Pricing For Traffic Safety - How Efficient Transport Pricing Can Reduce Roadway Crash Risk s - Victoria Transport Policy Institute
←
→
Page content transcription
If your browser does not render page correctly, please read the page content below
www.vtpi.org
Info@vtpi.org
Phone 250-360-1560
Pricing For Traffic Safety
How Efficient Transport Pricing Can Reduce Roadway Crash Risk s
22 April 2021
By Todd Litman
Victoria Transport Policy Institute
Summary
This report evaluates the traffic safety impacts of various transport pricing reforms including fuel
tax increases, efficient road and parking pricing, distance-based insurance and registration fees,
and public transit fare reductions. This analysis indicates that such reforms can significantly
reduce traffic risk, in addition to providing other important economic, social and environmental
benefits. Crash reductions depend on the type of price change, the portion of vehicle travel
affected, and the quality of alternative transport options available. If implemented to the degree
justified on economic efficiency grounds (for example, to reduce congestion, recover road and
parking facility costs, and make insurance more actuarially accurate), these reforms are
predicted to reduce North American traffic casualties 40-60%. Low per capita traffic fatality rates
in European and wealthy Asian countries result in significant part from their higher transport
prices, which result in more efficient, multi-modal transport systems where residents drive less
and rely more on alternative modes. However, these benefits are often overlooked: pricing
reform advocates seldom highlight traffic safety benefits and traffic safety experts seldom
advocate pricing reforms. This is particularly important for developing countries which are now
establishing pricing practices that will affect their future travel patterns and therefore crash risks.
Summaries of this report were published in:
Traffic Infra Tech (April-May 2014), pp. 68-71 (www.vtpi.org/TIT-pricesafety.pdf).
Transportation Research Record 2318 (2012), pp. 16-22.
Todd Litman 2011-2021
You are welcome and encouraged to copy, distribute, share and excerpt this document and its ideas, provided the author is given
attribution. Please send your corrections, comments and suggestions for improvement.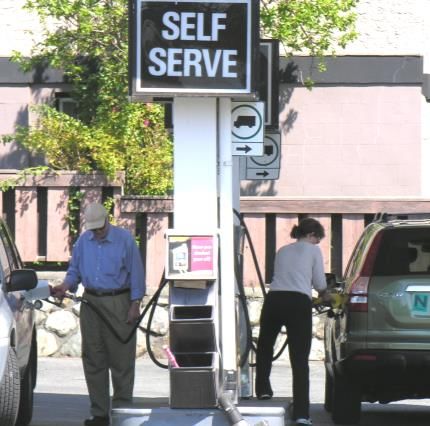
Pricing For Traffic Safety
                                      Victoria Transport Policy Institute

Introduction
Traffic safety is an important transport planning objective. Traffic accidents cause millions of disabilities
and deaths, and hundreds of billions of dollars in economic costs annually worldwide (Litman 2009;
WHO 2004). As a result, safety is a paramount consideration in roadway design and operation, and
many motorists willingly pay a premium for optional safety features. Experts are continually searching
for new ways to increase traffic safety.

Many factors affect traffic risk, including the amount and type of travel that occurs, roadway and vehicle
type, and driver behavior. One significant but often overlooked factor is transport pricing, that is, the
fees charged for vehicles, road and parking facilities, fuel, vehicle insurance and public transport use.
Analysis described in this report indicates that transport pricing reforms can significantly increase traffic
safety. However, these impacts are often overlooked, both when evaluating pricing reform benefits and
when searching for traffic safety strategies. As a result, such reforms are implemented less than optimal.

The current traffic risk paradigm (the assumptions used to define a problem and evaluate possible
solutions) tends to ignore pricing as a traffic safety strategy because it assumes that traffic crashes result
primarily from special risks, such as drunk or distracted driving, unsafe vehicles, and poorly designed
roadways. It considers “normal” vehicle travel (a responsible, sober driver, wearing seatbelts, in a
modern car, on a well-designed highway) a safe activity that need not be reduced. This paradigm tends
to measure risk using distance-based indicators (such as fatalities per 100,000 vehicle-miles) and so does
not recognize the safety benefits that result from policies which reduce total vehicle travel. From this
perspective, transport price increases are inefficient and unfair ways to increase safety because they
“punish” all motorists for risks caused by a minority.

There are good reasons to question this paradigm. Current traffic safety programs are not very effective.
Despite billions of dollars invested to create safer roads and vehicles, and to encourage safer driving
behavior, traffic risk continues to be a major cause of deaths and injuries, and the U.S. has one of the
highest per capita traffic fatality rates among developed countries. According to some research, much of
the reduction in traffic fatalities during the last half-century resulted from improvements in emergency
response and medical treatment, rather than from traffic safety programs (Noland 2003).

According to analysis in this report, transport pricing reforms can provide significant crash reductions.
Traffic safety is just one of several justifications for these reforms. More efficient transport pricing can
help achieve various planning objectives including congestion reduction, equitable road and parking
facility finance, equitable and affordable vehicle insurance, energy conservation, pollution reduction,
and more efficient land use patterns. Traffic safety adds another important benefit to this list.

The follow section discusses factors to consider when evaluating the traffic safety impacts of transport
pricing reforms.

                                                       2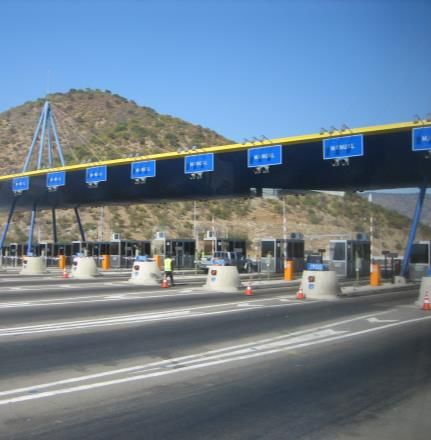
Pricing For Traffic Safety
                                      Victoria Transport Policy Institute

Risk Evaluation
Traffic crashes (also called accidents or collisions) can be measured in various ways that lead to different
conclusions about the nature of this risk and the effectiveness of safety strategies. For example, crash
rates tend to increase with urban density due to increased vehicle interactions, but crash severity and
therefore casualties (injuries and deaths) tend to be higher in rural areas due to higher speeds. Risk
analysis is affected by the reference units (units in the denominator) used. Figure 1 illustrates two traffic
fatality rates. When measured per unit of travel (e.g., per 100 million vehicle-miles), as traffic safety
experts tend to prefer, fatality rates declined more than two thirds between 1960 and 2000. From this
perspective, past traffic safety programs were successful and should be continued.

Figure 1         U.S. Traffic Fatalities (BTS 2000)
                       6                              Fatal ities Per 100 Mill ion V ehicle Miles
                                                      Fatal ities Per 10, 000 P opul ation
                       5

                       4

                       3

                       2

                       1

                       0
                       1960   1965   1970   1975    198 0   1985     1990    1995     2000

When measured per vehicle-mile, fatality rates declined significantly, but when measured per capita
they show little decline due to increased per capita vehicle travel.

But per capita vehicle mileage more than doubled during that period, offsetting much of this decline.
When measured per capita (e.g., per 10,000 population), as with other health risks, there was little
improvement despite large investments in safer road and vehicle designs, increased use of safety
devices, targeted traffic law enforcement, better emergency response and improved medical care.
Taking these factors into account, much greater casualty reductions can be expected (Noland 2003). For
example, seat belt use increased from nearly 0% in 1960 to 75% in 2002, which should reduce traffic
fatalities about 33%, yet per capita traffic fatality rates declined only 25%. Traffic crashes continue to be
one of the greatest single causes of deaths and disabilities for people aged 1-44 years (CDC 2003).
Although the U.S. has an average traffic fatality rate per vehicle-kilometer, it has one of the highest
traffic fatality rates per capita, as illustrated in Figure 2. From this perspective, traffic risk continues to
be a major problem, existing strategies are ineffective and new approaches are needed to achieve safety
targets.

                                                        3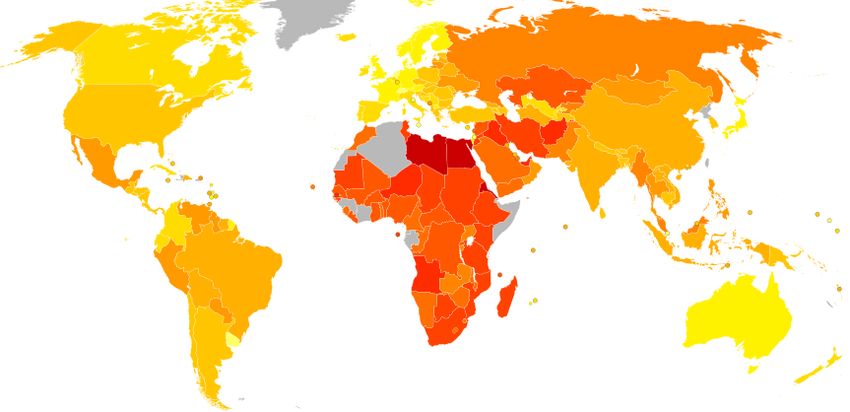
Pricing For Traffic Safety
                                            Victoria Transport Policy Institute

Figure 2                 International Traffic Fatality Rates1
           USA
    New Zealand
          Ireland
         Canada
          France
        Australia
         Finland
                                                                                                  100,000 Pop.
       Germany                                                                                    Billion Vehicle-Kms
            Israel
           Japan
    Great Britain
       Denmark
         Norway
     Switzerland
        Sweden
     Netherlands

                     0          2          4              6             8            10            12            14       16
                                                              Traffic Fatalities

The USA has the highest per capita traffic fatality rate among peer countries.

Many less developed countries have very high per capita traffic fatality rates despite low vehicle
ownership and mileage, as indicated in Figure 3. This reflects a combination of inexperienced drivers,
unsafe user behaviors, low seatbelt and helmet use, inferior vehicles and roadways, ineffective traffic
law enforcement, and poor emergency response and medical care.

Figure 3                 International Per Capita Traffic Fatality Rates2
                                                                                                               Deaths Per 100,00
                                                                                                               Residents
                                                                                                                no data
                                                                                                                less than 5
                                                                                                                5-8.5
                                                                                                                8.5-12
                                                                                                                12-15.5
                                                                                                                15.5-19
                                                                                                                19-22.5
                                                                                                                22.5-26
                                                                                                                26-29.5
                                                                                                                29.5-33
                                                                                                                33-36.5
                                                                                                                36.5-40
                                                                                                                more than 40

Per capita traffic fatality rates tend to be highest in low income countries and decline as they develop.

1
 List of Countries by Traffic Fatality Death Rate, Wikipedia http://en.wikipedia.org/wiki/List_of_countries_by_traffic-
related_death_rate.

                                                               4
Pricing For Traffic Safety
Victoria Transport Policy Institute
Per capita vehicle travel tends to increase while traffic fatality rates decline as countries develop
economically, which implies that mileage is not a risk factor. However, comparisons between otherwise
similar countries, regions and people indicate that per capita traffic casualty rates increase with vehicle
travel (Edlin and Karaca-Mandic 2006; Litman and Fitzroy 2010).
Figure 4 Vehicle Mileage and Traffic Fatality Rates In OECD Countries (OECD Data)
16
Canada
Traffic Fatalities Per 100,000 Pop.
14 Denmark
Germany
12
Iceland
10 Italy
Japan
8
Netherlands
6 Norway
Sweden
4
Switzerland
2 2 United Kingdom
R = 0.6405
0 United States
0 5,000 10,000 15,000 20,000 25,000
Annual Vehicle Kilometers Per Capita
Among economically developed countries, per capita traffic fatalities increase with vehicle travel.
Figure 4 shows a strong positive relationship between per capita vehicle travel and fatality rates among
OECD (Organization for Economic Cooperation and Development) countries. Figure 5 shows a strong
positive relationship between per capita vehicle mileage and traffic fatalities for U.S. states, particularly
in rural areas.
Figure 5 U.S. Traffic Fatality and Mileage Rates (FHWA 1993-2002 data)
16
Traffic Fatalities Per 100,000 Pop.
Rural
14
Urban This graph indicates a strong
12
positive relationship between
Linear
10 per capita annual vehicle
(Rural)
mileage and traffic fatalities
8
in the U.S., particularly in rural
6 areas. Each dot represents the
urban or rural portion of a
4
R2 = 0.862 U.S. state.
2
0
0 10,000 20,000 30,000 40,000 50,000 60,000
Per Capital Annual Vehicle Mileage (thousands)
5Pricing For Traffic Safety
Victoria Transport Policy Institute
Figure 6 shows a positive correlation between vehicle travel and traffic fatalities for U.S. cities.
Figure 6 Vehicle Mileage and Traffic Fatality Rates For U.S. Cities (FHWA 2002)
20
Traffic Deaths Per 100,000 Population
18
16
14 This graph indicates a
12 moderate positive relationship
between per capita annual
10
vehicle mileage and traffic
8 fatalities in U.S. cities.
6
4
2 R2 = 0.178
0
0 5,000 10,000 15,000 20,000
Annual Vehicle-Miles Per Capita
The relationship between risk and mileage is particularly strong for motorists who marginally reduce
their mileage since most risk factors do not change (Ferreira and Minike 2010). For example, a motorist
who reduces mileage 20% in response to a price incentive does not usually become more hazardous.
Sivak and Schoettle (2010) found that the 14% decline in U.S. traffic crashes between 2005 (43,510
traffic fatalities) and 2008 (37,261 fatalities) is largely explained by reductions in per capita vehicle
travel.
Reductions in total vehicle travel can cause proportionally larger reductions in total crash damages since
about 70% of crashes involve multiple vehicles, so each vehicle removed from traffic reduces both its
chances of causing a crash and of being the target of crashes caused by another vehicle, and reducing
multi-vehicle crashes reduces multiple claims (Vickrey 1968; Edlin and Karaca-Mandic 2006; Litman and
Fitzroy 2010).
Traffic safety experts often emphasize that most crashes are associated with special risk factors (young
and inexperienced drivers, impairment, distraction, speeding, etc.), which implies that safety programs
should target risky travel and need not reduce low-risk vehicle travel (FHWA 2010). But high- and low-
risk travel are complementary; policies that stimulate lower-risk driving also tend to stimulate higher-
risk driving. For example, where driving is inexpensive and convenient, reducing high risk driving tends
to be difficult since it leads to automobile-dependent transport system where alternative modes are
inferior and stigmatized, and sprawled development where destinations are difficult to access without
an automobile. As a result, teenagers, drunks and mentally impaired people continue to drive. Described
more positively, policy reforms that reduce overall vehicle travel can provide significant traffic safety
benefits.
6Pricing For Traffic Safety
Victoria Transport Policy Institute
Pricing Reform Safety Impacts
This section evaluates the impacts of various transport pricing reforms.
A basic economic principle is that markets tend to be most efficient and equitable if prices (what
consumers pay for a good) reflect marginal costs, that is, the full incremental costs of providing that
good (Clarke and Prentice 2009).2 This means, that motorists should pay directly for the costs of the
road and parking facilities they use, plus fees that reflect the congestion delays, accident risk and
pollution emission damages they impose on others.3 Vehicle travel is generally not efficiently priced. A
number of pricing reforms can be justified on market principles, including increased fuel taxes, more
efficient road and parking pricing, distance-based insurance and registration fees, and reduced public
transit fares. These reforms can reduce various transport problems, including traffic and parking
congestion, accident risk, fuel externalities, pollution emissions, inefficient land development, and
inadequate mobility for non-drivers.
People sometimes doubt that pricing affects vehicle travel – they point to fuel price changes that caused
little perceived change in travel behavior – but extensive evidence indicates that motorists do respond
to prices, particularly over the long-run (Brand 2009; CARB 2010/2011; Goodwin, Dargay and Hanly
2004; Litman 2008 and 2012). Travel impacts tend to be greater if prices increase relative to consumer
wealth (for example, if fuel prices increase relative to median incomes), and with improved transport
options (such as better public transit services or telework opportunities). For example, the Traffic
Choices Study (PSRC 2005) found commute travel price elasticities are four times higher than average for
commuters with high quality public transit service, and both Gillingham (2010) and Guo, et al. (2011)
found that vehicle travel is more price sensitive for households located in more accessible, transit-
oriented communities than comparable households in sprawled, automobile-dependent communities.
The following section evaluates the travel and safety impacts of these pricing reforms. For more
information on these strategies see related chapters in the Online TDM Encyclopedia (VTPI 2011).
2
There are exceptions to this rule, for example, when underpricing may be justified to achieve social equity objectives, to
support strategic objectives such as helping develop a new industry, to take advantage of scale economies, or as a second-best
strategy to offset other market distortions such as underpricing of competing goods.
3
There can be different interpretations of what constitutes marginal costs. Some analysts focus on short-run costs, and so
emphasize congestion and maintenance costs, but ignore sunk costs, which could include construction costs and land values.
But since most land has an opportunity cost (it could have other productive uses), and the prices of most other goods repay
total production costs, efficient and equitable pricing of roads and parking facilities should generally include cost recovery of
facility construction and land purchase costs.
7Pricing For Traffic Safety
Victoria Transport Policy Institute
Fuel Tax Increases (www.vtpi.org/tdm/tdm17.htm)
Justifications
Fuel tax increases are often recommended to finance transportation improvements, and to encourage
fuel conservation to achieve various economic and environmental objectives including energy security
and emission reductions (Litman 2009; Metschies 2009; Wachs 2003).
Travel Impacts
Fuel price increases tend to reduce overall vehicle travel. The long-term elasticity of fuel consumption
with respect to price is about –0.7, so a 10% price increase typically causes a 7% reduction in fuel use,
but about two thirds of this resulting from consumers purchasing more fuel efficient vehicles and about
one third from vehicle mileage reductions, so a 10% increase in fuel price typically reduces vehicle travel
2-3% (Johansson and Schipper 1997; Goodwin, Dargay and Hanly 2004).
Figure 7 Fuel Price Versus Per Capita Vehicle Travel (Litman 2008)
Per Capita Annual Vehicle-Kilometers
25,000 Australia
Austria
Belgium
20,000
Canada
Denmark
France
15,000
Finland
Germany
10,000 Italy
Japan
Netherlands
5,000 Norway
2
R = 0.4548 Spain
Sweden
0
Switzerland
$0.00 $0.50 $1.00 $1.50 $2.00 United K ingdom
F uel Prices (2004 US Dollars Per Liter) United S tat es
Higher fuel prices tend to reduce per capita vehicle travel.
Figures 7 and 8 illustrate how changes in real fuel prices (adjusted for inflation and currency exchange)
affect per capita annual vehicle travel.
8Pricing For Traffic Safety
Victoria Transport Policy Institute
Figure 8 Fuel Costs Versus Annual Vehicle Mileage (BTS 2001)
$0.22
$0.20 1980 Per capita vehicle mileage
tends to increase when real
Fuel Cost Per Vehicle-Mile
$0.18
(inflation-adjusted) per-mile
$0.16 1975 fuel costs decline. For a
1960 spreadsheet with the source
$0.14 1985
1965 data of this graph, click here:
1970
$0.12 FuelTrends
$0.10 1990
2000
$0.08
1995
$0.06
9,000 10,000 11,000 12,000 13,000
Average Annual VMT Per Vehicle
There is debate concerning the sensitivity of vehicle travel to fuel pricing. Small and Van Dender (2007)
and Hymel, Small and Van Dender (2010) found that vehicle travel price elasticities declined to less than
-0.1 (a 10% fuel price increase reduced vehicle travel less than 0.1%) in the U.S. between 1970 and 2004,
but this was a unique period of increasing travel demand, rising incomes, automobile-oriented planning,
and declining real (inflation-adjusted) fuel prices. Recent studies indicate that driving has since become
more price sensitive (Litman 2012). Li, Linn and Muehlegger (2011) found a -0.235 fuel price elasticity
between 1968 and 2008 (a 10% fuel price increase reduced fuel consumption 2.3%) with higher values
for durable price increases. Gillingham (2010) found medium-run (two-year) elasticities of vehicle travel
with respect to gasoline price ranging from -0.15 to -0.20, with impacts increasing over time. These
studies suggest that travel elasticities have returned to more normal levels and will probably rise further
if fuel prices continue to increase relative to incomes.
Safety Impacts
Various studies indicate that, all else being equal, higher fuel prices tend to reduce per capita traffic
fatality rates. Ahangari, et al. (2014) employed a panel data model of 14 industrialized countries
between 1990 and 2000 using gas prices, unemployment, health index, vehicle ownership and vehicle
travel as independent variables and per capita traffic deaths as a dependent variable. The results
revealed a significant inverse relationship between gas prices and the road fatality rates. The elasticity
analysis indicates that a 10% decrease in gasoline prices resulted in a 2.19% increase in road fatalities.
Likewise, a 10% decrease in unemployment rate resulted in a 0.65% increase in road fatalities. The
analysis also implied that the health index has the highest impact on road fatality rates.
Using two decades of data for 144 countries, Burke and Nishitateno (2015), found that the average
reduction in road fatalities resulting from a 10% increase in the gasoline pump price is in the order of 3-
6%, and estimate that approximately 35,000 deaths per year could be avoided by the removal of global
fuel subsidies. Morrisey and Grabowski (2011) find that a 10% U.S. fuel price increase reduces fatalities
by 3.2–6.2% with the largest percentage reductions among 15- to 17-year-old drivers, and a 10% beer
tax increase reduces motor vehicle fatalities by 17-24 year old drivers by approximately 1.3%.
9Pricing For Traffic Safety
Victoria Transport Policy Institute
Figure 9 indicates that among OECD countries, per capita traffic fatality rates decline with higher fuel
prices.
Figure 9 Fuel Price and Traffic Fatality Rates In OECD Countries4
14
Canada
Traffic Fatalities Per 100,000 Pop.
Denmark
12
Finland
Among
France
10 economically
Germany
Iceland
developed
8
Italy countries, per
Japan capita traffic
6
Netherlands fatalities decline
4 New Zealand with fuel price.
Norw ay
2 Spain
R2 = 0.4859 Sw eden
0 Sw itzerland
$0.00 $0.25 $0.50 $0.75 $1.00 $1.25 $1.50 $1.75 United Kingdom
Gasoline Price Per LiterCapita United States
Sivak (2008) found that a 2.7% vehicle travel decline resulting from high fuel prices and a weak economy
during 2007-2008 caused a much larger 17.9% to 22.1% month-to-month traffic fatality reductions,
probably due to large vehicle travel reductions by lower income drivers (who tend to be young or old,
and therefore higher than average risk) and speed reductions to save fuel. Grabowski and Morrisey
(2004) estimate that in the U.S., each 10% fuel price increase reduces total traffic deaths 2.3%, with a
6% decline for drivers aged 15 to 17 and a 3.2% decline for ages 18 to 21 according to analysis. In follow-
up research, Grabowski and Morrisey (2006) estimate that a one-cent state gasoline taxes increase
reduces per capita traffic fatalities 0.25%, and traffic fatalities per vehicle-mile by 0.26%. Leigh and
Geraghty (2008) estimate that a sustained 20% gasoline price increase would reduce approximately
2,000 traffic crash deaths (about 5% of the total), plus about 600 air pollution deaths. Based on New
Zealand data, Schuffham and Langley (2002) found that per capita crash rates varied with changes in
vehicle mileage, with crash reductions caused by fuel price increases.
Studies by Chi, et al. (2010a, 2010b, 2013a, 2013b, 2015) quantify fuel price impacts on traffic crashes in
various U.S. regions. Fuel price increases reduce both total traffic crashes and distance-based crash rates
(e.g., per million vehicle miles traveled), with impacts that vary by geographic and demographic factors,
and increase over time. All these studies show that fuel price increases reduce per-mile crash rate, so a
1% reduction in total VMT provides more than a 1% reduction in total crashes. For example, in
Mississippi, controlling for other risk factors (total vehicle travel, seatbelt use, state unemployment and
alcohol consumption), they find that each 1% inflation-adjusted gasoline price increase reduces total (all
types of drivers) crashes per million vehicle-miles traveled 0.25% in the short-run (less than one year)
and 0.47% in the medium-run (more than one year) (2010a). In Minnesota they estimate that a $1.00
4
Gerhard Metschies (2005), International Fuel Prices 2005, International Fuel Prices (www.internationalfuelprices.com); at
www.international-fuel-prices.com/downloads/FuelPrices2005.pdf. List of Countries by Traffic Fatality Death Rate, Wikipedia
http://en.wikipedia.org/wiki/List_of_countries_by_traffic-related_death_rate (9 February 2011).
10Pricing For Traffic Safety
Victoria Transport Policy Institute
per gallon gasoline price increase would reduce total rural crashes 28.15%, rural injury crashes 3.9%,
total urban crashes 18.40%, and urban fatal crashes 18.4%. They find that fuel price increases cause
larger short-term crash reductions by younger drivers, and larger intermediate-term reductions by older
and male drivers (2010a; 2011), and large drunk driving crash reductions (2010b).
Using a Crash Prediction Model (CPM) based on fatal and injury crashes observed between 2004 and
2007 in Flanders, Belgium, Pirdavani, et al. (2013) find that a 20% fuel price increase would reduce the
annual vehicle travel by 11.6% which would reduce total injury crashes by 2.8%.
There is some debate concerning the safety impacts of more fuel efficient vehicle fleets, which result
from higher fuel prices. Lighter vehicle occupants face greater risk in crashes with heavier vehicles or
stationary objects, but this tends to be offset by their lower crash frequency, reduced risk to others, and
safer designs (CBO 2003; Wenzel and Ross 2006).
Road Pricing (www.vtpi.org/tdm/tdm35.htm)
Description
Road tolls and congestion fees are often implemented to generate revenue and reduce traffic
congestion. Road tolls are often used to finance new highways and bridges, and congestion pricing has
been implemented in several cities including London, Stockholm and Singapore.
Travel Impacts
Road pricing typically reduces affected vehicle travel 10-30%, depending on price, facility type, and type
of users. In most jurisdictions only a minor portion of total vehicle travel is tolled, so reductions tend to
be small relative to total regional vehicle travel.
Safety Impacts
Available data indicate that road pricing reduces crashes. Cities with congestion fees, such as London,
Stockholm, Singapore and Milan tend to have low per capita traffic fatality rates due to low per capita
vehicle travel, low traffic speeds and effective traffic law enforcement. London’s congestion fee reduced
total vehicle travel in the charging zone about 15%, but crashes declined even more (1,865 crashes
reported in 2004 compared with 2,598 in 2001), a 28% reduction, compared with a 22% reduction
throughout the region during that same period (TfL 2007), although motorcycle accidents may increase
since they are except from the charge (Noland, Quddus and Ochieng 2008). Comparing crash data for
major UK cities, professor Colin Green (2020) estimated that London’s congestion pricing reduced
crashes by 40%. Using a macro-level collision prediction model (CPM) that analyzes crash rates at a fine
geographic scale, Lovegrove, Lim and Sayed (2010) predict that a typical road pricing program would
reduce total neighborhood collision by 19% and severe collisions by 21%. After Milan, Italy introduced a
€5 (US$7) fee for entering the city center, vehicle trips declined 28% and injury crashes 26.3% (ITF 2014).
Tolling grade-separated highways could increase per-mile crash rates if it shifts traffic to surface roads,
but since many tolled facilities (particularly bridges) have few alternative routes, the magnitude of this
impact is probably small and offset by reductions in total vehicle travel, so in most situations tolling
probably reduces total crashes.
11Pricing For Traffic Safety
Victoria Transport Policy Institute
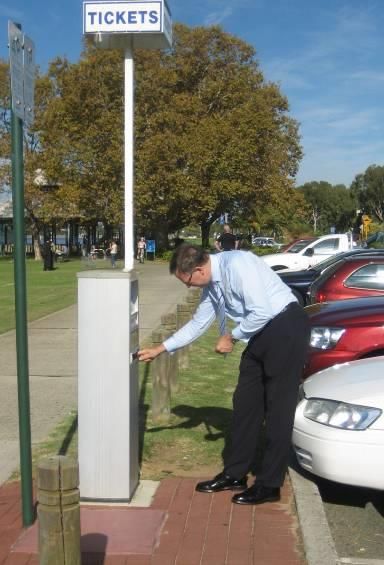
Parking Pricing (www.vtpi.org/tdm/tdm26.htm)
Description
Parking pricing (motorists pay directly for using parking facilities) can be implemented to generate
revenues, reduce parking congestion and therefore the need to expand parking facilities, reduce urban
traffic problems, or a combination of these objectives. There is considerable potential for more efficient
parking pricing since currently, most parking is unpriced, significantly subsidized, bundled, or rented by
the month or year, which gives motorists little incentive to shift mode part-time (Shoup 2005).
Travel Impacts
Cost recovery parking pricing (prices that reflect the full costs of providing that parking facility) and
parking cash out (offering non-drivers the cash equivalent of the parking subsidy they would receive if
they arrive by automobile) typically reduce vehicle travel 10-30%, although impacts vary depending on
conditions, including the type of trips and users affected, and the availability of alternative parking and
travel options (Litman 2008; Spears, Boarnet and Handy 2010).
Safety Impacts
Although little research specifically investigate parking pricing traffic safety impacts, they are probably
similar to road pricing. Since parking pricing is most commonly implemented in congested urban areas
where crash rates are high, it is likely to provide large crash reductions. Since parking pricing could be
widely applied, safety benefits are potentially large.
Distance-Based Pricing (www.vtpi.org/tdm/tdm10.htm)
Description
Distance-based pricing (also called Pay-As-You-Drive or per-mile pricing) converts vehicle insurance
premiums and registration fees from fixed into variable costs, which gives motorists additional savings
for reducing annual mileage (Ferreira and Minike 2010; Litman 1997).
Travel Impacts
With fully-prorated vehicle insurance (total premiums are divided by average annual mileage, so a $600
premium becomes 5¢ per vehicle-mile, a $1,200 premium becomes 10¢ per vehicle-mile, and $1,800
premium becomes 15¢ per vehicle-mile) the average motorist would pay about 8¢ per vehicle-mile,
which is predicted to reduce their vehicle travel 8-12%, and somewhat more if other fixed vehicle
charges, such as registration fees, are also made distance-based.
Safety Impacts
To the degree that distance-based pricing reduces vehicle travel it reduces crashes. Crash reductions
tend to be proportionately larger than mileage reductions for two reasons. First, higher-risk motorists
pay more per vehicle-mile and so have a greater incentive to reduce mileage. For example, a low-risk
driver who currently pays $360 annual premiums would pay 3¢ per mile and so would be expected to
reduce mileage only about 5%, but a higher-risk driver who pays $1,800 in premiums would pay 15¢ per
vehicle-mile and so would be expected to reduce mileage more than 20%. Some distance-based
insurance pricing systems base premiums on when, where and how a vehicle is driven, which can
provide additional safety benefits by discouraging particularly risky driving activity.
Second, since about two-thirds of traffic crashes involve multiple vehicles, widely-applied distance-
based pricing can provide external safety benefits, that is, reduced risk to other road users regardless of
whether or not drivers reduce their mileage (Vickrey 1968; Edlin and Karaca-Mandic 2006; Litman and
Fitzroy 2010). As a result, if fully implemented in an area, distance-based pricing can reduce traffic
12Pricing For Traffic Safety
Victoria Transport Policy Institute
crashes by 12-15%, and possibly even more, depending on price structure and other factors such as the
quality of transport options.
Transit Fare Reductions (www.vtpi.org/tdm/tdm112.htm)
Description
Public transport (including vanpools, buses, trains and ferries) fares can be reduced in various ways,
including public funding, targeted discounts and commuter benefits (employers paying a portion of
employee transit fares, often as a substitute for parking subsidies). A variation is to use increased
subsidies to improve public transit service quality without raising fares.
Travel Impacts
Public transit fare reductions and service quality improvements tend to increase transit ridership. A 10%
fare reduction typically increases transit ridership 3% (Litman 2008). A portion of this transit travel
substitutes for automobile travel, particularly with higher-quality public transit such as rail transit. In
addition, high quality public transit service, which attracts a significant amount of discretionary travel
(that would otherwise be by automobile), tends to leverage additional vehicle travel reductions by
affecting transport and land use patterns (ICF 2008; Litman 2006).
Safety Impacts
Public transport tends to have low traffic crash and casualty rates per passenger-mile and overall traffic
fatality rates tend to decline in an urban area as public transit ridership increases, as indicated in figures
10 and 11.
Figure 10 U.S. Traffic Deaths (Litman and Fitzroy 2010)
30
Traffic Fatalities Per 100,000 Population
25 Per capita traffic fatalities
(including automobile
20 occupants, transit occupants
and pedestrians) tend to
decline with increased
15
transit ridership. Each dot
represents a U.S. urban
10 area.
5
R2 = 0.352
0
0 200 400 600 800 1,000 1,200
Annual Per Capita Transit Passenger-Miles
Lim, et al (2006) describes how Bus Rapid Transit improvements in Seoul, South Korea increased transit
ridership more than 20%, reduced bus crashes 26% and bus casualties 11%. This shows how public
transit service quality improvements can provide safety benefits.
13Pricing For Traffic Safety
Victoria Transport Policy Institute
Figure 11 Traffic Fatalities Vs. Transit Travel (Kenworthy and Laube 2000)
25
Traffic Fatalities Per 100,000 Population
Northern Europe
20 Southern Europe International data
US indicate that crash rates
Canada
decline with increased
15 transit ridership.
Australia
10
5
R2 = 0.3467
0
0 1,000 2,000 3,000 4,000
Annual Per Capita Transit Passenger-Miles
14Pricing For Traffic Safety
Victoria Transport Policy Institute
Summary
Table 1 summarizes pricing reforms and their impacts. Total safety impacts depend on the amount and
type of travel reduced. These reforms tend to be most effective and acceptable if implemented as an
integrated program that includes improvements to alternative modes, encouragement programs, and
smart growth land use policies. Comparisons between otherwise similar geographic areas indicate that
those with more efficient transport pricing (i.e., road, parking and insurance prices that reflect marginal
costs) have significantly less per capita vehicle travel and traffic casualties (typically 40-60% lower) than
those where fuel, road and parking are significantly underpriced relative to costs (Buehler 2010).
Table 1 Transport Pricing Reform Impacts
Pricing Type Description Travel Impacts Traffic Safety Impacts
European-level fuel prices Reducing vehicle travel provide
Increase fuel prices to finance reduce per-capita vehicle travel about proportionate or greater
roads and traffic services, and 30-50% compared with North crash reductions (i.e., a 30%
to internalize fuel economic America. Affects most vehicle mileage reduction provides
Higher fuel prices and environmental costs. travel. 30%+ fatality reduction).
Can significantly increase safety
Typically reduces affected where applied, but total
vehicle travel 10-30%. Usually impacts are generally small due
Tolls to reduce congestion applied on a limited number of to the small portion of travel
Road pricing and generate revenue. highways and large city centers. affected.
User fees to finance parking Typically reduces affected
facilities. Can also include vehicle trips 10-30%. Most
parking cash out and common in city centers, Can significantly increase safety
Parking pricing unbundling. campuses and hospitals. where applied.
Fully-prorated pricing typically
reduces affected vehicle travel Potentially large safety benefits
Prorates vehicle insurance 8-12%, although most current to affected vehicles. If widely
Distance-based premiums and registration examples have smaller price applied can provide large total
pricing fees and travel impacts. safety benefits.
Reduce fares and commuter A 10% fare reduction typically Fare reductions alone have
transit benefits to make increases ridership 3%, modest impacts, but integrated
Public transport public transit travel more although only a portion of this programs can provide large
fare reductions attractive and affordable. substitutes for driving. safety benefits.
This table summarizes major pricing reform categories and their travel and safety impacts.
This suggests that if pricing reforms were implemented to the degree justified on economic principles
(congestion reductions, cost recovery of road and parking facilities, actuarially accurate insurance
pricing, etc.), vehicle travel and crashes are likely to decline significantly, probably 30-60% in the U.S.,
reducing per capita traffic casualty rates to the lower levels enjoyed by its peers (Litman 2007).
Research by Hosford, et al (2021) also indicates that efficient transportation pricing is beneficial for a
number of transportation and health outcomes, particularly in areas where total vehicle travel declines
significantly, but that there may be some inequities in the distribution of these impacts, with greater
benefits to higher income groups.
15Pricing For Traffic Safety
Victoria Transport Policy Institute
Comprehensive Impact Analysis
Conventional transport planning tends to be reductionist: individual problems are assigned to specific
organizations with narrowly-defined responsibilities. For example, transport agencies are responsible for
reducing traffic congestion, environmental agencies are responsible for reducing pollution, social service
agencies are responsible for improving accessibility for disadvantaged people, and public health
agencies are responsible for improving public fitness and health. This type of analysis can result in these
agencies rationally implementing solutions to the problems they are responsible that exacerbate other
problems facing society, and it tends to undervalue strategies that provide multiple benefits.
Comprehensive analysis considers how policy and planning decisions affect various planning objectives.
Table 2 illustrates this concept. Many traffic safety strategies only achieve one or two planning
objectives. For example, wider lanes and shoulders, and grade-separated intersections can help reduce
congestion, vehicle operating costs and accidents. Vehicle occupant crash protection (airbags and other
safety features) and increased safety education and enforcement tend to reduce crash risk, but provide
few other benefits. More efficient transport pricing can help achieve a variety of planning objectives
including congestion reductions, road and parking facility cost savings, energy conservation and
emission reductions. If implemented as part of an integrated program that includes improvements to
alternative modes and smart growth land use policies they help create more diverse transport systems
and more accessible communities, which improves mobility options for non-drivers, increase public
fitness and health and reduces sprawl costs.
Table 2 Comparing Strategies Including Travel Impacts
Planning Roadway Crash Safety Pricing
Objective Expansion Protection Enforcement Reforms
Congestion reduction
Roadway cost savings
Parking cost savings
Consumer cost savings Mixed
Reduced accident damages
Improved mobility options Mixed
Energy conservation
Pollution reduction
Physical fitness and health
Land use objectives
Roadway expansion, vehicle occupant crash protection and safety enforcement programs tend to achieve
a limited set of planning objectives. Pricing reforms tend to achieve more of these objectives, particularly if
they help create more diverse transport systems and more accessible, multi-modal communities.
Pricing reform direct consumer impacts tend to be mixed. Some reforms (parking cash out, distance-
based pricing, and transit fare reductions) offer consumers new opportunities to save money when they
reduce their vehicle travel. Others (higher fuel prices, efficient road and parking pricing) increase user
costs, but these are economic transfers, so their overall impacts depend on how revenues are used. The
following section discusses these impacts in detail.
16Pricing For Traffic Safety
Victoria Transport Policy Institute
Consumer Impacts
Pricing reforms are often criticized as harmful to consumers, particularly those with lower incomes, but
such criticism often reflects incomplete analysis. Pricing reforms tend to increase transport system
efficiency and diversity, which increases demand for alternative modes and makes them more politically
and socially acceptable, resulting in a more diverse and efficient transport system, and more accessible
community development. Pricing reforms tend to provide various benefits to physically, economically
and socially disadvantaged people, including increased transit service, reduced bus congestion delay,
reduced pedestrian and cyclists traffic risk, and reduced sprawl. Although user fees are regressive with
respect to income (a dollar of taxes or tolls is a greater share of income for a lower- than higher-income
households), they are generally less regressive than other funding options. For example, Schweitzer and
Taylor (2010) found that toll financing of urban highway expansion is less regressive (it imposes less
financial burden on lower-income households) than general tax financing. At best, underpricing vehicle
travel is an inefficient way to achieve equity objectives. For example, out of a dollar in fuel subsidies,
only 14¢ goes to the lowest income quintile. More progressive policies would direct a greater share of
subsidies to low-income households.
Figure 12 Annual Fuel Expenditures By Income Class
$1,400
Lower income consumers
2008 Fuel Expenditures Per
$1,200
purchase a relatively small
$1,000 portion of total fuel and drive a
relatively small portion of total
Capita
$800
vehicle travel, so underpricing
$600 fuel and other transport costs is
an inefficient way to help poor
$400
people.
$200
$0
First Second Third Fourth Fifth
Income Quintile
Because they tend to own fewer vehicles, drive less, and rely more on alternative modes, lower-income
households are particularly likely to benefit from unbundled parking, distance-based vehicle fees, and
parking cash out. Pricing reform impacts depend on the quality of transport and location options
available to consumers. For example, if affordable housing is only available in automobile-dependent,
urban-fringe locations, fuel tax increase and efficient road and parking pricing may impose significant
financial burdens on lower-income commuters, but this is reduced by improving alternative modes
(walking and cycling facilities, ridesharing, public transit service quality, telework options) and increasing
the supply of affordable housing in more accessible, multi-modal neighborhoods. As a result, pricing
reforms tend to be most beneficial to consumers and most progressive with respect to income if
implemented in conjunction with improvements to alternative modes and smart growth development
policies (TRB 2011).
17Pricing For Traffic Safety
Victoria Transport Policy Institute
Implications for Developing Countries
Transport pricing reforms are particularly relevant for developing countries. Although per capita traffic
fatality rates tend to decline as countries develop economically, the speed and amount of these declines
is affected by transport pricing and planning practices. Developing countries that apply efficient pricing
and multi-modal planning, as in Europe and wealthy Asian countries, will likely achieve much lower
(probably less than half) per capita traffic fatality rates of countries that follow the North American
model of low transport pricing and automobile-oriented planning. Table 3 compares these models.
Table 3 Contrasting Transport Pricing and Planning Practices
Feature European & Wealthy Asian North American
Fuel pricing High taxes Low taxes and indirect subsidies
Road tolls Few roads are tolled. Where tolled, revenues Roads are tolled to reduce congestion and
are often dedicated to highways. finance transport programs
Parking pricing Parking is often priced Parking is seldom priced
Parking Relatively low parking requirements Generous minimum parking requirements.
requirements
Transport planning Multi-modal. Considerable effort to improve Automobile-oriented. Little effort to
walking, cycling and public transport. improve alternative modes.
Land use planning Creates accessible, multi-modal communities. Creates automobile-dependent sprawl.
Vehicle travel Low relative to income (5,000 to 10,000 High relative to income. (15,000 to 25,000
annual kilometers per capita). annual kilometers per capita).
Walking and cycling Moderate to high non-motorized mode share. Low non-motorized mode share.
Traffic fatalities Low (4-8 annual traffic deaths per 100,000 Moderate (10-20 annual traffic deaths per
population) 100,000 population)
Different transport pricing and planning models result in different transport patterns and fatality rates.
Traffic safety is just one of many reasons that developing countries may want to implement efficient
transport pricing and multi-modal planning. Others include reduced traffic and parking congestion,
reduced road and parking facility costs, improved mobility for non-drivers, energy conservation, reduced
economic costs of importing vehicles and fuel, emission reductions, more efficient land development,
and improved public fitness and health. Since traffic accidents are one of the largest transport costs,
increased safety is one of the most important justifications for these reforms.
18Pricing For Traffic Safety
Victoria Transport Policy Institute
Conclusions
A basic economic principle is that, as must as possible, prices should reflect the marginal costs of
providing a good. This tends to be most efficient and equitable. Transportation markets currently violate
this principle: a major portion of costs are fixed or external and so do not reflect marginal costs. This
increases transport problems including traffic and parking congestion, facility costs, energy
consumption, pollution emissions, reduced transport options, and traffic risk.
Various pricing reforms can help reduce these problems, including higher fuel prices, efficient road and
parking pricing, distance-based insurance and registration fees, and lower public transit fares. Advocates
generally promote individual reforms to achieve specific objectives, such as road tolls to generate
revenues and reduce congestion, and fuel tax increases to generate revenue and conserve fuel. Traffic
safety benefits are generally overlooked. Pricing reform advocates seldom highlight safety benefits and
traffic safety experts seldom promote pricing reforms. Yet, pricing reforms can provide significant safety
benefits, and may be among the most cost effective safety strategies available, considering all costs and
benefits.
Fuel tax increases and distance-based pricing can probably provide the largest total safety benefits
because they tend to affect the largest portion of total vehicle travel. Distance-based insurance can
provide additional safety benefits because it gives higher risk drivers an extra incentive to reduce
mileage. Efficient road and parking pricing can provide significant safety benefits where they are
applied. Public transit fare reductions provide smaller direct safety benefits but can have much larger
impacts if they provide a catalyst for transit-oriented development, which leverages additional travel
reductions and safety benefits.
The much lower per capita traffic fatality rates in Northern European countries and wealthy Asian
counties can be largely explained by their relatively high transport prices, which reduces vehicle travel
directly and helps create more multi-modal transport systems. Yet, even these countries could
implement additional pricing reforms such as more efficient road and parking pricing, and distance-
based vehicle insurance and registration fees, further reducing crash rates.
These pricing reforms are particularly relevant for developing countries. Countries that establish
efficient transport pricing and multi-modal planning will have much lower traffic fatality rates, than if
they develop with low transport pricing and automobile-oriented planning.
Critics often claim that higher road tolls, parking fees and fuel taxes are regressive, but they are often
less regressive than alternative financing options. These pricing reforms can benefit physically,
economically and socially disadvantaged people by giving them by improving their mobility and
accessibility options, and by providing additional financial savings to people who rely on alternative
modes. For example, a non-driver usually benefits overall from efficiently priced roads and parking,
since they are not forced to pay for facilities they don’t use. Pricing reforms tend to be more effective
and beneficial if implemented in conjunction with improved mobility and accessibility options, such as
better walking, cycling and public transit services, and more affordable housing in accessible
neighborhoods.
19Pricing For Traffic Safety
Victoria Transport Policy Institute
References
Hamed Ahangari, et al. (2014), “An Investigation Into The Impact Of Fluctuations In Gasoline Prices And
Macroeconomic Conditions On Road Safety In Developed Countries,” Transportation Research Record 2465
(www.trb.org); at https://bit.ly/2zcwq1i. Also see, Hamed Ahangari (2015), A Comprehensive Comparative
Assessment of Road Safety in Developed Countries, PhD dissertation, University of Connecticut
(http://opencommons.uconn.edu); at https://bit.ly/2PWmFvm.
J. Ball, M. Ward, L. Thornley, and R. Quigley (2009), Applying Health Impact Assessment To Land Transport Planning,
Research Report 375, New Zealand Transport Agency (www.landtransport.govt.nz); at
www.landtransport.govt.nz/research/reports/375.pdf.
Dan Brand (2009), Impacts of Higher Fuel Costs, Federal Highway Administration, (www.fhwa.dot.gov); at
www.fhwa.dot.gov/policy/otps/innovation/issue1/impacts.htm.
BTS (annual reports), National Transportation Statistics, Bureau of Transport Statistics (www.bts.gov).
Ralph Buehler (2010), “Transport Policies, Automobile Use, and Sustainable Transport: A Comparison of
Germany and the United States,” Journal of Planning Education and Research, Vol. 30/1, pp. 76-93
(http://jpe.sagepub.com/content/30/1/76); presentation at www.ciens.no/data/no_NO/file/5411.pdf.
Paul J. Burke and Shuhei Nishitateno (2015), "Gasoline Prices and Road Fatalities: International
Evidence,” Economic Inquiry (DOI: 10.1111/ecin.12171); at https://bit.ly/1QBY62Z.
CARB (2010/2011), Impacts of Transportation and Land Use-Related Policies, California Air Resources Board
(http://arb.ca.gov); at http://arb.ca.gov/cc/sb375/policies/policies.htm.
CBO (2003) Fuel Economy Standards versus A Gasoline Tax, Congressional Budget Office (www.cbo.gov); at
www.cbo.gov/ftpdocs/51xx/doc5159/03-09-CAFEbrief.pdf.
G. Chi, et. al. (2010a), “Gasoline Prices and Traffic Safety in Mississippi,” Journal of Safety Research, Vol.
41(6), pp. 493−500; at https://bit.ly/2xJdM1V.
G. Chi, et al. (2010b). “Gasoline Prices And Their Relationship To Drunk-Driving Crashes,” Accident Analysis
and Prevention, Vol. 43(1), pp. 194–203; at http://tinyurl.com/lxhrswd.
G. Chi, et al. (2013a), “Gasoline Price Effects on Traffic Safety in Urban and Rural Areas: Evidence from
Minnesota, 1998–2007,” Safety Science, Vol. 59, pp. 154-162; at http://bit.ly/2nkESVx.
G. Chi, et al. (2013b), “Gasoline Price Effects on Traffic Safety in Urban and Rural Areas: Evidence from
Minnesota, 1998–2007,” Safety Science, Vol. 59, pp. 154-162; at http://bit.ly/2nkESVx.
G. Chi, et al. (2013c), “The Impact of Gasoline Price Changes on Traffic Safety: A Time Geography
Explanation,” Journal of Transport Geography, Vol. 28(1), pp. 1–11
(https://doi.org/10.1016/j.jtrangeo.2012.08.015); at https://bit.ly/2zon5EO.
G. Chi, et al. (2015), “Safer Roads Owing to Higher Gasoline Prices: How Long It Takes,” American Journal of
Public Health, Vol. 105(8), pp. e1-e7 (DOI: 10.2105/AJPH.2015.302579).
20Pricing For Traffic Safety
Victoria Transport Policy Institute
Harry Clarke and David Prentice (2009), A Conceptual Framework for the Reform of Taxes Related to Roads
and Transport, La Trobe University, for Australia Treasury Australia's Future Tax System review; at
http://apo.org.au/research/conceptual-framework-reform-taxes-related-roads-and-transport.
Aaron Edlin and Pena Karaca-Mandic (2002), The Accident Externality from Driving, The Berkeley Electronic
Press (www.bepress.com); at http://papers.ssrn.com/sol3/papers.cfm?abstract_id=424244. Also published in
the Journal of Political Economy, Vol. 114, No. 5, 2006, pp. 931-955.
Reid Ewing and Eric Dumbaugh (2009), “The Built Environment and Traffic Safety: A Review of Empirical
Evidence,” Journal of Planning Literature, Vol. 23 No. 4, May, pp. 347-367; at https://bit.ly/2PXBrG7.
Joseph Ferreira Jr. and Eric Minike (2010), A Risk Assessment of Pay-As-You-Drive Auto Insurance,
Department of Urban Studies and Planning, Massachusetts Institute of Technology (http://dusp.mit.edu); at
https://bit.ly/2GtS8jy.
FHWA (2010), Transportation Planner's Safety Desk Reference, Federal Highway Administration; at
http://tsp.trb.org/assets/FR1_SafetyDeskReference_FINAL.pdf.
Kenneth Gillingham (2010), Identifying the Elasticity of Driving: Evidence from a Gasoline Price Shock in
California, Stanford University (www.stanford.edu); at https://stanford.io/2Q4zyr3.
Phil Goodwin, Joyce Dargay and Mark Hanly (2004), “Elasticities of Road Traffic and Fuel Consumption with
Respect to Price and Income: A Review,” Transport Reviews (www.tandf.co.uk), Vol. 24, No. 3, May 2004, pp.
275-292; at www.tandfonline.com/doi/abs/10.1080/0144164042000181725.
David C. Grabowski and Michael A. Morrisey (2004), “Gasoline Prices and Motor Vehicle Fatalities,” Journal of
Policy Analysis and Management (www.appam.org/publications/jpam/about.asp), Vol. 23/3, pp. 575–593.
David C. Grabowski and Michael A. Morrisey (2006), Do Higher Gasoline Taxes Save Lives?” Economics
Letters, Vol. 90, pp. 51–55; abstract at www.sciencedirect.com/science/article/pii/S0165176505002533.
Colin Green (2020), Best Practices: Vision Zero Lessons from London’s Congestion Pricing, StreetsBlog USA
(https://usa.streetsblog.org); at https://bit.ly/3nLOloD.
Zhan Guo, et al. (2011), The Intersection of Urban Form and Mileage Fees: Findings from the Oregon Road
User Fee Pilot Program, Report 10-04, Mineta Transportation Institute (http://transweb.sjsu.edu); at
http://transweb.sjsu.edu/PDFs/research/2909_10-04.pdf.
Kate Hosford, et al. (2021), “The Effects of Road Pricing on Transportation and Health Equity: A Scoping
Review,” Transport Reviews (DOI: 10.1080/01441647.2021.1898488).
Kent M. Hymel, Kenneth A. Small and Kurt Van Dender (2010), “Induced Demand And Rebound Effects In
Road Transport,” Transportation Research B (www.elsevier.com/locate/trb), Vol. 44, No. 10, December, pp.
1220-1241; summary at www.socsci.uci.edu/~ksmall/Rebound_congestion_27.pdf.
ICF (2008), The Broader Connection between Public Transportation, Energy Conservation and Greenhouse Gas
Reduction, American Public Transportation Association (www.apta.com); at
www.apta.com/research/info/online/documents/land_use.pdf.
21Pricing For Traffic Safety
Victoria Transport Policy Institute
ITF (2014), City Of Milan Wins Prestigious Transport Award: Italian City’s Road Pricing Scheme Recognised By
Global Transport Body, International Transport Forum (www.internationaltransportforum.org); at
https://bit.ly/1qVBmAH.
Olof Johansson and Lee Schipper (1997), “Measuring the Long-Run Fuel Demand for Cars,” Journal of
Transport Economics and Policy, Vol. 31, No. 3, pp. 277-292; at www.jstor.org/pss/20053740.
Jeffrey Kenworthy and Felix Laube (2000), Millennium Cities Database For Sustainable Transport, Institute for
Sustainability and Technology Policy, Distributed by the International Union of Public Transport
(www.uitp.com).
J. Paul Leigh and Estella M. Geraghty (2008), “High Gasoline Prices and Mortality From Motor Vehicle Crashes
and Air Pollution,” Journal of Occupational and Environmental Medicine, Vol. 50, Is. 3, March, pp. 249-54; at
www.ncbi.nlm.nih.gov/pubmed/18332774.
Shanjun Li, Joshua Linn and Erich Muehlegger (2011), Gasoline Taxes and Consumer Behavior, Stanford
University (http://economics.stanford.edu); at http://economics.stanford.edu/files/muehlegger3_15.pdf.
Samjin Lim, Wonchol Kim, Sangmoon Jung and Myungsoon Chang (2006), “Bus Traffic Accident Analysis:
Before and after Transportation Reform in Seoul,” Seoul Studies Journal, Seoul Development Institute
(www.sdi.re.kr).
Todd Litman (1997), “Distance-Based Vehicle Insurance as a TDM Strategy,” Transportation Quarterly, Vol.
51, No. 3, Summer, pp. 119-138; at www.vtpi.org/dbvi.pdf.
Todd Litman (2006), Evaluating Public Transit Benefits and Costs, VTPI (www.vtpi.org); at
www.vtpi.org/tranben.pdf.
Todd Litman (2007), Socially Optimal Transport Prices and Markets, VTPI (www.vtpi.org); at
www.vtpi.org/sotpm.pdf.
Todd Litman (2008), Transportation Elasticities: How Prices and Other Factors Affect Travel Behavior, Victoria
Transport Policy Institute (www.vtpi.org); at www.vtpi.org/elasticities.pdf.
Todd Litman (2009), Transportation Cost and Benefit Analysis: Techniques, Estimates and Implications,
Victoria Transport Policy Institute (www.vtpi.org).
Todd Litman (2012), “Changing North American Vehicle-Travel Price Sensitivities: Implications For Transport
and Energy Policy,” Transport Policy, (http://dx.doi.org/10.1016/j.tranpol.2012.06.010); full report at
www.vtpi.org/VMT_Elasticities.pdf.
Todd Litman (2012), “Pricing for Traffic Safety: How Efficient Transport Pricing Can Reduce Roadway Crash
Risks,” Transportation Research Record 2318, pp. 16-22, TRB (www.trb.org); at www.vtpi.org/price_safe.pdf.
Todd Litman (2014), “How Transport Pricing Reforms Can Increase Road Safety,” Traffic Infra Tech, April-May
2014, pp. 68-71 (http://emag.trafficinfratech.com ); at www.vtpi.org/TIT-pricesafety.pdf.
Todd Litman (2017), A New Traffic Safety Paradigm, Victoria Transport Policy Institute (www.vtpi.org); at
www.vtpi.org/ntsp.pdf.
22You can also read