Sustainable Urban and Transport Development for Transportation Disadvantaged: A Review - The Open Transportation Journal
←
→
Page content transcription
If your browser does not render page correctly, please read the page content below
The Open Transportation Journal, 2010, 4, 1-8                                           1

                                                                                                                        Open Access
Sustainable Urban and Transport Development for Transportation
Disadvantaged: A Review
Tan Yigitcanlar*, Kushairi Rashid and Fatih Dur

Queensland University of Technology, School of Urban Development, Brisbane, Australia

            Abstract: Around the world, particularly in North America and Australia, urban sprawl combined with low density
            suburban development has caused serious accessibility and mobility problems, especially for those who do not own a
            motor vehicle or have access to public transportation services. Sustainable urban and transportation development is seen
            crucial in solving transportation disadvantage problems in urban settlements. However, current urban and transportation
            models have not been adequately addressed unsustainable urban transportation problems that transportation disadvantaged
            groups overwhelmingly encounter, and the negative impacts on the disadvantaged have not been effectively considered.
            Transportation disadvantaged is a multi-dimensional problem that combines demographic, spatial and transportation
            service dimensions. Nevertheless, most transportation models focusing on transportation disadvantage only employ
            demographic and transportation service dimensions and do not take spatial dimension into account. This paper aims to
            investigate the link between sustainable urban and transportation development and spatial dimension of the transportation
            disadvantage problem. The paper, for that purpose, provides a thorough review of the literature and identifies a set of
            urban, development and policy characteristics to define spatial dimension of the transportation disadvantage problem.
            This paper presents an overview of these urban, development and policy characteristics that have significant relationships
            with sustainable urban and transportation development and travel inability, which are also useful in determining
            transportation disadvantaged populations.
Keywords: Transportation disadvantaged, social exclusion, sustainable transportation, sustainable urban and transportation
development, travel demand management, accessibility, mobility.

INTRODUCTION                                                               increasingly under attack for being biased against non-
                                                                           motorised traffic modes and TDA groups [4], and for failing
    The concept of sustainability and its applicability to
                                                                           to inform policy-makers with accurate information on TDA.
urban settings have been one of the most discussed issues in
                                                                           In recent years, a strong demand has arisen for an equitable
the literature [1]. As rapid urbanisation and growing                      access to transportation opportunities for TDA. The literature
population of cities are considered, implications of changing
                                                                           points out the ethical responsibility of modelling studies
lifestyles on sustainability and how these are remedied could
                                                                           towards social issues and views ‘accessibility’ and ‘social
be considered as the most pressing subject of the urban and
                                                                           equity’ among the key issues for urban and transportation
transportation planning professions. The complex nature of
                                                                           planning [5, 6].
cities and politics around them strongly force urban and
transportation planners to analyse contemporary problems of                    Determining TDA populations and comparing their
their cities more carefully. This also pushes them to produce              characteristics with non-disadvantaged groups are important
more effective policy recommendations. In this instance, the               for a sound urban and transportation policy-making and
popular concept of ‘sustainable urban and transportation                   achieving SUTD. One of the major deficiencies is the
development’ (SUTD) comes into play. The most vulnerable                   unavailability of a comprehensive and holistic approach in
groups affected from the unsustainable urban and                           determining TDA and measuring their disadvantage levels.
transportation development are referred as ‘transportation                 Existing land-use and transportation planning models do not
disadvantaged’ (TDA) groups. TDA groups are generally                      provide policy-makers with the degree of disadvantage
identified as those people whose range of travel alternatives              levels of a locality, and have been inadequate in addressing
are limited, especially limited to the availability of easy-to-            severe long-term transportation problems that TDA groups
use and inexpensive options of trip-making [2]. The negative               overwhelmingly encounter [7-9]. Policy-makers would be
impacts of transportation on TDA have not been effectively                 able to propose relevant remedies or polices, if they have
considered in the urban and transportation modelling studies,              accurate disadvantage ratios and indicators.
as these models do not take all of the demographic, spatial                    The aim of this paper is to provide a review and outlook
and transportation service parameters into account [3].                    on the key features of SUTD and TDA by linking literatures
Particularly land-use and transportation models are                        on both of these fields. The two sections following this
                                                                           introduction provide a thorough review of the literature on
                                                                           SUTD and TDA. The fourth section of the paper firstly
*Address correspondence to this author at the Queensland University of
Technology, School of Urban Development, Brisbane, Australia; Tel:         reveals the key characteristics of TDA by introducing a
+61.7.3138.2418; Fax: +61.7.3138.1170;                                     conceptual framework that accommodates the key indicators
E-mail: tan.yigitcanlar@qut.edu.au                                         of measuring and determining TDA. Secondly it presents an

                                                         1874-4478/10      2010 Bentham Open
2 The Open Transportation Journal, 2010, Volume 4 Yigitcanlar et al.
overview of these urban, development and policy automobile dependence to more sustainable public
characteristics that have significant relationships with SUTD transportation and non-motorised means [14].
and travel inability, which are also useful in determining
In terms of social equity and accessibility to urban
TDA populations. The paper concludes by pinpointing the
services, low density urban sprawl imposes economic and
key findings and also directions for further research in the social burdens on low income groups towards deterioration
intersecting areas of SUTD and TDA.
of community sense and feeling powerless [15]. It is also
SUSTAINABLE URBAN AND TRANSPORTATION asserted that neo-traditional settlement form satisfying high
DEVELOPMENT density and mix use features are more sustainable that
suburban type urban development [16]. Conceptualisation of
Economic, environmental and social dimensions of SUTD policies has revealed various urban planning
SUTD encompass urban form, transport, infrastructure and movements, such as smart growth, new urbanism, transit
community domains. These domains also identify the oriented development, and decentralised concentration.
responsibilities of planning in terms of intervention and Opponents of urban consolidation, put forward the questions
regulation to reach desired sustainable urban futures. of feasibility and acceptability of such policies. For example,
Particularly, critical importance of the problems related to it is claimed that high density and large investment to public
unsustainable transportation activities, such as greenhouse transportation may not warrant a reduction in motor vehicle
gas emissions, health-threatening pollutants, non-renewable travel due to high level motor vehicle travel preferences of
fuel use, traffic congestion, accidents and fatalities, have the people [17]. Another claim opposing to compact urban
revealed the need for SUTD. On the one hand, mostly at the form states that neo-traditional urban form, like in Europe,
global and national levels, transportation emissions and does not necessarily make people less motor vehicle
energy consumption issues have been heavily discussed and dependent, what forces people to travel less is high public
received a great deal of attention. Following this attention, at transportation patronage, high fuel prices and stringent tax
the technological level, improvement strategies in the fuel policies [18]. From the perspective of land market
and engine systems of vehicles have become one of the economics, urban containment and consolidation could result
priority areas of development. On the other hand, policies in an increase in land and property values, which
aiming to diminish motor vehicle dependency and excessive unfortunately strengthens the suburbanisation trend that
travel have been also taken into account for achieving the stimulates motor vehicle mobility in return [15].
long term sustainability goals of many urban areas. In the
literature these policies are grouped under the heading of In the literature, SUTD arguments frame the main
‘travel demand management’ (TDM) considerations. As considerations demanding change towards a more
technological advancement of vehicle systems and sustainable state. However, the causal relationship among
transportation infrastructure constitute mostly technical and various factors affecting urban form and transportation
engineering part of the discussion, TDM mainly focuses on interrelationship is the main subject of the TDM domain.
relationship between urban form and transportation, and Interestingly, growing common interest on social exclusion,
socio-economic dimensions, such as household public health and transportation relationship, physical
characteristics affecting location choice, daily and holiday activity, and non-motorised transportation mode preference
travels, mode choice and acceptability of TDM policies. leads to the convergence of three literature: social exclusion,
Supporters of TDM discuss the relative importance of top- travel behaviour and physical activity research [1, 19, 20].
down approaches, which assign the main SUTD The common arguments of these disciplines are
responsibilities to local governments and planning agencies opportunities, patterns and preferences of travel, mode
[10]. However in more recent studies, it is reported that choice, socio-economic drivers of motor vehicle ownership
bottom-up strategies, which initiate public awareness and travel, and effects of urban design consideration on
towards individuals’ contribution to unsustainable physical activities, especially walking and cycling [21].
transportation pattern and searching the ways of voluntary The balance between mobility and accessibility plays a
travel behaviour change, may be more effective than top- key role in achieving SUTD. Mobility impairment and low
down approaches [11]. level of accessibility to urban services and transportation
Inherent complexity of achieving SUTD is mainly facilities are among the growing problems contributing to the
explained as a consequence of a number of factors escalation of transportation inequity [22, 23]. Particularly in
influencing urban form and transportation, joint effects of the context of North America and Australia, distance to
this relationship, and time-dependent changes in urban services is increased over the last three decades together with
structure. Land-use decisions affect transportation the rapid growth of suburbia. There is a clear inequity
investments and systems in the short run, however, travel problem between people with and without an automobile,
pattern shaped according to transportation network affects and those without access to an automobile are even deprived
land-use decisions and future transportation systems in the of access to the economic and social life of the city [24]. In
long run [12]. In SUTD, urban form discussion involves the light of the mobility and accessibility discussions, two
mainly density and mix land-use dimensions acknowledging key questions have become evident from the recent
the urban sprawl problem. Furthermore, motor vehicle literature. The first one is whether the new direction of
dependency and urban sprawl relationship is another popular SUTD policies is focused only on mobility and technology
topic of SUTD [13]. Principal function of urban issues. The second question is whether SUTD policies also
consolidation via intensification and mix use reduces trip consider citizens’ accessibility to urban opportunities,
lengths and total travel, and also changes modal split from particularly for those who are TDA [25]. This second
question aligns with the social dimension of sustainability,Sustainable Urban and Transport Development for Transportation Disadvantaged The Open Transportation Journal, 2010, Volume 4 3
whereby sustainability policies should take into account of in the UK, there are still both methodological and conceptual
social considerations together with environmental and struggles in tackling the TDA issue comprehensively.
economic sustainability issues [26]. It also relates to the
Not all widely accepted parameters to measure TDA
arguments about efficiency versus equity of market and
could be used under every circumstance. For instance,
governmental regulations. These arguments suggest that sometimes TDA may spend less money and time for their
policies that increase the cost of travel should not be the only
trips due to less mobility. Likewise, travel is assumed to be
regulatory instruments, but that other compensating
an impediment, which is true especially for work trips, a cost
measures, such as decreasing labour tax, which covers the
to be reduced whenever possible [32]. Similarly increasing
increased transportation cost of low-income people [27]; and
leisure activities and the time allowed to such trips may not
subsidising public transportation and other low cost
be assumed costly, thus, the accurate modelling of leisure
transportation infrastructure and services, particularly in the trips becomes more critical especially for TDA groups. Thus,
areas where transportation disadvantages exists [28]. Some
it is useful if TDA groups are determined for each trip
contend that such measures would rectify the erroneous
purposes. Also inequity arises between people who have and
definition of sustainable transportation, which equates
who have not own or access to a motor vehicle. Yet, the cost
mobility to accessibility, by emphasising the accessibility to
of driving in some developing countries is quite high due to
public services and urban activities with various
higher fuel prices and ever-increasing congestions, thus
transportation means [23, 29]. Transportation policies, while owning a motor vehicle does not make them non-
improving people’s mobility, should also convey social
disadvantaged, which is not the case in North America or
equity in sustainability. Further, a sustainable and socially
Australia, where driving is more affordable due to lower fuel
just transportation system ought to provide a fair distribution
prices and affordable motor vehicles. Additionally, peak
of transportation services and equal access to employment,
hour congestion is many times perceived as the biggest
housing, education, health services and recreation, and
problem, but the perception is relative and endurance to the
minimise the level of TDA [30]. congestion changes from one culture to another and from
TRANSPORTATION DISADVANTAGED metropolitan areas to remote settlements. Income levels also
may have different implications on difficulty perceptions.
Many cities, particularly in North America and Australia, Moreover, even disabled or elderly may feel non-
are plagued by the motor vehicle-oriented suburbanisation, disadvantaged, if they are provided with easy accessibility
which is a development characterised by low-density sprawl and mobility options.
like development, big retailers replacing corner shops,
doubled-up distances to major local activities, and removal TDA is a dynamic and multi-dimensional issue involving
of public transportation lines from the poor districts [24]. In physical, temporal, economical, spatial, and psychological
such development segregated view of the urban space can dimensions [33]. Because of the multi-dimensional nature of
even have a larger responsibility in the resulting appearance TDA serious measurement and level of analysis difficulties
of the disadvantage. Poor local transportation system has a arise [6]. Most of the related research, while managing to
role in creating barriers for TDA or also so-called ‘socially locate the problem and enriching discussion and
excluded’ groups that have become more and more convergence, failed to determine TDA accurately. Because
inaccessible [48]. Combination of poor accessibility with of the cultural significance of the issue, travel behaviours
low levels of mobility and low levels of sociability may show variety in different cultures and even from one
intensifies TDA [6]. In such circumstances what really disadvantaged group to another [34]. Thus, determination of
matter is to provide more assistance to the most vulnerable TDA can be highly place, culture and context dependent.
groups, poor, elderly and disabled particularly in rapidly Determining TDA populations and comparing their
aging societies [30]. characteristics with non-disadvantaged groups are extremely
important for a SUTD and urban policy-making. One of the
A number of studies have been conducted in order to major deficiencies is the unavailability of a comprehensive
determine TDA population. For example, Duvarci and and holistic way in determining TDA groups and measuring
Yigitcanlar’s study [30] sought integration of TDA analysis their disadvantage levels. Existing transportation planning
with mainstream travel demand models by employing models do not provide policy-makers with the degree of
perceptional data, in which TDA could neatly be determined disadvantage levels of a locality, and have been inadequate
through a cluster analysis focusing on community travel in addressing severe long-term transportation problems that
conditions in Aydin, Turkey. Some UK-based studies used TDA groups overwhelmingly encounter [7, 8]. Policy-
accessibility measures to determine TDA [19]. For instance, makers would only be able to propose relevant remedies or
Schmocker et al. [31] determined the trip making polices, if they have accurate disadvantage ratios and
characteristics of elderly and disabled for four trip purposes indicators. Therefore, it is important to clearly understand
by analysing the 2001 London Area Travel Survey. Wu and the specific characteristics of TDA.
Hine [22] provided a classification on TDA by deprivation
domains of income, employment, health and disability, CHARACTERISTICS OF TRANSPORTATION DIS-
education, geographical access to services, social ADVANTAGED
environment, and housing. Church et al. [19] defined seven
Transportation disadvantage is relatively a function of
basic TDA types as: physical, geographical, exclusion from
accessibility and mobility problems. In general, both
facilities, economic, and time-based, fear-based and space- accessibility and mobility can be conceived as an ease to
based exclusions. Despite the growing literature and interest
reach a destination [35]. Both terms have been fairly used
on the recent call of governmental policy on social exclusion
together in the TDA discourse. There are many factors or4 The Open Transportation Journal, 2010, Volume 4 Yigitcanlar et al.
indicators that are used for determining accessibility and mobility level and a high distance from the urban centre and
mobility levels of individuals and social groups, such as many key land-use destinations. Despite that the condition
social, economic, transport and land-use indicators. could be worsening as the low density development in the
suburbia is invisible for facilities and amenities to operate
In the discourse of equity in transportation supply,
mobility level has been used substantively to identify social and consequently, these households have to bare the
increased of travel cost due to increase in travel distance.
groups that have lower mobility levels and have significantly
While the current land-use and infrastructure policy remains
higher needs and demands for travel [10]. There is certainly
encouraging motor vehicle ownership, providing limited
a close relationship between access to a motor vehicle or
public transportation services in the suburbia, and creating a
income levels with the ability to travel freely [36]. It is
severely disadvantaged situation for these groups.
identified that a social group with lower mobility level is
traditionally lack one of these two resources. Therefore, the To remedy TDA problems, Banister [7] suggests
elderly, children and youth, caretaker, low income group, equilibrium to be developed between all elements of land-
beneficiaries, unemployed, women and those who physically use and transportation planning that considers both physical
impaired are traditionally associated with individuals or (e.g. urban form and traffic) and social dimensions of
social groups that are TDA [37]. However, transportation transportation (e.g. people and proximity). The sustainable
disadvantage does not solely depend on the demographics or mobility approach requires actions to reduce the need to
socio-economic attributes of people (e.g. income), but also is travel fewer trips, encourage modal shift, reduce trips lengths
an outcome of the transportation services (e.g. public and encourage greater efficiency in the transportation
transportation) and spatial (e.g. density) characteristics of the system. Therefore, there exists a substantial need to identify
locality. which spatial characteristics most leads to a severe TDA.
Even though, socio-economic characteristics and public
SUTD, including provision of efficient public
transportation systems, can resolve TDA and accessibility transportation system indices are also have significant roles
in determining TDA, it has been identified that only a few
problems in a society by providing services those without
TDA research include detailed spatial characteristics in their
any access to motor vehicle alternatives. On the one hand, it
analysis.
is vitally important that sustainable public transportation
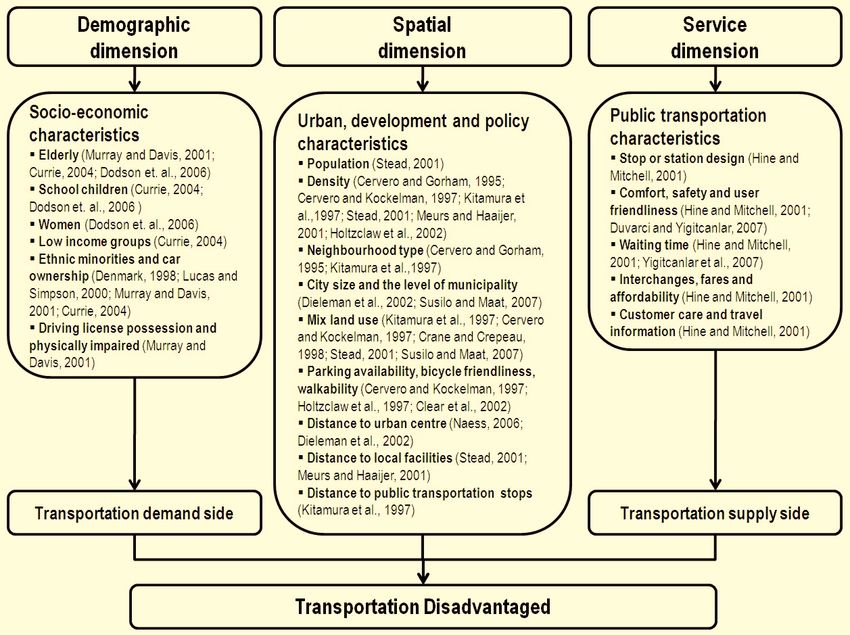
systems to provide the community with a significant level of TDA has a multi-dimensional nature that consists of
travel opportunity with minimum travel time, distance and demographic, spatial and transportation service dimensions.
cost to essential destinations. On the other, it is important Fig. (1) developed as part of the research reported in this
that sustainable public transportation system to provide a paper, illustrates key dimensions and characteristics with
reasonable access from origin to public transportation stop or their literature references in determining TDA. The literature
station by providing a high public transportation coverage indicates that there is a fundamental difference between the
area with a well connected bicycling and pedestrian system travel needs of the people and their travel behaviours. Thus,
[4]. However, TDA is not merely caused solely by the measuring the difference between these two might help
aforementioned factors, but it also includes preferences that planners and policy-makers to determine TDA and develop
are perceived by the passengers. In this regard, an individual policies to overcome their disadvantages. Therefore, it is
maybe considered as disadvantaged based on the merits of vital to clearly scrutinise both the travel needs and also
the public transportation vehicles’ comfort, waiting time and behaviours of populations. This brings the importance of
interchange locations and above all service frequency, assessing both travel demand and also supply. In broad
reliability and punctuality [27]. Furthermore; there are other terms, the difference between supply and demand indicates
factors that have significant weighting in determining what needs to be done by policy-makers and planners. The
transportation disadvantage such as the safety level in conceptual framework, shown in Fig. (1), focuses on TDA
stations or stops, customer care and travel information [2]. determination by both measuring travel demand and supply.
Moreover, those who are disable, with a big luggage or In this framework in terms of travel demand key socio-
travelling with children could be considered disadvantaged economic characteristics that effect accessibility and
while travelling via public transportation. These groups find mobility levels are considered. For the travel supply side
that access to and from a bus, train and station are sometimes public transportation infrastructure and service
troublesome due to unfriendly design of the system and the characteristics are seen as the main elements. Between the
environment. two dimensions, demographic and service, the framework
places the spatial dimension domain. Urban, development
TDA can be a result of spatial characteristics or location
and policy characteristics of this spatial dimension of a
disadvantage. In this case, the location disadvantage is partly
due to mono-centric development and the dramatic growth of locality is also important in determining TDA populations in
that particular locality.
a city that lead to urban sprawl and low density suburban
expansion [35, 38]. In mono-centric development form, the Although, there are three equally important,
fast phase of the spatial development is unbearable for demographic, spatial and service, domains or dimensions of
transportation infrastructure to cope and thus, the low TDA determination, a substantial number of research mainly
residential development is unprofitable for the public have focused on the analysis of the socio-economic and
transportation operators. Furthermore, location disadvantage public transportation service characteristics of TDA. There
also is a result of the increasing land values in the inner city. have been relatively limited explorations on the spatial
As land value increases in the inner area of the CBD, the low dimensions and its urban, development and policy
income groups have to move from the inner city and settle in characteristics. The reason of why spatial dimension of TDA
the outer areas which in general have a relatively low has not been scrutinised as much as the others might mostSustainable Urban and Transport Development for Transportation Disadvantaged The Open Transportation Journal, 2010, Volume 4 5
Fig. (1). A conceptual framework for transportation disadvantage analysis.
probably be due to the complex process of quantifying TDA between residential, determine the accessibility of an area
and finding the most suitable indicators for analysis. and thus determine the level of TDA.
Therefore, this paper mainly explores this relatively less
Keeping above mentioned two TDA approaches in mind
investigated dimension of TDA. the following section investigates and provides a review of
From the practice of TDA determination exercises, it is the major spatial measures used for determining TDA.
noticeable that spatial indices of TDA are determined by
using two distinctive approaches. The first approach is SPATIAL MEASURES FOR DETERMINING
TRANSPORTATION DISADVANTAGED
concerned of trip making by which trip capabilities are
depicted by trip rates, trip frequencies or trip distances or High dependence on motor vehicle use for travel has
vehicles kilometres travelled. It is acknowledged that, the been clearly associated with unsustainable way of travel due
ease to travel is likely associated with high level of trip rates to the relatively high cost of travel and environmental
and trip frequencies, which is to say TDA can be clearly hazards that motor vehicle mobility causes. Relating SUTD
defined with longer travel distance, increased dependency to with TDA, the literature underlines certain type of built
private vehicle use, low trip rates and low trip frequency environment and land-use characteristics that determine
[24]. The second approach is the accessibility-based travel behaviours, particularly mode choice, motor vehicle
measures that identify TDA by using accessibility levels or travel distance, and degree of motor vehicle dependency
number of accessible land-use destinations [6]. In this [24]. Spatial planning is vital in providing sustainable
measurement approach, people may become TDA, if the transportation systems and sustainable mobility as it
available transportation infrastructure does not reach to the determines the spatial arrangements of land-uses and
desired destination, especially for the mandatory trips of amenities. One of the SUTD strategies sensitive to TDA is
education, health and work. Determining TDA by using this developing an inclusive urban form with high mobility
approach requires expanding the data input with more opportunities by delaminating physical separation between
information of urban, development and policy characteristics activities, reducing distance between activity centres and by
[24]. In this approach vital land-use datasets, such as promoting significant level of mix land-use development.
location of activities, distribution of services, and the link Longer motor vehicle travel, high level of motor vehicle6 The Open Transportation Journal, 2010, Volume 4 Yigitcanlar et al.
dependency, and low accessibility are significantly become more dependent to motor vehicle use and have a
associated with land-use characteristics such density of the higher distance to travel by private motor vehicles.
development, distance from urban centre, mix land-uses, According to Naess [46], travel capability to the urban centre
type of neighbourhood, and presence of pedestrian facilities has a negative correlation with distance from the urban
[24]. The literature on spatial measures, travel capabilities centre. As the travel distance from urban centre increases,
and TDA are generally determined based on trip distance, trip frequency decreases and participation in urban activities
trip frequency, and mode of travel. These indicators, factors also decreases. The distant area from urban centre is more
or variables along with other supporting ones are used reliable on service in the local centre and the absence of such
interchangeably to show travel capabilities and indicating services in the neighbourhood may increase the motor
TDA. vehicle use. In the perspective of SUTD, the increased
The key spatial factors that affect travel capabilities of distance from urban centre has a negative consequence to
energy consumption and level of sustainability. According to
TDA include: urban density, urban form, urban structure,
Holden [1], the increased distance from urban centre has a
settlement size, distance to urban centre, distance to local
positive correlation with energy consumption, therefore, in
facilities, land-use mix, neighbourhood type and street
order to promote a lower energy consumption a compact
design. The key characteristics of these factors are discussed
development with minimised travel distance is favourable.
below.
This also applies for TDA populations, as the distance from
Urban Density, Form and Structure urban centre increases the level of TDA shows an increase
[30].
Density is the most studied land-use characteristic that
has the largest share to explain numerous travel behaviours, The provision of facilities and services within residential
and achieving high density is a SUTD goal [39]. In general, areas is a significant land-use characteristic that can reduce
density determines travel behaviours for four reasons. travel distance and increased travel capabilities via non-
Firstly, higher densities increase the range of opportunities motorised vehicles. The level of mix land-use is commonly
for the development of local personal contacts and activities identified by using a ratio of job and housing balance.
that can be maintained without resort for motorised travel. However, mix land-use can also be identified by using other
Secondly, higher population densities broaden the range of proxy variables that depict mix land-use characteristics such
local services thus reduce the need of travel and length of as provision of facilities and distance to local facilities.
travel. Thirdly, higher density tends to reduce travel distance Litman and Burwell [10] reveal that in order to develop a
between homes, services, employment and other good merit in accessibility, residents of an area should have
opportunities which reduces travel distance. Fourthly, higher right to access to emergency services, healthcare, basic food
density provides substantial number of passengers for public and clothing, education and employment, public services,
transportation services and less amenable to private motor mail and freight distribution, and social and recreational
vehicle usage. Therefore, there is significant ground to activities. The presence of facilities within a residential area
ascertain that people residing in less dense areas have a contributes to lower motor vehicle mobility, more travel
higher possibility to become TDA. Findings of Stead’s [40] capabilities and less TDA populations. Meurs and Haaijer
study show that residents of larger and dense urban areas [43] and Stead [40] indicate that travel capabilities can be
travel less than residents of smaller and spread population increased considerably by locating closely daily facilities,
settlements. Thus, it would not be wrong to say low density shopping and school with close proximity to residential
suburbs travel longer distances than the residents of higher areas. The results of Cervero and Kockelman’s [34] research
density suburbs. In relation with mode choice, density also on travel behaviours and mix uses show that residential areas
has a considerable influence in distance travelled by private with modest or high spatial accessibility to commercial
motor vehicles. A study on U.S. cities by Kitamura et al. premises tend to have less vehicles kilometres travelled per
[41] shows that density is the most significant land-use household. Thus, large share of commercial areas in
characteristic in mode choice and TDA. This finding is also residential zones allows a high level of travel capability to its
supported by other studies undertaken by Holtzclaw et al. residents, via public or non-motorised modes, and
[42] and Meurs and Haaijer [43]. contributes to the minimisation of TDA within the locality
[47]. Stead [40] claims that higher job ratio is clearly
Settlement Size, Distance to Urban Centre and Local associated with low travel distance. Examining the influence
Facilities, and Land-Use Mix of settlements and commuter characteristics, Susilo and Maat
Job opportunities and centralised activities in urbanised [44] identify that a high ratio between job and house tend to
areas attract substantial number of commuters, especially reduces journey outside the neighbourhood.
those residing in the suburban and outer areas. Compact Neighbourhood Type and Street Design
urban form with services is at proximity in most urbanised
areas have lead to shorter travel distance, thus increased the The influence of neighbourhood type and street design on
level of accessibility. Based on a research by Susilo and the trip making and travel behaviours have been debated
Maat [44], degrees of urbanisation variables consistently considerably [14]. It can be said that certain land-use
influence the parameter of commuting journey whereby features have noticeable influence on travel behaviours and
travel distance has a negative correlation with the size of the trip making. Within the scope of neighbourhood type and
settlement. Dieleman et al. [45] reveal that motor vehicle use street design studies, two noticeable features have been
is likely to be low in the large and medium size cities and subject of investigation. The first one is transit oriented
high in suburban or rural areas. As the distance from an development and neighbourhoods that the physical form of
urban centre increases, people who reside in the outer areas this type of neighbourhoods favour pedestrian and publicSustainable Urban and Transport Development for Transportation Disadvantaged The Open Transportation Journal, 2010, Volume 4 7
transportation use, and have gridiron street lay-out. These TDA, and the conceptual framework, presented in this paper,
types of neighbourhoods are labelled as green transportation is planned to be further developed into an operational
friendly neighbourhoods that help lowering down the TDA framework to form a TDA index to be used in determining
numbers. Cervero and Groham [48] state that in the U.S. TDA populations, measuring their disadvantage levels, and
most public transportation neighbourhoods were largely built developing policy directions to inform local decision-
before 1945, and auto-oriented neighbourhoods, also known making.
as suburban neighbourhoods, are relatively new
neighbourhoods developed without having any considerable REFERENCES
notion on the public transportation use [41]. This type of [1] E. Holden, Achieving Sustainable Mobility: Everyday and Leisure-
development is generally built in an area without public Time Travel in the EU. London: Ashgate, 2007.
[2] J. Hine, and F. Mitchell, Transport Disadvantage and Social
transportation lines and primarily has random street patterns Exclusion. London: Ashgate, 2003.
with having a combination of: 3-way lanes, T-intersections, [3] J. Hunt, D. Kriger, and E. Miller, “Current operational urban land-
and cul-de-sacs. Cervero and Groham’s [48] study compares use–transport modelling frameworks: a review”, Trans. Rev., vol.
commuting characteristics of transit oriented 25, no. 3, pp. 329-376, 2005.
neighbourhoods with auto-oriented neighbourhoods. The [4] A. Murray, and R. Davis, “Equity in regional service provision”, J.
Reg. Sci., vol. 41, no. 4, pp. 557-600, 2001.
findings of this study show that public transportation [5] E. Deakin, “Trends and policy choices”, Access, vol. 23, no. 1, pp.
neighbourhood has a lower drive-alone modal share and trip 12-15, 2003.
generation rate than its auto-oriented counterpart. Public [6] T. Yigitcanlar, N. Sipe, R. Evans, and M. Pitot, “A GIS-based land-
transportation neighbourhoods have higher walking and use and public transport accessibility indexing model”, Aust.
Planner, vol. 44, no. 3, pp. 30-37, 2007.
bicycling modal share than auto-oriented neighbourhoods. [7] D. Banister, “Sustainable urban development and transport-a
The presence of pedestrian friendly design features in the Eurovision for 2020”, Trans. Rev., vol. 20, no. 1, pp. 113-130.
public transportation neighbourhood design has a significant 2000.
contribution in increasing residential travel capabilities and [8] S. Kenyon, G. Lyons, and J. Rafferty, “Transport and social
SUTD [42]. A walkable neighbourhood combining exclusion: investigating the possibility of promoting inclusion
through virtual mobility”, J. Trans. Geogr., vol. 10, no. 3, pp. 207-
necessary land-use destinations supported with a reliable 219, 2002.
public transportation minimises the private motor vehicle [9] B. Simpson, Urban public transport today. London: E&FN Spon,
trips as well as the number of TDA dramatically [41, 49]. 1994.
[10] T. Litman, and D. Burwell, “Issues in sustainable transportation”,
CONCLUSION Int. J. Glob. Environ. Issues, vol. 6, no. 4, pp. 331-347, 2006.
[11] W. Shore, “Land-use, transportation and sustainability”, Technol.
Past few decades have shown a significant increase in Soc., vol. 28, no. 1-2, pp. 27-43, 2006.
private motor vehicle ownership, over reliance on private [12] P. Newman, “Sustainable transport for sustainable cities”, Issues,
motor vehicles for daily travel and an unsustainable urban vol. 1, no. 1, pp. 6-10, 2006.
[13] N. Low, B. Gleeson, and E. Rush, “Making believe: Institutional
development pattern. The over reliance, automobile and discursive barriers to sustainable transport in two Australian
dependency and unsustainable urban form correlate with a cities”, Int. Plann. Stud., vol., 8, no. 2, pp. 93-114, 2003.
number of problems such as environmental degradation, [14] R. Ewing, and R. Cervero, “Travel and the built environment: a
accident-generated mortality, and increasing TDA levels. It synthesis”, Transp. Res. Record, vol. 1780, no. 1, pp. 87-114, 2001.
has been widely accepted that current unsustainable practices [15] E. Burton, “The compact city: just or just compact? A preliminary
analysis”, Urban Stud., vol. 37, no. 11, pp. 1969-1985, 2000.
and lifestyles cannot be sustained, if we are to leave a [16] S. Handy, L. Weston, J. Song, and K. Lane, “Education of
healthy living planet to the next generations. One of the most transportation planning professionals”, Transp. Res. Record, vol.
vulnerable groups affected from the unsustainable 1812, no. 1, pp. 151-160, 2002.
development is TDA, whose abilities and range of travel [17] P. Gordon, and H. Richardson, “Are compact cities a desirable
planning goal?”, J. Am. Plann. Assoc., vol. 63, no. 1, pp. 95-106,
alternatives are limited. This circumstance urges for a need 1997.
for a more sustainable way of planning urban and [18] M. Breheny, “The compact city and transport energy
transportation development. In the light of these problems a consumption”, Trans. Inst. Br. Geogr., vol. 20, no. 1, pp. 81-101,
new perspective, SUTD, has been pushed to the forefront of 1995.
policy-making and politics. In this new sustainability [19] A. Church, M. Frost, and K. Sullivan, “Transport and social
exclusion in London”, Trans. Policy, vol. 7, no. 3, pp. 195-205,
perspective provision of transportation infrastructure and 2000.
services that are sustainable is seen as a panacea for TDA. [20] B. Giles-Corti, “People or places: What should be the target?”, J.
Sci. Med. Sport, vol. 9, no. 5, pp. 357-366, 2006.
The literature, reviewed in this paper, clearly indicates [21] T. Yigitcanlar, and F. Dur, “Developing a sustainability assessment
that discussions on incorporating sustainable development model: the sustainable infrastructure land-use environment and
and transport disadvantage in an urban context are clustered transport model”, Sustainability, vol. 2, no. 1, pp. 321-340, 2010.
around the broad topics of socio-economic, urban form and [22] B. Wu, and J. Hine, “A PTAL approach to measuring changes in
bus service accessibility”, Trans. Policy, vol. 10, no. 1, pp.307-320,
transportation features of localities as the key considerations. 2003.
For that reason, this paper developed and presented a [23] T. Yigitcanlar, L. Fabian, and E. Coiacetto, “Challenges to urban
conceptual framework that illustrates the key dimensions for transport sustainability and smart transport in a tourist city”, Open
determining TDA as demographic, spatial and transportation Transp. J., vol. 2, no. 1, pp. 19-36, 2008.
service dimensions. Among these three dimensions the paper [24] K. Rashid, and T. Yigitcanlar, and J. Bunker, “Transportation
disadvantage determination framework: space-time organisation
primarily investigated the spatial dimension of urban measure in determining transportation disadvantage”, The 2nd
environments and introduced its urban, development and Infrastructure Research Theme Postgraduate Student Conference,
policy characteristics, which all are important in achieving pp. 260-272, 2009.
SUTD and minimising TDA problems. However, our future [25] P. Moriarty, “Environmental sustainability of large Australian
cities”, Urban Policy. Res., vol. 20, no. 3, pp. 233-244, 2002.
research will also be focusing on the other two dimensions of8 The Open Transportation Journal, 2010, Volume 4 Yigitcanlar et al.
[26] M. Roseland, “Sustainable community development: integrating [39] D. Stead, and S. Marshall, “The relationships between urban form
environmental, economic, and social objectives”, Progr. Plann., and travel patterns. An international review and evaluation”, Eur J.
vol. 54, no. 2, pp. 73-132, 2000. Trans. Infrastruct. Res., vol. 1, no. 2, pp. 113-141, 2001.
[27] N. Cass, E. Shove, and J. Urry, “Social exclusion, mobility and [40] D. Stead, “Relationships between land use, socioeconomic factors,
access”, Sociol. Rev., vol. 53, no. 3, pp. 539-555, 2005. and travel patterns in Britain”, Environ. Plann. B, vol. 28, no. 4, pp.
[28] J. Black, A. Paez, and P. Suthanaya, “Sustainable urban 499-528, 2001.
transportation: performance indicators and some analytical [41] R. Kitamura, P. Mokhtarian, and L. Daidet, “A micro-analysis of
approaches”, J. Urban Plann. Dev., vol. 128, no. 1, pp. 184-209, land use and travel in five neighbourhoods in the San Francisco
2002. Bay Area”, Transportation, vol. 24, no. 2, pp. 125-158, 1997.
[29] D. Greene, and M.Wegener, “Sustainable transport”, J. Trans [42] J. Holtzclaw, R. Clear, H. Dittmar, D. Goldstein, and P. Haas,
Geogr., vol. 5, no. 3, vol. 177-190, 1997. “Location efficiency: neighbourhood and socio-economic
[30] Y. Duvarci, and T. Yigitcanlar, “Integrated modelling approach for characteristics determine auto ownership and use-studies in
the transportation disadvantaged”, J. Urban Plann. Dev., vol. 133, Chicago, Los Angeles and San Francisco”, Transp. Plann.
no. 3, pp. 188-200, 2007. Technol., vol. 25, no. 1, pp. 1-27, 2002.
[31] J. Schmocker, M. Quddus, R. Noland, and M. Bell, “Estimating trip [43] H. Meurs, and R. Haaijer, “Spatial structure and mobility”, Transp.
generation of elderly and disabled people”, Transp. Res. Board, Res. Part D, vol. 6, no. 6, pp. 429-446, 2001.
vol. 1924, no. 1, pp. 9-18, 2005. [44] Y. Susilo, and K. Maat, “The influence of built environment to the
[32] D. Ory, and P. Mokhtarian, “When is getting there half the fun?”, trends in commuting journeys in the Netherlands”, Transportation,
Transport. Res. A, vol. 39, no. 1, pp. 97-123, 2005. vol. 34, no. 5, pp. 589-609, 2007.
[33] D. Denmark, “The outsiders: planning and transport disadvantage”, [45] F. Dieleman, M. Dijst, and G. Burghouwt, “Urban form and travel
J. Plann. Educ. and Res., vol. 17, no. 3, pp. 231-240, 1998. behaviour: micro-level household attributes and residential
[34] R. Cervero, and K. Kockelman, “Travel demand and the 3Ds: context”, Urban Stud., vol. 39, no. 3, pp. 507-527, 2002.
density, diversity, and design”, Transp. Res. Part D, vol. 2, no. 3, [46] P. Naess, “Accessibility, activity participation and location of
pp. 199-219, 1997. activities: exploring the links between residential location and
[35] S. Schonfelder, and K. Axhausen, “Activity spaces”, Transp. travel behaviour”, Urban Stud., vol. 43, no. 3, pp. 627-652, 2006.
Policy, vol. 10, no. 1, pp. 273-286, 2003. [47] R. Crane, and R. Crepeau, “Does neighbourhood design influence
[36] K. Lucas, Ed, Running on empty: transport, social exclusion and travel? A behavioural analysis of travel diary and GIS data”,
environmental justice: Policy Press: Bristol 2004 Transp. Res. Part D, vol. 3, no. 4, pp. 225-238, 1998.
[37] G. Currie, “Gap analysis of public transport needs: measuring [48] R. Cervero, and R. Gorham, “Commuting in transit versus
spatial distribution of public transport needs and identifying gaps in automobile neighbourhoods”, J. Am Plann. Assoc., vol. 61, no. 2,
the quality of public transport provision”, Transp. Res. Record, vol. pp. 210-225, 1995.
1402, no. 1, pp. 137-146, 2004. [49] J. Hine, and M. Grieco, “Scatters and clusters in time and space:
[38] W. Anderson, “Urban form, energy and the environment: a review implications for delivering integrated and inclusive transport”,
of issues, evidence and policy”, Urban Stud., vol. 33, no. 1, pp. 7- Trans. J., vol. 10, no. 1, pp. 299-306, 2003.
36, 1996.
Received: September 21, 2009 Revised: December 3, 2009 Accepted: December 15, 2009
© Yigitcanlar et al.; Licensee Bentham Open.
This is an open access article licensed under the terms of the Creative Commons Attribution Non-Commercial License (http://creativecommons.org/licenses/by-
nc/3.0/) which permits unrestricted, non-commercial use, distribution and reproduction in any medium, provided the work is properly cited.You can also read