How Can Cities Respond to Flood Disaster Risks under Multi-Scenario Simulation? A Case Study of Xiamen, China - MDPI
←
→
Page content transcription
If your browser does not render page correctly, please read the page content below
International Journal of
Environmental Research
and Public Health
Article
How Can Cities Respond to Flood Disaster Risks
under Multi-Scenario Simulation? A Case Study of
Xiamen, China
Yijun Shi 1, * , Guofang Zhai 2, *, Shutian Zhou 2 , Yuwen Lu 2 , Wei Chen 3 and Jinyang Deng 4
1 School of Landscape Architecture, Zhejiang A&F University, Hangzhou 311300, China
2 School of Architecture and Urban Planning, Nanjing University, Nanjing 210093, China;
shutian_zhou@smail.nju.edu.cn (S.Z.); yuwen_lu@smail.nju.edu.cn (Y.L.)
3 School of Geography and Ocean Sciences, Nanjing University, Nanjing 210093, China; chenw.nju@gmail.com
4 School of Natural Resources, West Virginia University, Morgantown, WV 26506, USA;
jinyang.deng@mail.wvu.edu
* Correspondence: yijun_shi@zafu.edu.cn or yijun_shi@smail.nju.edu.cn (Y.S.);
guofang_zhai@nju.edu.cn (G.Z.)
Received: 24 December 2018; Accepted: 18 February 2019; Published: 20 February 2019
Abstract: Flood disasters often have serious impacts on cities. Disaster prevention and mitigation
schemes for flood disasters must be based on risk assessment. We constructed an indicator system
for flood disaster risk assessment from the aspects of hazard factors, sensitivity to the environment,
disaster vulnerability, flood disaster prevention, and resilience. Then we add the precipitation factor
as a scenario parameter to the assessment of flood disasters, in order to assess the flood disaster
risk under annual average precipitation scenarios, multi-year flood season average precipitation
scenarios, and large typhoon precipitation scenarios. Xiamen is one of the cities with more serious
flood disasters. We select Xiamen as an example and refer to existing indicators of flood disaster
assessment. The results show that: (1) the coefficient of variation of flood disasters in Xiamen under
the impact of large-scale typhoon precipitation is large; (2) the drainage and flood control capacity of
Xiamen is generally insufficient, and the risk in the old city is high; (3) there are many flood-prone
locations in Xiamen. Underpass interchanges, underground spaces, and urban villages have become
the new key areas for flood control; and (4) the flood risk in the northern mountainous areas of
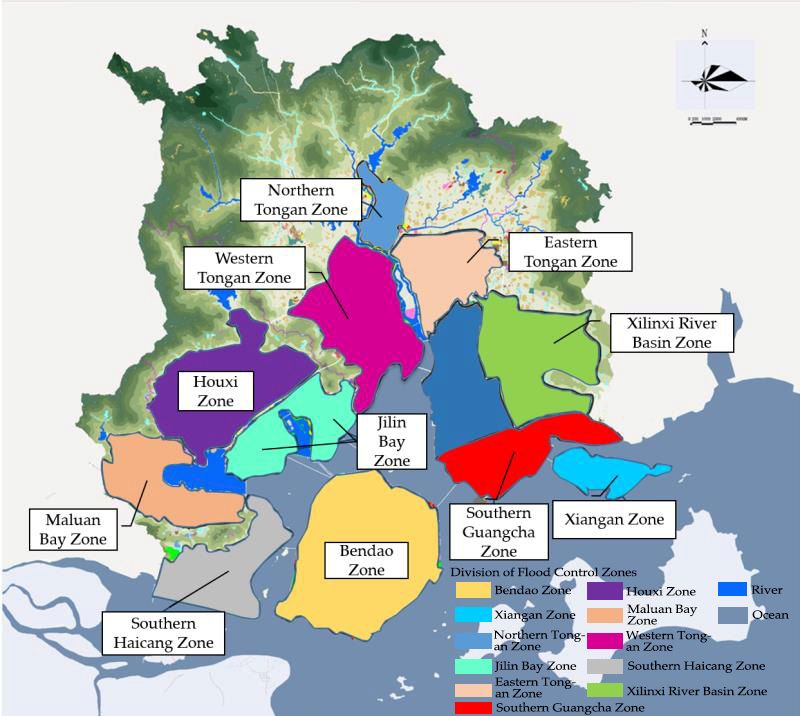
Xiamen is the highest. Based on the assessment results, we further delineate the urban flood control
zones and propose corresponding countermeasures. The study expands the research on flood disaster
risk assessment, and also provides reference for relevant cities to deal with flood disasters.
Keywords: flood disaster; risk assessment; multi-scenario simulation; response strategies;
Xiamen city
1. Introduction
As the main body of human social activities, cities have always suffered from various types of
disasters, especially natural disasters have caused very large losses to human society. According
to the International Emergency Disaster Database (EMDAT) [1], from 1900 to 2017, the world has
suffered 12,547 major natural disasters with a total of 22,989,400 deaths and economic losses of up to
$290.28 billion. Among these disasters, the flood disaster occurred the most frequently, resulting in the
highest number of deaths and economic losses. It can be said that flood disaster is one of the most
serious natural disasters affecting human society [2]. For example, in 2012, Hurricane Sandy caused
widespread flooding of road networks along the coast of New York City, where firefighting vehicles
could not reach fire sites and 122 houses were burned. In 2017, Hurricane Irma hit Florida, resulting
Int. J. Environ. Res. Public Health 2019, 16, 618; doi:10.3390/ijerph16040618 www.mdpi.com/journal/ijerph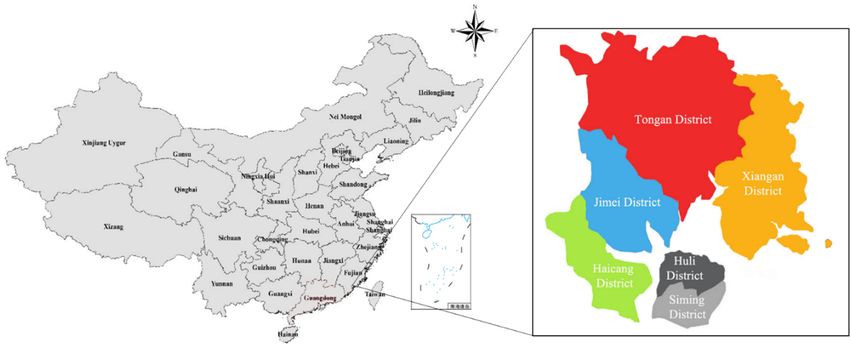
Int. J. Environ. Res. Public Health 2019, 16, 618                                                    2 of 18

in 123 deaths in the state, including 14 from a local nursing home. The hurricane has also caused
large-scale rescue interruptions and power outages [1]. On 13 June 2018, Shenzhen, China, recorded its
historically greatest rainfall, which caused serious floods with tremendous economic losses. Six people
were killed, and more than 20,000 people were forced to evacuate [3].
     As one type of natural disasters, urban flood disasters are often caused by a short-term heavy
rainfall or a long-term precipitation that accumulates a massive amount of water that cannot be easily
drained in time. Flood disaster often cause serious disruptions to cities, including loss of life, damage
to property, and destruction of public infrastructures, which usually cause serious environmental
pollution and more negative social impacts. Urban flood disaster is a complex problem, so the
flood control and disaster mitigation plan must be based on the flood disaster risk assessment [4].
Flood disaster risk assessment is one of the most effective ways to reduce flood occurrence and
disaster losses [5], and it is also the key technical support for urban disaster prevention and mitigation
assessment decision [6], and thus has become one of the hotspots that draws increasing attention from
researchers. Understanding the features of flood disasters helps us to understand the causes of flood
disasters. Therefore, finding an appropriate method to assess flood risk is the premise of flood risk
management. This paper aims to establish an applicable model to assess urban flood disaster risk for
achieving an optimal outcome. A scientific understanding of urban flood disasters will allow us to plan
in advance of the urban planning and construction, and minimize the damage caused by the disaster.
     Our paper offers three main contributions. First, we factor precipitations a scenario parameter into
the assessment of flood risk to obtain the results of flood disaster risk under multi-scenario simulations.
Secondly, we combine the historical flood disaster data with the flood disaster risks under different
scenarios to analyze the location points of flood disasters. Finally, based on the simulation results,
we delineate the urban flood control zones and propose corresponding countermeasures.
     The rest of the paper is organized as follows. In Section 2, we review the current indicators and
methods for assessing flood disaster risk. In Section 3, we introduce the study area and methods used
in this study. In Section 4, we use Xiamen as an example and assess the flood disaster risk under
different scenarios. On this basis, we combine with the historical floods locations in Xiamen, and obtain
the locations that are prone to flood disaster under different scenarios. In Section 5, based on main
research findings, we propose the flood control zones as well as relevant planning response strategies
of Xiamen. In Section 6, we draw the main conclusions.

2. Literature Review
     The flood disaster assessment mainly consists of two aspects: flood disaster risk assessment
(FDRA) and flood disaster damage assessment (FDDA) [7]. The FDRA mainly focuses on the
quantitative analysis of the causes, probability and intensity of flood disaster [8–11]. Different scales
of precipitation may generate different flood risks. Through FDRA, we can clearly understand the
level and spatial distribution of flood disaster risk, so that we can effectively manage and control the
flood risks. The FDDA is to quantitatively analyze the loss of life, damage to property, and impacts
on social economy or the environment caused by flood disaster [12–14]. In recent years, scholars
have gradually realized that flood disaster should be analyzed from the perspective of risk, and flood
disasters risk research is gradually developing from traditional disaster prediction to disaster risk
analysis. An examination of the existing research progress of FDRA shows that the FDRA methods
have evolved from the macro level to the micro level, from a focus on the cause mechanism of the
disaster to the application of the disaster statistics, and from the construction of the floods indicator
system to multi-scenario simulations [15]. FDRA methods, according to the development stages of
methods, can be summarized as mathematical statistics method [16], index system method [17,18],
simulation analysis method [19–21] and spatial analysis method [22,23].
     The mathematical statistics method is mainly utilized on the basis of historical disasters data in the
study area. Through statistical analyses involving the frequency of disaster occurrences, and the area
and population affected, the pattern of disasters occurrence can be found, and the relationship between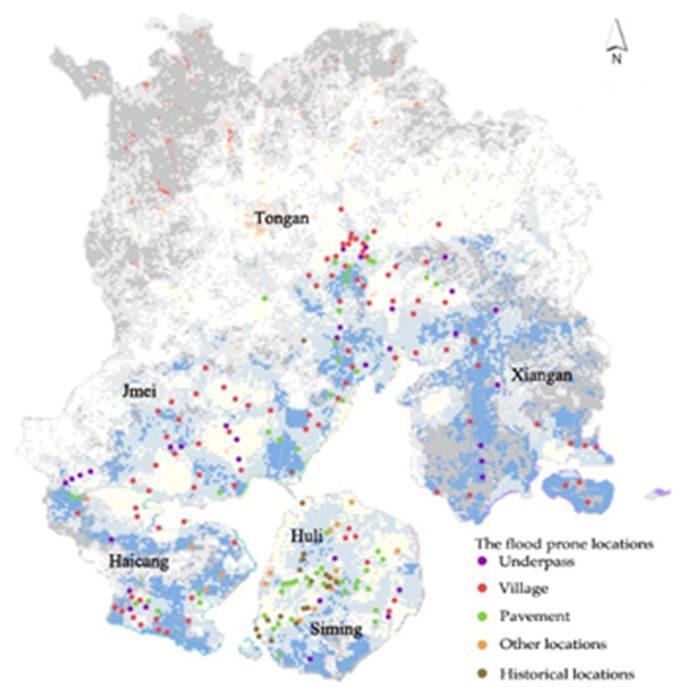
Int. J. Environ. Res. Public Health 2019, 16, 618                                                     3 of 18

the probability of disasters occurrence and associated factors can be established, so that the disasters
risk can be evaluated in advance. Therefore, this method is also called historical disaster probability
statistics method. Benito et al. [24] used historical floods data and a combination of geology, history,
statistics and other multidisciplinary approaches to assess flood risk. Nott [25] proposed the long-term
sequence of floods data as the basis for flood risk assessment in a regional scale. Qin and Jiang [26]
used historical flood data to analyze the risks of flood disaster in the lower reaches of the Yangtze
River in China. Huang et al. [27] conducted disaster damage assessment based on long-term disaster
data. Liu and Shi [28] proposed a regional flood risk assessment method based on the historical data
of the Yangtze River Basin. Mathematical statistics method is a simplified method, which is mainly
based on historical disaster probability statistics in the process of calculation, and it does not require
background data (e.g., such as topography, landform, and water system), and can be calculated based
on statistics of historical data. However, due to the lack of availability and quantifiability of statistical
data, this method often encounters fewer samples and incomplete sample content in the calculation
process. This may lead to results being less reliable or robust. Moreover, the results calculated by this
method may also be divergent from the actual situation, or even be inconsistent with the reality [29].
      The index system method is a static analysis method. The principle of this method is to select
certain indicators based on the characteristics of disasters, and then process the raw data through
mathematical methods to obtain the probability of disaster risks for the study area. This method is
also known as the comprehensive evaluation method [30]. For flood disasters, researchers usually
select precipitation, river network, elevation, population, economy, and infrastructure as indicators.
Through mathematical evaluation methods, the risk of flood disaster in an area is assessed from the
perspectives of the risk of the hazard factors, the sensitivity of the environment, the vulnerability and
vulnerability of the hazard [31,32]. The mathematical methods used most commonly in the calculation
process of indicator system methods mainly include the fuzzy comprehensive evaluation method,
the grey relational analysis method, the analytic hierarchy process and the principal component
analysis method. The main difference between these methods lies in the use of different criteria for
determining the weights of selected indicator. Common weight determination methods include the
principal component analysis method, the analytic hierarchy process method and the entropy weight
method. The analytic hierarchy process method is subjective, and its calculation results are easily
influenced by the randomness in the evaluation process and the subjective uncertainty and cognitive
ambiguity of the evaluation experts. The entropy method and the principal component method
are relatively objective. However, the principal component method may result in the loss of more
information lost during the calculation process. Since the indicator system method can reflect the flood
disaster risk on a macro scale, it has been widely used in disaster risk analysis and assessment [32].
      The scenario analysis method is to propose various key hypotheses based on the current situation
of disasters, and then to construct or modify relevant mathematical models by constructing algorithm
models and developing related software models to simulate urban flooding processes [33]. Based on
different parameter values, we can construct different flood disaster scenarios for specific evaluation
and analysis. With the development of computer technology, the scenario analysis method based on
algorithm and software analysis has become one of the main method to study the risk of urban flood
disaster. Thus far, a variety of urban flood disaster simulation models have been formed. Of these
models, the storm water management model (SWMM) developed by the U.S. Environmental Protection
Agency, the MIKE series model developed by the Danish DHI Hydraulic Research Institute and the
InfoWorks software developed by the National Institute of Wallingford in the UK are widely used [34].
The construction or revision of hydrological and hydrodynamic models is the key to the simulation
of urban flood disaster. Some researchers simulate urban flooding processes by constructing new
models or improving existing models [35,36]. By establishing relevant mathematical models, it is the
mainstream research method to simulate the flood disaster and the disaster losses [37–39]. The flood
risk assessment based on multi-scenario analyses can better reveal the spatial and temporal changes in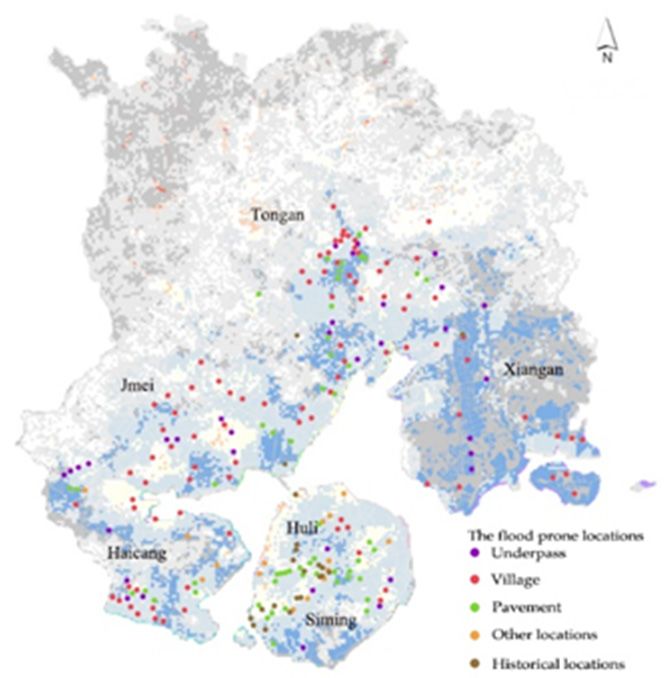
Int. J. Environ. Res. Public Health 2019, 16, 618                                                    4 of 18

flood evolution, and to some extent reflect the physical processes and mechanisms of flood disasters.
However, this method lacks system reliability and pays less attention to the analysis of risk levels.
     The spatial analysis method uses the digital terrain technology and spatial analysis function of
geographic information system (GIS) software to determine the risk of the water accumulation area
and flood disaster. The method takes the principle of water flowing from high pressure to low pressure
as the basis for calculation. Since floods have gravitational characteristics of flowing from high to low,
so spatial simulations on flooding often rely on the digital elevation model (DEM). Abdalla et al. [40]
used GIS, DEM and fuzzy evaluation methods to assess the flood disaster risk and classify flood
risk levels in the Red River region of Southern Canada. Santha [41] established a flood disaster
assessment model that is suitable for the coastal areas of India. Liu et al. [42] constructed a flood
disaster assessment model of the Bowen Basin in Australia using GIS, which directly reflect the floods
situation and can be used for real-time monitoring of flood disaster. However, due to its simulation
range being too wide, it is difficult to obtain high-precision risk assessment results.
     From the existing research on the flood risk assessment, the index system method is still the most
commonly used method so far, and it is also a relatively comprehensive method to systematically
assess the risk of flood disasters [43]. At the same time, in order to overcome the shortcomings of a
single method, a series of comprehensive methods such as multi-model collection and multi-model
comparison analysis emerged as one of the most effective approaches for flood disaster risk analysis.
For example, in order to solve the spatial and temporal heterogeneity of flood disaster risk, a spatial
comprehensive analysis method based on the combination of flood evolution hydrodynamic model,
remote sensing (RS) and GIS software are used [44]. Taking Xiamen as an example and referring
to the existing indicators for flood disaster assessment, we construct an index system for the risk
assessment of flood disaster in Xiamen. In the meanwhile, we propose to add multiple scenario
factors as parameter factors to the assessment of flood disaster in Xiamen under different scenarios.
Based on the results of the assessment, we further propose the division of flood control zones and
the corresponding coping strategies. In addition, considering that the measurement units of various
indicators of flood disaster risk assessment are not uniform, in order to solve the homogenization
problem of different quality indicators relatively objectively, we use the entropy method to determine
the weight of different evaluation indicators. On the one hand, this research verifies the scientificity
and feasibility of the methods constructed in this paper. On the other hand, it also serves an example
for the flood risk assessment for other similar cities.

3. Materials and Methods

3.1. Overview of the Study Area
     Xiamen City is located in the southeast coast of Fujian Province in China (see Figure 1). It is the
main central city and port city in the southeastern coastal areas of China. In 2017, the resident
population of Xiamen was 4.01 million, the urbanization rate reached 89.1% and its GDP was
435.18 billion CNY (approximately $64.95 billion (using the rate 1 to 6.7, estimated)) [45]. Affected by
hazard factors, such as climate, topography, and water system, flood disasters have always been one of
the major disasters affecting Xiamen. Xiamen features a typical coastal hilly landform. Topographically,
Xiamen is dominated by hills, especially in the central part of it. The terrain outside the island descends
from the northwest to the southeast and forms a ladder-like landscape of hills and mountains, terraces,
and plains. Xiamen has a subtropical maritime monsoon climate with an average annual rainfall of
1388 mm. Affected by topography, the annual precipitation shows an overall trend that decreases from
southeast to northwest with a high variability across seasons and locations.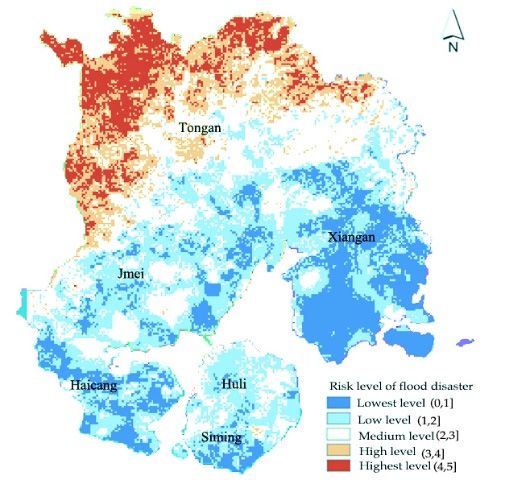
Int. J. Environ. Res. Res.
Int. J. Environ. Public Health
Public 2019,
Health 16,16,
2019, 618x 5 of 195 of 18
Figure 1. The administrative division map of Xiamen
Figure 1. The administrative division map of Xiamen
Typhoons are the main source of flooding to the city. Since 1949, large-scale typhoons have caused
Typhoons are the main source of flooding to the city. Since 1949, large-scale typhoons have
the five most
caused theserious floods
five most in floods
serious Xiamen’s historyhistory
in Xiamen’s with serious casualties
with serious andand
casualties economic
economiclosses.
losses.Flood
disasters in Xiamen mainly occurred in the flood season (May to October of each year),
Flood disasters in Xiamen mainly occurred in the flood season (May to October of each year), which which peaked
in September.
peaked in September. In recent years, with the continuous construction and improvement of urbanwater
In recent years, with the continuous construction and improvement of urban
conservancy facilities and
water conservancy increasing
facilities enforcement
and increasing of flood
enforcement ofcontrol standards,
flood control Xiamen’s
standards, ability
Xiamen’s to resist
ability
floodsto has
resist
beenfloods has strengthened.
largely been largely strengthened.
However, the However, the threatened
city is still city is still by
threatened
extremeby extreme
weather.
weather.
3.2. Methods
3.2. Methods
The FDRA refers to the analysis of the possibility and consequences of flood disasters based
The FDRA refers to the analysis of the possibility and consequences of flood disasters based on
on the risk theory, which provides a basis for the development of urban flood control and related
the risk theory, which provides a basis for the development of urban flood control and related
planning activities. This paper mainly draws on the theory of natural disaster risk in constructing the
planning activities. This paper mainly draws on the theory of natural disaster risk in constructing the
method of flood
method disaster
of flood analysis
disaster analysisand
andassessment, andevaluate
assessment, and evaluate thethe disaster
disaster riskrisk
fromfrom
four four aspects:
aspects:
risk, risk,
sensitivity,
sensitivity, vulnerability, and disaster prevention and mitigation ability [43]. At the same time, time,
vulnerability, and disaster prevention and mitigation ability [43]. At the same
givengiven
the precipitation
the precipitationas as
thethemain
maintrigger
trigger of
of the flooddisaster,
the flood disaster,wewe useuse
thisthis factor
factor as scenario
as the the scenario
parameter to estimate
parameter thethe
to estimate flood
flooddisaster
disasterrisk
risk under differentprecipitation
under different precipitation scenarios.
scenarios. Considering
Considering the the
difference of the precipitation conditions, we constructed three precipitation scenarios:
difference of the precipitation conditions, we constructed three precipitation scenarios: annual average annual
average precipitation,
precipitation, mean precipitation
mean precipitation during
during flood flood season,
season, and precipitation
and precipitation during during
the the typhoon
typhoon season.
season. Based on these three precipitation scenarios, we have further obtained
Based on these three precipitation scenarios, we have further obtained three assessment results of three assessment
results of flood disaster risk with GIS software. The specific research methods are as follows:
flood disaster risk with GIS software. The specific research methods are as follows:
3.2.1. Index System
3.2.1. Index System
Generally speaking, FDRA mainly involves four aspects: hazard of disaster factors, sensitivity
Generally
to environment,speaking, FDRA mainly
vulnerability of the involves four aspects:
disaster-bearing body, andhazard
the of disaster
city’s factors,
disaster sensitivity
prevention
to environment, vulnerability
capability [46,47]. Specifically,ofthe
thehazard
disaster-bearing body, mainly
of disaster factors and the city’sthe
reflects disaster
intensityprevention
and
capability [46,47].
frequency Specifically,
of disaster the hazard
occurrences. of disaster
Considering factors
the causes ofmainly reflects in
flood disasters, thethis
intensity
paper, weand frequency
mainly
of disaster
choose occurrences.
several mainConsidering the causes
factors, including of flood disasters,
precipitation, reservoir indistribution,
this paper, we and mainly
capacity.choose
Environmental
several main factors, sensitivity
includingrefers to the difficulty
precipitation, and probability
reservoir of environmental
distribution, and capacity. problems in the
Environmental
ecological
sensitivity environment
refers when encountering
to the difficulty interference.
and probability Sensitivity to the problems
of environmental environment inofthe
the ecological
flood
disaster is relates to the geographical environment, geological conditions, and
environment when encountering interference. Sensitivity to the environment of the flood disaster is climatic conditions,
etc. (e.g., in this paper, the elevation, slope, cultivated area, and river network density are selected).
relates to the geographical environment, geological conditions, and climatic conditions, etc. (e.g., in this
The vulnerability of the disaster-bearing body refers to the entities affected, where in the population
paper, the elevation, slope, cultivated area, and river network density are selected). The vulnerability
size, economic development level and the building quality of the city can reflect the vulnerability of
of thethedisaster-bearing body refers to the entities affected, where in the population size, economic
city. Keeping the disaster prevention ability and disaster level constant, a city with a higher
development level and
population density would the building
be morequality
likely toofsuffer
the city can
more reflect the
casualties. vulnerability
Likewise, of the
a city with city.level
a high Keeping
the disaster prevention ability and disaster level constant, a city with a higher population density
would be more likely to suffer more casualties. Likewise, a city with a high level of economic
development would be more likely to be seriously affected economically. In this paper, when assessing
the vulnerability of the disaster-bearing body for flood disasters, we also selected three indicators: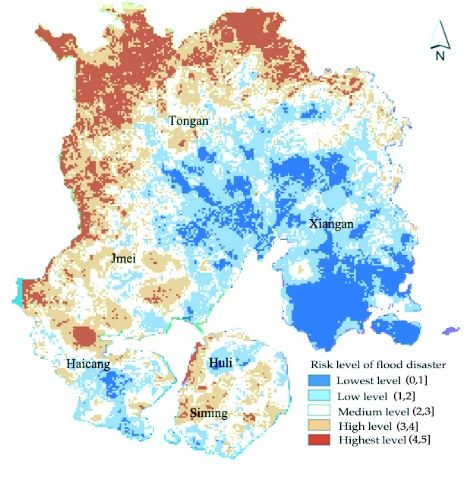
Int. J. Environ. Res. Public Health 2019, 16, 618                                                                                6 of 18

population vulnerability, economic vulnerability and building vulnerability. Finally, the city’s disaster
prevention capability is judged based on the construction and distribution of evacuation sites, urban
rescue capabilities, and emergency management capabilities. For flood disasters, the city’s disaster
prevention capabilities are mainly reflected in rainwater pipe network density, road network density
and urbanization level [47]. In this paper, two indicators—urbanization level and road network
density—are selected to assess the urban comprehensive response capacity. On the one hand, these
two indicators directly determine the strength of the city’s ability to respond to disasters. On the
other hand, the level of urbanization also indirectly or directly affects the government’s investment in
infrastructure such as flood control and flood prevention, and further affects the overall strength of the
city’s disaster prevention and mitigation capabilities.
      When constructing the index system of FDRA in Xiamen, we also take into account these four
aspects and use the entropy weight method to assign weights to all factors. The specific index system
and weight values are as follows (see Table 1).

                          Table 1. Index system for evaluating the flood disaster risk of Xiamen.

          Category                  Sub-Category            Explanation 1,2                                 Attribute   Weight
                                                            Annual average precipitation, mean
                                    Precipitation factor    precipitation during flood season and           Positive    0.1786
          Hazard of disaster                                precipitation during typhoon (unit: mm)
          factors
                                                            Distance to the river (unit: m) and reservoir
                                    Flood factor                                                            Positive    0.0815
                                                            storage capacity (unit: m3 )
                                    Terrain factor          Elevation (unit: m) and slope (unit: degree)    Positive    0.1538
          Sensitivity to the        Land factor             The proportion of cultivated land (unit: %)     Negative    0.0393
          environment
                                    River network
                                                            River network density (unit: %)                 Positive    0.0949
                                    factor
                                    Population
                                                            Population density (unit: %)                    Positive    0.0387
                                    vulnerability
          Vulnerability of the      Economic
          disaster-bearing body                             Per capita GDP (unit: CNY)                      Positive    0.0274
                                    vulnerability
                                    Building                Building quality (unit: null) and
                                                                                                            Positive    0.0531
                                    vulnerability           architectural age (unit: year)
                                    Flood control
                                                            Rainwater pipe network density (unit: %)        Negative    0.1762
          Disaster prevention       capacity
          and resilience            Comprehensive           Urbanization level (unit: %) and road
                                                                                                            Negative    0.1564
                                    response ability        network density (unit: %)
      1 Data sources: The economic, population, and other data involved in this paper are from Xiamen Statistical
      Yearbook and Xiamen City Economic Census Data. Data on precipitation, floods, and typhoons are collected
      from the Xiamen Meteorological Bureau, the Oceanic Administration, and the Emergency Office. The relevant
      data on land and topography are from the Xiamen Municipal Bureau of Land and Resources and the Earthquake
      Administration. The relevant data of the road network and other municipalities come from the Xiamen Municipal
      Transportation Bureau, the Housing Construction Bureau, and the Statistical Yearbook. 2 Note: In parentheses are
      the units of each indicator.

     It should be noted that the units and attributes of selected indicators are different, which need to
be standardized for calculation. There are two types of attributes in the index system: positive index vs.
negative index. If the index value is larger, the measured risk level value is larger, then such indicators
are referred to as the positive index. Otherwise, they are called the negative index.
     The normalized formula for the positive index:

                                                              ai − { amin }
                                                    Ai =                       × 100,                                               (1)
                                                           { amax } − { amin }

      The normalized formula for the negative index:

                                                              { amax } − ai
                                                    Ai =                       × 100,                                               (2)
                                                           { amax } − { amin }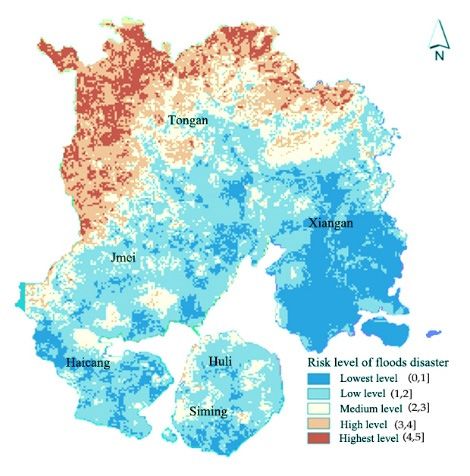
Int. J. Environ. Res. Public Health 2019, 16, 618 7 of 18
{ amax } and { amin } are the minimum and maximum values of each evaluation index in all years.
3.2.2. Calculation of Indicator Weights
In order to reduce the subjective influence on the weight determination, we use the entropy
weight method to determine the weights of the evaluation indices. The entropy weight method has
the feature of strong objectivity. Compared with methods, the weights obtained by the entropy weight
method have higher precision and more objectivity, and can better reflect the influence of the evaluation
indicators on the results. The models are as follows [47]:
The original data form the matrix X:
···
X11 X Im
.. .. ,
X= . ... . (3)
Xn1 ··· Xnm
By normalizing the raw data, a new matrix Y is obtained:
···
Y11 YIm
.. .. ,
Y= . ... . (4)
Yn1 ··· Ynm
Then the entropy value is derived as:
e j = −k ∑ ∑ Pij ln Pij , (5)
t i
k = 1/ ln(t × n), (6)
Pij = Yij / ∑ Yij , (7)
The weight Wj is calculated based on the entropy value:
1 − ej
Wj = , (8)
∑m
j =1 1 − ej
where Xij is an element in matrix X, t is the number of years, m is the number of indicators, n is the
number of samples and ej is the entropy value.
3.2.3. Methods of Multi-Scenario Flood Risk Assessment
Based on the flood risk assessment indicators and calculated weights, the formula for the
assessment of flood disaster risk is defined as follows:
n
R= ∑i=1 Fi Wi , (9)
Taking into account that some of the indicators in the existing evaluation system (e.g., precipitation
factors) are used as the average, the results of the assessment reflect more of the disaster risk in most
states. Therefore, in this paper, we take the multi-scenario factors as parameter factors into the
assessment of flood disaster risk to assess the risk of urban flood disasters under different scenarios.
Then we make a correction to Equation (9):
n
R= ∑i=1 βθ Fi Wi , (10)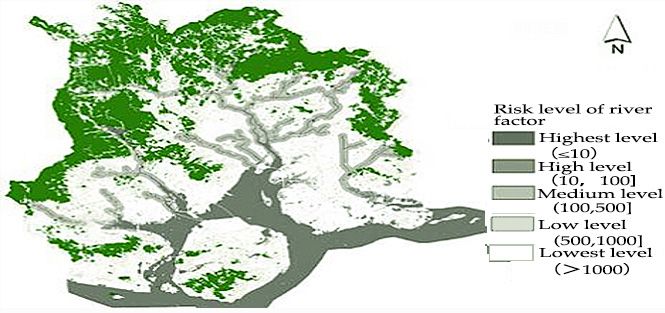
Int. J. Environ. Res. Public Health 2019, 16, 618 8 of 18
β θ = { β θ |θ = 1, 2, 3, . . . , m}, m ∈ N ∗ (11)
where β denotes the scenario parameters. In this paper, we consider that the flood disaster is mainly
affected by precipitation. Therefore, the precipitation factor is used as the scenario parameter to
estimate the flood disaster risk under three precipitation conditions. F represents each indicator factor.
W represents the weight of each indicator. R represents the risk of flood disaster.
Based on the comprehensive assessment results, we can grade the risk levels (Equation (12)) and
plan for different flood disaster risk zones. In our article, we mainly use the Natural Breaks method
to classify disaster risk levels. The Natural Breaks method is based on the natural grouping inherent
in the data. The classification interval is identified, the similarity values can be optimally grouped,
and the differences between the classes can be maximized:
V = {V1 , V2 , V3 , · · · , VN }, N ∈ N ∗, (12)
4. Results
4.1. Hazard Analysis of Disaster Factors
The flooding disaster factors are mainly considered from the perspectives of precipitation factors
Int. J. Environ. Res. Public Health 2019, 16, x 8 of 19
and flood factors. In the case of precipitation factors, we use the precipitation factor as the scenario
parameter, and4. Results
select three different precipitation scenarios (i.e., average annual precipitation, average
precipitation4.1.
duringHazardflood
Analysis season and
of Disaster precipitation during typhoon) to simulate the flood disaster risk
Factors
of Xiamen. (1) The average annual precipitation of Xiamen from 2005 to 2015 is selected to represent
The flooding disaster factors are mainly considered from the perspectives of precipitation factors
the situationandunder normal
flood factors. precipitation
In the conditions.
case of precipitation factors, we(2)use The average annual
the precipitation precipitation
factor as the scenario during
flood season parameter,
(May to October and select of three
each different
year) precipitation
in Xiamenscenarios
during (i.e., averageperiod
the same annual isprecipitation,
used to represent the
average precipitation during flood season and precipitation during typhoon) to simulate the flood
general disaster situation. (3) The precipitation during the period of large typhoon (i.e., the Meranti
disaster risk of Xiamen. (1) The average annual precipitation of Xiamen from 2005 to 2015 is selected
typhoon in this paper)the
to represent issituation
selected to represent
under a scenario
normal precipitation under
conditions. (2) extreme
The averagedisaster conditions. Through
annual precipitation
the analysis during
of theflood season (May to
precipitation dataOctober
from of each
the year)
Xiamen in Xiamen during the same
Meteorological period is from
Bulletin used to2005 to 2015,
represent the general disaster situation. (3) The precipitation during the period of large typhoon (i.e.,
we use GIS software to simulate different precipitation scenarios. It can be seen from the simulation
the Meranti typhoon in this paper) is selected to represent a scenario under extreme disaster
results (see Figure
conditions. 2) Through
that thetheaverageanalysis of annual precipitation
the precipitation data fromand the average
the Xiamen precipitation
Meteorological Bulletin during the
flood seasonfromshow 2005ato 2015, we
trend of use GIS software
decreasing to simulate
from different precipitation
the northwest scenarios. It can
to the southeast, andbetheseenprecipitation
from the simulation results (see Figure 2) that the average annual precipitation and the average
under the typhoon scene is obviously affected by the typhoon path. From the spatial distribution of
precipitation during the flood season show a trend of decreasing from the northwest to the southeast,
precipitation,and
thetherainfall levelunder
precipitation under the the typhoon
typhoon scene isscenario
obviously is the highest,
affected and the
by the typhoon path.precipitation
From the in most
areas exceedsspatial distribution
the highest of precipitation,in
precipitation thescenario
rainfall level underscenario
1 and the typhoon 2. scenario is the highest, and
the precipitation in most areas exceeds the highest precipitation in scenario 1 and scenario 2.
(a) (c)
(b)
Figure 2. Simulation
Figure 2. Simulation of precipitation
of precipitation in different scenarios
in different scenarios in Xiamen: (a) precipitation
in Xiamen: simulation simulation
(a) precipitation
under multi-year average precipitation scenarios; (b) precipitation simulation under the flood season
under multi-year average precipitation scenarios; (b) precipitation simulation under the flood season
scenario; and (c) precipitation simulation under the typhoon transit scenario.
scenario; and (c) precipitation simulation under the typhoon transit scenario.
In terms of flood factors, two indicators are considered: reservoir storage capacity and distance
In termstooftheflood
river. In general,two
factors, the probability
indicators of aare
flood disaster in a certain
considered: reservoirarea depends
storagelargely on theand distance
capacity
distribution of river networks in the region. The closer the distance to the rivers and lakes, the higher
to the river. the
In risk
general,
of flood the probability
disaster would be. Atofthea same
flood disaster
time, the moreintheariver
certain areais,depends
water flow largely on the
the larger the
distribution of rivercapacity
reservoir networks inthe
is, thus the region.
greater The closer
the impact range inthe distance
the event to the
of a flood. rivers
In this paper,and lakes, the higher
the buffer
zones of
the risk of flood different would
disaster river networks
be. and
At reservoirs
the same aretime,
used tothe
demonstrate
more the the impact
riverofwater
river networks
flow is, the larger
on flood disaster. Different buffer widths represent the difficulty risk level affected by floods in
the reservoirdifferent
capacity is, thus
sections. From thethe greater
analysis the
results (seeimpact
Figure 3),range
the risk in the network
of river event inofthea dense
flood. In this paper,
areas
is significantly higher, and the risk in the coastal areas is higher than that in the inland areas.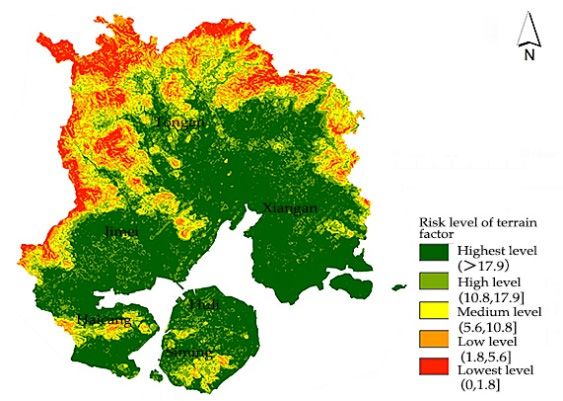
Int. J. Environ. Res. Public Health 2019, 16, 618 9 of 18
the buffer zones of different river networks and reservoirs are used to demonstrate the impact of river
networks on flood disaster. Different buffer widths represent the difficulty risk level affected by floods
in different sections. From the analysis results (see Figure 3), the risk of river network in the dense
areas is
Int.significantly higher,
J. Environ. Res. Public Healthand
2019,the
16, xrisk in the coastal areas is higher than that in the inland9 areas.
of 19
(a) (b)
3. Analysis
FigureFigure ofofflood
3. Analysis flood factors
factors ininXiamen:
Xiamen: (a) analysis
(a) analysis of riverofbuffers;
river and
buffers; and (b)
(b) analysis analysis of
of reservoir
buffers.
reservoir buffers.
4.2. Sensitivity Analysis
4.2. Sensitivity of the
Analysis Environment
of the Environment
The sensitivity
The sensitivity to environment
to environment of of the
the flooddisaster
flood disaster isis examined
examined from fromthree
three perspectives:
perspectives: landland
factor, topographic factor and river network factor. (1) Land factor: Different
factor, topographic factor and river network factor. (1) Land factor: Different types of land use affect types of land use affect
the natural
the natural waterwater regulation
regulation capacitycapacity
andand
thethe runoff
runoff ofofrainwater
rainwateron onthe
the surface
surface differently.
differently.The Thesoilsoil in
in the forest area has strong water seepage ability, and it is not easy to form stagnant water. The water
the forest area has strong water seepage ability, and it is not easy to form stagnant water. The water
seepage capacity of agricultural and forestry land is moderate. The ground surface of the urban built-
seepage capacity of agricultural and forestry land is moderate. The ground surface of the urban
up area is dominated by a hard surface and the water seepage capacity is the worst. However, on the
built-up
cityarea
scale,isitdominated
is relatively by a hard
difficult to surface
obtain the anddatatheonwater seepage surface
the impervious capacity of is
thethe worst.
road. This However,
paper
on theuses
citythescale, it is relatively
proportion of cultivated difficult
land is to
usedobtain the data
to indicate on the
the water impervious
seepage capacity surface
of the landof factor
the road.
This paper uses the
and obtain theevaluation
proportion of cultivated
results of the landland is used
factors. Fromto theindicate
assessmentthe results
water (seeseepage
Figurecapacity
4), we of
the land
canfactor andthe
find that obtain
land in thetheevaluation
downtownresults
area ofof the land
Xiamen hasfactors.
the worst From
water the assessment
seepage results
capacity. As a (see
result, the risk is higher than that in several areas outside the
Figure 4), we can find that the land in the downtown area of Xiamen has the worst water seepage central city. (2) Terrain factor: The
terrain of Xiamen is dominated by plains, terraces, and hills, and the terrain
capacity. As a result, the risk is higher than that in several areas outside the central city. (2) Terrain slopes from the northwest
factor:toThe
the terrain
southeast. Mountainous
of Xiamen terrain affects
is dominated local precipitation,
by plains, terraces, andand hills,inand
steeptheterrain,
terrainit slopes
is morefrom
susceptible to risks such as mudslides during torrential rains. Based on the DEM data of Xiamen, the
the northwest to the southeast. Mountainous terrain affects local precipitation, and in steep terrain,
two factors of elevation and slope are superimposed and analyzed, and the analysis results of
it is more susceptible to risks such as mudslides during torrential rains. Based on the DEM data of
topographic factors are obtained. It can be seen from the evaluation results (see Figure 4) that the risk
Xiamen, the two factors
of topographic factorsofinelevation
Xiamen graduallyand slope are superimposed
decreases from the northwest and analyzed,
to the southeast.and the analysis
(3) River
resultsnetwork
of topographic
factor: Thefactors are obtained.
water system in Xiamen It is
can be seencomplicated.
relatively from the evaluation
The slope of results (see Figure
the tributaries of 4)
that the risk of topographic factors in Xiamen gradually decreases from the
the northern part of the mountain is large, the water is flooded quickly, the terrain in the southern northwest to the southeast.
(3) River
partnetwork
of the cityfactor:
is flat, The
and water system
the coastal in Xiamen
terrain is low. Inisview relatively
of this,complicated.
we carry out surfaceThe sloperunoffof the
simulation
tributaries of theand water flow
northern part length
of thecalculation
mountain forisXiamen.
large, theOn this
waterbasis, river network
is flooded extraction
quickly, and in
the terrain
river network
the southern part ofdensity
the city analysis
is flat,isandcarried
the out,
coastaland terrain
the Xiamen river
is low. Innetwork
view ofdensity
this, we map wasout
carry finally
surface
obtained (see Figure 4).
runoff simulation and water flow length calculation for Xiamen. On this basis, river network extraction
and river network density analysis is carried out, and the Xiamen river network density map was
finally obtained (see Figure 4).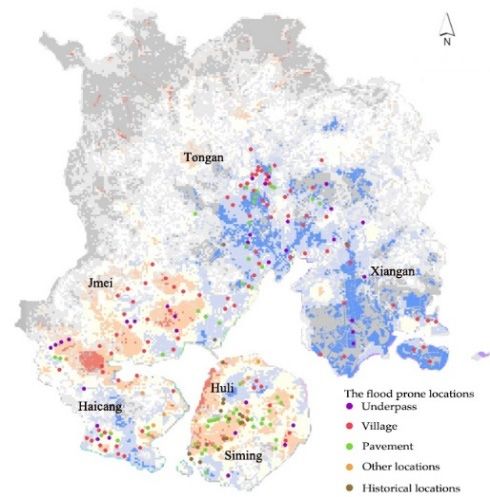
Int. J. Environ. Res. Public Health 2019, 16, 618 10 of 18
Int. J. Environ. Res. Public Health 2019, 16, x 10 of 19
Int. J. Environ. Res. Public Health 2019, 16, x 10 of 19
(a) (b) (c)
Figure 4. Sensitivity
Figure 4. Sensitivity analysis analysis
of theof the environment in
environment in Xiamen:
Xiamen: (a)(a)
analysis of land
analysis offactor;
land (b) analysis
factor; (b)ofanalysis of
topographic factor; and (c) analysis of river network factor.
topographic factor; and (c) analysis of river network factor.
4.3. Vulnerability
(a) ANALYSIS of the Disaster-Bearing
(b)Body (c)
4.3. Vulnerability ANALYSIS of the Disaster-Bearing Body
The vulnerability
Figure of the disaster-bearing
4. Sensitivity analysis of the environmentbody mainly
in Xiamen: (a)refers
analysistoofthe loss
land level(b)ofanalysis
factor; people’s
of lives
The vulnerability
andtopographic
property whenof thethe
factor; disaster-bearing
city
and (c)isanalysis
threatened body
a floodmainly
bynetwork
of river disaster.
factor. refers
It to the
is related loss
to the level ofofpeople’s
population the area, lives and
property when the city isofthreatened
the concentration property, and bythea flood disaster.
performance of the It is relatedHolding
building. to the other
population
conditions of the area,
4.3. Vulnerability
constant,
the concentration of ANALYSIS
an property,
area with aand of the
theDisaster-Bearing
greater population
performance Body
density,
of thehigher GDP perHolding
building. capita, and worse
other building constant,
conditions
quality is more likely to suffer serious damages from flooding. Therefore, in this paper, we consider
an area with aThe vulnerability
greater of the disaster-bearing
population density, higher body GDP mainly
perrefers
capita, to the
andloss
the vulnerability of the flood disaster risk from the perspectives of population vulnerability,
level of
worse people’s quality
building lives is more
and property when the city is threatened by a flood disaster. It is related to the population of the area,
likely to suffer serious damages from flooding. Therefore, in this paper,
economic vulnerability and building vulnerability. Specifically, four indicators are identified: we consider the vulnerability
the concentration of property, and the performance of the building. Holding other conditions
of the flood disaster
population
constant, riskwith
density,
an area from
GDP the
a greaterperspectives
per capita, buildingofquality
population density, population
higher GDPvulnerability,
per capita, and economic
and building age. As Figure vulnerability
5 indicates,
worse building
and buildingXiamen’s GDP per
vulnerability. capita, population density and building quality all exhibit a consistent pattern that
quality is more likely toSpecifically, four indicators
suffer serious damages are identified:
from flooding. Therefore, in this population density, GDP per
paper, we consider
increases from the north to the south. The central part of the city with the highest GDP, highest
the vulnerability
capita, building quality of the
and flood disaster
building age. AsriskFigure
from the5 perspectives
indicates, of population
Xiamen’s GDP vulnerability,
per capita, population
population density, and best building quality is most vulnerable to flooding.
economic vulnerability and building vulnerability. Specifically, four indicators are identified:
density and building quality all exhibit a consistent pattern that increases from the north to the south.
population density, GDP per capita, building quality and building age. As Figure 5 indicates,
The central part ofGDP
Xiamen’s theper
city withpopulation
capita, the highest GDP,
density andhighest
building population
quality all exhibit density, and best
a consistent patternbuilding
that quality
is most vulnerable to flooding.
increases from the north to the south. The central part of the city with the highest GDP, highest
population density, and best building quality is most vulnerable to flooding.
(a) (b) (c)
Figure 5. Vulnerability analysis of disaster-bearing bodies in Xiamen: (a) analysis of economic
vulnerability; and (b) analysis of population vulnerability; (c) analysis of building vulnerability.
4.4. Analysis
(a) of the Disaster Prevention and Resilience
(b) (c)
Under5.the same disaster conditions, the flood control
bodiescapacity determines the magnitude
of economic of the
Figure 5.Figure Vulnerability
Vulnerability analysis
analysis of ofdisaster-bearing
disaster-bearing
bodiesin Xiamen: (a) analysis
in Xiamen: (a) analysis of economic
city’s losses in a flood
vulnerability; and (b)disaster.
analysis The higher the
of population city’s flood(c)
vulnerability; control capacity
analysis is, the
of building smaller the damage
vulnerability.
vulnerability; and (b) analysis of population vulnerability; (c) analysis of building
caused by flooding. The disaster prevention capability of flood disasters is mainly determined by two vulnerability.
4.4. Analysis
aspects: the of the Disaster
flood Prevention
control capacity andandthe
Resilience
comprehensive response capacity. The former refers to the
4.4. Analysis of the Disaster Prevention and Resilience
construction of disaster prevention infrastructures and drainage engineering measures, while the
Under the same disaster conditions, the flood control capacity determines the magnitude of the
Under latter
the refers
same to the city’sconditions,
ability to respond to disaster risks, which isdetermines
related to the urban socio-
city’s losses in adisaster
flood disaster. The higher thetheflood control
city’s flood capacity
control capacity is, the smallerthe the magnitude
damage of the
economic level and the level of municipal facilities. Due to the impact of infrastructure and economic
caused
city’s losses in abyflood
flooding. The disaster
disaster. The prevention
higher the capability
city’s of flood
flood disasterscapacity
control is mainly is,determined
the by twothe damage
smaller
level (From the economic level and infrastructure status of Xiamen City, the Siming District, and Huli
caused byaspects:
flooding.
District
the flood control capacity and the comprehensive response capacity. The former refers to the
Thecore
are the disaster prevention
urban areas of Xiamen. capability of flood
The economic leveldisasters is mainly
is the highest, and thedetermined
economic by two
construction of disaster prevention infrastructures and drainage engineering measures, while the
aspects: the flood
latter referscontrol capacity
to the city’s abilityand the comprehensive
to respond to disaster risks,response capacity.
which is related The
to the former
urban refers to the
socio-
construction of disaster
economic level and prevention infrastructures
the level of municipal facilities.and
Due drainage
to the impactengineering
of infrastructuremeasures, while the latter
and economic
levelcity’s
refers to the (From ability
the economic level and infrastructure
to respond to disaster risks, status ofwhich
XiamenisCity, the Siming
related District,
to the urban andsocio-economic
Huli
District are the core urban areas of Xiamen. The economic level is the highest, and the economic
level and the level of municipal facilities. Due to the impact of infrastructure and economic level (From
the economic level and infrastructure status of Xiamen City, the Siming District, and Huli District
are the core urban areas of Xiamen. The economic level is the highest, and the economic aggregate
accounts for more than 50% of Xiamen (from 2005 to 2015). Meanwhile, the infrastructure of these two
regions is relatively complete, and the investment in infrastructure assets accounts for more than 30%
of the city’s total investment in assets (from 2005 to 2015). The economic aggregates of Jimei District,Int. J. Environ. Res. Public Health 2019, 16, x 11 of 19
Int. J. Environ.accounts
aggregate Res. Publicfor
Health
more 16, 618
2019,than 50% 11 of 18
of Xiamen (from 2005 to 2015). Meanwhile, the infrastructure
of these two regions is relatively complete, and the investment in infrastructure assets accounts for
more than 30% of the city’s total investment in assets (from 2005 to 2015). The economic aggregates
Haishu District, Xiang’an District, and Tong’an District are relatively low, and the infrastructure level
of Jimei District, Haishu District, Xiang’an District, and Tong’an District are relatively low, and the
is relatively low compared with the first two districts), the central urban area of Xiamen has the
infrastructure level is relatively low compared with the first two districts), the central urban area of
strongest flood control and drainage capacity and comprehensive response capacity, while the disaster
Xiamen has the strongest flood control and drainage capacity and comprehensive response capacity,
prevention ability of Xiangan District and Tongan District in the urban fringe area is relatively weaker
while the disaster prevention ability of Xiangan District and Tongan District in the urban fringe area
(see Figure 6).
is relatively weaker (see Figure 6).
(a) (b)
Figure 6. Analysis of the disaster prevention of Xiamen: (a) analysis of the flood control capacity; and
(b) analysis
(b) analysis of
of the
the comprehensive
comprehensive response
responseability.
ability.
4.5.
4.5. Assessment
Assessment and
and Analysis
Analysis of
of Flood
Flood Disasters
Disasters under
under Different
Different Scenarios
Scenarios
As
As aforementioned,
aforementioned, this
this paper
paper constructs
constructs three
three flood
flood risk
risk assessment
assessment scenarios
scenarios using
using the
the
precipitation
precipitation as a scenario parameter, and analyzes the flood risk levels for Xiamen under the
as a scenario parameter, and analyzes the flood risk levels for Xiamen under the three
three
different
different precipitation
precipitation scenarios.
scenarios. Each
Each scenario
scenario is
is described
described below:
below:
• Flood risk assessment under the multi-year average annual precipitation scenario.
Flood risk assessment under the multi-year average annual precipitation scenario.
The average annual precipitation data of each site recorded in the Xiamen Meteorological Bulletin
from The
2005 average
to 2015 areannual precipitation
calculated, and thendata of each issite
GIS software usedrecorded
to simulatein the Xiamen
the flood Meteorological
disaster risk under
Bulletin from 2005 to 2015 are calculated, and then GIS software is used
the multi-year average annual precipitation scenario (see Figure 7). Under this scenario,to simulate the floodthe
disaster
areas
risk under
with higherthe multi-year
flood levels in average
Xiamen annual precipitation
are mainly distributed scenario (see Figure
in the northern 7). Under this
mountainous scenario,
areas. This is
the areas
mainly due with higher
to the higherflood levels
terrain in Xiamen
in the north, thearelarge
mainly distributed
terrain in the
fluctuations, northern
and mountainous
the higher risk in the
areas. This is mainly due to the higher terrain in the north, the large terrain fluctuations,
areas with higher precipitation. In the built-up area, the terrain is relatively flat, and various types and theof
higher risk in the areas with higher precipitation. In the built-up area, the terrain is relatively
infrastructure are well-established. Therefore, the floods analysis level of this region is low. Overall, flat, and
variousthis
under types of infrastructure
scenario, the overall are well-established.
flood disaster risk in Therefore, the floodslow.
Xiamen is relatively analysis level of this region
is low. Overall, under this scenario, the overall flood disaster risk in Xiamen is relatively low.
• Flood risk assessment under the average precipitation scenario in flood season.
Flood
By riskthe
taking assessment under the average
average precipitation of eachprecipitation
site recordedscenario in flood Meteorological
in the Xiamen season. Bulletin
from By
2005 to 2015 in the flood seasons (May to October of each year), we obtain the
taking the average precipitation of each site recorded in the Xiamen Meteorological Bulletinfloods risk under
the average precipitation situation in Xiamen for many years (see Figure 7). Under
from 2005 to 2015 in the flood seasons (May to October of each year), we obtain the floods risk under this scenario,
the
the overall
averagerisk level of flood
precipitation disaster
situation in Xiamen
in Xiamen forhas
many increased compared
years (see with
Figure 7). scenario
Under 1. The areas
this scenario, the
with high-risk level are still in the northern mountainous areas, but the medium-risk
overall risk level of flood disaster in Xiamen has increased compared with scenario 1. The areas with areas in the
central andlevel
high-risk central
are urban
still inareas have increased
the northern significantly.
mountainous areas,Overall,
but the the flood risk level
medium-risk areasofinthe
thebuilt-up
central
area of Xiamen is still low, indicating that Xiamen can better cope with the flood threat
and central urban areas have increased significantly. Overall, the flood risk level of the built-up caused byarea
the
regular disasters.
of Xiamen is still low, indicating that Xiamen can better cope with the flood threat caused by the
•regular disasters.
Flood risk assessment under large typhoon precipitation scenarios.
According to the data in
Flood risk assessment the Xiamen
under Statistical
large typhoon Meteorological
precipitation Bulletin, during Typhoon Meranti
scenarios.
in 2016, there was a strong precipitation in Xiamen. The cumulative precipitation in the whole process
was 201.2 mm, which reached the magnitude of heavy storms. The typhoon caused serious casualtiesInt. J. Environ.
Int. J. Environ. Res. Public
Res. Public HealthHealth
2019,2019, 16, x
16, 618 12 of 19 12 of 18
According to the data in the Xiamen Statistical Meteorological Bulletin, during Typhoon Meranti
in 2016, there was
and direct economic a strong
losses. precipitation
Typhoon in Xiamen.
Meranti is theThe
mostcumulative
seriousprecipitation
typhoon ininXiamen’s
the whole process
history, and it
was 201.2 mm, which reached the magnitude of heavy storms. The typhoon caused serious casualties
is used to simulate the flood disaster risk of Xiamen under extreme precipitation (see Figure 7). It is
and direct economic losses. Typhoon Meranti is the most serious typhoon in Xiamen’s history, and it
found that, unlike
is used under
to simulate theScenario 1 and
flood disaster riskScenario
of Xiamen 2,under
the overall
extremeflood risk level
precipitation (see faced
Figure by
7). ItXiamen
is is
significantly
foundincreased,
that, unlikewhich
under is the inevitable
Scenario result2,ofthe
1 and Scenario theoverall
increased
flood risk
risk of hazard
level faced factors.
by Xiamen In isaddition,
results show that the
significantly risk level
increased, of flood
which is the disasters is the of
inevitable result highest in the central
the increased area, Haicang
risk of hazard factors. InDistrict,
addition, results show that the risk level of flood disasters is the
and Jimei District, which feature the highest economic development. On the one hand,highest in the central area, Haicang
it reflects the
District, and Jimei District, which feature the highest economic development. On the one hand, it
weakening of the original natural ecological adjustment capacity of the city due to the large-scale
reflects the weakening of the original natural ecological adjustment capacity of the city due to the
urbanization construction. On the other hand, it reflects that the existing infrastructure construction
large-scale urbanization construction. On the other hand, it reflects that the existing infrastructure
and fortification
constructionstandards in Xiamen
and fortification cannot
standards in cope
Xiamen with the cope
cannot floodwith
disaster caused
the flood by extreme
disaster caused byweather.
extreme weather.
(a) (b) (c)
Figure
Figure 7. Risk7. assessment
Risk assessment of flood
of flood disasters under
disasters under different
differentscenarios in Xiamen:
scenarios (a) assessment
in Xiamen: (a) assessment
results under
results under the average
the average annual
annual precipitation scenario;
precipitation scenario; (b)
(b)assessment
assessmentresults underunder
results the average
the average
precipitation during the flood season scenario; and (c) assessment results under the precipitation
precipitation during the flood season scenario; and (c) assessment results under the precipitation
during typhoon scenario.
during typhoon scenario.
By superimposing the flood risk results of the three precipitation scenarios with the flood
By disaster
superimposing the flood
data in history risk results
(The existing of the
disaster threerecords
database precipitation
the floodsscenarios withbuilt-up
in the urban the flood
areadisaster
data in history
of Xiamen (The
City.existing
Therefore, disaster database
the recorded floodrecords the floods
prone locations in the
are also urban built-up
distributed in urban area of Xiamen
built-up
City. Therefore, the recorded
areas. Meanwhile, flood
in this paper, prone
when locations
simulating are also
the flood pronedistributed in urban
locations in different built-up
scenarios, it areas.
is mainly targeted at urban built-up areas.), we further simulate the flood
Meanwhile, in this paper, when simulating the flood prone locations in different scenarios, it is prone locations in the urban
mainly built-up
targetedarea at of Xiamen under different precipitation scenarios. As shown in Figure 8, the flood prone
urban built-up areas.), we further simulate the flood prone locations in the urban
locations in Xiamen are mainly distributed within the urban built-up area, and the flood prone
built-uplocations
area ofdistributed
Xiamen under different precipitation scenarios. As shown in Figure 8, the flood
in the central urban area are more likely to occur than other areas. Areas such
prone locations
as underpassin Xiamen are mainly
interchanges, distributed
underground spaces within
and urban thevillages
urban havebuilt-up
becomearea,
newand the flood prone
distribution
locations distributed
areas in the central
for flood disasters. urban
In addition, area arethe
comparing more
floodlikely
prone to occur under
locations than other areas. Areas such
three precipitation
scenarios,
as underpass we can find that
interchanges, the flood disaster
underground spaces caused by large-scale
and urban villagestyphoon
have precipitation
become new is distribution
more
likely to occur than the other two scenarios. This is due to the large-scale
areas for flood disasters. In addition, comparing the flood prone locations under three precipitationtyphoon bringing short-
term heavy precipitation, and the planning and construction standards for the drainage network in
scenarios, we can find that the flood disaster caused by large-scale typhoon precipitation is more likely
Xiamen are generally low. In particular, some old urban areas (e.g., the old towns and the urban
to occurvillages
than the in other
Tongan two scenarios.
District ThisDistrict)
and Jimei is due still
to theuselarge-scale
rainwater and typhoon
sewagebringing
combined short-term
drainage heavy
precipitation,
system. and the planning
Rainwater pipes are and construction
generally designed and standards for according
constructed the drainageto thenetwork
labeling ofinone
Xiamen
to are
generallytwo low. In and
years, particular, somecapacity
the drainage old urban areas (e.g.,
is seriously the old
insufficient, townstoand
leading urbantheflood
urban villages in Tongan
disaster.
District and Jimei District) still use rainwater and sewage combined drainage system. Rainwater pipes
are generally designed and constructed according to the labeling of one to two years, and the drainage
capacity is seriously insufficient, leading to urban flood disaster.You can also read