A system-wide scenario analysis of large-scale corporate bond downgrades - An ESRB technical note July 2020
←
→
Page content transcription
If your browser does not render page correctly, please read the page content below
A system-wide scenario
analysis of large-scale
corporate bond
downgrades
An ESRB technical note
July 2020

Contents

1 Executive summary 2

2 Introduction 7

 2.1 Background and main goals of the analysis 7

 2.2 Caveats 8

 2.3 Overview of current holdings 9

3 Description of scenarios 13

 3.1 Transition matrices and yield shocks 13

 3.2 Behavioural and modelling assumption 16

4 Results 20

 4.1 Impact assessment of the scenarios 21

 4.2 Overlap analysis 33

5 Methodological annex 35

 5.1 Short-term transition matrices and historical maximum downgrades 35

 5.2 Estimation of transition matrices 36

 5.3 Estimation of the yield shocks on prices 39

 5.4 Estimation of price impacts from forced sales 39

6 References 41

Imprint and acknowledgements 43

A system-wide scenario analysis of large-scale corporate bond downgrades
Contents
 1
1 Executive summary

Background

The coronavirus (COVID-19) pandemic has inflicted a severe and unprecedented shock on the
economies of Europe and the world. Against this background, the General Board of the European
Systemic Risk Board (ESRB) decided at its meeting on 2 April 2020 to focus its attention on five
priority areas where coordination among authorities or across the EU is likely to be particularly
 1
important in order to safeguard financial stability. One of those five priority areas was the
procyclical impact that downgrades of corporate bonds might have on markets and entities across
the financial system.

 2
Following an issues note on the topic which describes the main issues , this report summarises the
findings of a top-down analysis that attempts to quantify the impact of a mass bond downgrade
scenario on the financial system. While the report focuses on European financial institutions when
considering the impact of forced bond sales, the estimates of forced sale volumes include global
(non-European) passive investment funds, given that sales of their holdings would also have an
impact on European institutions holding the same assets. The main focus is on the potential sales
of “fallen angels” (corporate bonds which were formerly investment grade but have been
downgraded to high yield) and covers only “plain vanilla” financial and non-financial corporate
bonds (thus excluding unrated financial and non-financial corporate bonds, sovereign bonds,
 3
securitisations and covered bonds, among others). The report uses data and models from the
European Supervisory Authorities (ESAs), the European Central Bank (ECB), the ESRB Secretariat
and the Bank of England. The results have not been validated in a bottom-up exercise involving
any individual financial institution.

Analysis

The report considers two scenarios that are characterised by an increasingly large percentage of
bonds being downgraded (see scenarios 1 and 2 in Table 5), both accompanied by the same
 4
severe yield shock. Using these two scenarios, the report then analyses (i) direct losses occurring
owing to increases in yields, (ii) the amount of forced sales of fallen angels that could potentially
result from these downgrades, and (iii) the possible extent of the price impact (and hence additional
losses) of these forced sales on all bond holders. The analysis applies three different behavioural
scenarios regarding how financial institutions might react, as well as two regimes of potential price

1
 See ESRB (2020a).
2
 See ESRB (2020b).
3
 Note: many collateralised loan obligations have recently been put on negative watch or downgraded.
4
 These increases in yields and downgrades are assumed to materialise simultaneously as a consequence of the increase in
 credit risk owing to the pandemic. Indeed, as the market usually prices in downgrades before they occur, yields are not
 assumed to increase entirely “because of” the downgrades. Nevertheless, downgrades can have an additional “trigger”
 effect, for example affecting the behaviour of funds that follow investment-grade indices and may therefore be forced to
 rebalance their portfolios by selling fallen angels once the downgrade has materialised.

A system-wide scenario analysis of large-scale corporate bond downgrades
Executive summary
 2
impacts (“low market liquidity and high price impact” and “high market liquidity and low price
impact”). As the variation in the estimates set out in Tables 1 and 2 below shows, the assumptions
and modelling parameters are key drivers of the results and produce considerable uncertainty
around the estimated losses. For this reason, the report presents estimated losses and results as
“ranges” under various assumptions, rather than providing single point estimates. Moreover, the
volume of sales presented herein should be read as a “what if” analysis, rather than an evidence-
based estimate of what amounts various sectors might realistically choose to – or be forced to –
sell in such scenarios. In particular, while downgrades have historically taken place over a longer
time horizon, the shock from the Coronavirus pandemic is an unprecedented far-reaching and
exogenous shock, and more downgrades may consequently appear over a shorter time period.
While this has not occurred before, the analysis asks the question “What if a large number of
downgrades and forced sales were to occur at the same time?”

Recent estimates by the ECB and the ESRB place the likely amount of BBB-rated non-financial
 5
corporate bonds that could be downgraded at between €110 billion and €132 billion. In this
context, it is important to recognise both (i) the “what if” nature of the present analysis using higher
downgrade percentages and multiple-notch downgrades (for example from A to BB), and (ii) the
difference in coverage (i.e. financial corporate bonds and non-euro area bonds are included in the
present analysis), which therefore complements the analysis of likely downgrades by the ECB and
ESRB with two hypothetical scenarios.

Holdings

Chart 1 below provides an overview of the total corporate bond holdings and the subset of BBB-
rated and A-rated corporate bonds, as captured in the ECB’s Securities Holdings Statistics (SHS)
database. The data cover the global holdings of the reporting institutions (which comprise euro area
institutions and some selected European countries that report voluntarily). These data can be seen
in relation to several benchmark figures:

• The total assets of the banks included in the data amount to roughly €27 trillion and total
 equity amounts to €1.9 trillion (€1.65 trillion in terms of CET1).

• For the insurance sector, total investments stand at approximately €8.9 trillion.

• The Total Assets held by EU passive investment-grade corporate bond funds is €155 billion.

• EU active investment-grade corporate bond funds hold Total Assets of €480 billion.

The total value of the EU investment-grade and high-yield corporate bond markets stands at
around €3 trillion.

5
 See Chart 2.11 in the ECB Financial Stability Review, May 2011, and the ESRB issues note on liquidity in the
 corporate bond and commercial paper markets, the procyclical impact of downgrades and implications for asset
 managers and insurers, May 2020.

A system-wide scenario analysis of large-scale corporate bond downgrades
Executive summary
 3
Chart 1
Overview of corporate bond holdings by sector (left-panel) and BBB-rated and A-rated bond
holdings by sector (right-panel)

(EUR billions)

 Active IG Passive IG
 corporate funds corporate funds
 62 61

 Other
 Insurers investment
 1,033 funds
 1,068
 Banks
 257
 Other
 1,375

 Insurers
 764
 Active and passive
 IG corporate funds
 307
 Banks
 520
 Pension
 Pension funds funds
 111 73

Sources: ECB SHS database and ESAs.
Notes: The insurance sector holdings comprise corporate bonds for which the credit quality step was reported. See Section 2.3
for further details on geographic and institutional coverage.

Main findings

Table 1 shows that under the first downgrade scenario (which assumes that approximately 25% of
downgrades are from BBB to below investment grade), the system-wide initial losses would amount
 6
to €146 billion. Depending on the behavioural assumption regarding institutional reactions, these
losses may trigger forced sales of fallen angels amounting to between €30 billion and €198 billion.
In turn, these sales – also called “fire sales” – which reflect the assumed stressed market
 7
conditions in which they take place, could trigger additional fire sale losses, owing to the high-yield
corporate bond market’s assumed limited capacity to absorb such sales. These additional losses
would range from between €2 billion and €18 billion under the “mild” behavioural assumption which
considers forced sales by index-tracking funds only, to between €10 billion and €64 billion under
the hypothetical extreme behavioural assumption. Under the second downgrade scenario (which
assumes that around 45% of downgrades are fallen angels), the initial losses could climb to
€213 billion across the financial system, triggering up to €373 billion of forced sales of fallen angels,
which, under the severely stressed assumptions, could produce up to €85 billion of additional
losses.

6
 The analysis in this report assumes that the downgrades occur instantaneously, rather than over a longer time horizon. As
 mentioned above, the assumed downgrade percentages considered in this report take a “what if” approach and therefore
 differ from recent estimates by the ECB and ESRB.
7
 Unlike sales under normal circumstances, “fire sales” entail distressed values and occur in the context of low to very low
 market liquidity: “a fire sale is essentially a forced sale of an asset at a dislocated price” (Shleifer and Vishny, 2011).

A system-wide scenario analysis of large-scale corporate bond downgrades
Executive summary
 4
While it would be expected that the price impact of forced sales would not be permanent and prices
would revert to their fundamental value over a longer time horizon, capital may not be available fast
enough to prevent price dislocations (see Duffie 2010). Institutions that have sufficient balance
sheet capacity and a long-term investment perspective, enabling them to hold on to the assets,
would therefore suffer only accounting losses, which would subsequently be reversed. Conversely,
institutions that did sell some of the bonds would “lock in” the loss.

Table 1
Initial losses from downgrades (in all rating categories), volume of fallen angels, volume of
sales and lower and upper bounds for losses resulting from fire sales

(EUR billions)

 Scenario 1 Scenario 2

 Lower Upper Lower Upper
 Initial Fallen Volume bound bound Initial Fallen Volume bound bound
 losses angels of sales fire sales fire sales losses angels of sales fire sales fire sales

 Mild behavioural
 assumption 145.9 231.8 30.3 1.7 18.0 212.7 443.1 64.6 3.3 33.0

 Severe
 behavioural
 assumption 145.9 231.8 68.6 4.0 36.9 212.7 443.1 135.2 7.3 58.7

 Extreme
 behavioural
 assumption 145.9 231.8 198.1 9.8 64.1 212.7 443.1 373.1 15.7 84.6

Sources: ESAs, Bank of England and ESRB Secretariat calculations.
Note: Owing to data aggregation issues, it was not possible to provide a breakdown of the losses into those on bonds issued by
non-financial corporations and those on bonds issued by banks.

Table 2 shows the additional market value losses (as a percentage of initial losses) corresponding
to additional fire sale losses triggered by the estimated forced sales. Under the less severe
scenario, i.e. scenario 1, and the mild behavioural assumption, these additional fire sale losses
would add only 1.2% to the initial losses, while under the hypothetical most extreme behavioural
assumption these additional fire sale losses could increase the initial losses by approximatively
44% in the first downgrade scenario and by up to 40% in the second downgrade scenario.

A system-wide scenario analysis of large-scale corporate bond downgrades
Executive summary
 5
Table 2
Fire sale losses as a percentage of initial losses

 Scenario 1 Scenario 2

 Initial Lower bound Upper bound Initial Lower bound Upper bound
 losses fire sales fire sales losses fire sales fire sales

 Mild behavioural
 assumption - 1.2 12.3 - 1.6 15.5

 Severe behavioural
 assumption - 2.7 25.3 - 3.5 27.6

 Extreme behavioural
 assumption - 6.7 44.0 - 7.4 39.8

Sources: ESAs, Bank of England and ESRB Secretariat calculations.

Overall, the analysis shows that in a severe mass downgrade scenario with a corresponding yield
shock, initial losses from repricing could amount to €150 billion – €200 billion across the entire
financial system, and that fire sale losses stemming from distressed market reactions might add
another 20% – 30% to these losses, depending how much of their holdings it is assumed that
institutions would sell and how (il)liquid markets would turn out to be. These fire sale losses result
from estimated price impacts, which are notoriously difficult to model and depend on the size of the
sale and the underlying market liquidity assumptions (see Annex 5.4). In the analysis below,
depending on the scenario, they range, on average, between 0.3% and 7.9% for an individual bond
and thus cover a realistic range, observed both from anecdotal market intelligence and academic
empirical studies of the US corporate bond market.

Furthermore, a portfolio overlap analysis (see Figure 2 in Section 4.2) reveals considerable overlap
between the portfolios of investment funds and insurers. This implies, for instance, that a forced
sale by one of these sectors would potentially affect the other sector more severely through mark-
to-market losses than would be the case with the less significant overlap between the holdings of
the banking and pension fund sectors.

Finally, the report does not assess the impact and consequences of increased funding costs for the
companies whose bond yields have increased. These effects could be a sizeable addition to the
losses described in the report.

A system-wide scenario analysis of large-scale corporate bond downgrades
Executive summary
 6
2 Introduction

2.1 Background and main goals of the analysis
In the context of the coronavirus (COVID-19) pandemic and the ESRB’s priority work streams, the
present report summarises the results of a system-wide top-down impact assessment of a mass
bond downgrade scenario carried out jointly by the ESAs (the European Banking Authority, the
European Insurance and Occupational Pensions Authority and the European Securities and
Markets Authority), the ECB, the Bank of England and the ESRB.

The economic disruptions caused by the coronavirus pandemic could trigger a wave of credit rating
downgrades in the financial and non-financial corporate bond sector owing to the significant
 8
increase in credit risk. These downgrades can be problematic, in particular when issuers lose their
investment-grade status and the downgrades are concentrated within a short period. BBB-rated
corporate bonds represent roughly 50% of the investment-grade universe. Index-tracking funds
would need to sell those holdings quickly if the bonds fell out of the reference basket. Other
investment funds, banks, pension funds and insurers may voluntarily decide – or be forced – to sell
because of their risk limits or investment mandates, or in order to protect their solvency positions.
Such sales could result in additional spread increases, given the expected limited absorption
capacity of the high-yield market (which is three times smaller than the BBB corporate bond
segment), leading to mark-to-market losses for investors and higher funding costs for corporates.
From a macroprudential perspective, it is therefore important to ensure that the possible effects of
these credit rating downgrades are well understood, so as to capture any risks to the proper
functioning of financial markets and the real economy. The analysis below attempts to estimate the
following:

1. The direct losses that could materialise from yield shocks in a “large-scale downgrade”
 scenario.

2. The potential volume of forced sales and the high-yield corporate bond market’s capacity for
 absorption and potential price impacts of forced sales.

3. The additional losses from the price impact for financial institutions (investment funds,
 insurers, pension funds and banks).

8
 It is assumed that increases in yields and downgrades occur simultaneously owing to the increase in credit risk, rather than
 increases in yields occurring as a result of the downgrades. See also Footnotes 4 and 6.

A system-wide scenario analysis of large-scale corporate bond downgrades
Introduction
 7
2.2 Caveats
We stress several important caveats:

• Behavioural assumptions underpinning the “what if” analysis: Assumptions regarding
 the likely behaviour of financial institutions play an important role in driving the results. The
 analysis below therefore considers three hypothetical behavioural scenarios. These scenarios
 should be seen as “what if” analyses, rather than a judgement on likely behaviour. For
 instance, regarding behavioural assumptions, the present analysis has not taken into account
 liquidity management tools that help investment funds meet outflows and limit fire sales.
 Regarding the downgrade scenarios, the likelihood of the scenarios materialising is not
 considered, given the “what if” nature of the exercise. The present analysis therefore serves
 as a hypothetical complement to prior ECB and ESRB analyses on the topic.

• System-wide perspective: While the modelling of fire sales by individual sectors has
 received a lot of attention in the academic literature, the present analysis of forced sales
 attempts to model simultaneously almost the entire ecosystem (investment funds, pension
 funds, insurers and banks). It is therefore essential to specify who will be the buyers of assets
 that are sold off (e.g. distressed debt buyers, hedge funds or sovereign wealth funds). The
 system-wide perspective is particularly relevant when modelling the price impact of these
 forced sales. Given the considerable uncertainty regarding price impacts (owing to both the
 size of the potential sales and the number of sectors covered), a sensitivity analysis is
 conducted around this parameter. Furthermore, although dealing with the entire ecosystem,
 the present analysis does not assess where cash from investment fund redemptions would
 flow to elsewhere in the system, thereby potentially mitigating the impact on other actors
 (e.g. through increased bank deposits or purchases of higher-rated bonds).

• Types of bond covered: The analysis focuses on corporate bonds and does not consider
 securitisations, covered bonds or sovereign bonds. The repercussions of sovereign
 downgrades are likely to exceed those of corporate downgrades. Owing to the need to merge
 several databases, the analysis unfortunately does not allow a breakdown between corporate
 bonds issued by financial corporations and those issued by non-financial corporates, although
 the expected downgrades and their effects (including second-round effects) could vary
 considerably across these two types.

• Geographic scope: The analysis of potential sales of fallen angels focuses particularly on
 euro area corporate bonds and non-euro area assets reported by European institutions to the
 ECB’s Securities Holding Statistics (SHS) database. Using detailed data on these assets,
 price impacts are also extrapolated to non-euro area bonds.

• Indirect holdings and other effects: The report does not consider and quantify the issue of
 “indirect holdings”, i.e. funds holding corporate bonds with “fallen angel” risk and banks,
 insurance companies or other institutions holding shares in these funds in turn. As such, the
 estimates of losses for banks and insurers may be somewhat higher depending on their share
 of such indirect holdings. Other potential effects, such as the increase in funding costs for
 non-financial corporates or the impact on the liquidity coverage ratio for banks when bonds
 lose their high quality liquid asset status, are also not included in the analysis.

A system-wide scenario analysis of large-scale corporate bond downgrades
Introduction
 8
2.3 Overview of current holdings
Table 3 provides an overview of the different sectors’ initial holdings, as at the end of 2019 (except
for investment fund data provided by ESMA, which are refer to March 2020). The data on these
holdings are database extracts that do not vary on the basis of the above-mentioned scenarios or
assumptions and thus constitute fixed inputs into all scenario variants.

Three types of fund are exposed to corporate bonds:

1. Active investment-grade (IG) corporate bond funds use an IG corporate bond benchmark
 which they seek to outperform, and can invest in a range of other assets in addition to
 corporate bonds. The Total Assets of EU and UK active funds amount to €480 billion and
 these funds hold €152 billion of corporate bonds, including €52 billion of euro area corporate
 bonds.

2. Passive IG corporate bond funds replicate an IG corporate bond index and therefore invest
 almost exclusively in index constituents. EU passive funds hold Total Assets of €155 billion,
 and EU passive funds tracking euro IG corporate index hold Total Assets of €43 billion.

3. Finally, other funds invest in corporate bonds, such as mixed funds (which invest in both
 equities and bonds).

In the analysis, we focus on active and passive funds only, as their investment mandates are
directly related to IG corporate bond benchmarks.

In Table 3, the data in the blue columns are extracted from the ECB’s SHS database, which covers
only euro area institutions and some selected countries that voluntarily report SHS data (currently
Bulgaria, the Czech Republic, Denmark and Romania). The SHS data cover global holdings of
these institutions. The green columns correspond to data provided by ESMA and EIOPA, which
have global coverage. It is also important to note that passive funds constitute only a small portion
of the investment funds included in SHS data, since active funds and especially other types of fund
could also hold corporate bonds, as discussed in Section 3.2. It is therefore difficult to compare the
global passive funds data from ESMA with the SHS investment fund data. Focusing only on SHS
data, i.e. the global holdings of euro area institutions (plus institutions of some selected countries),
these institutions hold approximatively €967 billion of BBB-rated bonds and €782 billion of A-rated
bonds (as at the end of 2019), which are the two rating categories that are most important for
considering fallen angel risk. Of these amounts, between 60% and 70% are euro area bonds, while
30% – 40% are non-euro area corporate bonds held by the euro area institutions reporting SHS
data.

A system-wide scenario analysis of large-scale corporate bond downgrades
Introduction
 9
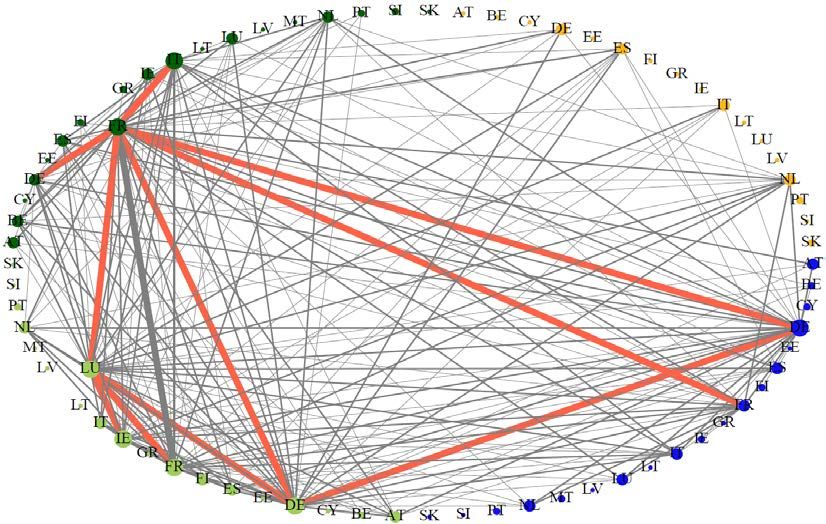
Table 3
Holdings of various sectors in selected rating categories in the EEA (excluding the United
Kingdom)

(EUR billions)

 Investment Pension Global Insurers (EEA
 Rating funds Insurers Banks funds Total passive funds excluding UK)

 AAA 53.6 40.2 106.2 7.0 207.0 11.0 59.8

 AA 143.2 210.2 140.9 15.2 509.5 99.5 179.7

 A 327.6 281.1 140.4 32.9 782.0 464.1 416.3

 BBB 518.7 291.6 116.5 40.1 966.9 530.4 347.9

 BB and below 331.4 24.2 16.4 15.8 387.8 NA 29.0

 Total 1,374.5 847.3 520.4 111.0 2,853.2 1,105.0 1,032.7

Sources: ESAs and ECB SHS database.
Notes: The left-hand columns in blue are based on SHS data, while the two right-hand columns in green are based on data
provided by the ESAs. In general, it should be expected that the total based on SHS data would be smaller than the total
collected by the ESAs, as SHS data cover only global assets of owners in the euro area and some other selected countries. The
only exception is for AA holdings of insurers, possibly owing to different sources used for reporting the credit quality step.
Similarly, “investment funds” in SHS data (blue columns) also include active funds and other investment funds, while global
passive funds is an estimate of the global holdings of passive funds by ESMA. These differences have no impact on the results
since the report only considers sales of fallen angels. EIOPA data contain CIC2-1 (corporate bonds, corporate bonds) with the
reported credit quality step. The analysis below requires both data sources, as it seeks to quantify the impact of sales by global
institutions on European institutions.

Active funds dominate the corporate bond fund sector in Europe, with a market share of roughly
75%. EU passive funds manage assets with a value of €155 billion (i.e. 25% of the market), which
is significantly less than in the United States, where passive funds dominate (see Chart 2).

Chart 2
Size of passive and actie IG corporate bond funds

(EUR billions)

Sources: Morningstar Direct, ESMA.
Note: Total assets of open-ending fungs tracking IG corporate indice by domicile.

A system-wide scenario analysis of large-scale corporate bond downgrades
Introduction
 10
Passive funds, in the aggregate, are assumed to track the Bank of America Merrill Lynch (BoAML)
global corporate bond index. Since passive funds can track a range of IG indices (including the
Bloomberg Barclays Aggregate index where corporates only account for 25% of the index), the
estimates can be interpreted as an upper bound. The composition of the index, as shown in
Table 4, is used to map passive funds’ exposures to rating categories in Table 3.

Table 4
Assumed composition of passive funds’ corporate bond holdings

 Eupassive funds total
 Index composition assets (EUR billions) United States Rest of the world Total

 AAA 1% 2 9 2 13

 AA 9% 14 69 16 99

 A 42% 65 321 77 463

 BBB 48% 74 367 88 529

 Total 100% 155 766 183 1,104

Sources: BoAML, Morningstar Direct, ESMA.

For active funds, the available data cover only €136 billion of holdings. All data are obtained from a
commercial database (Morningstar Direct) where no harmonised definition of active funds exists.
The sample of active funds has been constructed by selecting fixed income funds which mainly
invest in corporate bonds and whose benchmark is an IG corporate bond index. Most bond funds
investing in corporate and sovereign bonds are not included. Overall, active funds’ Total Assets
amount to €1.2 trillion, with €480 billion held by funds domiciled in the EU and the United Kingdom.
Only a subsample (€139 billion) of those active funds was used in the analysis owing to data
availability issues regarding portfolio composition and credit quality. The data are as at the end of
March 2020. Of the €139 billion subsample, only €55 billion is held by EU-domiciled funds.

Regarding the United Kingdom, the size of the sterling investment-grade corporate bond market
has increased six-fold since 1998 and currently stands at £430 billion. Over the same period, the
share of BBB-rated bonds in the market has increased from 8% to 49% (see Chart 3). Thus the
market value of the sterling BBB market is now four and a half times greater than it was in 2008
and nine times greater than in 2002.

A system-wide scenario analysis of large-scale corporate bond downgrades
Introduction
 11
Chart 3
Sterling investment-grade corporate bond index broken down by credit rating

 BBB A AA AAA Per cent
 100
 90
 80
 70
 60
 50
 40
 30
 20
 10
 0
 98 00 02 04 06 08 10 12 14 16 18 20

Sources: ICE BoAML and Bank of England calculations.

A system-wide scenario analysis of large-scale corporate bond downgrades
Introduction
 12
3 Description of scenarios 3.1 Transition matrices and yield shocks In contrast to recent estimates by the ECB and the ESRB that focused on estimating the likely 9 amount of downgrades, the present analysis focuses on two “what if” scenarios that consist of a large number of downgrades (Scenario 1) and a very large number of downgrades (Scenario 2), as summarised in Table 5. In each case, the shocks are assumed to materialise simultaneously. The scenarios have been calibrated by taking into account the projected contractions in GDP and the Purchasing Managers’ Index (PMI) for 2020, assessing the link between GDP, the PMI and rating transitions, and applying additional expert judgement via benchmarking the model-based estimates to historical maxima. In addition, the transition probabilities from BBB to BB (or below) have been 10 increased to reflect (i) the substantial growth of the BBB segment in recent years, (ii) the fact that 11 60% of BBB-rated corporate bonds are now on “negative outlook”, and (iii) the fact that this rating is a key threshold in terms of investor and market behaviour. Yield shocks to bonds Three types of shock are applied to the bond holdings: • First, as the data for insurers, pension funds and banks are as at the end of 2019 and do not include the price movements resulting from the market turmoil in March 2020, Table 6 adds 12 yield shocks that correspond to the actual market moves between February and April 2020. This brings all prices to the same “starting point”. The losses from the application of these yield shocks are not counted in the analysis below. • Second, Table 7 models a yield shock to all bonds, capturing a further deterioration in credit risk. • Finally, those bonds that are downgraded in line with the percentages in Table 5, and thus face a larger increase in credit risk, receive an additional yield shock reflecting this relatively 13 higher credit risk. This element is captured in Table 8. 9 See Chart 2.11 in the ECB Financial Stability Review, May 2011, and the ESRB issues note on liquidity in the corporate bond and commercial paper markets, the procyclical impact of downgrades and implications for asset managers and insurers, May 2020. 10 While pure model-based calibrations have resulted in downgrade percentages close to the observed historical maximum, they have been increased substantially for the BBB BB and BBB B downgrades for the reasons stated. 11 See ESRB (2020b) for details. 12 See the Annex for an overview of the various data sources. 13 As an example, consider an EU/EEA financial corporate bond, initially rated BBB. If the data capture its value in February 2020 or earlier and it is downgraded to B, it receives a shock of 221 (Table 6) + 143 (Table 7) + 210 + 340 (both Table 8) = 914 basis points. A system-wide scenario analysis of large-scale corporate bond downgrades Description of scenarios 13
To the extent that market prices may already have priced in forced sales, the impact once they
occur might be smaller. This uncertainty is captured in the range between “low price impact” and
“high price impact” in Section 4.1.4.

Table 5
Transition probabilities in both scenarios

 EU-27 and EEA

 Medium severe case – Scenario 1 Severe case – Scenario 2

 AAA AA A BBB BB B CCC CC C D AAA AA A BBB BB B CCC CC C D

 AAA 80.0 20.0 0.0 0.0 0.0 0.0 0.0 0.0 0.0 0.0 AAA 20.0 65.0 10.0 5.0 0.0 0.0 0.0 0.0 0.0 0.0

 AA 0.0 85.6 10.0 4.4 0.0 0.0 0.0 0.0 0.0 0.0 AA 0.0 40.5 45.0 13.4 1.0 0.0 0.0 0.0 0.0 0.1

 A 0.0 0.0 86.9 10.0 2.0 1.1 0.0 0.0 0.0 0.0 A 0.0 0.0 52.7 35.0 10.0 2.1 0.0 0.0 0.0 0.2

 BBB 0.0 0.0 0.0 74.9 20.0 5.0 0.0 0.0 0.0 0.2 BBB 0.0 0.0 0.0 54.7 40.0 5.0 0.0 0.0 0.0 0.3

 BB 0.0 0.0 0.0 0.0 78.7 20.0 0.5 0.0 0.0 0.8 BB 0.0 0.0 0.0 0.0 50.1 35.0 13.3 0.0 0.0 1.6

 B 0.0 0.0 0.0 0.0 0.0 76.7 15.0 5.0 0.0 3.3 B 0.0 0.0 0.0 0.0 0.0 63.0 25.0 0.3 5.0 6.7

 CCC 0.0 0.0 0.0 0.0 0.0 0.0 86.7 5.0 5.0 3.3 CCC 0.0 0.0 0.0 0.0 0.0 0.0 53.3 30.0 10.0 6.7

 CC 0.0 0.0 0.0 0.0 0.0 0.0 0.0 75.0 20.0 5.0 CC 0.0 0.0 0.0 0.0 0.0 0.0 0.0 60.0 30.0 10.0

 C 0.0 0.0 0.0 0.0 0.0 0.0 0.0 0.0 80.0 20.0 C 0.0 0.0 0.0 0.0 0.0 0.0 0.0 0.0 60.0 40.0

 United Kingdom

 Medium severe case – Scenario 1 Severe case – Scenario 2

 AAA AA A BBB BB B CCC CC C D AAA AA A BBB BB B CCC CC C D

 AAA 85.0 15.0 0.0 0.0 0.0 0.0 0.0 0.0 0.0 0.0 AAA 55.0 45.0 0.0 0.0 0.0 0.0 0.0 0.0 0.0 0.0

 AA 0.0 86.2 10.0 3.8 0.0 0.0 0.0 0.0 0.0 0.0 AA 0.0 47.4 40.0 11.6 0.9 0.0 0.0 0.0 0.0 0.1

 A 0.0 0.0 80.2 14.1 5.0 0.7 0.0 0.0 0.0 0.0 A 0.0 0.0 58.2 30.0 10.3 1.3 0.0 0.0 0.0 0.2

 BBB 0.0 0.0 0.0 77.9 18.0 4.0 0.0 0.0 0.0 0.2 BBB 0.0 0.0 0.0 59.7 35.0 5.0 0.0 0.0 0.0 0.3

 BB 0.0 0.0 0.0 0.0 75.7 22.9 0.5 0.0 0.0 0.8 BB 0.0 0.0 0.0 0.0 56.9 30.0 11.5 0.0 0.0 1.6

 B 0.0 0.0 0.0 0.0 0.0 75.1 16.6 5.0 0.0 3.3 B 0.0 0.0 0.0 0.0 0.0 68.0 20.0 0.3 5.0 6.7

 CCC 0.0 0.0 0.0 0.0 0.0 0.0 87.0 4.7 5.0 3.3 CCC 0.0 0.0 0.0 0.0 0.0 0.0 58.3 25.0 10.0 6.7

 CC 0.0 0.0 0.0 0.0 0.0 0.0 0.0 80.0 15.0 5.0 CC 0.0 0.0 0.0 0.0 0.0 0.0 0.0 55.0 35.0 10.0

 C 0.0 0.0 0.0 0.0 0.0 0.0 0.0 0.0 80.0 20.0 C 0.0 0.0 0.0 0.0 0.0 0.0 0.0 0.0 60.0 40.0

A system-wide scenario analysis of large-scale corporate bond downgrades
Description of scenarios
 14
United States and rest of the world

 Medium severe case – Scenario 1 Severe case – Scenario 2

 AAA AA A BBB BB B CCC CC C D AAA AA A BBB BB B CCC CC C D

 AAA 90.0 10.0 0.0 0.0 0.0 0.0 0.0 0.0 0.0 0.0 AAA 75.0 25.0 0.0 0.0 0.0 0.0 0.0 0.0 0.0 0.0

 AA 0.0 90.0 10.0 0.0 0.0 0.0 0.0 0.0 0.0 0.0 AA 0.0 69.9 30.0 0.0 0.0 0.0 0.0 0.0 0.0 0.1

 A 0.0 0.0 74.4 20.0 5.0 0.0 0.0 0.6 0.0 0.0 A 0.0 0.0 63.8 25.0 10.0 0.0 0.0 1.0 0.0 0.2

 BBB 0.0 0.0 0.0 60.1 25.0 9.0 3.4 2.3 0.0 0.2 BBB 0.0 0.0 0.0 49.1 35.0 9.4 3.7 2.5 0.0 0.3

 BB 0.0 0.0 0.0 0.0 89.2 10.0 0.0 0.0 0.0 0.8 BB 0.0 0.0 0.0 0.0 53.4 45.0 0.0 0.0 0.0 1.6

 B 0.0 0.0 0.0 0.0 0.0 70.4 15.0 11.3 0.0 3.3 B 0.0 0.0 0.0 0.0 0.0 41.7 35.0 11.6 5.0 6.7

 CCC 0.0 0.0 0.0 0.0 0.0 0.0 81.7 10.0 5.0 3.3 CCC 0.0 0.0 0.0 0.0 0.0 0.0 58.3 25.0 10.0 6.7

 CC 0.0 0.0 0.0 0.0 0.0 0.0 0.0 75.0 20.0 5.0 CC 0.0 0.0 0.0 0.0 0.0 0.0 0.0 50.0 40.0 10.0

 C 0.0 0.0 0.0 0.0 0.0 0.0 0.0 0.0 80.0 20.0 C 0.0 0.0 0.0 0.0 0.0 0.0 0.0 0.0 60.0 40.0

Sources: ESRB and ECB estimations.
Notes: Additional transition matrices for short-term ratings and historical maximum downgrades are provided in the
Methodological annex. The rows denote the initial rating, while the columns denote the final rating. The orange shaded area
covers all fallen angels. For instance, in Scenario 2, for the EU-27 and EEA, 40% of BBB bonds are assumed to migrate to BB,
while 5% are assumed to migrate to B and 0.3% are assumed to default.

Table 6
Yield shocks to bonds reflecting market developments in March – April 2020

(absolute changes (basis points))

 Corporate bond yields

 Country Type AAA-AA A BBB BB (and below)

 Financial 160 173 292 369
 United Kingdom
 Non-financial 172 181 207 262

 Financial 131 175 221 280
 EU and EEA
 Non-financial 117 125 179 226

 United States and Financial 113 165 297 375
 rest of the world Non-financial 113 129 211 267

Notes: These shocks have been applied only to bond holdings data for the period prior to February 2020. Losses from these
yield shocks are not added to the loss estimates below. Observed during the March – April 2020 market turmoil.

A system-wide scenario analysis of large-scale corporate bond downgrades
Description of scenarios
 15
Table 7 Yield shocks to all bonds owing to the increase in credit risk (based on final ratings after transitions; absolute changes (basis points)) Corporate bond yields Country Type AAA-AA A BBB BB (and below) Financial 61 66 149 188 United Kingdom Non-financial 73 80 105 133 Financial 50 67 113 143 EU and EEA Non-financial 49 56 90 114 United States and Financial 55 73 124 157 rest of the world Non-financial 54 61 100 126 Source: ECB calculations. Table 8 Additional yield shocks to downgraded bonds only (basis points) Shocks on downgrade AAA AA AA A A BBB BBB BB BB B B CCC** Financials 10 60 120 210 340 910 Non-financials 10 60 90 150 250 670 Source: ECB calculations. ** And for each additional downgrade step. 3.2 Behavioural and modelling assumption The analysis below assumes that financial institutions respond to the instantaneous shocks calibrated in Section 3.1 partly mechanically (e.g. implementing fixed investment mandates) and partly through behavioural reactions (e.g. management actions or portfolio rebalancing). The forced sale analysis focuses only on the first month after the downgrade shock, as price impacts are unlikely to be of first-order importance over longer time horizons. The results are based on the behavioural assumptions below, which should be viewed as hypothetical “what if” reactions, rather than specifying an evidence-based expected or likely behaviour of different institutional sectors. The simulations below analyse three different sets of “behavioural scenarios”, which, as the estimated losses further below show, are important drivers of the results: 1. Mild behavioural scenario: Only passive funds are assumed to engage in forced sales; they are assumed to sell all of their fallen angels. All other institutions are assumed not to engage in any forced sales. A system-wide scenario analysis of large-scale corporate bond downgrades Description of scenarios 16
2. Severe behavioural scenario: Passive funds behave as under the mild behavioural scenario.
 In addition, active funds, insurers and pension funds are assumed to sell some of their fallen
 angels. Further details on the assumptions underlying this scenario are provided below.

3. Extreme behavioural scenario: Passive and active funds, pension funds and insurers sell all
 of their fallen angels.

“What if” assumptions regarding the selling behaviour of the various institutional sectors:

• Passive IG corporate investment funds tracking an IG index are assumed to sell all of their
 fallen angels in accordance with their investment mandate within the first month for the
 14
 purposes of the analysis. Additional potential volumes sold to meet potential redemptions
 15
 have not been incorporated. Such outflow-related sales have been estimated for active
 funds and are dwarfed by the direct sale assumption for fallen angels. This assumption for
 passive funds remains the same across all three behavioural scenarios.

•
 16
 Active IG corporate bond funds, following Aramonte and Eren (2019) and ESMA (2020),
 are assumed to sell 33.3% of the fallen angels in their portfolios to reflect some degree of
 investment mandate flexibility. Moreover, active funds are assumed to face outflows and are
 assumed to sell some assets to meet these redemptions. The redemptions are calibrated to
 17
 historical return-flow relationships for EU funds (ESMA, 2019). This assumption is relevant
 for the severe behavioural scenario.

• Insurers’ reactions depend on their current portfolio composition, their asset-liability
 management and their risk appetite. Based on available information, it is difficult to assess
 how insurers would react in such a downgrade scenario. They might not sell their fallen angels
 immediately if prices are perceived as being “too low” and if they have sufficient balance sheet
 capacity and/or for instance choose to de-risk in other asset classes, such as equities. For the
 sake of simplicity, it is therefore assumed that, similarly to active funds, insurers would sell
 20% of their fallen angels. This hypothetical assumption is relevant for the severe behavioural
 scenario below.

• Pension funds, depending on their risk appetite, may also choose to reduce risk exposures.
 While the EIOPA 2019 IORP stress test suggests that pension funds may take considerable
 time to rebalance their portfolios, for the sake of simplicity it is assumed here that pension
 funds would sell 10% of their fallen angels. Again, this assumption is relevant for the severe
 behavioural scenario.

Assumptions for other financial institutions:

14
 In practice, passive funds replicate the index by using a set of sampling techniques (rather than holding all the index
 constituents) and have some flexibility regarding the timing of the rebalancing of their portfolios. This flexibility can however
 imply larger tracking errors.
15
 Given that it is already assumed that passive funds would sell all of their fallen angels.
16
 Excluding hedge funds, distressed debt funds and sovereign wealth funds.
17
 The flow-related sales are in the order of 1% compared with the assumption of selling 33.3% of the fallen angels.

A system-wide scenario analysis of large-scale corporate bond downgrades
Description of scenarios
 17
• Money Market Funds (MMFs) invest in short-term bonds and adjust their portfolios to
 changes in credit risk. Although there is no automatic reliance on credit ratings in the
 regulation governing MMFs, a large share of MMFs receives money market fund ratings
 issued by credit rating agencies (CRAs) (around 95% of a sample of €750 billion of EU
 MMFs). AAAmmf ratings for MMFs prohibit them from investing in a short-term instrument
 from an issuer rated below P1/A1/F1. CRAs give MMF managers a short transition period to
 dispose of the assets following a downgrade (“grace” or “cure” periods). It is therefore
 assumed that MMFs refrain from rolling over these investments instead of selling these parts
 of their bond portfolios.

• Banks act as market-makers, and it is assumed that they are unlikely to sell off their existing
 bond holdings. They may in fact act as buyers and, balance sheet capacity allowing, increase
 their holdings. The recent measures taken by the ECB with regard to the collateral framework
 in order to alleviate the impact of rating downgrades on the availability of collateral should help
 banks to continue their activities of market-making. Marketable assets and issuers of those
 assets that were rated at least BBB- on 7 April 2020 will retain their eligibility in terms of the
 provision of collateral in the event of rating downgrades, as long as their rating remains at or
 18
 above BB. An analysis including banks as sellers is possible in principle. Nevertheless,
 banks suffer mark-to-market losses from the initial yield shocks in the scenarios and the price
 impact of the forced sales by other institutions. We assume that all bonds are held on a “fair
 19
 value” accounting basis to estimate these mark-to-market losses.

• Hedge funds, distressed debt funds or sovereign wealth funds may also act as potential
 buyers (however, see Duffie 2010 on “slow-moving capital”). These counterparties are not
 modelled directly in the analysis, but captured indirectly in the “price impact function” and in
 particular the price floors (i.e. levels below which prices are assumed not to drop, as
 fundamental value buyers are assumed to step in at this level).

• Central counterparties (CCPs) usually accept only assets with very low credit risk as
 collateral. At first sight, a fallen angel scenario is thus not likely to have a severe impact on
 CCPs, unless a substantial amount of their clients were using, for “collateral upgrades”, bonds
 that became fallen angels, which their dealer banks would no longer be willing to transform
 into accepted collateral. Our data sources do not allow us to assess the relevance of this
 possibility. CCPs are therefore not modelled.

• Central banks are not modelled. While the ECB has recently taken policy actions to expand
 its collateral framework, no policy actions are modelled in the simulation exercise below.

Regarding the liquidation strategy, it is assumed that assets are sold in proportion to current
 20
holdings (pro-rata).

18
 ECB (2020a) and (2020b).
19
 This is a simplifying assumption because bonds held at amortised cost do not suffer mark-to-market-losses. However, the
 bonds held in the banking book would also have an impact on the balance sheet via increases in risk weights or migrations
 in credit stages (owing to deterioration in credit risk). The mark-to-market losses can thus be seen to approximate these
 effects.
20
 A variant in which only bonds assigned a negative outlook are sold is in principle implementable, but this matching was not
 feasible within our timeline.

A system-wide scenario analysis of large-scale corporate bond downgrades
Description of scenarios
 18
Simplified version of a potential timeline of events (in days)

T0: Credit risk increases and downgrades

T+1: Passive funds sell

T+2: MMFs cut their exposures

T+7: Active funds face outflows and sell

T+10 and later: Pension funds and insurers sell

A system-wide scenario analysis of large-scale corporate bond downgrades
Description of scenarios
 19
4 Results

Given both the uncertainty and importance surrounding some of the key parameters and modelling
assumptions in this analysis, the results below are presented for different combinations of
assumptions, which yield a range for the results rather than single point estimates. This approach
attempts to quantify the uncertainty of the results and thereby to be “roughly right”, rather than
“precisely wrong”. We consider:

1. Two scenarios for the transition probabilities which quantify the amount of downgrades.
 These scenarios are referred to as “Transition scenario 1” and “Transition scenario 2” below
 (see Table 5 in Section 3.1);

2. A single scenario for the yield shocks (see Tables 6, 7 and 8 in Section 3.1);

3. Three behavioural scenarios which specify the assumptions regarding the behavioural
 reactions of institutions in a “what if” approach. These scenarios are referred to as “mild
 behavioural scenario”, “severe behavioural scenario” and “extreme behavioural scenario”
 below (see Section 3.2 for a description of the scenarios).

4. A two-scenario sensitivity analysis on the price impact, using a “low price impact” regime
 and a “high price impact” regime. The low price impact regime is characterised by price
 impacts that are usually below 50 basis points, which may be small for a distressed market
 condition, while in the high price impact regime, price impacts can reach 500 basis points or
 more.

Overall, these combinations thus yield:

• Two scenarios for both the amount of fallen angels and for the initial losses.

• Twelve scenarios for the final fire sale losses/price impact estimates.

The twelve grey boxes in the flow chart below illustrate these twelve combinations.

Figure 1
Overview of the combinations of scenarios and assumptions

 Scenario 1 Scenario 2

 Mild Severe Extreme Mild Severe Extreme
 behavioural behavioural behavioural behavioural behavioural behavioural
 assumption assumption assumption assumption assumption assumption

 Low price Low price Low price Low price Low price Low price
 impact impact impact impact impact impact

 High price High price High price High price High price High price
 impact impact impact impact impact impact

A system-wide scenario analysis of large-scale corporate bond downgrades
Results
 20
4.1 Impact assessment of the scenarios

4.1.1 Losses from yield shocks

Table 9 shows the initial losses suffered by the various sectors under transition scenario 1, which
amount to roughly €146 billion. For active funds, a small-sample approximation of their portfolio
holdings has been used; data availability issues do not allow a more granular estimation of the
impact. It is assumed that the duration of pension funds’ and banks’ portfolios is similar to that of
insurers’ portfolios; the losses for pension funds and banks are therefore derived by multiplying the
pension fund and banking sectors’ respective holdings with the percentage losses by rating
 21
category recorded by insurers.

Table 9
Initial losses under transition scenario 1

(EUR billions)

 EEA excluding Euro
 Transition scenario 1 EEA United Kingdom area EEA

 Active Passive Funds – Pension
 Rating funds funds total Insurers funds Banks Total

 AAA 0.0 0.1 0.1 2.3 0.3 4.1 6.8

 AA 1.8 0.6 2.4 6.8 0.6 5.3 15.2

 A 2.2 4.0 6.2 24.1 2.1 8.1 40.5

 BBB 11.4 8.3 19.7 33.3 4.3 11.2 68.4

 BB 3.2 0.0 3.2 1.8 1.3 1.4 7.8

 B 3.2 0.0 3.2 0.6 0.0 0.0 3.8

 CCC 0.8 0.0 0.8 0.1 0.0 0.0 0.9

 Not rated 2.6 NA NA NA NA NA NA

 Total 25.2 13.0 38.2 69.0 8.6 30.1 145.9

 In relation to initial holdings 6.4% 8.4% 7.3% 7.8% 5.8%

Source: ESA and ESRB Secretariat calculations.

Table 10 below shows the estimated initial losses by sector in transition scenario 2. They total
approximately €213 billion.

21
 In scenario 1, these losses correspond to 4% (AAA and AA), 6% (A), 10% (BBB) and 9% (BB and below). In scenario 2,
 these losses correspond to 6% (AAA and AA), 9% (A), 12% (BBB), 16% (BB), 13% (B) and 17% (CCC). The average
 duration of insurers’ bond portfolios usually ranges between 8 and 10 years, while for banks it usually ranges between 5
 and 6 years. As such the losses from yield shocks for banks will be slightly overestimated in the table below.

A system-wide scenario analysis of large-scale corporate bond downgrades
Results
 21
Table 10
Initial losses under transition scenario 2

(EUR billions)

 EEA excluding Euro
 Transition scenario 2 EEA United Kingdom area EEA

 Active Passive Funds – Pension
 Rating funds funds total Insurers funds Banks Total

 AAA 0.0 0.1 0.1 3.3 0.4 5.9 9.7

 AA 3.0 1.0 4.0 11.1 1.0 8.7 24.8

 A 3.8 6.7 10.5 37.5 3.2 12.6 63.9

 BBB 16.2 10.1 26.3 40.2 5.2 13.5 85.2

 BB 7.1 0.0 7.1 3.3 2.5 2.6 15.5

 B 5.3 0.0 5.3 0.9 0.0 0.0 6.2

 CCC 1.8 0.0 1.8 0.2 0.0 0.0 2.0

 Not rated 5.4 NA NA NA NA NA NA

 Total 42.6 18.0 60.6 96.5 12.3 43.3 212.7

 In relation to initial holdings 10.8% 11.6% 10.3% 11.1% 8.3%

Source: ESA and ESRB Secretariat calculations.

Initial portfolio losses from downgrades amount to 8.4% for passive funds and 6.4% for actively
managed funds in scenario 1, and 11.6% and 10.8% respectively in scenario 2. In the scenarios
tested, the European insurance sector, excluding the United Kingdom, could be faced with losses
on their BBB holdings of 9.5% in scenario 1 and 11.5% in scenario 2. This corresponds to
€33.3 billion in scenario 1 and €40.2 billion in scenario 2 and would account for about 2.5% of their
initial holdings of corporate bonds in scenario 1 and 3.3% in scenario 2. As the scenarios assume
the largest downgrade percentages in the A and BBB categories, the losses resulting from
downgrades are, by design, also the largest in these categories, while the losses in other rating
categories still amount to about €20 billion.

Overall, for the insurance sector, the losses from all downgrades amount to 4.9% in scenario 1 and
6.9% in scenario 2 in terms of pre-shock excess of assets over liabilities (EAOL). But such losses
on the corporate bond portfolios would not be directly reflected in the own funds of insurers. In fact,
the extent of this negative development in the own funds would depend on a series of factors not
included in this assessment. In particular, there are many loss-absorbing mechanisms which would
mitigate the actual impact of a downgrade on the insurers’ balance sheets. Profit-sharing
mechanisms would certainly alleviate pressure on own funds, and the volatility adjustment would
also likely offer a substantial countercyclical effect. Overall, these figures should not be considered
estimates of post-stress EAOL since they do not reflect any changes to liabilities offsetting the
estimated asset-side decrease. Consequently, while the figures help to understand the order of
magnitude of the shock, they cannot be considered a reliable estimate of the impact on the
solvency of insurers.

A system-wide scenario analysis of large-scale corporate bond downgrades
Results
 22
For the banking sector, these losses should be seen in relation to approximately €1.65 trillion of
CET1 capital. The losses may be concentrated within a smaller subset of banks, however, which
the present analysis cannot disentangle.

4.1.2 Amount of fallen angels

Table 11 shows the amount of fallen angels by sector and rating category for transition scenarios 1
and 2 respectively. The figures for banks are shaded in grey, as they are not assumed to contribute
to the sales volume. The estimates based on the above-mentioned transition matrices suggest that
the EU financial sector could face amounts between €232 billion and €443 billion. These estimated
amounts of fallen angels correspond almost directly to the figures obtained by multiplying the total
amount of BBB and A holdings (€967 billion and €782 billion, as stated above) with the average
percentage of downgrades (assumed to be, for EU assets, 3.1% for A-rated bonds and 25.2% for
BBB-rated bonds in scenario 1, compared with 12.3% for A-rated bonds and 45.3% for BBB-rated
bonds in scenario 2). A back-of-the-envelope estimate therefore implies that each percentage point
of additional downgrades in A and BBB holdings generates €7.8 billion and €9.7 billion of fallen
angels in each rating category respectively.

Table 11
Amount of fallen angels in transition scenarios 1 and 2

(EUR billions)

 Scenario 1

 EEA excluding United
 Global funds EU assets United Kingdom Kingdom

 Active Passive Funds – Pension
 Rating funds funds total Insurers funds Insurers Banks Total MMF

 A 1.9 0.8 2.6 12.6 0.9 6.0 4.4 26.4

 BBB 40.6 29.5 70.1 79.9 8.1 18.0 29.4 205.4

 P1 (short term) 0.0 15.2

 Total 42.5 30.3 72.7 92.5 9.0 24.0 33.7 231.8 15.2

 Scenario 2

 EEA excluding United
 Global funds EU assets United Kingdom Kingdom

 Active Passive Funds – Pension
 Rating funds funds total Insurers funds Insurers Banks Total MMF

 A 7.5 12.8 20.3 38.8 3.5 12.3 17.3 92.1

 BBB 72.9 51.8 124.7 126.5 14.5 32.6 52.8 351.0

 P1 (short term) 0.0 30.4

 Total 80.4 64.5 144.9 165.3 18.0 44.9 70.0 443.1 30.4

Source: ESA and ESRB Secretariat calculations.

A system-wide scenario analysis of large-scale corporate bond downgrades
Results
 23
4.1.3 Volume of estimated sales

The tables in the following subsections present estimates for the volume of assets that are sold
under each of the three behavioural scenarios described above. There are multiple reasons for why
institutions might choose (or be forced) to sell after a downgrade occurs, such as (i) discretionary
management decisions, (ii) internal risk management benchmarks, (iii) a desire to shrink the
balance sheet following a loss of equity, or (iv) regulatory restrictions or covenants. The mild
behavioural scenario focuses on stricter investment mandates that passive funds follow under
regulatory restrictions or conventions. The severe and extreme behavioural scenarios extend to
further reasons, but without taking a clear stance as to why exactly the sale was triggered.

For AAA-rated MMFs, issuer downgrades below P1 force them either to sell the bond or to let it
mature without rolling it over. MMFs are assumed to let short-term instruments mature (see
Section 3.2) and are therefore not included in the estimation of the price impact from forced sales
(see below). Overall, the reduction in short-term funding to issuers (mainly financial corporations)
would range between €15 billion and €30 billion (see Table 11).

Mild behavioural scenario

Under the mild scenario, only passive investment funds sell all of their fallen angels. Table 12
provides estimates of the volume of forced sales (in EUR billions) in this scenario. We focus on the
EU assets held by global funds, as the sales of EU corporate bonds by a US passive investment
fund will obviously affect the price of that asset held by all other EU institutions. Our estimates
suggest that in scenarios 1 and 2 an amount between €30.3 billion and €64.6 billion could be sold
by passive investment funds.

A system-wide scenario analysis of large-scale corporate bond downgrades
Results
 24
Table 12
Estimated volume of forced sales under the mild behavioural assumption in transition
scenarios 1 and 2

(EUR billions)

 Scenario 1

 EEA excluding United
 Global funds EU assets United Kingdom Kingdom

 Active Passive Funds – Pension
 Rating funds funds total Insurers funds Insurers Banks Total MMF

 A 0.8 0.8 0.8

 BBB 29.5 29.5 29.5

 P1 (short term) 0.0 15.2

 Total 30.3 30.3 15.2

 Scenario 2

 EEA excluding United
 Global funds EU assets United Kingdom Kingdom

 Active Passive Funds – Pension
 Rating funds funds total Insurers funds Insurers Banks Total MMF

 A 12.8 12.8 12.8

 BBB 51.8 51.8 51.8

 P1 (short term) 0.0 30.4

 Total 64.5 64.5 64.5 30.4

Source: ESA and ESRB Secretariat calculations.

Severe behavioural scenario

Under the severe behavioural scenario, passive investment funds sell all their fallen angels while
active funds sell 33.3%, insurers 20% and pension funds 10% of their fallen angels (see Table 13).
At a system level, this yields a total volume of assets sold of between €69 billion and €135 billion in
scenarios 1 and 2 respectively.

A system-wide scenario analysis of large-scale corporate bond downgrades
Results
 25
Table 13
Estimated volume of forced sales under the severe behavioural assumption in transition
scenarios 1 and 2

(EUR billions)

 Scenario 1

 EEA excluding United
 Global funds EU assets United Kingdom Kingdom

 Active Passive Funds – Pension
 Rating funds funds total Insurers funds Insurers Banks Total MMF

 A 0.6 0.8 1.4 2.5 0.1 1.2 5.2

 BBB 13.5 29.5 43.0 16.0 0.8 3.6 63.4

 P1 (short term) 0.0 15.2

 Total 14.2 30.3 44.4 18.5 0.9 4.8 0.0 68.6 15.2

 Scenario 2

 EEA excluding United
 Global funds EU assets United Kingdom Kingdom

 Active Passive Funds – Pension
 Rating funds funds total Insurers funds Insurers Banks Total MMF

 A 2.5 12.8 15.3 7.8 0.3 2.5 25.8

 BBB 24.3 51.8 76.1 25.3 1.5 6.5 109.4

 P1 (short term) 0.0 30.4

 Total 26.8 64.5 91.3 33.1 1.9 9.0 0.0 135.2 30.4

Source: ESA and ESRB Secretariat calculations.

Extreme behavioural scenario

Under this scenario, which is the most extreme hypothetical behavioural scenario in our framework,
all financial institutions except for banks sell all their fallen angels (see Table 14). Table 14 is
therefore, save for banks, identical to Table 11 in terms of the total amount of fallen angels under
both scenarios. In this case, estimates suggest that the volume liquidated is between €198 billion
and €313 billion. At these volumes of sales, which would reach almost 50% of the total initial BBB
market and exceed the total value (€388 billion as recorded in the SHS data) of all bonds rated BB
and below, we must again ask who the potential buyers of these distressed sold assets might be. It
is uncertain whether hedge funds, distressed debt funds and sovereign wealth funds would be able
or willing to absorb these volumes, especially if concentrated in time. In addition, in the light of the
volume of such potential sales relative to the high-yield market, one might conjecture that markets
could freeze or that forced sales of bonds would entail prices so severely depressed that
institutions might hold on to their assets. Insurers and pension funds with long-term business and
with no immediate liquidity pressure are likely to opt for the latter.

A system-wide scenario analysis of large-scale corporate bond downgrades
Results
 26
You can also read