Monthly Highlights - EUMOFA
←
→
Page content transcription
If your browser does not render page correctly, please read the page content below
Monthly Highlights
No. 2 / 2021

  In this issue                                             As of 2021, the Monthly Highlights include
                                                               Bulgaria among surveyed countries.
  According to data collected by EUMOFA from 13 EU
  Member States, in November 2020 striped venus
  and whelk together accounted for 12% of the total
                                                            Contents
  first-sales value of the “Bivalves and other molluscs
  and aquatic invertebrates” commodity group.                      First sales in Europe
                                                                   Striped venus (Italy, Spain) and whelk
  From 2018 to 2020, the price of live, fresh, or chilled          (Belgium, France, Netherlands)
  mussels imported in the EU from Norway fluctuated
  from 2,04 to 7,09 EUR/kg. In 2020, both price and                Extra-EU imports
  volume exhibited a downward trend.                               Weekly average EU import prices of
                                                                   selected products from
  Over the last four years, German consumers spent                 selected countries of origin
  the most for a kilogram of fresh cod,
                                                                   Consumption
  (18,00 EUR/kg on average) compared to France
                                                                   Fresh cod in Germany, France, and the
  (16,80 EUR/kg) and the Netherlands (16,30 EUR/kg).               Netherlands
  In 2019, the EU imports of fisheries and aquaculture
  products from South Africa accounted for over EUR                Case studies
  295 million and 80.597 tonnes. Hake, squid, and                  Fisheries and aquaculture in South
                                                                   Africa
  fishmeal constitute the bulk share of EU imports.
                                                                   Horse mackerel in the EU
  The largest market for horse mackerel exported by
  the EU is Egypt. In 2019, exports to the country                 Global highlights
  reached 54.000 tonnes, worth EUR 51 million,
  accounting for 50% of total export volume                        Macroeconomic context
  and 47% of value.                                                Marine fuel, consumer prices, and
  In January 2021, the EU and Greenland concluded                  exchange rates
  negotiations for a new four-year Sustainable
  Fisheries Partnership Agreement (SFPA), which is the
  third most important agreement in place for the EU
  in financial terms.
                                                               Find all data, information, and more at:
                                                                          www.eumofa.eu

                                                                      @EU_MARE #EUMOFA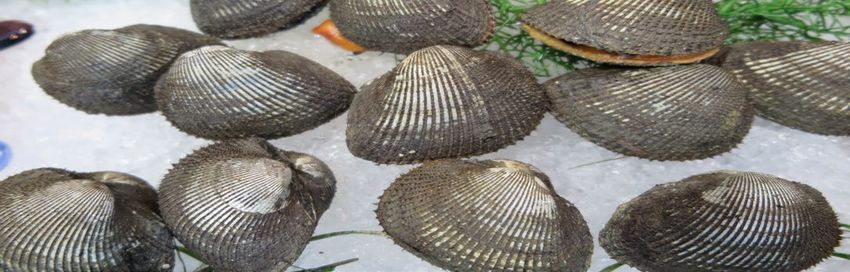
European Market Observatory for                                                                              MONTHLY HIGHLIGHTS | NO.2/2021
     Fisheries and Aquaculture Products                                                                                      FIRST SALES IN EUROPE

 1. First sales in Europe
 During January–November 2020, 13 EU Member States (MS), Norway, and the United Kingdom reported
 first-sales data for 10 commodity groups 1. First-sales data are based on sales notes and data collected from auction
 markets. First-sales data analysed in the section “First sales in Europe” are extracted from EUMOFA 2.

 1.1. January-November 2020 compared to the same period in 2019

 Increases in value and volume: Estonia and Lithuania were the only surveyed countries that recorded an increase in
 both first-sales value and volume. In Lithuania, the increase was sharp due to a higher supply of herring and sprat.

 Decreases in value and volume: Belgium, Bulgaria, Denmark, France, Italy, the Netherlands, Poland, and Sweden all
 recorded decreases in value and volume. Bulgaria stood out with the most significant decline, which was due to a lower
 supply of sprat, while decreases in Poland and Sweden were primarily caused by a decline in herring and sprat sales.

 Table 1.      JANUARY-NOVEMBER OVERVIEW OF FIRST SALES FROM THE REPORTING COUNTRIES
               (volume in tonnes and value in million EUR) *

                                                                                                                                Change from
                           January -                          January -                        January -
                                                                                                                                 January -
                         November 2018                      November 2019                    November 2020
                                                                                                                               November 2019
Country                Volume              Value          Volume            Value          Volume             Value           Volume           Value
Belgium                     13.012             55,11          12.424           53,08           11.316             50,54            -9%              -5%
Bulgaria                      2.995             2,07           4.784             2,60           2.514              1,65           -47%            -37%
Denmark                    257.916           345,54         241.078           324,96         197.141            256,07            -18%            -21%
Estonia                     43.595             11,06          55.849           12,30           58.112             14,97             4%             22%
France                     175.649           582,60         165.187           556,81         144.839            480,41            -12%            -14%
Italy                       87.736           318,89           87.784          338,11           76.751           288,90            -13%            -15%
Latvia                      44.534              8,03          48.264             8,15          44.259              9,08            -8%             11%
Lithuania                     1.603             1,17              854            0,64           2.168              0,85          154%              33%
Netherlands                329.168           507,48         225.971           353,96         213.727            325,23             -5%              -8%
Norway                   2.875.300         2.401,60       2.701.648        2.480,04        2.810.598          2.356,05              4%              -5%
Poland                     102.865             32,66          89.974           25,87           73.850             18,55           -18%            -28%
Portugal                                                                                                                          -21%            -14%
                           112.064           236,87         122.445           249,25           97.267           214,74
Spain                                                                                                                               3%              -3%
                           461.246         1.265,37         448.372        1.281,93          459.983          1.249,13
Sweden                                                                                                                            -32%            -20%
                           202.443             95,06        170.712            86,78         116.835              69,47
UK                         249.735           478,24         268.890           561,89         281.386            457,35              5%            -19%
 Possible discrepancies in % changes are due to rounding.
 * Volumes are reported in net weight for EU Member States and the UK, and in live weight equivalent (LWE) for Norway. Prices are reported in EUR/kg (without
 VAT). For Norway, prices are reported in EUR/kg of live weight.

 1
   Bivalves and other molluscs and aquatic invertebrates, cephalopods, crustaceans, flatfish, freshwater fish, groundfish, salmonids, small pelagics, tuna and
 tuna-like species, and other marine fish.
 2
   First sales data updated on 16.1.2021.

                               Overview | 1. First sales in Europe | 2. Extra-EU imports | 3. Consumption
                                                                                                                                                                 2
                  | 4. Fisheries and aquaculture in South Africa | 5. Horse mackerel in the EU | 6. Global highlights |
                                                                 7. Macroeconomic context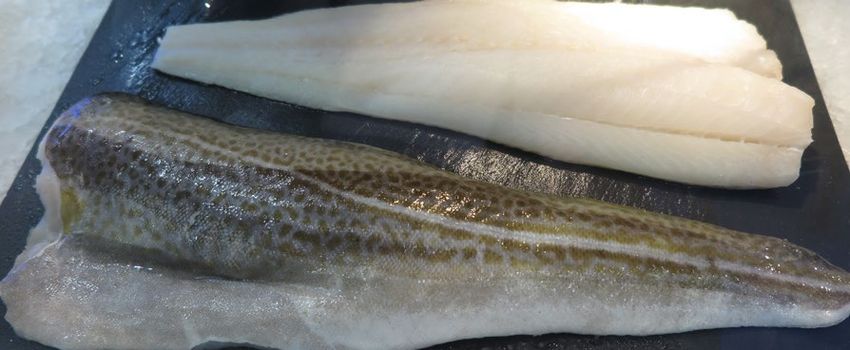
European Market Observatory for                                                                             MONTHLY HIGHLIGHTS | NO.2/2021
   Fisheries and Aquaculture Products                                                                                     FIRST SALES IN EUROPE

 1.2. November 2020 compared to November 2019

 Increases in value and volume: First sales increased in France, Latvia, Lithuania, the Netherlands, and Spain. Higher
 sales of herring were behind the sharp increases in Latvia, Lithuania, and the Netherlands, while sardine sales were
 behind increases in Spain.

 Decreases in value and volume: First sales fell in Denmark, Estonia, Norway, and Poland. The most significant
 decrease in absolute terms were observed in Norway and Poland, due to lower first-sales value and volume of herring.
 A lower supply of mackerel led to a sharp decrease in first sales in Denmark.

 Table 2.      NOVEMBER OVERVIEW OF FIRST SALES FROM THE REPORTING COUNTRIES
               (volume in tonnes and value in million EUR) *

                                                                                                                            Change from
                          November 2018                   November 2019                   November 2020
                                                                                                                           November 2019

Country                 Volume            Value          Volume           Value          Volume          Value          Volume             Value
Belgium                      1.446            5,76            1.144            5,37          1.153            4,27             1%             -21%
Bulgaria                        343           0,25              312            0,25            308            0,31            -1%              25%
Denmark                     38.109           46,48           31.237           38,11         21.036           23,96          -33%              -37%
Estonia                      6.023            1,89            8.621            1,70          7.663            1,61          -11%               -6%
France                      15.915           52,82           14.284           47,08         15.393           48,92             8%               4%
Italy                        7.912           28,22            6.962           27,73          7.272           26,61             4%              -4%
Latvia                       8.492            1,43            4.139            0,75          5.168            1,05           25%               40%
Lithuania                       271           0,12              124            0,05            369            0,11          196%             113%
Netherlands                 19.984           39,11            4.534           19,75         11.217           22,78          147%               15%
Norway                    298.573          253,73          296.127          248,43        218.055          189,01           -26%              -24%
Poland                       9.209            2,99            5.452            1,63            916            0,24          -83%              -85%
Portugal
                             6.498           16,85            9.634           15,27          8.089           17,26          -16%               13%
Spain                                                                                                                        40%                8%
                            42.138         115,93            27.854           98,93         39.010         106,80
Sweden                                                                                                                         1%
                            20.466            8,53           14.805            6,86         14.905            6,16                            -10%
UK                          38.348           77,30           25.630           54,15         28.854           46,30           13%              -14%
 Possible discrepancies in % changes are due to rounding.
 * Volumes are reported in net weight for EU Member States and the UK, and in live weight equivalent (LWE) for Norway. Prices are reported in EUR/kg (without
 VAT). For Norway, prices are reported in EUR/kg of live weight.

The most recent weekly first-sales data (up to week 7 of 2021) are available via the EUMOFA website, and can
be accessed here.

The most recent monthly first-sales data for December 2020 are available via the EUMOFA website, and can be
accessed here.

                               Overview | 1. First sales in Europe | 2. Extra-EU imports | 3. Consumption
                                                                                                                                                                3
                  | 4. Fisheries and aquaculture in South Africa | 5. Horse mackerel in the EU | 6. Global highlights |
                                                               7. Macroeconomic context
European Market Observatory for                                                                          MONTHLY HIGHLIGHTS | NO.2/2021
    Fisheries and Aquaculture Products                                                                                  FIRST SALES IN EUROPE

1.3. First sales in selected countries
First sales data analysed in this section are extracted from EUMOFA 3.

Table 3.        FIRST SALES OF THE MAIN COMMERCIAL SPECIES 4 IN BELGIUM
                              First-sales             First-sales              Main contributing species
                              value / trend %         volume / trend %
           Belgium

    Jan-Nov 2020 vs           EUR 50,5 million,       11.316 tonnes,           European plaice, turbot, other sole* (i.e. other than common sole),
    Jan-Nov 2019              -5%                     -9%                      shrimp Crangon spp., cod.
    Nov 2020 vs               EUR 4,3 million,        1.153 tonnes,            Value: Common sole, European plaice, turbot.
    Nov 2019                  -21%                    +1%                      Volume: gurnard, cod, other sole*.

Figure 1.       FIRST SALES OF THE MAIN COMMERCIAL SPECIES IN BELGIUM, NOVEMBER 2020

                         -41%                 -19%
     200                                                                                                                                   1.500
              -19%
     150                                                                                                                                   1.200
                                                                                                                                           900
     100                                                                                                     +114%
                                                         -20%                                                                              600
      50                                                                                 -36%                                              300
                                                                               -22%                                       +41%

                Common sole                 European plaice                       Turbot                       Gurnard

                                                     Volume (tonnes)                Value (EUR 1000)
Percentages show change from the previous year. *EUMOFA aggregation for species. (Metadata 2, Annex 3: http://eumofa.eu/supply-balance-and-other-
methodologies).

Table 4.        FIRST SALES OF THE MAIN COMMERCIAL SPECIES IN BULGARIA
                                  First-sales             First-sales               Main contributing species
                                  value / trend %         volume / trend %
            Bulgaria

    Jan-Nov 2020 vs               EUR 1,6 million,        2.514 tonnes,             Molluscs and aquatic invertebrates (other)*, sprat, clam.
    Jan-Nov 2019                  -37%                    -47%
    Nov 2020 vs                   EUR 0,3 million,        308 tonnes,               Value: clam, other marine fish*.
    Nov 2019                      +25%                    -1%                       Volume: molluscs and aquatic invertebrates (other)*,
                                                                                    red mullet.

3
    First-sales data updated on 16.12.2020.
4
    Data on fisheries and aquaculture products harmonised in EUMOFA allow comparisons along the different supply chain stages in EUMOFA.

                                Overview | 1. First sales in Europe | 2. Extra-EU imports | 3. Consumption
                                                                                                                                                     4
                   | 4. Fisheries and aquaculture in South Africa | 5. Horse mackerel in the EU | 6. Global highlights |
                                                               7. Macroeconomic context
European Market Observatory for                                                                         MONTHLY HIGHLIGHTS | NO.2/2021
 Fisheries and Aquaculture Products                                                                                 FIRST SALES IN EUROPE

Figure 2.     FIRST SALES OF THE MAIN COMMERCIAL SPECIES IN BULGARIA, NOVEMBER 2020

   100                  +3%                +1529%                                                           -24%                            120
                                                       +1207%
     75                                                                                                                 -8%                 90
                                                                              -55%
     50      +18%                                                                                                                           60

     25                                                                                   -60%                                              30

                 Clam                     Other marine fish*            Molluscs and aquatic                 Red mullet
                                                                        invertebrates, other*

                                                  Volume (tonnes)                  Value (EUR 1000)
Percentages show change from the previous year. *EUMOFA aggregation for species.

Table 5.      FIRST SALES OF THE MAIN COMMERCIAL SPECIES IN DENMARK
                           First-sales                First-sales             Main contributing               Notes
                           value / trend %            volume / trend %        species
       Denmark

 Jan-Nov 2020 vs           EUR 256,1 million,         197.141 tonnes,         Norway lobster, cod,            The sharp decrease in first sales of
 Jan-Nov 2019              -21%                       -18%                    mackerel, saithe.               mackerel is mostly the result of a
                                                                                                              change in fishing strategies.
 Nov 2020 vs               EUR 24,0 million,          21.036 tonnes,          Mackerel, Norway lobster,       Catches by Danish vessels largely
 Nov 2019                  -37%                       -33%                    hake, clam.                     took place in early 2020. Prices
                                                                                                              were strong but a risk of a possible
                                                                                                              Brexit deadline in June meant that
                                                                                                              only very limited quotas were left
                                                                                                              for the autumn period.

Figure 3.     FIRST SALES OF THE MAIN COMMERCIAL SPECIES IN DENMARK, NOVEMBER 2020

                                                         -43%
       800                                                                                                                          2.000
                                                                                                        -61%
       600                                                                                                                          1.500

       400                                     -53%                                                                                 1.000
                                                                                      -58%
       200                                                                  -60%                                   -76%             500
                  -99%
                          -100%

                  Mackerel                     Norway lobster                      Hake                     Clam
                                                  Volume (tonnes)                  Value (EUR 1000)
Percentages show change from the previous year.

Table 6.      FIRST SALES OF THE MAIN COMMERCIAL SPECIES IN ESTONIA
                           First-sales              First-sales             Main contributing species
                           value / trend %          volume / trend %
        Estonia

 Jan-Nov 2020 vs           EUR 15,0 million,        58.112 tonnes,          Pike-perch, other freshwater fish*, smelt, herring.
 Jan-Nov 2019              +22%                     +4%
 Nov 2020 vs               EUR 1,6 million,         7.663 tonnes,           Sprat, herring, pike, other freshwater fish*.
 Nov 2019                  -6%                      -11%

                             Overview | 1. First sales in Europe | 2. Extra-EU imports | 3. Consumption
                                                                                                                                                     5
                | 4. Fisheries and aquaculture in South Africa | 5. Horse mackerel in the EU | 6. Global highlights |
                                                            7. Macroeconomic context
European Market Observatory for                                                                         MONTHLY HIGHLIGHTS | NO.2/2021
 Fisheries and Aquaculture Products                                                                                 FIRST SALES IN EUROPE

Figure 4.     FIRST SALES OF THE MAIN COMMERCIAL SPECIES IN ESTONIA, NOVEMBER 2020

      5.000                 -16%                                                                                                    800
                    -11%
      4.000                                              -9%
                                                -13%                                                                                600
      3.000
                                                                                                                                    400
      2.000
                                                                                                                 +70%
                                                                                                                                    200
      1.000
                                                                           -17% -32%                  +101%

                       Sprat                      Herring                          Pike           Other freshwater fish*
                                                  Volume (tonnes)                  Value (EUR 1000)
Percentages show change from the previous year. *EUMOFA aggregation for species

Table 7.      FIRST SALES OF THE MAIN COMMERCIAL SPECIES IN FRANCE
                                 First-sales             First-sales                  Main contributing species
                                 value / trend %         volume / trend %
            France

 Jan-Nov 2020 vs                 EUR 480,4 million,      144.839 tonnes,              Monk, hake, squid, cuttlefish, anchovy, albacore tuna.
 Jan-Nov 2019                    -14%                    -12%
 Nov 2020 vs                     EUR 48,9 million,       15.393 tonnes,               Scallop, Norway lobster, common sole, hake.
 Nov 2019                        +4%                     +8%

Figure 5.     FIRST SALES OF THE MAIN COMMERCIAL SPECIES IN FRANCE, NOVEMBER 2020

      3.500        +30%        +24%                                                                                                     10.000
      3.000
      2.500                                                                                                                             7.500
      2.000
                                                                                          +15%                                          5.000
      1.500                                                                                                            +12%
      1.000                                                                                               +25%
                                                          +85%                                                                          2.500
        500                                     +108%                        +49%

                      Scallop                     Norway lobster                  Common sole                   Hake

                                                  Volume (tonnes)                    Value (EUR 1000)
Percentages show change from the previous year.

Table 8.      FIRST SALES OF THE MAIN COMMERCIAL SPECIES IN ITALY
                            First-sales              First-sales              Main contributing species
                            value / trend %          volume / trend %
           Italy

 Jan-Nov 2020 vs            EUR 288,9 million,       76.751 tonnes,           Miscellaneous shrimps*, clam, anchovy, cuttlefish, red mullet,
 Jan-Nov 2019               -15%                     -13%                     sardine.
 Nov 2020 vs                EUR 26,6 million,        7.272 tonnes,            Value: clam, squillid.
 Nov 2019                   -4%                      +4%                      Volume: anchovy, sardine.

                                Overview | 1. First sales in Europe | 2. Extra-EU imports | 3. Consumption
                                                                                                                                                 6
                   | 4. Fisheries and aquaculture in South Africa | 5. Horse mackerel in the EU | 6. Global highlights |
                                                            7. Macroeconomic context
European Market Observatory for                                                                        MONTHLY HIGHLIGHTS | NO.2/2021
 Fisheries and Aquaculture Products                                                                                FIRST SALES IN EUROPE

Figure 6.     FIRST SALES OF THE MAIN COMMERCIAL SPECIES IN ITALY, NOVEMBER 2020

  2.000                                                                     +107% -19%                                                  4.000
                                                                                                          +31%
  1.500                                                                                                                                 3.000
                        -38%                                                                                          +25%
  1.000       -42%                                                                                                                      2.000
                                                         -49%
    500                                       -50%                                                                                      1.000

                    Clam                          Squillid                     Anchovy                      Sardine
                                              Volume (tonnes)                           Value (EUR 1000)
Percentages show change from the previous year. *EUMOFA aggregation for species.

Table 9.      FIRST SALES OF THE MAIN COMMERCIAL SPECIES IN LATVIA
                           First-sales             First-sales              Main contributing species
                           value / trend %         volume / trend %
         Latvia

 Jan-Nov 2020 vs           EUR 9,1 million,        44.259 tonnes,           Value: herring, other freshwater fish*, other marine fish*, cod
 Jan-Nov 2019              +11%                    -8%                      Volume: sprat, smelt, European flounder.
 Nov 2020 vs               EUR 1,1 million,        5.168 tonnes,            Herring, sprat, smelt.
 Nov 2019                  +40%                    +25%

Figure 7.     FIRST SALES OF THE MAIN COMMERCIAL SPECIES IN LATVIA, NOVEMBER 2020

      3.000         +53%                                                                                                                      600
                                  +66%                                      +27%
      2.500                                                  +11%                                                                             500
      2.000                                                                                                                                   400
      1.500                                                                                                                                   300
      1.000                                                                                                                                   200
        500                                                                                                                                   100
                                                                                                   +13%          +28%

                        Herring                                     Sprat                                Smelt
                                              Volume (tonnes)                      Value (EUR 1000)
Percentages show change from the previous year.

Table 10. FIRST SALES OF THE MAIN COMMERCIAL SPECIES IN LITHUANIA
                           First-sales             First-sales              Main contributing           Notes
                           value / trend %         volume/ trend %          species
       Lithuania

 Jan-Nov 2020 vs           EUR 0,9 million,        2.168 tonnes,            Herring, sprat, European    The increases in first sales recorded for
 Jan-Nov 2019              +33%                    +154%                    flounder, other             sprat are linked to the expansion of the
                                                                            groundfish*, pike-perch.    Latvian and Estonian fish processing
 Nov 2020 vs               EUR 0,1 million,        369 tonnes,              Herring, sprat, cod.        companies and changes to the transport
 Nov 2019                  +113%                   +196%                                                procedure for sprat. Moreover, fishery
                                                                                                        restrictions, laid down in COUNCIL
                                                                                                        REGULATION          (EU)       2019/1838
                                                                                                        of 30th October 2019, led to many
                                                                                                        fishing activities shifting from the first
                                                                                                        half of 2020 to November.

                               Overview | 1. First sales in Europe | 2. Extra-EU imports | 3. Consumption
                                                                                                                                                     7
                  | 4. Fisheries and aquaculture in South Africa | 5. Horse mackerel in the EU | 6. Global highlights |
                                                             7. Macroeconomic context
European Market Observatory for                                                                     MONTHLY HIGHLIGHTS | NO.2/2021
 Fisheries and Aquaculture Products                                                                             FIRST SALES IN EUROPE

Figure 8.      FIRST SALES OF THE MAIN COMMERCIAL SPECIES IN LITHUANIA, NOVEMBER 2020

       2.000                    +143%                                                                                                  80

       1.500                                                                                                                           60

       1.000                                                                                                                           40
                                                                          +682%
         500       +158%                                                                                                               20
                                                             +663%                                +4518%      +4957%

                         Herring                                  Sprat                                Cod
                                               Volume (tonnes)                 Value (EUR 1000)
Percentages show change from the previous year.

Table 11. FIRST SALES OF THE MAIN COMMERCIAL SPECIES IN THE NETHERLANDS
                           First-sales                First-sales            Main contributing        Notes
                           value / trend %            volume / trend %       species
  The Netherlands

 Jan-Nov 2020 vs           EUR 325,2 million,         213.727 tonnes,        Blue whiting, common     Dutch mackerel production increased
 Jan-Nov 2019              -8%                        -5%                    sole, Atlantic horse     from 6 tonnes in November 2019 to
                                                                             mackerel, European       1.600 tonnes in November 2020
                                                                             plaice.                  (+26713%).        Atlantic        horse
 Nov 2020 vs               EUR 22,8 million,          11.217 tonnes,         Common sole,             mackerel stocks strongly fluctuated
 Nov 2019                  +15%                       +147%                  mackerel, Atlantic       across the different years too. While
                                                                             horse mackerel,          the production of these two species
                                                                             cuttlefish.              often strongly fluctuates, usually due
                                                                                                      to the opportunistic strategies of large
                                                                                                      pelagic vessels, these trends are
                                                                                                      mostly due to statistical artefacts as if
                                                                                                      one compare 2020 data with 2018
                                                                                                      data, fluctuation is not as big as that
                                                                                                      between 2019 and 2020.

Figure 9.      FIRST SALES OF THE MAIN COMMERCIAL SPECIES IN THE NETHERLANDS, NOVEMBER 2020

                         -26%             +26713%
    1.600                                                                                                                          6.000
                                                                          +30183%                                                  5.000
    1.200
                                                                                                                                   4.000
               +25%
      800                                                                                                                          3.000
                                                        +11304%                                                                    2.000
      400                                                                          +49122%
                                                                                                     +157% +87%                    1.000

                Common sole                       Mackerel             Atlantic horse mackerel         Cuttlefish

                                                     Volume (tonnes)              Value (EUR 1000)
Percentages show change from the previous year.

                             Overview | 1. First sales in Europe | 2. Extra-EU imports | 3. Consumption
                                                                                                                                                  8
                | 4. Fisheries and aquaculture in South Africa | 5. Horse mackerel in the EU | 6. Global highlights |
                                                             7. Macroeconomic context
European Market Observatory for                                                                        MONTHLY HIGHLIGHTS | NO.2/2021
 Fisheries and Aquaculture Products                                                                                FIRST SALES IN EUROPE

Table 12. FIRST SALES OF THE MAIN COMMERCIAL SPECIES IN NORWAY
                              First-sales                First-sales              Main contributing species
                              value / trend %            volume / trend %
         Norway

 Jan-Nov 2020 vs              EUR 2.356 million,         2.810.598 tonnes,        Value: cod, haddock, coldwater shrimp.
 Jan-Nov 2019                 -5%                        +4%                      Volume: other groundfish*, mackerel, blue whiting.
 Nov 2020 vs                  EUR 189,0 million          218.055 tonnes,          Cod, herring, haddock, Greenland halibut.
 Nov 2019                     -24%                       -26%

Figure 10. FIRST SALES OF THE MAIN COMMERCIAL SPECIES IN NORWAY, NOVEMBER 2020

   150.000                                                                                                                             80.000
                                                  -29% -10%
   120.000                                                                                                                             60.000
     90.000
                           -50%                                                                                                        40.000
     60.000
     30.000      -38%                                                                                                                  20.000
                                                                              -29%      -44%
                                                                                                          -11%      -60%

                        Cod                         Herring                       Haddock               Greenland halibut
                                                      Volume (tonnes)                 Value (EUR 1000)
Percentages show change from the previous year. *EUMOFA aggregation for species

Table 13. FIRST SALES OF THE MAIN COMMERCIAL SPECIES IN POLAND
                               First-sales            First-sales             Main contributing species
                               value / trend %        volume / trend %
          Poland

 Jan-Nov 2020 vs               EUR 18,6 million,      73.850 tonnes,          Cod, European flounder, herring, sprat.
 Jan-Nov 2019                  -28%                   -18%
 Nov 2020 vs                   EUR 0,2 million        916 tonnes,             Herring, European flounder, sprat, European plaice.
 Nov 2019                      -85%                   -83%

Figure 11. FIRST SALES OF THE MAIN COMMERCIAL SPECIES IN POLAND, NOVEMBER 2020

       600      -83%        -83%                                                                                                        180
       500                                                                                                                              150
       400                                                                   -76%                                                       120
       300                                                                               -70%                                           90
       200                                                                                                                              60
       100                                        -96%     -97%                                                                         30
                                                                                                            -99% -99%

                     Herring                 European flounder                     Sprat                   European plaice
                                                   Volume (tonnes)                  Value (EUR 1000)
Percentages show change from the previous year.

                             Overview | 1. First sales in Europe | 2. Extra-EU imports | 3. Consumption
                                                                                                                                                9
                | 4. Fisheries and aquaculture in South Africa | 5. Horse mackerel in the EU | 6. Global highlights |
                                                              7. Macroeconomic context
European Market Observatory for                                                                            MONTHLY HIGHLIGHTS | NO.2/2021
 Fisheries and Aquaculture Products                                                                                    FIRST SALES IN EUROPE

Table 14. FIRST SALES OF THE MAIN COMMERCIAL SPECIES IN PORTUGAL
                            First-sales               First-sales                 Main contributing species
                            value / trend %           volume / trend %
       Portugal

 Jan-Nov 2020 vs            EUR 214,7 million,        97.267 tonnes,              Mackerel, anchovy, squid, Atlantic horse mackerel.
 Jan-Nov 2019               -14%                      -21%
 Nov 2020 vs                EUR 17,3 million          8.089 tonnes,               Anchovy, octopus, squid, mackerel.
 Nov 2019                   +13%                      -16%

Figure 12. FIRST SALES OF THE MAIN COMMERCIAL SPECIES IN PORTUGAL, NOVEMBER 2020

    3.000                                                 +90%                                                                               2.400
                                                                                                             -54%
                         +2091%                                                                                                              1.800
    2.000
                                                                                                                       -43%                  1.200
              +9432%
    1.000                                                                               -49%
                                                                                                                                             600
                                             +108%
                                                                              -51%

                  Anchovy                          Octopus                         Squid                        Mackerel

                                                   Volume (tonnes)                   Value (EUR 1000)
Percentages show change from the previous year.

Table 15. FIRST SALES OF THE MAIN COMMERCIAL SPECIES IN SPAIN
                            First-sales               First-sales               Main contributing           Notes
                            value / trend in %        volume / trend %          species
         Spain

 Jan-Nov 2020 vs            EUR 1.249,1 million,      459.983 tonnes,           Value: hake, clam,          Sardine recruitment in the Cantabrian
 Jan-Nov 2019               -3%                       +3%                       octopus.                    Sea and Atlantic Iberian waters has
                                                                                Volume: squid,              increased significantly over the last two
                                                                                sardine, mackerel.          years. The higher recruitment in 2019
 Nov 2020                   EUR 106,8 million         39.010 tonnes,            Sardine, bigeye tuna,       caused an upward revision of the initial
 vs Nov 2019                +8%                       +40%                      warmwater shrimp,           catch advice 5, which explains the abrupt
                                                                                mackerel.                   increase in first-sales value and volume.

Figure 13. FIRST SALES OF THE MAIN COMMERCIAL SPECIES IN SPAIN, NOVEMBER 2020

   6.000 +289%            +86%                                                                                                                 4.000
   5.000
                                                                                         +171%                                                 3.000
   4.000
                                                         +847%
   3.000                                                                                                                                       2.000
                                                                                                               +112% +84%
   2.000                                      +883%                                                                                            1.000
   1.000                                                                      +542%

                  Sardine                         Bigeye tuna                Warmwater shrimp                     Mackerel
                                                  Volume (tonnes)                   Value (EUR 1000)
Percentages show change from the previous year.

5
  ICES. 2020b. Request from Portugal and Spain for an updated advice for 2020 on catch opportunities for sardine (Sardina pilchardus) in divisions 8.c and
9.a (Cantabrian Sea and Atlantic Iberian waters). In Report of the ICES Advisory Committee, 2020. ICES Advice 2020, sr.2020.06.
https://doi.org/10.17895/ices.advice.6063.

                              Overview | 1. First sales in Europe | 2. Extra-EU imports | 3. Consumption
                                                                                                                                                        10
                 | 4. Fisheries and aquaculture in South Africa | 5. Horse mackerel in the EU | 6. Global highlights |
                                                             7. Macroeconomic context
European Market Observatory for MONTHLY HIGHLIGHTS | NO.2/2021
Fisheries and Aquaculture Products FIRST SALES IN EUROPE
Table 16. FIRST SALES OF THE MAIN COMMERCIAL SPECIES IN SWEDEN
First-sales First-sales Main contributing species
value / trend in % volume / trend %
Sweden
Jan-Nov 2020 vs EUR 69,5 million, 116.835 tonnes, Herring, sprat, cod, mackerel.
Jan-Nov 2019 -20% -32%
Nov 2020 vs EUR 6,2 million, 14.905 tonnes, Value: sprat, Norway lobster, cod, herring.
Nov 2019 -10% +1% Volume: sprat.
Figure 14. FIRST SALES OF THE MAIN COMMERCIAL SPECIES IN SWEDEN, NOVEMBER 2020
8.000 -17% -12% 2.000
+34%
6.000 -28% 1.500
4.000 1.000
-31%
2.000 -15% 500
-39%
-53%
Sprat Norway lobster Herring Cod
Volume (tonnes) Value (EUR 1000)
Percentages show change from the previous year.
Table 17. FIRST SALES OF THE MAIN COMMERCIAL SPECIES IN THE UNITED KINGDOM
First-sales First-sales Main contributing species
value / trend % volume / trend %
The United Kingdom
Jan-Nov 2020 vs EUR 457,4 million, 281.386 tonnes, Value: Norway lobster, crab, cod.
Jan-Nov 2019 -19% +5% Volume: mackerel, blue whiting.
Nov 2020 vs EUR 46,3 million 28.854 tonnes, Value: Norway lobster, cod, scallop.
Nov 2019 -14% +13% Volume: mackerel.
Figure 15. FIRST SALES OF THE MAIN COMMERCIAL SPECIES IN THE UNITED KINGDOM, NOVEMBER 2020
+67% +30%
15.000 16.000
12.000 12.000
9.000
8.000
6.000
-45%
3.000 -46% -20% -36% 4.000
-32% -54%
Norway lobster Cod Scallop Mackerel
Volume (tonnes) Value (EUR 1000)
Percentages show change from the previous year.
Overview | 1. First sales in Europe | 2. Extra-EU imports | 3. Consumption
11
| 4. Fisheries and aquaculture in South Africa | 5. Horse mackerel in the EU | 6. Global highlights |
7. Macroeconomic contextEuropean Market Observatory for MONTHLY HIGHLIGHTS | NO.2/2021
Fisheries and Aquaculture Products FIRST SALES IN EUROPE
1.4. Comparison of first-sales prices of selected species in selected countries 6
Figure 16. FIRST-SALES PRICES OF EUROPEAN PLAICE IN BELGIUM, DENMARK, AND THE NETHERLANDS
3,30
3,10
2,90
2,70
2,50
EUR/kg
2,30
2,10
1,90
1,70
1,50
2018-M01
2018-M03
2018-M05
2018-M07
2018-M09
2018-M11
2019-M01
2019-M03
2019-M05
2019-M07
2019-M09
2019-M11
2020-M01
2020-M03
2020-M05
2020-M07
2020-M09
2020-M11
Belgium Denmark Netherlands
Denmark, the Netherlands, and Belgium are among the main EU countries in terms of first sales of European plaice.
Average prices in November 2020 (the most recent available data) were 2,49 EUR/kg in Belgium (down by 2% from the
previous month and down by 1% from the previous year), and 2,45 EUR/kg in Denmark (3% up from both October 2020 and
November 2019). In the Netherlands, the average price was 2,32 EUR/kg (unchanged from October 2020 and 9% down from
November 2019). In November 2020, first-sales volume decreased in both Belgium and the Netherlands, by 19% and
12% respectively, and increased by 8% in Denmark, relative to the previous year. Over the 36-month period, prices decreased
in all three markets, most notably in the Netherlands. During the same period, supply fell in Belgium and the Netherlands, and
remained stable in Denmark. European plaice fisheries are seasonal, with different peaks for each of the three countries:
December–January in Belgium, June–August in Denmark, and May–June in the Netherlands.
Figure 17. FIRST-SALES PRICES OF ROCK LOBSTER AND SEA CRAWFISH IN FRANCE, ITALY, AND SPAIN
80,00
70,00
60,00
50,00
EUR/kg
40,00
30,00
20,00
10,00
0,00
2018-M01
2018-M03
2018-M05
2018-M07
2018-M09
2018-M11
2019-M01
2019-M03
2019-M05
2019-M07
2019-M09
2019-M11
2020-M01
2020-M03
2020-M05
2020-M07
2020-M09
2020-M11
France Italy Spain
EU first sales of rock lobster and sea crawfish occur in multiple countries, including France, Italy, and Spain. In November
2020, the average first-sales prices of rock lobster and sea crawfish were: 39,67 EUR/kg in France (up from both the previous
month and year by 24% and 146%, respectively); 40,01 EUR/kg in Italy (unchanged from October 2020, and down
by 3% from November 2019); and 17,20 EUR/kg in Spain (12% lower than October 2020, and 5% lower than November
2019). In November 2020, supply increased in France (+27%) and Spain (+61%) and decreased in Italy (–13%) relative to
November 2019. Over the past 36 months, both prices and supply of rock lobster and sea crawfish have increased in all three
countries. First-sales volume is highly seasonal, with similar peaks (July–August) seen in all three countries.
6
First sales data updated on 16.01.2021.
Overview | 1. First sales in Europe | 2. Extra-EU imports | 3. Consumption
12
| 4. Fisheries and aquaculture in South Africa | 5. Horse mackerel in the EU | 6. Global highlights |
7. Macroeconomic contextEuropean Market Observatory for MONTHLY HIGHLIGHTS | NO.2/2021
Fisheries and Aquaculture Products FIRST SALES IN EUROPE
Figure 18. FIRST-SALES PRICES OF DEEP–WATER ROSE SHRIMP IN ITALY, PORTUGAL, AND SPAIN
25,00
20,00
15,00
EUR/kg
10,00
5,00
0,00
2018-M01
2018-M03
2018-M05
2018-M07
2018-M09
2018-M11
2019-M01
2019-M03
2019-M05
2019-M07
2019-M09
2019-M11
2020-M01
2020-M03
2020-M05
2020-M07
2020-M09
2020-M11
Italy Portugal Spain
EU first sales of deep-water rose shrimp occur predominantly in Spain, as well as in Italy, and Portugal. In November
2020, the average first-sales prices of deep-water rose shrimp were: 3,88 EUR/kg in Italy (down from both the previous
month and year by 2% and 5%, respectively); 13,58 EUR/kg in Portugal (14% lower than both October 2020 and November
2019); 10,19 EUR/kg in Spain (down by 14% from October 2020 and down by 11% from November 2019). In November
2020, supply increased in all three countries compared to November 2019: in Italy by 15%, Portugal by 17%, and Spain
by 47%. Over the past 36-month period, prices increased slightly in Spain and Portugal, and decreased moderately in Italy.
Over the past three years, supply increased in Portugal and Spain, and decreased in Italy. Supply is seasonal, with similar
peaks across the three countries between April and August.
1.5. Commodity group of the month: Bivalves and other molluscs and aquatic
invertebrates 7
Figure 19. FIRST-SALES COMPARISON AT CG, MCS, AND ERS LEVELS FOR REPORTING COUNTRIES 8, DECEMBER
2017 - NOVEMBER 2020
45,0
30,0
Value (million EUR)
15,0
0,0
2017 2018 2019 2020
Bivalves (CG) Clam (MCS)
Molluscs and aquatic invertebrates, other (MCS) Whelk (ERS)
Striped venus (ERS)
The “Bivalves and other molluscs and aquatic invertebrates 9” commodity group (CG 10) recorded the seventh-highest
first-sales value and fourth-highest volume out of the 10 CGs recorded in November 2020 11. First sales reached a value of
EUR 22 million and a volume of 9.328 tonnes, representing decreases of 20% and 17%, respectively, from November 2019.
In the past 36 months, the highest first-sales value of bivalves was registered at EUR 41,4 million (November 2019).
7
First sales data updated on 16.1.2021.
8
Norway and the UK excluded from the analyses.
9
In the further text bivalves refers to “Bivalves and other molluscs and aquatic invertebrates“
10
Annex 3: http://eumofa.eu/supply-balance-and-other-methodologies
11
More data on commodity groups can be found in Table 1.2 of the Annex.
Overview | 1. First sales in Europe | 2. Extra-EU imports | 3. Consumption
13
| 4. Fisheries and aquaculture in South Africa | 5. Horse mackerel in the EU | 6. Global highlights |
7. Macroeconomic contextEuropean Market Observatory for MONTHLY HIGHLIGHTS | NO.2/2021
Fisheries and Aquaculture Products FIRST SALES IN EUROPE
The bivalves and other molluscs and aquatic invertebrates commodity group includes 10 main commercial species (MCS):
abalone, clam, jellyfish, mussel Mytilus spp., other mussel, oyster, scallop, sea cucumber, sea urchin, other molluscs and other
invertebrates 12.
At Electronic Recording and Reporting System (ERS) level, striped venus (10%) and whelk (2%) together accounted
for 12% of bivalves total first-sales value recorded in November 2020.
1.6. Focus on striped venus
Striped venus (Chamelea gallina) is a species of small saltwater clam, a marine bivalve in the family Veneridae,
the venus clams. Striped venus can be found on Eastern Atlantic coasts, from Norway and the British Isles, to
Portugal, Morocco, Madeira, and the Canary Islands. It is also found in the Mediterranean Sea and the Black
Sea and is abundant in the Adriatic Sea. This species is found buried in sand and muddy sand from the lower
shore to depths of approximately 55 m 13.
Despite a relatively low production in Europe, clams are a high-value seafood product, economically important in many
European countries, particularly in Spain, Italy, and Portugal. It is caught with dredges, occasionally with bottom trawls. The
hydraulically dredged striped venus fishery in the Adriatic is of paramount importance, mainly for Italy. In Croatia, striped
venus is present at the Neretva estuary, although fishing activity for this fishery is practically negligible and most catches are
harvested manually 14.
The European Union regulates the exploitation of clams in the Mediterranean Sea through Council Regulation (EC)
No 1967/2006 15, which sets a minimum size of 25 mm for exploitation of mollusc bivalves. Italy, however, has benefitted
from a four-year derogation deriving from the Landing Obligation (Articles 15 and 18.3 of EU Reg. 1380/2013 16), decreed
with EU Delegated Reg. 2020/2237 17 which led to the minimum conservation reference size being set at 22 mm. This
derogation lasted until 31 December 2020.
The species is sold commercially fresh, frozen, and canned, and is usually eaten steamed.
Selected countries
Table 18. COMPARISON OF STRIPED VENUS FIRST-SALES PRICES, MAIN PLACES OF SALE, AND
CONTRIBUTION TO OVERALL SALES OF BIVALES IN ITALY AND SPAIN
Changes in striped venus
Striped venus first sales Contribution of Principal places of
Jan-Nov 2020 (%) striped venus to total sale Jan-Nov 2020 in
Compared to Compared to bivalves first sales in terms of first-sales
Jan-Nov Jan-Nov November 2020 (%) value
2019 2018
Italy Value -18% -28% 65% Giulianova, Fano, Ancona.
Volume -19% -19% 71%
Spain Value +13% +326% 11% Punta Umbría, Sanlúcar
de Barrameda, Isla
Volume +6% +470% 18% Cristina.
12
EUMOFA aggregation for species (Metadata 2, Annex 3: http://eumofa.eu/supply-balance-and-other-methodologies).
13
https://www.marlin.ac.uk/species/detail/2000
14
https://www.europarl.europa.eu/RegData/etudes/STUD/2016/573412/IPOL_STU(2016)573412_EN.pdf
15
Regulation (EC) No 1967/2006 https://eur-lex.europa.eu/legal-content/EN/TXT/?uri=CELEX%3A02006R1967-20190814
16
Regulation (EU) No 1380/2013 https://eur-lex.europa.eu/legal-content/EN/TXT/?uri=celex:32013R1380
17
Commission Delegated Regulation (EU) 2020/2237 https://eur-lex.europa.eu/legal-content/EN/TXT/?uri=CELEX:32020R2237
Overview | 1. First sales in Europe | 2. Extra-EU imports | 3. Consumption
14
| 4. Fisheries and aquaculture in South Africa | 5. Horse mackerel in the EU | 6. Global highlights |
7. Macroeconomic contextEuropean Market Observatory for MONTHLY HIGHLIGHTS | NO.2/2021
Fisheries and Aquaculture Products FIRST SALES IN EUROPE
Figure 20. STRIPED VENUS: FIRST SALES IN ITALY, DECEMBER 2017 - NOVEMBER 2020
6,00
2.000
5,00
1.600
4,00
Volume
1.200
Value
3,00
800 2,00
400 1,00
0 0,00
Feb
Feb
Feb
Mar
May
Mar
May
Mar
May
Dec
Aug
Apr
Sep
Dec
Aug
Apr
Sep
Dec
Aug
Apr
Sep
Jun
Oct
Jun
Oct
Jun
Oct
Jan
Jul
Jan
Jul
Jan
Jul
Nov
Nov
Nov
2017 2018 2019 2020
Volume (tonnes) Value (million EUR)
Over the past 36 months, the highest first sales of striped venus in Italy occurred from May to August and in December.
This trend could be linked with the tourist season in later spring/summer and Christmas holidays in December, when
consumption of fisheries products is traditionally higher.
Figure 21. FIRST SALES: COMPOSITION OF “BIVALVES” (ERS LEVEL) IN ITALY IN VALUE AND VOLUME,
NOVEMBER 2020
Smooth
callista
Purple dye
Purple dye 5%
Other murex Other
Smooth murex
17% 8% 11%
callista 13%
10%
Total value Total volume
EUR 2,1 mil
914 tonnes
Striped venus Striped venus
65%
71%
Figure 22. STRIPED VENUS: FIRST SALES IN SPAIN, DECEMBER 2017 - NOVEMBER 2020
350
1,40
300
1,20
250
1,00
200
Volume
0,80
Value
150 0,60
100 0,40
50 0,20
0 0,00
Feb
Feb
Feb
Mar
May
Mar
May
Mar
May
Dec
Aug
Apr
Sep
Dec
Aug
Aug
Apr
Sep
Dec
Apr
Sep
Jun
Oct
Jun
Oct
Jun
Oct
Jan
Jul
Jan
Jul
Jan
Jul
Nov
Nov
Nov
2017 2018 2019 2020
Volume (tonnes) Value (million EUR)
Overview | 1. First sales in Europe | 2. Extra-EU imports | 3. Consumption
15
| 4. Fisheries and aquaculture in South Africa | 5. Horse mackerel in the EU | 6. Global highlights |
7. Macroeconomic contextEuropean Market Observatory for MONTHLY HIGHLIGHTS | NO.2/2021
Fisheries and Aquaculture Products FIRST SALES IN EUROPE
Over the past 36 months in Spain, the highest first sales of common striped venus occurred from July to September
2019 and 2020, peaking in September 2020 when 326 tonnes were sold. There were low or no first sales recorded in
May and June, which is the closure period when the main spawning occurs 18.
Figure 23. FIRST SALES: COMPOSITION OF “BIVALVES” (ERS LEVEL) IN SPAIN IN VALUE AND VOLUME,
NOVEMBER 2020
Common Common
edible cockle edible cockle
Other 22% Other 19%
34% 30%
Japanese
Total volume carpet
Total value 1.405 tonnes
EUR 7,2 mil shell
17%
Japanese Tuberculate
Striped carpet shell cockle
venus 30% Striped venus
16% 18%
Tuberculate 11%
cockle
3%
Price trend
Figure 24. STRIPED VENUS: FIRST-SALES PRICES IN SELECTED COUNTRIES, DECEMBER 2017 -
NOVEMBER 2020
13,50
12,00
10,50
9,00
EUR/kg
7,50
6,00
4,50
3,00
1,50
0,00
Feb
Feb
Feb
Mar
May
Mar
May
Mar
May
Dec
Aug
Aug
Aug
Apr
Sep
Dec
Apr
Sep
Dec
Apr
Sep
Jun
Oct
Oct
Jan
Jul
Jun
Oct
Jan
Jul
Jun
Jan
Jul
Nov
Nov
Nov
2017 2018 2019 2020
Italy Spain
Over the 36-month observation period (December 2017 to November 2020), the average first-sales price of striped venus
in Spain was 4,95 EUR/kg, which was 113% higher than in Italy (2,32 EUR/kg). Such high difference in the first-sales
price is significantly lower volume of the species sold in Spain (the highest volume was 326 tonnes in September 2020)
compared to Italy (highest volume was 2062 tonnes in December 2020).
In Italy in November 2020, the average first-sales price of striped venus (2,17 EUR/kg) remained stable compared with
November 2019 and slightly fell by 3% compared with November 2018. During the past 36 months, average price ranged
from 2,04 EUR/kg for 1145 tonnes and 1297 tonnes in January and February 2020, respectively, to 3,14 EUR/kg
for 1.148 tonnes in March 2018. In Spain in November 2020, the average first-sales price of striped venus (3,02 EUR/kg)
decreased by 9% compared to November 2019 and by 29% relative to November 2018. During the observed period, the
lowest average price (2,26 EUR/kg for 309 tonnes) was seen in September 2019, while the highest average price was
recorded in March 2018 at 12,84 EUR/kg, for 1 tonne.
18
http://rua.ua.es/dspace/bitstream/10045/78071/1/TFM_Juan_Francisco_Lechuga_Sanchez_Final.pdf
Overview | 1. First sales in Europe | 2. Extra-EU imports | 3. Consumption
16
| 4. Fisheries and aquaculture in South Africa | 5. Horse mackerel in the EU | 6. Global highlights |
7. Macroeconomic contextEuropean Market Observatory for MONTHLY HIGHLIGHTS | NO.2/2021
Fisheries and Aquaculture Products FIRST SALES IN EUROPE
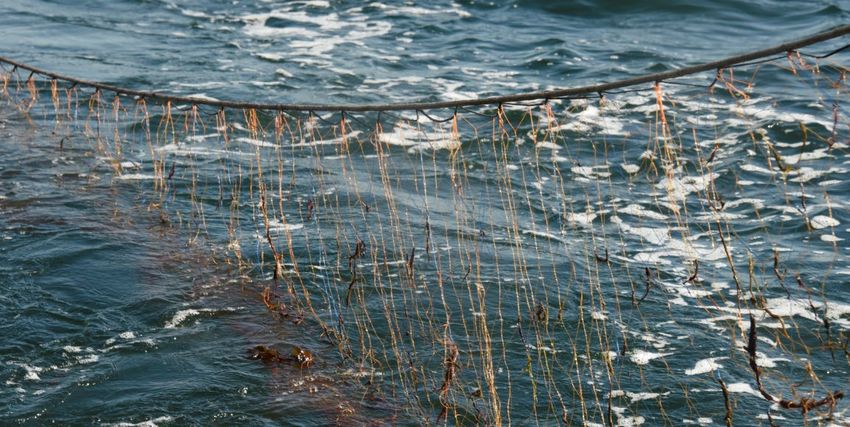
1.7. Focus on whelk
Buccinum undatum, the whelk or the waved buccinum, is a large, edible marine gastropod in the family
Buccinidae, the "true whelks". The species is a familiar part of the marine fauna of the Northern Atlantic
and is found on the shores of the United Kingdom, Ireland, France, Norway, Iceland, various other
northwest European countries, some Arctic islands, and North America as far south as New Jersey. They
prefer colder temperatures, and cannot survive at temperatures above 29 °C. It can be found on muddy sand, gravel and rock
habitat up to a depth of 1.200 m and is also sometimes present in brackish waters 19. This whelk feeds on live bivalves and
are, in turn, preyed upon by several fish species and crustaceans. The maximum height of the shell is 10 cm, and the maximum
width is 6 cm.
A whelk fishery exists on many shores around the world. This fishery uses traps covered with nylon or wire netting submerged
on the seafloor to catch whelk. Traps are attached to lines and marked by floats on the surface 20. The trap attract whelk
using various bait.
Selected countries
Table 19. COMPARISON OF WHELK FIRST-SALES PRICES, MAIN PLACES OF SALE AND CONTRIBUTION TO
OVERALL SALES OF BIVALVES IN BELGIUM, FRANCE, AND THE NETHERLANDS
Changes in whelk first sales Contribution of Principal places of sales
Whelk Jan-Nov 2020 (%) whelk to total in Jan-Nov 2020 in
bivalve first sales in terms of first-sales
Compared to Compared to November 2020 (%) value
Jan-Nov 2019 Jan-Nov 2018
Belgium Value -44% +41% 6% Nieuwpoort, Oostende,
Zeebrugge.
Volume -7% +151% 27%
France Value -31% -35% 4% Dieppe, Erquy, St Malo.
Volume -25% -32% 7%
Netherlands Value -66% -53% 53% Vlissingen, Scheveningen,
Stellendam.
Volume -29% -7% 89%
Figure 25. WHELK: FIRST SALES IN BELGIUM, DECEMBER 2017 - NOVEMBER 2020
25 40,00
20 32,00
Volume
15 24,00
Value
10 16,00
5 8,00
0 0,00
Feb
Feb
Feb
Mar
May
Dec
Aug
Mar
May
Aug
Mar
May
Apr
Sep
Dec
Apr
Sep
Dec
Aug
Apr
Sep
Jun
Oct
Oct
Jan
Jul
Jun
Jan
Jul
Jun
Oct
Jan
Jul
Nov
Nov
Nov
2017 2018 2019 2020
Volume (tonnes) Value (1000 EUR)
19
https://web.archive.org/web/20070822170400/http://www.marlin.ac.uk/species/Buccinumundatum.htm
20
https://thisfish.info/fishery/species/whelk/
Overview | 1. First sales in Europe | 2. Extra-EU imports | 3. Consumption
17
| 4. Fisheries and aquaculture in South Africa | 5. Horse mackerel in the EU | 6. Global highlights |
7. Macroeconomic contextEuropean Market Observatory for MONTHLY HIGHLIGHTS | NO.2/2021
Fisheries and Aquaculture Products FIRST SALES IN EUROPE
Bivalves landed in Belgium are taken as a by-catch of fisheries targeting finfish or crustaceans, and the nation has never
had specialised molluscan fisheries. Species landed consist mainly of whelk, with first sales fluctuating throughout the year 21.
The peak in first sales was reached in November 2019 when 21 tonnes were sold.
Figure 26. FIRST SALES: COMPOSITION OF “BIVALVES” (ERS LEVEL) IN BELGIUM IN VALUE AND VOLUME,
NOVEMBER 2020
Whelk
6%
Whelk
27%
Total value Total volume
EUR 59,715 38 tonnes
Great Atlantic scallop Great Atlantic scallop
94%
73%
Figure 27. WHELK: FIRST SALES IN FRANCE, DECEMBER 2017 - NOVEMBER 2020
900 1,80
800
1,50
700
600 1,20
500
Volume
Value
0,90
400
300 0,60
200
0,30
100
0 0,00
Feb
Feb
Feb
Mar
May
Mar
May
Mar
May
Dec
Aug
Apr
Sep
Dec
Aug
Aug
Apr
Sep
Dec
Apr
Sep
Jun
Oct
Jan
Jul
Jun
Oct
Jun
Oct
Jan
Jul
Jan
Jul
Nov
Nov
Nov
2017 2018 2019 2020
Volume (tonnes) Value (million EUR)
In France, over the past 36 months (December 2017 – November 2020) the whelk fishery fluctuated regularly, with the
highest first sales registered during warmer months, namely from April to June every year. The peak in first sales was
recorded in April 2018, when 812 tonnes were sold.
21
http://www.vliz.be/imisdocs/publications/267114.pdf
Overview | 1. First sales in Europe | 2. Extra-EU imports | 3. Consumption
18
| 4. Fisheries and aquaculture in South Africa | 5. Horse mackerel in the EU | 6. Global highlights |
7. Macroeconomic contextEuropean Market Observatory for MONTHLY HIGHLIGHTS | NO.2/2021
Fisheries and Aquaculture Products FIRST SALES IN EUROPE
Figure 28. FIRST SALES: COMPOSITION OF “BIVALVES” (ERS LEVEL) IN FRANCE IN VALUE AND VOLUME,
NOVEMBER 2020
Whelk Other Whelk Other
4% 2% 7% 2%
Warty venus Warty venus
2% 1%
Total value Total volume
EUR 10,5 mil 3.644 tonnes
Great Atlantic scallop Great Atlantic scallop
92% 90%
Figure 29. WHELK: FIRST SALES IN THE NETHERLANDS, DECEMBER 2017 - NOVEMBER 2020
56 60,00
48 50,00
40
Volume
40,00
32
Value
30,00
24
20,00
16
8 10,00
0 0,00
Feb
Feb
Feb
Mar
May
Mar
May
Mar
May
Dec
Aug
Aug
Apr
Sep
Dec
Apr
Sep
Dec
Aug
Apr
Sep
Jun
Oct
Jun
Oct
Oct
Jan
Jul
Jan
Jul
Jun
Jan
Jul
Nov
Nov
Nov
2017 2018 2019 2020
Volume (tonnes) Value (1000 EUR)
In the Netherlands, over the past 36 months (December 2017 – November 2020) the whelk fishery fluctuated regularly,
with the highest first sales registered during colder months. The highest first sales were recorded in November 2018 and
2019 when 42 and 37 tonnes, respectively, were sold.
Figure 30. FIRST SALES: COMPOSITION OF “BIVALVES” (ERS LEVEL) IN THE NETHERLANDS IN VALUE AND
VOLUME, NOVEMBER 2020
Great Atlantic
scallop
Other 8%
1% Pacific
cupped
oyster
Other Great 2%
17% Atlantic
scallop
28%
Total value Total volume
EUR 11,999 15 tonnes
Whelk
53% Pacific Whelk
cupped 89%
oyster
8%
Overview | 1. First sales in Europe | 2. Extra-EU imports | 3. Consumption
19
| 4. Fisheries and aquaculture in South Africa | 5. Horse mackerel in the EU | 6. Global highlights |
7. Macroeconomic contextEuropean Market Observatory for MONTHLY HIGHLIGHTS | NO.2/2021
Fisheries and Aquaculture Products FIRST SALES IN EUROPE
Price trend
Figure 31. WHELK: FIRST-SALES PRICES IN SELECTED COUNTRIES, DECEMBER 2017 - NOVEMBER 2020
4,00
3,50
3,00
2,50
EUR/kg
2,00
1,50
1,00
0,50
0,00
Feb
Feb
Feb
Mar
May
Mar
May
Mar
May
Dec
Aug
Apr
Sep
Dec
Aug
Apr
Sep
Dec
Aug
Apr
Sep
Jun
Oct
Oct
Jun
Oct
Jan
Jul
Jun
Jan
Jul
Jan
Jul
Nov
Nov
Nov
2017 2018 2019 2020
Belgium France Netherlands
Over the 36-month observation period (November 2017 – November 2020), the average first-sales price of whelk in
France was 2,12 EUR/kg, 52% higher than in Belgium (1,40 EUR/kg), and 47% over that in the Netherlands (1,12 EUR/kg).
In Belgium in November 2020, the average first-sales price of whelk (0,35 EUR/kg) decreased by 80% compared to
November 2019 and 78% compared to November 2018. The lowest average price was registered in November 2020 at
0,35 EUR/kg for 10 tonnes, which was among the highest volumes recorded in the observed 36 months. The highest
average price at 2,76 EUR/kg for 1 tonne was registered in May 2018.
In France, in November 2020 the average first-sales price of whelk was 1,84 EUR/kg, 26% and 22% lower than in
November 2019 and 2018, respectively. The lowest price in the past 36 months was registered in May 2020,
at 1,25 EUR/kg for 405 tonnes. The highest price (3,29 EUR/kg for 307 tonnes) was observed in December 2019.
In the Netherlands in November 2020, the average first-sales price of whelk (0,47 EUR/kg) decreased by 60% compared
to November 2019 and 66% compared to November 2018. The lowest average price was registered in August 2020 at
0,33 EUR/kg for 18 tonnes. The highest average price at 1,54 EUR/kg for 13 tonnes was registered in June 2019.
Overview | 1. First sales in Europe | 2. Extra-EU imports | 3. Consumption
20
| 4. Fisheries and aquaculture in South Africa | 5. Horse mackerel in the EU | 6. Global highlights |
7. Macroeconomic contextEuropean Market Observatory for MONTHLY HIGHLIGHTS | NO.2/2021
Fisheries and Aquaculture Products EXTRA-EU IMPORTS
2. Extra-EU imports
Every month, the weekly extra-EU import prices (average values per week, in EUR per kg) are examined for nine different
species. The three most relevant species in terms of value and volume remain consistent, and are examined every month:
fresh whole Atlantic salmon from Norway, frozen Alaska pollock fillets from China, and frozen tropical shrimp (Penaeus spp.)
from Ecuador. The other six species change each month. Three are chosen from the commodity group of the month, which
this month is bivalves. The featured commodity species this month are: prepared or preserved mussels from Chile, frozen
scallops (including queen scallops) from the United States, and fresh or chilled mussels from Norway. The remaining three
species examined each month are randomly selected and, this month, include prepared or preserved shrimps and prawns
from Greenland, albacore or longfin tunas (for industrial manufacture of products) from South Africa, and smoked Pacific
salmon, Atlantic salmon, and Danube salmon from Norway.
Table 20. EVOLUTION OF WEEKLY PRICE AND VOLUME OF THE THREE MOST RELEVANT FISHERIES AND
AQUACULTURE PRODUCTS IMPORTED INTO THE EU
Extra-EU Imports Week Preceding 4- Week 01/2020 Notes
01/2021 week average
Fresh whole Price 5,03 4,54 (+11%) 7,79 (–35%) Lower prices in December 2020 than
Atlantic salmon (EUR/kg) the same month in previous years.
imported from Downward trend in 2020. In week
Norway (Salmo 01/2021, price rose above 5,00
salar, EUR/kg for the first time since
CN code 03021440) week 29/2020.
Volume 10.214 16.405 (–38%) 8.698 (+17%) Higher volumes in December 2020
(tonnes) than the same month in previous
years. Upward trend in 2020. Supply
up in week 01/2021, compared with
previous week.
Frozen Alaska Price 2,43 2,46 (–1%) 2,96 (–18%) December 2020 prices were lower
pollock fillets (EUR/kg) than the same month in 2019 but
imported from higher than December 2018. The
China (Theragra upward trend observed in 2020
chalcogramma, continued in week 01/2021.
CN code 03047500) Volume 3.477 2.443 (+42%) 6.136 (–43%) Fluctuations in supply. Lower
(tonnes) volumes in December 2020 than the
same month in 2019, but unchanged
from December 2018. Supply
increased remarkably in the first
week of 2021.
Frozen tropical Price 5,26 5,17 (+2%) 6,26 (–16%) Downward trend in 2020. Average
shrimp imported (EUR/kg) price in December 2020 distinctively
from Ecuador lower than December 2018 and
(genus Penaeus spp., 2019. Price up in week 1 of 2021
CN code 03061792) compared with week 52 of 2020.
Volume 1.369 2.013 (–32%) 1.985 (–31%) Fluctuations in supply. Upward trend
(tonnes) in 2020. Volumes in December 2020
higher compared with the same
month in 2018 and 2019. Supply
decreased in the first week of 2021
compared with last week of 2020.
Source: European Commission (updated 18.01.2021).
Overview | 1. First sales in Europe | 2. Extra-EU imports | 3. Consumption
21
| 4. Fisheries and aquaculture in South Africa | 5. Horse mackerel in the EU | 6. Global highlights |
7. Macroeconomic contextEUR/kg EUR/kg EUR/kg
4,00
4,50
5,00
5,50
6,00
6,50
7,00
1,50
2,00
2,50
3,00
3,50
4,00
4,00
5,00
6,00
7,00
8,00
9,00
2018/01 2018/01 2018/01
2018/05 2018/05 2018/05
2018/09 2018/09 2018/09
2018/13 2018/13 2018/13
2018/17 2018/17 2018/17
2018/21 2018/21 2018/21
2018/25 2018/25 2018/25
European Market Observatory for
2018/29
Fisheries and Aquaculture Products
2018/29 2018/29
2018/33 2018/33 2018/33
2018/37 2018/37 2018/37
2018/41 2018/41
Source: European Commission (updated 18.01.2021).
Source: European Commission (updated 18.01.2021).
Source: European Commission (updated 18.01.2021).
2018/41
2018/45 2018/45 2018/45
2018/49 2018/49 2018/49
2019/01 2019/01 2019/01
2019/05 2019/05 2019/05
2019/09 2019/09 2019/09
2019/13 2019/13 2019/13
2019/17 2019/17 2019/17
2019/21 2019/21 2019/21
2019/25 2019/25 2019/25
2019/29 2019/29 2019/29
2019/33 2019/33 2019/33
7. Macroeconomic context
2019/37 2019/37 2019/37
2019/41 2019/41 2019/41
Figure 34. IMPORT PRICE OF FROZEN TROPICAL SHRIMP FROM ECUADOR
2019/45 2019/45 2019/45
2019/49 2019/49 2019/49
Figure 33. IMPORT PRICE OF FROZEN ALASKA POLLOCK FILLETS FROM CHINA
2020/01 2020/01 2020/01
2020/05 2020/05 2020/05
2020/09
Figure 32. IMPORT PRICE OF FRESH AND WHOLE ATLANTIC SALMON FROM NORWAY
2020/09 2020/09
2020/13 2020/13 2020/13
2020/17 2020/17 2020/17
Overview | 1. First sales in Europe | 2. Extra-EU imports | 3. Consumption
2020/21 2020/21 2020/21
2020/25 2020/25 2020/25
2020/29 2020/29 2020/29
2020/33 2020/33 2020/33
| 4. Fisheries and aquaculture in South Africa | 5. Horse mackerel in the EU | 6. Global highlights |
Week 01:
2020/37 2020/37 2020/37
2,43 EUR/kg
Week 01:
Week 01:
2020/41
5,26 EUR/kg
5,03 EUR/kg
2020/41 2020/41
2020/45 2020/45 2020/45
2020/49 2020/49 2020/49
2021/01
MONTHLY HIGHLIGHTS | NO.2/2021
EXTRA-EU IMPORTS
2021/01 2021/01
22European Market Observatory for MONTHLY HIGHLIGHTS | NO.2/2021
Fisheries and Aquaculture Products EXTRA-EU IMPORTS
Table 21. EVOLUTION OF WEEKLY PRICE AND VOLUME OF THIS MONTH'S THREE FEATURED COMMODITY
PRODUCTS IMPORTED INTO THE EU
Extra-EU Imports Week Preceding 4- Week 01/2020 Notes
01/2021 week average
Prepared or Price 2,47 2,46 (+1%) 2,49 (–1%) Upward trend from 2018 to 2020. Price
preserved mussels (EUR/kg) spike (3,29 EUR/kg) correlates with
from Chile significant drop of supply.
(CN code 16055390) Volume 225 245 (–8%) 344 (–35%) Supply is consistent, with volume
(tonnes) mostly ranging from 300 to
700 tonnes. Volume exceeds
1.000 tonnes in the summer months
(June–August). Slight downward trend
from 2018 to 2020.
Frozen scallops Price 16,19 14,37 (+13%) 14,92 (+9%) Slight upward trend from 2018 to
(including queen (EUR/kg) 2020. Price spikes (over 20 EUR/kg) do
scallops) from not always correlate with drop
the US of supply.
(CN code 03072290) Volume 1 3 (–60%) 14 (–92%) High fluctuations in supply, from 0,01
(tonnes) to 176 tonnes. Downward trend from
2018 to 2020.
Live, fresh, or Price 3,80 3,48 (+9%) 4,34 (–12%) Slight downward trend from 2018 to
chilled mussels (EUR/kg) 2020. Price spikes do not correlate with
from Norway drop of supply.
(Mytilus spp., Volume 0,13 0,43 (–69%) 0,39 (–66%) Fluctuations in supply, from 36 kg to
CN code 03073110) (tonnes) 1,05 tonnes. Downward trend from
2018 to 2020.
Source: European Commission (updated 18.01.2021).
Figure 35. IMPORT PRICE OF PREPARED OR PRESERVED MUSSELS FROM CHILE
4,50
Week 01:
4,00
2,47 EUR/kg
3,50
EUR/kg
3,00
2,50
2,00
1,50
2018/01
2018/05
2018/09
2018/13
2018/17
2018/21
2018/25
2018/29
2018/33
2018/37
2018/41
2018/45
2018/49
2019/01
2019/05
2019/09
2019/13
2019/17
2019/21
2019/25
2019/29
2019/33
2019/37
2019/41
2019/45
2019/49
2020/01
2020/05
2020/09
2020/13
2020/17
2020/21
2020/25
2020/29
2020/33
2020/37
2020/41
2020/45
2020/49
2021/01
Source: European Commission (updated 18.01.2021).
Overview | 1. First sales in Europe | 2. Extra-EU imports | 3. Consumption
23
| 4. Fisheries and aquaculture in South Africa | 5. Horse mackerel in the EU | 6. Global highlights |
7. Macroeconomic contextEuropean Market Observatory for MONTHLY HIGHLIGHTS | NO.2/2021
Fisheries and Aquaculture Products EXTRA-EU IMPORTS
Figure 36. IMPORT PRICE OF FROZEN SCALLOPS (INCLUDING QUEEN SCALLOPS) FROM THE US
26,00
Week 01:
16,19 EUR/kg
21,00
EUR/kg
16,00
11,00
6,00
2018/01
2018/05
2018/09
2018/13
2018/17
2018/21
2018/25
2018/29
2018/33
2018/37
2018/41
2018/45
2018/49
2019/01
2019/05
2019/09
2019/13
2019/17
2019/21
2019/25
2019/29
2019/33
2019/37
2019/41
2019/45
2019/49
2020/01
2020/05
2020/09
2020/13
2020/17
2020/21
2020/25
2020/29
2020/33
2020/37
2020/41
2020/45
2020/49
2021/01
Source: European Commission (updated 18.01.2021).
Figure 37. IMPORT PRICE OF LIVE, FRESH, OR CHILLED MUSSELS FROM NORWAY
8,00
7,00
Week 01:
6,00
3,80 EUR/kg
5,00
EUR/kg
4,00
3,00
2,00
1,00
0,00
2018/01
2018/05
2018/09
2018/13
2018/17
2018/21
2018/25
2018/29
2018/33
2018/37
2018/41
2018/45
2018/49
2019/01
2019/05
2019/09
2019/13
2019/17
2019/21
2019/25
2019/29
2019/33
2019/37
2019/41
2019/45
2019/49
2020/01
2020/05
2020/09
2020/13
2020/17
2020/21
2020/25
2020/29
2020/33
2020/37
2020/41
2020/45
2020/49
2021/01
Source: European Commission (updated 18.01.2021).
In 2020, the price of prepared or preserved mussels from Chile increased continuously, while volume
exhibited a slight downward trend.
Both price and volume of frozen scallops (including queen scallops) from the US showed a downward
trend in 2020. Over the past three years, price fluctuated from 9,31 to 20,76 EUR/kg.
In 2018–2020, the price of live, fresh, or chilled mussels from Norway fluctuated from 2,04 to
7,09 EUR/kg. In 2020 both price and volume exhibited a downward trend (the latter most notably).
Overview | 1. First sales in Europe | 2. Extra-EU imports | 3. Consumption
24
| 4. Fisheries and aquaculture in South Africa | 5. Horse mackerel in the EU | 6. Global highlights |
7. Macroeconomic contextEuropean Market Observatory for MONTHLY HIGHLIGHTS | NO.2/2021
Fisheries and Aquaculture Products EXTRA-EU IMPORTS
Table 22. EVOLUTION OF WEEKLY PRICE AND VOLUME OF EU IMPORTS OF OTHER THREE FISHERIES AND
AQUACULTURE PRODUCTS RELEVANT TO THE EU MARKET
Extra-EU Imports Week Preceding 4- Week 01/2020 Notes
01/2021 week average
Prepared or Price 6,14* 6,47** (–5%) n/a*** Upward trend from 2018 to 2020. Most
preserved shrimps (EUR/kg) of the price spikes correlate with drops
and prawns from in supply.
Greenland Volume 226* 698** (–68%) n/a*** High fluctuations in supply, from 20 to
(CN code 16052900) (tonnes) 1.189 tonnes. Upward trend from 2018
to 2020.
Frozen albacore or Price 2,91* n/a n/a*** Data is limited. Loose downward trend
longfin tunas for (EUR/kg) from 2018 to 2020. Most of the prices
industrial range from 2,91 to 4,30 EUR/kg.
manufacture of Volume 55* n/a n/a*** Data is limited. High fluctuations in
products from (tonnes) supply, from 13 to 187 tonnes. Loose
South Africa upward trend from 2018 to 2020.
(Thunnus alalunga,
CN code 03034110)
Smoked Pacific Price 21,84 15,30 (+43%) 25,93 (–16%) Upward trend from 2018 to 2020.
salmon, Atlantic (EUR/kg) Prices range from 7,20 to 25,93 EUR/kg.
salmon, and Danube Volume 2 22 (–89%) 3 (–16%) Volume exhibited a stable trend from
salmon from (tonnes) 2018 to 2020, notwithstanding high
Norway fluctuations, from 0,5 to 46 tonnes.
(CN code 03054110)
Source: European Commission (updated 18.01.2021).
* Data refers to week 52 of 2020 (the most recent available); **average of weeks 48, 50, 51, and 52;*** data is not available for week 52/2020.
Figure 38. IMPORT PRICE OF PREPARED OR PRESERVED SHRIMPS AND PRAWNS FROM GREENLAND
Source: European Commission (updated 18.01.2021).
Overview | 1. First sales in Europe | 2. Extra-EU imports | 3. Consumption
25
| 4. Fisheries and aquaculture in South Africa | 5. Horse mackerel in the EU | 6. Global highlights |
7. Macroeconomic contextEuropean Market Observatory for MONTHLY HIGHLIGHTS | NO.2/2021
Fisheries and Aquaculture Products EXTRA-EU IMPORTS
Figure 39. IMPORT PRICE OF FROZEN ALBACORE OR LONGFIN TUNAS FOR INDUSTRIAL MANUFACTURE OF
PRODUCTS FROM SOUTH AFRICA
Source: European Commission (updated 18.01.2021).
Figure 40. IMPORT PRICE OF SMOKED PACIFIC SALMON, ATLANTIC SALMON, AND DANUBE SALMON FROM
NORWAY
30,00
Week 01:
21,84 EUR/kg
25,00
20,00
EUR/kg
15,00
10,00
5,00
2018/01
2018/05
2018/09
2018/13
2018/17
2018/21
2018/25
2018/29
2018/33
2018/37
2018/41
2018/45
2018/49
2019/01
2019/05
2019/09
2019/13
2019/17
2019/21
2019/25
2019/29
2019/33
2019/37
2019/41
2019/45
2019/49
2020/01
2020/05
2020/09
2020/13
2020/17
2020/21
2020/25
2020/29
2020/33
2020/37
2020/41
2020/45
2020/49
2021/01
Source: European Commission (updated 18.01.2021).
Since the beginning of 2020, both price and volume of prepared or preserved shrimps and prawns from
Greenland have exhibited an upward trend.
In 2020, price of frozen albacore or longfin tunas for industrial manufacture of products from South
Africa exhibited a downward trend. At the same time, supply increased.
The price of smoked Pacific salmon, Atlantic salmon, and Danube salmon from Norway exhibited an
upward trend in 2020. At the same time, supply remained stable.
Overview | 1. First sales in Europe | 2. Extra-EU imports | 3. Consumption
26
| 4. Fisheries and aquaculture in South Africa | 5. Horse mackerel in the EU | 6. Global highlights |
7. Macroeconomic contextYou can also read