Otolith d18O and microstructure analyses provide further evidence of population structure in sardine Sardinops sagax around South Africa
←
→
Page content transcription
If your browser does not render page correctly, please read the page content below
ICES Journal of Marine Science (2020), doi:10.1093/icesjms/fsaa130

                                                                                                                                                    Downloaded from https://academic.oup.com/icesjms/advance-article/doi/10.1093/icesjms/fsaa130/5899240 by guest on 29 September 2020
Otolith d18O and microstructure analyses provide further
evidence of population structure in sardine Sardinops sagax
around South Africa
Tatsuya Sakamoto 1*, Carl D. van der Lingen2,3, Kotaro Shirai                                        4
                                                                                                         , Toyoho Ishimura5,†
Yonela Geja2, James Peterson2, and Kosei Komatsu4,6
1
 Seikai National Fisheries Research Institute, Fisheries Research and Education Agency, Nagasaki, Japan
2
 Branch: Fisheries Management, Department of Forestry, Fisheries and the Environment, Cape Town, South Africa
3
 Department of Biological Sciences, Marine Biology Research Institute, University of Cape Town, Cape Town, South Africa
4
 Atmosphere and Ocean Research Institute, The University of Tokyo, Chiba, Japan
5
 National Institute of Technology, Ibaraki College, Ibaraki, Japan
6
 Graduate School of Frontier Sciences, University of Tokyo, Chiba, Japan
*Corresponding author: tel: þ81-95-860-1634; e-mail: tats@affrc.go.jp.
†
 Present address: Graduate School of Human and Environmental Studies, Kyoto University, Kyoto, Japan.
Sakamoto, T., van der Lingen, C. D., Shirai, K., Ishimura, T., Geja, Y., Peterson, J., and Komatsu, K. Otolith d18O and microstructure analy-
ses provide further evidence of population structure in sardine Sardinops sagax around South Africa. – ICES Journal of Marine Science
doi:10.1093/icesjms/fsaa130.
Received 5 January 2020; revised 28 June 2020; accepted 29 June 2020.

Sardine Sardinops sagax is an ecologically and economically important Clupeid found off the entire South African coast that includes both
coastal upwelling and western boundary current systems. Although the management of the sardine fisheries historically assumed a single,
panmictic population, the existence of three, semi-discrete subpopulations has recently been hypothesized. We conducted otolith d18O and
microstructure analyses to investigate nursery habitat temperatures and early life growth rates, respectively, of sardine collected from three
biogeographic regions around South Africa’s coast to test that hypothesis. Analyses indicated that for both summer- and winter-captured
adults and summer-captured juveniles, fishes from the west coast grew significantly slower in water that was several degrees cooler than those
from the south and east coasts. This suggests that mixing of sardines between regions, particularly the west and other coasts, is relatively lim-
ited and supports the hypothesis of semi-discrete subpopulations. However, the west-south differences disappeared in the results for winter-
captured juveniles, suggesting that differences in early life conditions between regions may change seasonally, and/or that all or most winter-
captured juveniles originated from the west coast. Further elucidating the interactions between South African sardine subpopulations and
the mechanisms thereof is important for sustainable harvesting of this species.
Keywords: coastal upwelling, otolith d18O, otolith microstructure, population structure, South African sardine, western boundary current

Introduction                                                                both eastern and western boundary current systems (Figure 1).
The South African coastline extends between the Southeast                   The west coast has a relatively narrow shelf and forms the south-
Atlantic and the Southwest Indian oceans and is bordered by                 ern part of the Benguela Current upwelling system, where

C International Council for the Exploration of the Sea 2020.
V
This is an Open Access article distributed under the terms of the Creative Commons Attribution License (http://creativecommons.org/
licenses/by/4.0/), which permits unrestricted reuse, distribution, and reproduction in any medium, provided the original work is prop-
erly cited.
2 T. Sakamoto et al.
seasonal, wind-driven coastal upwelling results in a cool shelf
habitat characterized by high primary and secondary production,
particularly during austral spring/summer (Hutchings et al.,
2009; Kirkman et al., 2016). In contrast, the south and east coasts
are dominated by the Agulhas Current that flows south-
westwards along the continental shelf and produces warm, oligo-
trophic, and advective environments. The broad shelf off the
south coast known as the Agulhas Bank is an irregular extension
Downloaded from https://academic.oup.com/icesjms/advance-article/doi/10.1093/icesjms/fsaa130/5899240 by guest on 29 September 2020
of the South African coastal plain, and hydrological conditions
there are primarily related to strong forcing by the Agulhas
Current on the outer shelf and wind-driven upwelling on the in-
ner shelf (Hutchings et al., 2009; Kirkman et al., 2016). The east
coast has a particularly narrow shelf and is markedly impacted by
the Agulhas Current (Roberts et al., 2010) although limited local
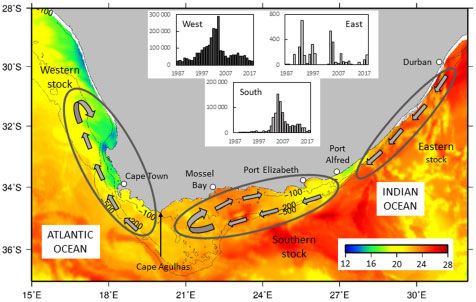
upwelling does occur there (Hutchings et al., 2010). Figure 1. Satellite-derived (GHRSST Level 4 OSTIA Global
Sardine Sardinops sagax is an abundant Clupeid found off Foundation Sea Surface Temperature Analysis; UK Met Office, 2005)
South Africa that is distributed around the coast and in all of Sea surface temperature around South Africa on 1 January 2017
South Africa’s marine biogeographic provinces except the tropical demonstrating the marked oceanographic variability in the study
(Beckley and van der Lingen, 1999). This species is a major target area and with the 100, 200, and 500 m depth contours and places
of the South African small pelagic fishery and is caught off the named in the text shown. Grey ellipses indicate the approximate
west and south coasts using purse seine nets, and annual sardine distribution areas of the putative western, southern, and eastern
catches in that fishery have ranged from 16 000 to 410 000 tons sardine stocks and the grey arrows within each ellipse indicate
hypothesized transport of early life history stages of each stock.
over the period 1950–2015 (de Moor et al., 2017). Although sar-
Histograms show annual sardine catches by a purse seine fishery off
dine was initially only exploited off the west coast, fishing off the the west and south coasts, and by a beach seine fishery off the east
south coast was initiated in the late 1980s and significant catches coast, 1987–2018 (note that the y-axis scales differ between
have been taken in that region, particularly during the mid-2000s histograms).
(Figure 1). Sardine is also caught off the east coast by a small
beach seine fishery (annual catches have never exceeded 700 t)
that targets this species during the annual migration of sardine
from the Agulhas Bank up the east coast in austral winter that is while none is transported to the south coast, whereas relatively
locally known as the “KwaZulu-Natal sardine run” (van der few (Population structure of South African sardine 3 found in that region from winter to spring (Connell, 2010). Forestry, Fisheries and the Environment; DFFE). During the sec- Larvae and juveniles recruit inshore in all regions; however, their ond survey (conducted by the Department of Environmental nursery environments and growth patterns during early life stages Affair, DEA), samples were collected at 5 m depth using Niskin are not well understood, especially for the putative southern and bottles attached to a Conductivity Temperature Depth profiler eastern subpopulations. (CTD) along the south and east coasts. Near-shore (
4                                                                                                                            T. Sakamoto et al.

            15˚E   18˚E     21˚E      24˚E     27˚E     30˚E      33˚E 15˚E      18˚E     21˚E     24˚E      27˚E     30˚E      33˚E
     28˚S                                                                                                                              28˚S
                                  Seawater                                                        Adult
     30˚S                                                                                                                              30˚S

     32˚S                                                                                                                              32˚S

                                                                                                                                                  Downloaded from https://academic.oup.com/icesjms/advance-article/doi/10.1093/icesjms/fsaa130/5899240 by guest on 29 September 2020
     34˚S                                                                                                                              34˚S

     36˚S                                                                                                                              36˚S

     38˚S
                                                               (a)               W          C          S         E           (b)       38˚S
     28˚S                                                                                                                              28˚S
                                   Juvenile                                                     Juvenile
     30˚S                         (summer)                                                      (winter)                               30˚S

     32˚S                                                                                                                              32˚S

     34˚S                                                                                                                              34˚S

     36˚S                                                                                                                              36˚S

     38˚S
                   W          C          S                     (c)               W          C          S                     (d)       38˚S
            15˚E   18˚E     21˚E      24˚E     27˚E     30˚E      33˚E 15˚E      18˚E     21˚E     24˚E      27˚E     30˚E      33˚E

Figure 2. Sampling locations of (a) sub-surface seawater, (b) adult sardine, (c) juvenile sardine captured in summer, and (d) juvenile sardine
captured in winter. The shape and filled/open represent the sampling year and season, respectively [diamond: 2015, circle: 2016, and triangle:
2017 and filled: winter (June to August) and open: summer (November to January)].

juveniles in spring/summer 2017. Only adult sardine from the pu-         and air dried for a few hours, embedded in Petropoxy 154
tative eastern stock were collected from beach seine net catches         (Burnham Petrographics LLC) resin, and kept at 80 C for 12 h to
taken during the winter sardine run events of 2015 and 2017, and         cure. Embedded otoliths were then ground with sandpaper (no.
one sample of adult fish was collected off each of the west and          2000) and polished with an alumina suspension (BAIKOWSKI
south coasts in winter 2015 (Figure 2). The mean CL for each sta-        International Corporation) to reveal the daily rings and expose
tion was 15.2–20.1 cm for adults and 7.9–10.5 cm for juveniles           the otolith nucleus. The position and number of daily rings in
(see Supplementary Materials for further details). To facilitate         otoliths were examined from the core as far as possible along the
spatial comparisons, stations were assigned to one of four regions       axis of the post-rostrum using an otolith measurement system
(West, Central, South, and East; Figure 2) based on their location       (RATOC System Engineering Co. Ltd). Daily rings became indis-
[West (27 E)]. Regions were longitudinally defined to represent the          edge in most of the samples, except for juveniles captured in win-
spatial distribution of the putative western (West), southern            ter 2017 whose daily rings could be read from core to edge and
(South), and eastern (East) sardine stocks off South Africa (van         which enabled estimation of their hatch dates. Hatch date data
der Lingen et al., 2015), with the Central region representing the       were, therefore, only available for the juveniles captured in winter
mixing area between western and southern sardine stocks (as in           2017. The first daily ring was assumed to be formed after 3 days
de Moor et al., 2017).                                                   post-hatch (dph) based on the observation that the mean differ-
   Sardine samples were frozen shortly after capture and subse-          ence between sardine age and daily ring counts for 18 larvae
quently transported to DAFF laboratories in Cape Town, where             reared in the laboratory from eggs collected at sea was 3.3 days
they were later defrosted, and each fish had their CL recorded           (Brownell, 1983; Thomas, 1986). Daily increment widths of each
and their sagittal otoliths extracted. Otoliths were then air dried,     fish were averaged for consecutive 10-day intervals (except the
placed in labelled vials, and transported to the Atmosphere and          first interval that was of 7 days only) for the first 100 dph (i.e. 3–
Ocean Research Institute (AORI) of the University of Tokyo,              10, 11–20, 21–30, . . ., 91–100 dph), and the mean increment
Japan, for microstructure and isotope analyses.                          width for each interval for all individuals collected at each station
                                                                         was calculated for comparison between regions. Sardine body
Otolith microstructure analysis                                          length at 60 dph was calculated using the observed otolith radius
Otoliths were cleaned using a wooden toothpick and a thin paint-         at this age and the allometric relationship between fork length
brush under 10–20 magnification, rinsed with Milli-Q water              and otolith radius of sardine S. sagax off Namibia [otolith radius
Population structure of South African sardine 5
¼ 17.32 (fork length)1.977; Thomas, 1986] for comparison with Greenhouse–Geisser approximation were used to compute the p
otolith isotope data (see below). values for rm-ANOVA for those sample sets.
Otolith d18O analysis Results
For up to eight individual sardine per station, and a total of 243 Distribution of seawater d18O
individuals, the otolith portion that was formed during the first Near-surface seawater showed a strong longitudinal variation and
60 days from hatch was milled out using a high-precision micro- an inshore–offshore difference in d18O. Values were relatively low
milling system (Geomill 326, Izumo-web, Japan), and the result- (around þ0.2&) off the west coast to the north of Cape
Downloaded from https://academic.oup.com/icesjms/advance-article/doi/10.1093/icesjms/fsaa130/5899240 by guest on 29 September 2020
ing powder was collected in a stainless steel microcup. The Columbine. Seawater d18O increased with longitude until 23 E
d18Ootolith of powdered samples was measured using an isotope (where the continental shelf narrows), then became relatively sta-
ratio mass spectrometer (Delta V plus, Thermo Fisher Scientific), ble at þ0.5 to þ0.6& on the south and east coasts, and offshore
equipped with an automated carbonate reaction device stations generally showed higher values than nearby inshore sta-
(GasBench II, Thermo Fisher Scientific), and installed at the tions along the entire coast (Figure 3a). A quadratic curve [d18O
AORI, the University of Tokyo, Tokyo. Detailed analytical condi- ¼ 0.003 (Longitude)2 þ 0.1578 (Longitude) 1.5505; r2 ¼
tions have been reported elsewhere (e.g. Shirai et al. 2018), with 0.57, p < 0.001, root mean square error ¼ 0.09] was fitted (least
minor modification of using 4.5-ml glass vials (Breitenbach and squares method) to express the geographical variation of seawater
Bernasconi, 2011). All isotope values are reported using delta no- d18O around the South African coast. The estimation of potential
tation relative to the Pee Dee Belemnite. No correction was ap- seasonal variations of 0–30 m mean seawater d18O based on salin-
plied for the acid fractionation factor between calcite and ity monthly climatology showed that the seasonal discrepancies
aragonite [phosphoric acid–calcium carbonate reaction tempera- from the values in winter was in the range of 0.17 to þ0.08&
ture 72 C (Kim et al. 2007)]. Analytical precisions of d18O for in- off the South African coast (Supplementary Figure S3), which
ternational standards (NBS-19) were 60.10–0.16& (1r). would only cause 1.0 C difference at most in subsequent temper-
To exclude the effect of seawater d18O variation on otolith ature estimations.
d O and to convert the otolith d18O difference to a temperature
18
scale, water temperature was calculated from otolith d18O based Otolith d18O and daily increment width
on the relationship between these two parameters established for Otolith d18O data were collected from 243 and daily increment
Japanese sardine by Sakamoto et al. (2017), namely: width data were collected from 367 individual sardine. For adult
fish, both otolith d18O during the 60 days from hatch and daily
dotolith dseawater ¼ 0:18 T þ 2:69; increment width until 100 dph showed clear spatial variation.
Otolith d18O values were relatively higher (about þ0.8&) in the
in which seawater d18O estimated from longitude using a fitted West, lower (þ0.3 to þ0.4&) in the South, and intermediate in
quadratic function (see Results) was substituted. Because the dif- the Central and the East region (Figure 4a). One-way ANOVA
ference between acid fractionation factors of calcite and aragonite and post hoc pairwise comparisons detected a significant differ-
is temperature dependent (Kim et al., 2007), 0.09& was added to ence between the West and the South regions (ANOVA: F ¼ 5.87,
the otolith d18O before calculating water temperature to adjust p ¼ 0.01, Tukey–Kramer test: difference ¼ 0.51, p ¼ 0.01) but not
for the different reaction temperature between this study and between any other regions. In the South and the East regions,
Sakamoto et al. (2017). daily increment width peaked at 9 mm over 51–70 dph, while in
the West and the Central regions, it peaked at 7 mm over 71–90
Statistical analysis dph (Figure 4b). rm-ANOVA detected a significant interaction
To assess differences between otolith d18O and growth increment between age and region (F ¼ 7.36, p ¼ 2.7e5) during 0–60 dph,
widths of sardine from four regions along the South African and the post hoc Tukey–Kramer test found significant differences
coast, we used one-way ANOVA and the Tukey–Kramer test for between the West and the South regions (difference ¼ 2.50,
the former and repeated-measures ANOVA (rm-ANOVA) and p ¼ 6.0e6), the West and the East regions (difference ¼ 1.88,
the Tukey–Kramer test for the latter, respectively. Statistical tests p ¼ 2.6e4), the Central and the South regions (difference ¼
were performed separately for: (i) adult, (ii) summer-captured ju- 1.87, p ¼ 2.6e4), and the Central and the East regions (differ-
venile, and (iii) winter-captured juvenile sardine, using MATLAB ence ¼ 1.25, p ¼ 0.01). Hence, during their early life adult sar-
and Statistics and Machine Learning Toolbox R2017a (The dine from the West and Central regions showed significantly
MathWorks Inc., Natick, MA, USA). Station mean values were slower initial growth that had a later peak than observed for
treated as minimum data units in these analyses, hence stations adults from the South and the East regions (Figure 4b). Otolith
that included data from only two individuals were considered d18O values and increment widths during6 T. Sakamoto et al.
values (about þ0.4&) in the South, and intermediate values in
the Central region (Figure 4c). No sardine juveniles were col-
(a)
28˚S
lected from the East. Otolith d18O values were significantly differ-
ent between the West and the South regions (ANOVA:
30˚S
F ¼ 12.345, p ¼ 0.01, Tukey–Kramer test, difference ¼ 0.50,
p ¼ 0.01), but not between the West and Central or the Central
32˚S
and South regions. Daily increment width peaked at 8 mm over
−20
61–70 dph for fish from the South region, while for those from
0
Downloaded from https://academic.oup.com/icesjms/advance-article/doi/10.1093/icesjms/fsaa130/5899240 by guest on 29 September 2020
34˚S 0.6
the West daily increment widths of 4–6 mm were stable and
continued through 31–100 dph with no marked peak (Figure 4d). Seawater 0.4
The otolith growth trajectories of juvenile sardine from the 36˚S δ18OVSMOW 0.2
Central region were similar to but slightly higher than those of (per mille) 0.0
fish from the West. rm-ANOVA detected a significant interaction 38˚S
between age and region (F ¼ 5.28, p ¼ 0.02) during 0–60 dph, and 15˚E 18˚E 21˚E 24˚E 27˚E 30˚E 33˚E
the post hoc Tukey–Kramer test found significant differences be-
tween the West and South (difference ¼ 1.47, p ¼ 0.01) and the
(b)
Seawater δ18OVSMOW (per mille)
Central and South regions (difference ¼ 1.11, p < 0.05), but not
between the West and the Central. The spatial differences in oto- 0.6
lith d18O and increments were still significant when the data were
merged within West and Central regions and compared with the
South region (d18O: ANOVA, F ¼ 16.57, p ¼ 0.007, increment 0.4
width: rm-ANOVA, F ¼ 8.78, p ¼ 3.2e5).
Otolith d18O and early growth of juvenile sardine captured in
0.2
winter showed a different trend to those from juveniles captured in−shore
in summer and adult fish. Otolith d18O values were highest in off−shore
fish from the Central and South regions (at about þ0.8&) and
0.0
lower in those from the West (at about þ0.6&; Figure 4e). No
significant differences were detected between otolith d18O values 15 18 21 24 27 30 33
o
of juvenile sardine from the West, Central, and South regions Longitude ( E)
(ANOVA: F ¼ 1.362 p ¼ 0.32). rm-ANOVA detected no signifi-
Figure 3. (a) Horizontal distribution and (b) longitudinal variation
cant interaction (F ¼ 0.977, p ¼ 0.48) between age and region in
of near-surface seawater d18O. The dotted line in (b) shows the
daily increment widths for fish from the West, Central, and South fitted quadratic curve [d18O ¼ 0.003 (Longitude)2 þ
regions, all of which peaked at 7 mm over 81–90 dph 0.1578 (Longitude) 1.5505; r2 ¼ 0.57, p < 0.001, root mean
(Figure 4f). The estimated hatch date distribution of juvenile sar- square error ¼ 0.09].
dine sampled in winter in 2017 was similar for fish from the
West, Central, and South regions, with most individuals hatched higher temperature group including all samples from the East re-
between November 2016 and January 2017 (austral spring/sum- gion, most from the South, one from the Central and none from
mer; Figure 5). the West region, whereas the lower temperature group included
all of the samples from the West region, all but one from the
Ambient water temperature and growth Central, and two from winter-captured juvenile samples in the
The overall geographical trends for adults and juveniles captured South region (Figure 6b). This separation indicated the existence
in summer were still apparent when otolith d18O values were con- of two categories of sardine growth and nursery habitat off South
verted into water temperature and taking into account the ob- Africa, slower growth in cooler waters west of 22 E and faster
served spatial variation of seawater d18O. Estimated temperature growth in warmer waters east of 22 E.
was highest in the South at 16 C, high in the East at 15 C,
and low in the West and the Central regions at 10–14 C Discussion
(Figure 6a). The trend for juveniles captured in winter was differ- This study investigated nursery environments and early life
ent although otolith d18O values showed an increase with longi- growth of sardine around the coast of South Africa by conducting
tude from the West to the South region (Figure 4e), estimated the first otolith d18O analysis of this species in this region and
temperatures did not decrease but were stable at 12 C, suggest- also by using otolith microstructure analysis. Our results revealed
ing the increase in otolith d18O was due to the increase of seawa- that the nursery temperature for the first 2 months of life esti-
ter d18O at a constant water temperature. mated from otolith d18O and otolith increment widths of adults
The mean fork length at 60 dph and the mean ambient water and summer-captured juveniles showed significant and consistent
temperature estimated for the period from hatch to 60 dph for spatial differences. Sardine showed faster growth in warmer tem-
each sample showed a significant positive correlation when all peratures off the south and the east coasts and slower growth in
three sample sets (adults, and summer-caught and winter-caught cooler temperatures off the west coast, likely reflecting the differ-
juveniles) were combined (r2 ¼ 0.64, p ¼ 4.0e8, Figure 6b), sug- ent oceanographic characteristics of western boundary current
gesting that higher water temperatures result in faster growth and costal upwelling systems, respectively. The coherent trends
during the early life stages of the South African sardine. The dis- observed in both juveniles captured in summer, and adults cap-
tribution of mean values showed a separation at 14 C, with the tured in both summer and winter suggest that adults tend toPopulation structure of South African sardine 7
(a) (b)
1.2
Increment width (μm)
10
δ18OVPDB (per mille) 1.0
8
0.8
6
0.6
Downloaded from https://academic.oup.com/icesjms/advance-article/doi/10.1093/icesjms/fsaa130/5899240 by guest on 29 September 2020
0.4 4 West
Central
0.2 2 South
East
0.0 0
16 18 20 22 24 26 28 30 32 0 20 40 60 80 100
Longitude (oE) Age (days)
(c) (d)
1.2
Increment width (μm)
10
δ18OVPDB (per mille)
1.0
8
0.8
6
0.6
0.4 4
0.2 2
0.0 0
16 18 20 22 24 26 28 30 32 0 20 40 60 80 100
Longitude (oE) Age (days)
(e) (f)
1.2
Increment width (μm)
10
δ18OVPDB (per mille)
1.0
8
0.8
6
0.6
0.4 4
0.2 2
0.0 0
16 18 20 22 24 26 28 30 32 0 20 40 60 80 100
Longitude (oE) Age (days)
Figure 4. Geographical variations of otolith d18O and daily increment width for (a and b) adults, (c and d) juveniles captured in summer,
and (e and f) juveniles captured in winter. In (a), (c), and (e), station means and standard errors are shown, and the shapes and filled/open
represent the sampling year and season, respectively [diamond: 2015, circle: 2016, and triangle: 2017 and filled: winter (June to August) and
open: summer (November to January)]. Edge-dotted plots are the stations that included only two individuals. In (b), (d), and (f), the shapes
represent the sampling year and the colours shows the region (blue: West, green: Central, red: South, and orange: East) to which the station
belongs. The open plots are the stations that included only two individuals.
remain in the same regions as their young and that migrations of winter-captured juveniles, suggesting that further efforts are
fish from one region to another are relatively limited. Hence, needed to understand the whole movement patterns and mixing
these results support the existence of semi-discrete sardine subpo- between subpopulations of sardine off South Africa.
pulations that utilize different nursery habitats around the South We have two hypotheses for the cause of the observed seasonal
African coast. However, the inter-annual and seasonal coverages differences in spatial gradients of juvenile sardine otolith d18O
for these samples are not large, and the geographical trends in and early growth rate. One is the seasonality of coastal upwelling.
otolith d18O and growth described above were absent in the Juveniles captured in summer 2016 and 2017 showed clear8 T. Sakamoto et al.
(a)
18
16
Temperature (oC)
14
Adult
Downloaded from https://academic.oup.com/icesjms/advance-article/doi/10.1093/icesjms/fsaa130/5899240 by guest on 29 September 2020
12
Juvenile in summer
Juvenile in winter
10
16 20 24 28 32
Longitude (oE)
Figure 5. Distribution of estimated hatch month of juveniles
captured in June to July 2017 based on the number of daily (b)
increments. Individuals from different stations are pooled within 5.5
each region. South
East
5.0
differences in otolith d18O and daily increment widths between
Fork length (cm)
Central
the different areas, whereas juveniles captured off the south coast
in winter 2017 showed similar temperatures to those captured off 4.5
West
the west coast (Figure 6). In summer, when the winter-captured
juveniles hatched, wind-driven coastal upwelling does occur 4.0 Adult
along the south coast, in addition to the strong upwelling off the Juvenile in summer
west coast at this time (Lamont et al., 2018). In addition, a quasi- Juvenile in winter
3.5
permanent ridge of cool water extends along the 100 m isobath 10 12 14 16 18
on the eastern Agulhas Bank between 22 and 24 E due to shelf- Temperature (oC)
edge upwelling during spring and summer (Swart and Largier,
1987). The disappearance of the temperature gradient in the Figure 6. (a) Longitudinal variation of estimated temperature and
summer-hatched (winter-captured) cohort suggests that sardine (b) relationship between estimated temperature and fork length at
off the south coast may have utilized these upwelled waters that 60 dph. Station means and standard errors are shown. Stations
including less than three individuals were excluded. The colours in
resulted in their high otolith d18O values. Such individuals with
(b) represent the areas of capture.
high otolith d18O and slow growth, however, were rarely found in
the adults captured off the south coast (Figure 4a and b). This
sardine adults are mainly distributed to the west of 20 E and to
may be because summer-hatched cohorts do not contribute sub-
the east of 22 E, and considered the area 20–22 E, the Central re-
stantially to recruitment in the southern subpopulation, as the
gion in this study, as the mixing area between the putative west-
spawning by these fish peaks in winter to spring, hence, it can be
ern and southern subpopulations. However, the nursery
concluded that the majority of individuals in the southern sub-
population grows faster in warmer waters than those in the west- temperature and early life growth of sardine from the Central re-
ern subpopulation. Alternatively, juvenile sardine collected off gion were similar to those of fish from the West in all sample sets
the south coast in winter 2017 may in fact have been spawned off we analysed but were significantly different to those of fish from
the west coast in the preceding summer and subsequently mi- the South for adult and summer-captured juvenile sardine.
grated south and eastward to the join the southern subpopula- Therefore, based on their ecology, sardine in the Central region
tion. This may be a more likely explanation as there is clear appear to be more likely to belong to the western subpopulation
evidence from survey-derived length frequency distributions of and thus may have to be treated as such in fishery management.
recruits having moved from the west to the south coast in some Further investigation is required to clarify whether fish that
years. In addition, hatch dates and the otolith characteristics of participate in the sardine run along the east coast comprise a
winter-collected juveniles from the South were not different to third subpopulation. The run “most likely corresponds to a sea-
those from the West or Central regions (Figures 4e and f and 5). sonal spawning migration of a genetically distinct subpopulation
The sardine two-stock assessment model assumes mixing between of sardine responding to a strong instinct of natal homing”
western and southern subpopulations via a year-varying propor- (Fréon et al., 2010). Sardine catches off the south coast typically
tion of western recruits and some older fish that move perma- peak in winter (Beckley and van der Lingen, 1999), indicating
nently to the southern subpopulation (de Moor et al., 2017). that not all sardine in that region participate in the run, and esti-
Although Cape Agulhas (20 E) has been considered to approx- mates of the biomass of sardine in the run from three surveys
imate the boundary between western and the southern sardine (conducted in 1986, 1987, and 2005) were all 30 000 t, despite
subpopulations off South Africa, our results suggest that it may overall population size ranging from 0.3 to 3 million t between
occur several degrees east of Cape Agulhas, which can be impor- the two time periods (Coetzee et al., 2010). However, otolith
tant when setting the boundary of management units. Based on d18O and growth rates of early life stages did not show marked
data collected during hydroacoustic and trawl surveys conducted differences between adult sardine from the south and east coasts.
over the period 1984–2007, Coetzee et al. (2008) showed that This appears to contradict the hypothesis that relatively lowerPopulation structure of South African sardine 9
d18O values (indicative of higher temperatures) would be ob- larvae and their prey may be more important because the enrich-
served in sardine from the east coast, where the dominance of the ment processes do not persist as long as coastal upwelling off the
Agulhas Current is particularly strong because of the very narrow west coast. As match-mismatch has been considered a key process
continental shelf in that region. Even if individuals in the sardine determining survival of Japanese sardine Sardinops melanostictus
run had originated from spawning off the east coast, they appear in warm current systems in the western North Pacific (Nishikawa
to have been rapidly transported to and grown in cooler areas off and Yasuda, 2008; Kodama et al., 2018), this may also be the case
the south coast, such as the area around Port Alfred where strong for South African sardine off the south coast.
upwelling is frequently observed (Lutjeharms et al., 2000). It should be noted that the estimation of nursery temperature
Downloaded from https://academic.oup.com/icesjms/advance-article/doi/10.1093/icesjms/fsaa130/5899240 by guest on 29 September 2020
Sardine larvae are commonly encountered off the east coast in based on otolith d18O includes some potential errors. First, the
spring (September/October) but juveniles are infrequently seawater d18O value used for temperature estimation was pre-
recorded there (see van der Lingen et al., 2010a and references dicted from the longitude at catch. This implicitly assumes that
therein), hence, it appears likely that the east coast (in particular the fish had not moved substantially from where they were lo-
the KZN north coast, i.e. east of 30 E) is not an important sar- cated during their first 2 months of life, which is not necessarily
dine nursery area and that early life history stages are transported
the case especially for adults. Second, the equation between oto-
southwards to recruit on the south coast, where they likely mix
lith d18O and ambient water temperature, which was used to con-
with members of the southern subpopulation. Future studies that
vert otolith d18O to temperature, was derived for Japanese
provide d18O analyses at a higher resolution using microvolume
sardine (Sakamoto et al., 2017) and was not calibrated for sardine
carbonate isotope analytical system MICAL3c (Ishimura et al.,
around South Africa. It has been suggested that the intercept of
2004, 2008; Sakamoto et al., 2019) may allow a more accurate
view of the life history of fish that participate in the sardine run. the otolith d18O ambient water temperature relationship can vary
A clear, positive relationship between water temperature and even between closely related species while the slope is similar
growth during the first 2 months post-hatch is observed for sar- among a wide variety of fish species (Storm-Suke et al., 2007).
dine sampled around the coast of South Africa (Figure 6b). This Thus the estimated temperature may have consistently shifted to
is consistent with previous observations that sardine larvae cap- some extent (estimated temperatures are 2–4 C lower than ob-
tured at higher temperatures off Namibia and the South African served sea surface temperatures for each of the four regions).
west coast had faster recent (over the 5 days before capture) Nonetheless, the original otolith d18O before temperature conver-
growth rates compared to those captured at lower temperatures sion was significantly higher in sardine from the West region
(Thomas, 1986). Laboratory experiments for European sardine than in fish from the South in both adults and summer-captured
Sardina pilchardus have shown that under good feeding condi- juveniles. As it would be difficult to explain this difference due to
tions larval growth increased with increasing temperature, but spatial variation in seawater d18O because it has the opposite
that this was achieved at the expense of a significant increase in trend (being lower in the West) with limited seasonal variations,
the number of foraging events (Garrido et al., 2016), which indi- the otolith d18O solely suggests that the sardine nursery environ-
cates that fast growth in warm waters requires a sufficient food ment is cooler in the West than in the South or East regions. In
supply. Recently, Costalago et al. (2020) compared otolith micro- addition, the potential variation in the intercept of the fraction-
structure and nucleic acid ratios of larval (5–25 mm TL) Cape an- ation equation does not affect the relative difference of nursery
chovy (Engraulis encrasicolus) sampled off the South African west temperature. Hence, although the estimated temperature may not
(33–34.5 S) and southeast (26–26.5 E) coasts. Those authors be completely accurate, it does not weaken the conclusion that
reported higher individual growth rates at any given age, and the nursery temperatures differ by several degrees between the
higher RNA: DNA values indicative of higher instantaneous West and the South regions.
growth rates, for anchovy larvae on the southeast coast than on Overall, the application of otolith d18O and otolith microstruc-
the west coast. Both our results and those of Costalago et al. ture analyses has suggested the existence of sardine subpopula-
(2020) indicate that food does not limit early growth of sardine tions off the west and the south coasts of South Africa that grow
and anchovy on the South African south and east coasts. in different nursery environments and at different rates, with pos-
Small-scale coastal upwelling at capes and large-scale shelf-
sibly a third subpopulation off the east coast. This pattern in
edge upwelling drive productivity off the south coast, whereas
South African sardine may reflect general features of the ecology
large-scale coastal upwelling and large-scale wind-stress-curl-
of Sardinops sp. in upwelling and western boundary current
driven upwelling are the primary drivers off the west coast
regions around the world, hence comparisons of these data with
(Kirkman et al., 2016). Additionally, the two regions show differ-
those from sardine in other systems would be of particular inter-
ent seasonality in primary production, with Chl a levels highest in
spring-summer off the west coast and in autumn-winter off the est. For example, the biomass of Japanese sardine in the Kuroshio
south coast (Demarcq et al., 2007). Sardine spawning peaks be- Current system tends to increase in relatively cooler periods while
tween spring and summer off the west coast and during winter to that of Pacific sardine in the Californian Current system tends to
spring off the south coast, indicating that the putative sardine increase in warmer periods (e.g. Chavez et al., 2003); hence, ana-
subpopulations off the west and the south coast have different lysing the responses of South African sardine subpopulations to
strategies to utilize different ocean enrichment processes. This environmental variations may provide further insights into the
suggests that factors driving sardine biomass fluctuations may be contrasting patterns observed in the North Pacific. As the combi-
different between these different regions, which will be the scope nation of the otolith d18O and otolith microstructure analyses
of future studies. In upwelling systems, retention in stable and could help to understand population structures and also provide
productive coastal areas is considered key for larval survival of insights into drivers of population dynamics, the methods applied
small pelagic fishes (Agostini and Bakun, 2002). Off the south here will likely be useful where stock structure has been an issue
coast, however, temporal and spatial match-mismatch between for fisheries management elsewhere in the world.10 T. Sakamoto et al.
Supplementary data Campana, S. E., and Thorrold, S. R. 2001. Otoliths, increments, and
Supplementary material is available at the ICESJMS online ver- elements: keys to a comprehensive understanding of fish popula-
tions? Canadian Journal of Fisheries and Aquatic Sciences, 58:
sion of the manuscript.
30–38.
Chavez, F. P., Ryan, J., Lluch-Cota, S. E., and Niquen, C. M. 2003.
Data availability statement From anchovies to sardines and back: multidecadal change in the
The datasets generated during and/or analysed during the current Pacific Ocean. Science, 299: 217–221.
study are available from the corresponding author on reasonable Coetzee, J. C., Merkle, D., Hutchings, L., van der Lingen, C. D., van
request.
Downloaded from https://academic.oup.com/icesjms/advance-article/doi/10.1093/icesjms/fsaa130/5899240 by guest on 29 September 2020
den Berg, M., and Durholtz, M. D. 2010. The 2005
KwaZulu-Natal sardine run survey sheds new light on the ecology
Acknowledgements of small pelagic fish off the east coast of South Africa. African
We appreciate Noriko Izumoto and Tomihiko Higuchi Journal of Marine Science, 32: 337–360.
(Atmosphere and Ocean Research Institute, The University of Coetzee, J. C., van der Lingen, C. D., Hutchings, L., and Fairweather,
Tokyo) for their great contributions to d18O analysis on otolith T. P. 2008. Has the fishery contributed to a major shift in the dis-
tribution of South African sardine? ICES Journal of Marine
powders. We are grateful to Tarron Lamont (Department of
Science, 65: 1676–1688.
Forestry, Fisheries and the Environment) for collecting seawater
Connell, A. D. 2010. A 21-year ichthyoplankton collection confirms
samples for d18O analysis during the DEA cruise, and to Brent sardine spawning in KwaZulu-Natal waters. African Journal of
Chiazarri (University of KwaZulu-Natal) for collecting seawater Marine Science, 32: 331–336.
samples from the east coast. We are also grateful to Aril Slotte Costalago, D., Kisten, Y., Clemmesen, C., and Strydom, N. 2020.
(Institute of Marine Research, Norway) and an anonymous re- Growth and nutritional condition of anchovy larvae on the west
viewer for providing a number of constructive comments to im- and southeast coasts of South Africa. Marine Ecology Progress
prove our manuscript. Series, 644: 119–128.
Demarcq, H., Barlow, R., and Hutchings, L. 2007. Application of a
Funding chlorophyll index derived from satellite data to investigate the
This study was funded by the research fund KAKENHI Grants variability of phytoplankton in the Benguela ecosystem. African
from the Japan Society for the Promotion of Science (JSPS) to TS Journal of Marine Science, 29: 271–282.
(17J00556) and TI (16H02944, 18H04921). The work is in part de Moor, C. L., and Butterworth, D. S. 2015. Assessing the South
African sardine resource: two stocks rather than one? African
supported by the International Exchange Program for Graduate Journal of Marine Science, 37: 41–51.
Students of the Graduate School of Agricultural and Life de Moor, C. L., Butterworth, D. S., and van der Lingen, C. D. 2017.
Sciences, The University of Tokyo. The quantitative use of parasite data in multistock modelling of
South African sardine (Sardinops sagax). Canadian Journal of
Author contributions Fisheries and Aquatic Sciences, 74: 1895–1903.
TS and CDvdL designed and conceived the study. CDvdL, YG Edmonds, J., and Fletcher, W. 1997. Stock discrimination of pilchards
and JP collected fish, otolith, and seawater samples. TS performed Sardinops sagax by stable isotope ratio analysis of otolith carbon-
otolith microstructure analysis. TS, KS, and TI performed isotope ate. Marine Ecology Progress Series, 152: 241–247.
analyses. TS and CDvdL wrote the manuscript. All authors con- Fréon, P., Coetzee, J. C., van der Lingen, C. D., Connell, A. D.,
tributed to manuscript editing. O’Donoghue, S. H., Roberts, M. J., Demarcq, H., et al. 2010. A re-
view and tests of hypotheses about causes of the KwaZulu-Natal
References sardine run. African Journal of Marine Science, 32: 449–479.
Garrido, S., Cristóv~ao, A., Caldeira, C., Ben-Hamadou, R., Baylina,
Agostini, V. N., and Bakun, A. 2002. Ocean triads’ in the
N., Batista, H., Saiz, E., et al. 2016. Effect of temperature on the
Mediterranean Sea: physical mechanisms potentially structuring
reproductive habitat suitability (with example application to growth, survival, development and foraging behaviour of Sardina
European anchovy, Engraulis encrasicolus). Fisheries pilchardus larvae. Marine Ecology Progress Series, 559: 131–145.
Oceanography, 11: 129–142. Goethel, D. R., and Berger, A. M. 2017. Accounting for spatial com-
Beckley, L., and van der Lingen, C. 1999. Biology, fishery and man- plexities in the calculation of biological reference points: effects of
agement of sardines (Sardinops sagax) in southern African waters. misdiagnosing population structure for stock status indicators.
Marine and Freshwater Research, 50: 955–978. Canadian Journal of Fisheries and Aquatic Sciences, 74:
Begg, G. A., Friedland, K. D., and Pearce, J. B. 1999. Stock identifica- 1878–1894.
tion and its role in stock assessment and fisheries management: an Groenewald, G., Moloney, C., and van der Lingen, C. 2019. Spatial
overview. Fisheries Research, 43: 1–8. variation in meristic and morphometric characteristics of sardine
Breitenbach, S. F., and Bernasconi, S. M. 2011. Carbon and oxygen Sardinops sagax around the coast of southern Africa. African
isotope analysis of small carbonate samples (20 to 100 mg) with a Journal of Marine Science, 41: 51–60.
GasBench II preparation device. Rapid Communications in Mass Harvey, J. T. 2000. Relationship between Fish Size and Otolith
Spectrometry, 25: 1910–1914. Length for 63 Species of Fishes from the Eastern North Pacific
Brownell, C. 1983. Laboratory rearing of Cape anchovy Engraulis Ocean. NOAA Technical Report NMFS 150. U.S. Department of
capensis and South African pilchard Sardinops ocellata through Commerce, Seattle, Washington.
metamorphosis. South African Journal of Marine Science, 1: Høie, H., Otterlei, E., and Folkvord, A. 2004.
181–188. Temperature-dependent fractionation of stable oxygen isotopes in
Campana, S. E. 1990. How reliable are growth back-calculations otoliths of juvenile cod (Gadus morhua L.). ICES Journal of
based on otoliths? Canadian Journal of Fisheries and Aquatic Marine Science, 61: 243–251.
Sciences, 47: 2219–2227. Hutchings, L., Morris, T., van der Lingen, C. D., Lamberth, S. J.,
Campana, S. E. 1999. Chemistry and composition of fish otoliths: Connell, A. D., Taljaard, S., and van Niekerk, L. 2010. Ecosystem
pathways, mechanisms and applications. Marine Ecology Progress considerations of the KwaZulu-Natal sardine run. African Journal
Series, 188: 263–297. of Marine Science, 32: 413–421.Population structure of South African sardine 11
Hutchings, L., van der Lingen, C., Shannon, L., Crawford, R., Sakamoto, T., Komatsu, K., Shirai, K., Higuchi, T., Ishimura, T.,
Verheye, H., Bartholomae, C., van der Plas, A., et al. 2009. The Setou, T., Kamimura, Y., et al. 2019. Combining microvolume
Benguela Current: an ecosystem of four components. Progress in isotope analysis and numerical simulation to reproduce fish mi-
Oceanography, 83: 15–32. gration history. Methods in Ecology and Evolution, 10: 59–69.
Idris, I., Moloney, C., and van der Lingen, C. 2016. Spatial variability Sakamoto, T., Komatsu, K., Yoneda, M., Ishimura, T., Higuchi, T.,
in branchial basket meristics and morphology of southern African Shirai, K., Kamimura, Y., et al. 2017. Temperature dependence of
sardine Sardinops sagax. African Journal of Marine Science, 38: d18O in otolith of juvenile Japanese sardine: laboratory rearing ex-
351–362. periment with micro-scale analysis. Fisheries Research, 194:
55–59.
Downloaded from https://academic.oup.com/icesjms/advance-article/doi/10.1093/icesjms/fsaa130/5899240 by guest on 29 September 2020
Ishimura, T., Tsunogai, U., and Gamo, T. 2004. Stable carbon and
oxygen isotopic determination of sub-microgram quantities of Shirai, K., Koyama, F., Murakami-Sugihara, N., Nanjo, K., Higuchi,
CaCO3 to analyze individual foraminiferal shells. Rapid T., Kohno, H., Watanabe, Y., et al. 2018. Reconstruction of the sa-
Communications in Mass Spectrometry, 18: 2883–2888. linity history associated with movements of mangrove fishes using
Ishimura, T., Tsunogai, U., and Nakagawa, F. 2008. Grain-scale het- otolith oxygen isotopic analysis. Marine Ecology Progress Series,
erogeneities in the stable carbon and oxygen isotopic composi- 593: 127–139.
tions of the international standard calcite materials (NBS 19, NBS Storm-Suke, A., Dempson, J. B., Reist, J. D., and Power, M. 2007. A
18, IAEA-CO-1, and IAEA-CO-8). Rapid Communications in field-derived oxygen isotope fractionation equation for Salvelinus
Mass Spectrometry, 22: 1925–1932. species. Rapid Communications in Mass Spectrometry, 21:
Jackson, J. M., Rainville, L., Roberts, M. J., McQuaid, C. D., and 4109–4116.
Lutjeharms, J. R. 2012. Mesoscale bio-physical interactions be- Swart, V., and Largier, J. 1987. Thermal structure of Agulhas Bank
tween the Agulhas Current and the Agulhas Bank, South Africa. water. South African Journal of Marine Science, 5: 243–252.
Continental Shelf Research, 49: 10–24. Tanner, S. E., Reis-Santos, P., and Cabral, H. N. 2016. Otolith chem-
Kim, S., Mucci, A., and Taylor, B. E. 2007. Phosphoric acid fraction- istry in stock delineation: a brief overview, current challenges and
ation factors for calcite and aragonite between 25 and 75 C: revis- future prospects. Fisheries Research, 173: 206–213.
ited. Chemical Geology, 246: 135–146. Teske, P. R., Golla, T. R., Sandoval-Castillo, J., Emami-Khoyi, A., van
Kirkman, S., Blamey, L., Lamont, T., Field, J., Bianchi, G., Huggett, der Lingen, C. D., von der Heyden, S., Chiazzari, B., et al. 2018.
J., Hutchings, L., et al. 2016. Spatial characterisation of the Mitochondrial DNA is unsuitable to test for isolation by distance.
Scientific Reports, 8: 8448.
Benguela ecosystem for ecosystem-based management. African
Journal of Marine Science, 38: 7–22. Thomas, R. 1986. Growth of larval pelagic fish in the South-East
Atlantic from daily otolith rings in 1982/83 and 1983/84. South
Kodama, T., Wagawa, T., Ohshimo, S., Morimoto, H., Iguchi, N.,
African Journal of Marine Science, 4: 61–77.
Fukudome, K., Goto, T., et al. 2018. Improvement in recruitment
of Japanese sardine with delays of the spring phytoplankton UK Met Office. 2005. GHRSST Level 4 OSTIA Global Foundation
bloom in the Sea of Japan. Fisheries Oceanography, 27: 289–301. Sea Surface Temperature Analysis. https://doi.org/10.5067/
GHOST-4FK01 (last accessed 27 December 2018).
Lamont, T., Garcı́a-Reyes, M., Bograd, S., van der Lingen, C., and
Sydeman, W. 2018. Upwelling indices for comparative ecosystem Uren, R. C., van der Lingen, C. D., Kylin, H., and Bouwman, H.
2020. Concentrations and relative compositions of metallic ele-
studies: variability in the Benguela Upwelling System. Journal of
ments differ between predatory squid and filter-feeding sardine
Marine Systems, 188: 3–16.
from the Indian and South Atlantic oceans. Regional Studies in
LeGrande, A. N., and Schmidt, G. A. 2006. Global gridded data set of Marine Science, 35: 101137.
the oxygen isotopic composition in seawater. Geophysical
Van der Lingen, C. D., and Huggett, J. A. 2003. The role of ichthyo-
Research Letters, 33: L12604.
plankton surveys in recruitment research and management of
Lutjeharms, J., Cooper, J., and Roberts, M. 2000. Upwelling at the in- South African anchovy and sardine. In The Big Fish Bang:
shore edge of the Agulhas Current. Continental Shelf Research, Proceedings of the 26th Annual Larval Fish Conference, pp.
20: 737–761. 303–343. Ed. by H. I. Browman and A. B. Skiftesvik. Institute of
McGrath, A. M., Hermes, J. C., Moloney, C. L., Roy, C., Cambon, G., Marine Research, Bergen, Norway.
Herbette, S., and Lingen, C. D. 2020. Investigating connectivity van der Lingen, C., Coetzee, J., and Hutchings, L. 2010a. Overview of
between two sardine stocks off South Africa using a high resolu- the KwaZulu-Natal sardine run. African Journal of Marine
tion IBM: retention and transport success of sardine eggs. Science, 32: 271–277.
Fisheries Oceanography, 29: 137–151. van der Lingen, C., Hendricks, M., Durholtz, M., Wessels, G., and
Miller, D. C. M., Moloney, C. L., van der Lingen, C.D., Lett, C., Mtengwane, C. 2010b. Biological characteristics of sardine caught
Mullon, C., and Field, J. G. 2006. Modelling the effects of by the beach-seine fishery during the KwaZulu-Natal sardine run.
physical-biological interactions and spatial variability in spawning African Journal of Marine Science, 32: 309–330.
and nursery areas on transport and retention of sardine Sardinops van der Lingen, C. D., and McGrath, A. 2017. Incorporating
sagax eggs and larvae in the southern Benguela ecosystem. Journal Seasonality in Sardine Spawning into Estimations of the
of Marine Systems, 61: 212–229. Transport Success of Eggs Spawned on the South Coast to the
Nishikawa, H., and Yasuda, I. 2008. Japanese sardine (Sardinops mel- West Coast Nursery Area. Unpublished Document
anostictus) mortality in relation to the winter mixed layer depth MARAM/IWS/2017/Sardine/BG6. https://drupalupload.uct.ac.za/
in the Kuroshio Extension region. Fisheries Oceanography, 17: maram/Documents/pub/2017/IWS%202017/MARAM_IWS_
411–420. 2017_Sardine_BG6.pdf (last accessed 13 July 2020).
Politikos, D. V., Curchitser, E. N., Rose, K. A., Checkley, D. M. Jr, van der Lingen, C. D., Weston, L. F., Ssempa, N. N., and Reed, C. C.
and Fiechter, J. 2018. Climate variability and sardine recruitment 2015. Incorporating parasite data in population structure studies
in the California Current: a mechanistic analysis of an ecosystem of South African sardine Sardinops sagax. Parasitology, 142:
model. Fisheries Oceanography, 27: 602–622. 156–167.
Roberts, M., van der Lingen, C., Whittle, C., and van den Berg, M. Waldron, M. 1998. Annual ring validation of the South African sar-
2010. Shelf currents, lee-trapped and transient eddies on the in- dine Sardinops sagax using daily growth increments. South
shore boundary of the Agulhas Current, South Africa: their rele- African Journal of Marine Science, 19: 425–430.
vance to the KwaZulu-Natal sardine run. African Journal of Weston, L. F., Reed, C. C., Hendricks, M., Winker, H., and van der
Marine Science, 32: 423–447. Lingen, C. D. 2015. Stock discrimination of South African sardine12 T. Sakamoto et al.
(Sardinops sagax) using a digenean parasite biological tag. Ying, Y., Chen, Y., Lin, L., and Gao, T. 2011. Risks of ignoring fish
Fisheries Research, 164: 120–129. population spatial structure in fisheries management. Canadian
Wu, Q., Schlag, S., Uren, R., van der Lingen, C. D., Bouwman, H., Journal of Fisheries and Aquatic Sciences, 68: 2101–2120.
and Vetter, W. 2020. Polyhalogenated compounds (halogenated Zweng, M. M., Reagan, J. R., Seidov, D., Boyer, T. P., Locarnini, R.
natural products and POPs) in sardine (Sardinops sagax) from the A., Garcia, H. E., Mishonov, A. V., et al., 2018. World Ocean Atlas
South Atlantic and Indian Oceans. Journal of Agricultural and 2018, 2: Salinity. A. Mishonov Technical Ed.; NOAA Atlas
Food Chemistry, 68: 6084–6091. NESDIS 82. 50 pp.
Yatsu, A. 2019. Review of population dynamics and management of
small pelagic fishes around the Japanese Archipelago. Fisheries
Downloaded from https://academic.oup.com/icesjms/advance-article/doi/10.1093/icesjms/fsaa130/5899240 by guest on 29 September 2020
Science, 85: 611–639.
Handling editor: Manuel HidalgoYou can also read