Ifo WORKING PAPERS 336 2020 - ifo Institut
←
→
Page content transcription
If your browser does not render page correctly, please read the page content below
ifo                                                          336
                                                            2020
WORKING                                                     August 2020

PAPERS
 Economic Deprivation and
 Radical Voting: Evidence from
 Germany
 Florian Dorn, Clemens Fuest, Lea Immel, Florian Neumeier
Imprint: ifo Working Papers Publisher and distributor: ifo Institute – Leibniz Institute for Economic Research at the University of Munich Poschingerstr. 5, 81679 Munich, Germany Telephone +49(0)89 9224 0, Telefax +49(0)89 985369, email ifo@ifo.de www.ifo.de An electronic version of the paper may be downloaded from the ifo website: www.ifo.de
ifo Working Paper No. 336

                 Economic Deprivation and Radical Voting:
                       Evidence from Germany*
                                            Abstract
This paper studies the impact of economic deprivation on radical voting. Using a unique
dataset covering different indicators of economic deprivation as well as federal election
outcomes at the county-level in Germany for the period from 1998 to 2017, we examine
whether economic deprivation affects the share of votes for radical right and left-wing parties
using instrumental variable estimation. Our results suggest that an increase in economic
deprivation has a sizeable effect on the support for radical parties at both ends of the political
spectrum. The higher a county’s rate of relative poverty, the average shortfall from the
national median income, and the poverty line, the higher the vote share of radical right-wing
and left-wing parties. We also provide evidence that regional variation in economic deprivation
gave rise to the electoral success of the populist right-wing party AfD in the federal election
of 2017. Our findings thus indicate that a rise in economic deprivation may undermine
moderate political forces and be a threat to political stability.
JEL code: I32, D31, D73
Keywords: Economic deprivation, inequality, political polarization, radical voting, Germany

                Florian Dorn                                       Clemens Fuest**
    ifo Institute – Leibniz-Institute for                ifo Institute – Leibniz-Institute for
            Economic Research                                    Economic Research
        at the University of Munich,                         at the University of Munich,
            University of Munich                            University of Munich, CESifo
              Poschingerstr. 5                                     Poschingerstr. 5
          81679 Munich, Germany                                81679 Munich, Germany
                dorn@ifo.de                                          fuest@ifo.de

                 Lea Immel                                         Florian Neumeier
    ifo Institute – Leibniz-Institute for                ifo Institute – Leibniz-Institute for
            Economic Research                                    Economic Research
        at the University of Munich,                         at the University of Munich,
            University of Munich                                         CESifo
              Poschingerstr. 5                                      Poschingerstr. 5
          81679 Munich, Germany                                81679 Munich, Germany
               immel@ifo.de                                        neumeier@ifo.de

* We thank participants of the 2018 meeting of the European Public Choice Society in Rome, the 2018
annual congress of the International Institute of Public Finance in Tampere, the 2018 annual conference
of the German Economic Association (Verein für Socialpolitik) in Freiburg, the 15th PEARL workshop in
Zermatt in 2018, a conference on regional inequalities held in 2018 at the University of Marburg, the
MACIE Research Seminar at the University of Marburg, the 2019 Doctoral workshop of the Hanns-
Seidel-Foundation at the Banz monastery, the 2019 annual congress of the European Economic Associa-
tion in Manchester, the 2019 Canadian Economics Association annual conference in Banff, and the
2019 meeting of the Society for the Study of Economic Inequality in Paris for helpful comments on
earlier versions of this paper. The usual disclaimer applies.
** Corresponding author.
1 Introduction
Over the past decades, economic inequality as well as the share of people suffering from
(relative) economic deprivation has increased in many industrialized countries. This trend
has not only spurred research into the underlying causes and economic consequences, but
also triggered heated public debates about its political and social implications. One of the
major concerns is that the rise in economic deprivation jeopardizes social cohesion and
nourishes radical and populist political movements. The economic pressure experienced by
certain groups in society is widely believed to fuel resentment against mainstream political
parties as well as the political order itself. Many pundits link the increase in economic
deprivation to the emergence of populist movements and the surge in public support for
radical parties in Europe and other parts of the world: Syriza in Greece, Podemos in Spain,
MoVimento-5-Stelle (5-Star-Movement) and Lega in Italy, Front National in France, Fidesz in
Hungary, the Sverigedemokraterna (Sweden Democrats) in Sweden, or the Alternative für
Deutschland (Alternative for Germany; AfD) in Germany are only a few examples of parties
at the far left and far right of the political spectrum that capitalize on growing economic
insecurity and deprivation. Moreover, the rise in economic deprivation is believed to be
one of the major sources of what has been labelled neo-nationalism – a political leaning that
promotes nativism, opposition to immigration, and protectionism.
The available empirical evidence suggests that, in general, economic deprivation and
support for radical views and parties are indeed correlated. Evidence on the causal
relationship is scarce, though. Our paper contributes to the literature by examining the
causal effect of economic deprivation on support for radical parties in Germany. To this end,
we exploit regional variation in election outcomes as well as the prevalence and intensity of
economic deprivation. More precisely, we estimate regressions linking the share of radical
left-wing and right-wing votes to regional indicators of economic deprivation. We measure
economic deprivation of regions’ citizens relative to the national average (not inequality
or relative deprivation within regions). To identify causal effects, we follow Boustan et al.
(2013) and construct instruments for region-specific measures of economic deprivation that
are exogenous to asymmetric economic developments, endogenous political reactions to the
rise in the support for radical parties, as well as endogenous sorting of individuals into
regions.
Our analysis is conducted at the county-level, corresponding to NUTS-3. In the main part of
our analysis, we use data for the period from 1998 to 2017. In an extension, we restrict
our focus to the federal elections held in 2017 and the vote share of the AfD, which is
interesting for at least two reasons. First, the AfD is the first nationalist party represented
in the German federal parliament with significant size since World War II. Second, survey
1evidence indicates that AfD supporters -- unlike supporters of other radical right-wing
parties in Germany -- do not differ in their socioeconomic characteristics from supporters
of parties at the center of the political spectrum, like the Christian Democratic Party (CDU)
or the Social Democratic Party (SPD), in terms of income, education, or employment status
Bergmann et al. (e.g. 2017); Hansen and Olsen (e.g. 2019).
Germany is particularly well-suited to study the effect of regional economic deprivation
on the support for radical parties. The multi-party system in Germany covers parties from
the entire political spectrum, including far left-wing and far right-wing parties. Arguably,
this constitutes an important advantage over studies that focus on countries where only few
parties compete in elections, like the U.S. or U.K., as it facilitates the measurement of political
polarization. Moreover, by using data on election outcomes, we observe the electorate’s
revealed support for radical parties. This is an advantage over studies that rely on survey
data, which only include stated preferences, not real voting behavior.
Our findings suggest that economic deprivation has a statistically and economically
significant effect on the vote share of radical parties. The higher the intensity of economic
deprivation in a county – measured by the average shortfall from the national median
income (median gap), the poverty line (poverty gap), as well as the poverty rate – the more
successful are radical parties at the polls. For instance, if the poverty gap (median gap)
increases by one percentage point (pp), the share of radical right-wing party votes rises, on
average, by 1.2 (0.7) pp. This effect is even more pronounced when focusing on the AfD
votes at the 2017 federal election. Here, a one pp increase in the poverty gap (median gap)
leads to a rise in the AfD vote share by 4.9 (1.9) pp. This effect is more pronounced in East
Germany compared to West Germany. Our results thus indicate that economic deprivation is
an important determinant of the electoral success of radical right-wing parties in Germany.
In contrast, our results for radical left-wing parties are more ambiguous in that they are
sensitive to the definition of radical parties, and whether East or West German counties are
examined.
How can these results be reconciled with the observation from survey evidence that AfD
voters are not poorer, on average, than other voters ((Bergmann et al., 2017; Hansen and
Olsen, 2019))? One explanation is that middle or even upper class voters in counties with a
high degree of deprivation vote for AfD because they perceive higher economic threat and
fear for their status, not because they are poor.
The rest of the paper is organized as follows. In Section 2, we review the related literature,
motivate the connection between economic deprivation and the support for radical parties,
and explain our contribution. Section 3 describes our data. Section 4 provides some
descriptive evidence on regional variation in economic deprivation and election outcomes
in Germany. In Section 5, we explain our estimation strategy. Our results are presented in
2Section 6. In Section 7, we examine the effect of economic deprivation on election outcomes
of the radical party AfD in the federal election of 2017. Section 8 concludes.
2 Related Literature, Hypotheses, and Contribution
2.1 The Economics of Radical Voting
Economic conditions matter at the polls. In fact, among the various determinants of voting
behavior scholars have been analyzing, economic circumstances are typically considered
to be among the most important ones Fair (e.g. 1978); Lewis-Beck (e.g. 1990); Lewis-Beck
and Stegmaier (e.g. 2000, 2013). Consequently, in an attempt to explain the increase in
political polarization as well as the rising support for radical parties – especially nationalist
ones – various Western countries have been experiencing over the past few years, many
scholars focus on economic factors. Recent empirical studies have linked the rise in political
radicalism and nationalist (including anti-immigration) sentiments to major macroeconomic
trends and events, particularly economic globalization and its adverse consequences (Autor
et al., 2020; Colantone and Stanig, 2018; Dippel et al., 2018; Malgouyres, 2017), growing
economic insecurity (Algan et al., 2017; Dal Bó et al., 2018; Guiso et al., 2017), the economic
strains resulting from the financial and economic crisis (Funke et al., 2016; Mian et al., 2014),
as well as rising economic inequality (Duca and Saving, 2016; Garand, 2010; Jesuit et al.,
2009; McCarty et al., 2016; Voorheis et al., 2015; Winkler, 2019).1
Most approaches linking radical voting to inequality and economic deprivation emphasize
the importance of relative deprivation. The concept of relative deprivation suggests that
individual support for radical (political) views results from an unfavorable comparison
with other members of society (Runciman, 1966; Runciman and Bagley, 1969). Plainly
speaking, people tend to be more concerned about their relative standing in a society’s
income distribution than their absolute level of income. An unfavorable social comparison
or the fear of social decline are believed to trigger feelings of anxiety and frustration - people
are convinced that they are not getting what they are entitled to. Those feelings, in turn,
may foster resentments against the political mainstream as well as the political system itself
(Algan et al., 2017; Dal Bó et al., 2018; Mutz, 2018). An inclination toward such sentiments
seems to make the economically deprived particularly responsive to the messages of radical
political parties and movements. Radical and populist politicians try to appeal to voters
1 A related literature strand links economic strain to anti-immigrations sentiments as well as right-wing
extremist crime. See, for example, Becker et al. (2017), Guiso et al. (2017), Davis and Deole (2015), Billiet
et al. (2014), Falk et al. (2011), Facchini and Mayda (2009), and Mayda (2006).
3experiencing relative economic deprivation by posing as their advocates and discrediting
mainstream political parties and political institutions (Mudde, 2007).
The traditional view is that economic deprivation translates into greater support for
left-wing parties as they advocate redistributive policies and cater to the needs of those at
the bottom of the income distribution (Meltzer and Richard, 1981; Romer, 1975). However,
recent studies point out that economic deprivation can increase the popularity of right-wing
parties as well. Aggeborn and Persson (2017) develop a theoretical model to explain why
low-income voters are prone to support right-wing (populist) parties. They argue that
low-income voters are particularly vulnerable to economic insecurity and depend more
heavily on basic public services. In contrast to left-wing parties, right-wing parties oppose
spending on global goods such as generous refugee support systems, foreign aid, and
environmental protection in favor of basic public services that mainly benefit the domestic
population.
Other scholars emphasize that in a highly globalized world, the welfare state is constrained
in its ability to redistribute resources and to raise taxes due to the danger of capital
flight (Antràs et al., 2017; Sinn, 2003). When redistribution becomes prohibitively costly,
protectionist views and hostile attitudes toward globalization may become particularly
popular among voters suffering from economic deprivation. As Colantone and Stanig (2018,
p.3) put it: “As the losers (of globalization; authors’ note) realize that effective redistribution
policies are not feasible, the demand for protection emerges as an alternative. This breeds
the success of economic nationalism.” Consequently, in a country that is highly integrated
into the world economy, radical right-wing parties may have a particularly great appeal to
voters suffering from economic deprivation.
2.2 Empirical Evidence on the Association between Deprivation and
Polarization
Existing empirical evidence appears to support the conjecture that indicators related to
economic deprivation such as unemployment, a low income level, and economic inequality
are positively related to political polarization and the support for radical parties.2 Duca
and Saving (2016), Garand (2010), and McCarty et al. (2016) for the U.S., Guiso et al. (2017)
and Jesuit et al. (2009) for samples of European countries, Lubbers and Scheepers (2001) for
Germany, as well as Dal Bó et al. (2018) and Rydgren and Ruth (2011) for Sweden are just a
few of the studies that document such an empirical relationship.
2 Some scholars argue that unemployed people, lower skilled workers and the ‘old middle class’ are
particularly affected by economic insecurity and perceptions of relative economic deprivation (Dal Bó et al.,
2018; Inglehart and Norris, 2017; Rydgren, 2007).
4However, the bulk of the empirical literature analyses statistical correlations. Causal
evidence on the effect of economic deprivation on political polarization or radical voting is
scarce. To the best of our knowledge, the only studies that employ a credible identification
strategy to estimate the causal impact of indicators of economic deprivation on the support
for radical parties and political polarization are Voorheis et al. (2015), Algan et al. (2017), and
Winkler (2019).
Voorheis et al. (2015) and Winkler (2019) adopt the instrumental variable approach proposed
by Boustan et al. (2013) that is also used in the present paper and explained in detail below.
Voorheis et al. (2015) use data on the degree of political polarization in U.S. state legislatures
and state-level data on income inequality covering the years from 2005 to 2011. The
authors report a positive effect of income inequality on political polarization. Winkler (2019)
uses survey data from different European countries aggregated at different NUTS levels
covering the period from 2002 and 2014. The evidence he provides suggests that an increase
in inequality within a region increases the share of people supporting extreme left-wing
parties. In contrast, an increase in inequality increases the support for extreme right-wing
parties only among older voters. Algan et al. (2017) use data from European countries at
the NUTS-2 level for the period from 2000 to 2016 and examine the effect of crises-driven
increases in regional unemployment on vote shares for anti-establishment parties. The
authors use regional variation in the pre-crisis share of real estate and housing construction
as instrument for regional unemployment. Their estimates suggest that a crisis-induced rise
in unemployment increases vote shares of anti-establishment parties, especially populist
ones.
Our paper contributes to the literature in several ways. First, by focusing on German
counties (corresponding to the NUTS-3 level), this paper uses data collected at a much more
granular regional level than the literature cited above. In Germany, there are currently more
than 400 counties with, on average, roughly 170,000 inhabitants. Exploiting variation at
such a highly disaggregated regional level increases both our sample size as well as the
variation in our measures of economic deprivation and, thus, the power of the statistical
tests we perform. Second, most of the studies listed above use survey data to study the
association between economic deprivation and political polarization. In contrast, we assess
the support for radical parties using data on election outcomes and, thus, capture the
electorate’s revealed (and not stated) political preferences. Third, many studies utilize data
from the U.S. Due to its two-party system, it is rather tedious to measure the degree of
political polarization in the U.S. The multi-party system in Germany covers parties from the
entire political spectrum, including parties at the far right and the far left. This facilitates the
measurement of political polarization.3 Fourth, our sample period covers two decades and,
3 Studies with a focus on the U.S. typically rely on DW-nominate scores to measure the degree political
polarization within U.S. politics. DW-nominate scores represent measures of the distance between
5thus, a considerably larger time span than the studies discussed above. This is particularly
important because the degree of economic deprivation typically changes only slowly over
time. Finally, in our empirical analysis, we employ different measures of regional economic
deprivation, that is, the poverty rate, the poverty gap, as well as the median gap, which has
not been done before.
3 Data Description
To study the influence of economic deprivation on electoral outcomes, we construct a
unique panel dataset covering more than 400 counties in Germany. Our dataset combines
county-specific measures of economic deprivation and outcomes of federal elections that
took place between 1998 and 2017. During this period, federal elections were held six times;
in 1998, 2002, 2005, 2009, 2013, and 2017. Due to territorial reforms, the number of counties
varies across our sample period. Therefore, our panel dataset is slightly unbalanced. To
construct our variables of main interest, we mainly rely on two sources. Regional measures
of economic deprivation are constructed based on microdata from the German Microcensus
(Mikrozensus). Federal election outcomes at the county-level are provided by the Federal
Returning Officer (Bundeswahlleiter).
3.1 The German Microcensus
The Microcensus is a household survey carried out annually since 1957 by the statistical
offices of the German states (Statistische Landesämter) and administered by the Federal
Statistical Office (Statistisches Bundesamt). It comprises a representative one percent-sample
of the German population, resulting in a sample size of more than 800,000 persons in
almost 400,000 households per year. The sample is representative at the regional level. The
Microcensus contains information on various demographic characteristics, including the
county of residence, employment status, household size, the age of all household members,
and household income. For our analysis, we use the waves from 1991 to 2017.
Besides the large number of variables, one major advantage of the Microcensus is its large
sample size, which allows us to construct indicators of economic deprivation at the regional
level. Moreover, the Microcensus is administered by a federal agency and there is a legal
obligation to answer the questions. Hence, item-non-response is not an issue. Also, answers
legislators. These scores indicate how similar or different, respectively, the voting records of legislators are.
DW-nominate scores are not without criticism. Only recently, the political science journal Studies in American
Political Development has devoted a special issue on the advantages and disadvantaged of the DW-nominate
scores. See Studies in American Political Development, Vol. 30, Issue 2, 2016.
6must be truthful and complete. This makes the Microcensus well-suited to study economic
deprivation at the county-level in Germany.
To construct our measures of economic deprivation, we use information on monthly net
household income. To account for differences in household size, we compute equivalized
household incomes using the OECD equivalence scale. In addition, we adjust the income
figures for changes in prices using the consumer price index for Germany. Note that the
income variable in the Microcensus dataset is interval-censored, i.e., respondents are asked
to indicate in which income class they are. However, the width of the income classes
are rather narrow and the number of income classes is large, varying between 18 and
24, depending on the survey year. To obtain continuous household income figures, we
apply an imputation approach. We estimate a continuous income figure for each household
based on information on a household’s income class as well as various socio-demographic
characteristics using interval regressions. This imputation technique ensures that the
empirical distribution of the continuous income variable fits the shape of the distribution
of the income classes and that the income figure computed for each household lies within
the borders of the income household’s income class (see Royston, 2007).
3.2 Indicators of Economic Deprivation
A large literature suggests that concerns about personal economic well-being determine
preferences for redistribution and protectionism and thereby voting behavior (cf. Section 2).
When focusing on federal elections, we thus expect that an individual’s position in the
national income distribution is decisive for her vote. This implies that a regionally
aggregated measure of economic deprivation should indicate how residents residing in a
county compare to the national average.
In our empirical analysis, we employ three different indicators of economic deprivation that
account for the relative economic well-being of a county’s citizens compared to the national
average. Our first indicator is the poverty rate, i.e., the share of households in a county with
an income below the national poverty line znat pov,t . As it is common, we set the poverty line
equal to 60 percent of the national median income z50,t nat , so that znat = 0.6 × znat .
pov,t 50,t
Our second indicator of economic deprivation is the poverty gap, which is defined as the
average shortfall from the national poverty line:
1
q znat
pov,t − yijt
Poverty gapit = 100
nit ∑ znat
(1)
j =1 pov,t
7Here, nit is the number of households in county i and year t that are included in the
Microcensus data, q is the number of households with an income below the poverty line,
and yijt is the income of household j.
Our third measure of relative economic deprivation is constructed in a similar fashion, but
measures the average shortfall from the national median income (instead of the poverty
line). We refer to this measure as the median gap. It is constructed as follows:
r nat − y
z50,t
1 ijt
Median gapit = 100
nit ∑ nat
z50,t
(2)
j =1
r refers to the number of households in a county with an income below the national median
income, while the other variables in equation (2) are defined as above.
3.3 The German Electoral System and the Definition of Radical Parties
The electoral system in Germany is based on proportional representation and multiple
parties run for elections. Since those parties cover the entire political spectrum from the far
left to the far right, Germany is a particularly interesting country to study the association
between economic deprivation and support for radical parties. At federal elections in
Germany, voters have two votes: The first vote (Erststimme) is for a local candidate whom
voters would like to see in parliament, the second vote (Zweitstimme) is for one of the
political parties running for election.4 In our analysis, we focus on the second votes since
they determine the number of seats parties receive in parliament, provided a party passes
the five percent election threshold.5
We are mainly interested in the vote shares of radical left-wing and radical right-wing parties
in the federal elections held between 1998 and 2017. We consider parties to be radical
in case the party or a subgroup of party members have been under surveillance of the
German Federal Office for the Protection of the Constitution (Bundesverfassungsschutz) or its
state-level equivalents (Landesverfassungsschutz).6 Parties or party members are put under
surveillance if they impose an imminent threat to the free democratic basic order. Table 1
4 The candidate who receives the majority of first votes in an election district is directly elected to the
parliament. The distribution of seats in the parliament is, however, solely determined by the share of second
votes a party receives.
5 Note that the five percent threshold is not binding if a party wins at least three election districts directly
by the first vote. In all federal elections in Germany since 1990, this occurred only once in 1994, when four
candidates of the leftist Party of Democratic Socialism (PDS) received the majorities of first votes in their
election districts. As result, the party got in total 30 seats in parliament, corresponding to its 4.4 percent vote
share of second votes.
6 We also define parties as radical if they cooperate in elections with other parties that are monitored by the
German Federal Office for the Protection of the Constitution or its state-level equivalents.
8provides a list of parties that we label radical right-wing and radical left-wing, respectively.
The marks indicate in which federal elections the parties ran.
Table 1: Radical Parties at Federal Elections in Germany, 1998–2017
Federal Elections in Germany
1998 2002 2005 2009 2013 2017
Radical Right-Wing Parties
ADM X
AfD X X
BfB* X
Büso X X X X X X
Die RECHTE* X X
DM X
DVU* X X
NPD* X X X X X X
Pro Deutschland* X
REP (Republikaner)* X X X X X
Volksabstimmung* X X X X X
50plus X
Radical Left-Wing Parties
Die LINKE (PDS) X X X X X X
DKP* X X
KPD* X
MLPD* X X X X X
SGP* X X X X X
Notes: *indicates parties also included in the narrow definition.
Abbr.: ADM (Allianz der Mitte), AfD (Alternative für Deutschland),
BfB (Bund freier Bürger), Büso (Bürgerrechtsbewegung Solidarität), DM
(Deutsche Mitte), DVU (Deutsche Volksunion), NPD (Nationaldemokratische
Partei Deutschlands), PDS (Partei des Demokratischen Sozialismus),
DKP (Deutsche Kommunistische Partei), KPD (Kommunistische Partei
Deutschlands), MLPD (Marxistisch-Leninistische Partei Deutschlands), SGP
(Sozialistische Gleichheitspartei).
Our list of radical left-wing parties includes five parties. The Left Party (Die Linke), which
was founded in 2007 when the Party of Democratic Socialism (PDS)7 and the Electoral
Alternative for Labour and Social Justice (WASG) merged, is the most popular leftist
party in Germany and regularly represented in the German federal parliament (Deutscher
Bundestag).8 Besides the Left Party (Die Linke), there are several small radical left-wing
7 The PDS was founded in 1990 and is the successor of the Socialist Unity Party of Germany (SED), the
communist party governing the German Democratic Republic (DDR) between 1949 and 1989.
8 In the first unified German federal elections in 1990, the Left Party received only 2.4 percent of the second
votes. However, the party was represented in the parliament with 17 seats because of a one-time exception
that was made for parties that won at least five percent of all votes in the former German Democratic
Republic.
9parties, but none of those has ever passed the five percent election threshold during
our sample period. Small radical parties on the far left are communist parties such
as the German Communist Party (DKP), the Communist Party of Germany (KPD), the
Marxist-Leninist Party of Germany (MLPD), and the Trotzkyist oriented Party for Socialist
Equality (SGP).
On the far right, twelve parties ran in German federal elections since 1998. The populist
party Alternative for Germany (Alternative für Deutschland, AfD) is the most successful
radical right-wing party in Germany since 1945. The AfD started to run for elections in
2013 and entered the European parliament one year later, i.e., in 2014. However, despite its
Euro-skepticism, the AfD was not a radical right-wing party in its early years, but rather
a conservative, market-liberal party (see Arzheimer, 2015; Schmitt-Beck, 2017). Since 2015,
however, the AfD became more and more radical after several leading moderate politicians
left the party. The nationalist and radical fraction took over power and clearly favored
anti-immigration policies, emphasized German nationalism, and provoked distrust in the
political order. This new radical right-wing party was successful in several state elections
held in 2015 and 2016. In 2017, the AfD entered the German federal parliament for the first
time. The AfD received a vote share of 12.6 percent and became the third largest party in
parliament.
Besides the AfD, there are eleven other radical right-wing parties, the most prominent ones
being the National Democratic Party of Germany (NPD), the German People’s Union (DVU;
merged with NPD in 2011), and the Republicans (REP). While none of these parties was ever
represented in the federal parliament, they do have regional strongholds and entered some
state parliaments in the past. Moreover, the NPD has won a seat in the European parliament
in 2014, after the three percent threshold was removed by the Federal Constitutional Court
of Germany. Besides AfD, NPD, DVU, and REP, there is a number of other radical right-wing
parties that ran for federal elections during our sample period, such as the nationalist Union
of Free Citizens (BfB), the Right Party (Die Rechte), Pro Germany (Pro Deutschland), the party
Popular Referendum (Volksabstimmung), and the Civil Rights Movements Solidarity (BüSo).9
To test the sensitivity of our results with regard to the definition of radical parties, we also
employ a narrow definition. In the narrow definition, we only label a party radical in case
the party as a whole is under surveillance of the Office for the Protection of the Constitution.
This reduces the number of radical right-wing parties from twelve to seven and the number
of radical left-wing parties from five to four. Note that the two largest radical parties, i.e.,
the Left Party (Die Linke) and the AfD, are excluded from the narrow definition.
9 Note that many scholars studying right-wing extremism in Germany only include the AfD, NPD, DVU, and
REP to their lists of radical right-wing parties, as they are the largest ones.
10As a further robustness test, we also estimate the impact of relative economic deprivation
on the vote shares of established parties. Our definition of established parties includes
the Social Democratic Party (SPD), the Green Party (Bündnis90/Die Grünen), the Christian
Democratic Party (CDU/CSU), and the Free Democratic Party (FDP). During our sample
period, each of these four parties was a coalition member of the federal government for at
least one legislative period.
3.4 Control Variables
In our empirical analysis, we include several control variables describing the demographic
and economic situation in a county. We control for the population share of different
age groups, population density, the unemployment rate, the share of recipients of
social transfers, the shares of graduates from different schooling tracks (no degree
(reference category), lower secondary degree (Hauptschule), intermediate secondary degree
(Realschule), higher secondary degree (Gymnasium)), and the share of foreigners. Population
density figures are provided by the Federal Institute for Research on Building, Urban
Affairs and Spatial Developments (Bundesinstitut für Bau , Stadt-, und Raumforschung, BBSR).
The share of foreigners is taken from the German Regional Database (Regionaldatenbank
Deutschland) as well as the statistical offices of the German states (Statistische Landesämter).
Information on school graduates comes from the Federal Statistical Office (Statistisches
Bundesamt). The remaining control variables are calculated based on individual responses
from the German Microcensus (see Section 3.1).
4 Descriptive Statistics
4.1 Regional Variation in Economic Deprivation
Figure 1 illustrates how the average realizations of the economic deprivation indicators
developed over the past 20 years. Between 1998 and 2017, the average degree of relative
economic deprivation at the county-level in Germany increased slightly. The share of
households with an income below the poverty line grew from 14.7 percent in 1998 to
16.7 percent in 2017. Similarly, the average shortfall from the poverty line (median income),
that is, the poverty gap (median gap), rose from 3.8 (15.3) percent to 4.1 (15.8) percent.
Figure 2 shows the realizations of the poverty rate in 1998, 2009, and 2017 at the county-level.
The figure reveals that the extent of economic deprivation varies considerably across
regions. Particularly pronounced are the differences between West and East German
11Figure 1: Economic Deprivation over Time
counties as well as between North and South. Interestingly, it appears that the differences
between West and East Germany became smaller over time, while the North/South divide
grew.
4.2 Support for Radical Parties
Figure 3 shows the average vote shares of radical right-wing and left-wing parties at the
federal elections held between 1998 and 2017. Until 2017, radical left-wing parties have
consistently been more successful at the polls than radical right-wing parties. This is
mainly due to the popularity of the socialist Left Party and its predecessor, the PDS, in East
Germany, where these parties have managed to always receive roughly one fifth of the votes.
Many pundits link the noticeable jump in the average vote share of radical left-wing parties
at the 2005 federal election to the so-called Hartz reforms, which led to a liberalization of
the German labor market and were implemented by the left-wing coalition government
consisting of the SPD and the Green Party. This resulted in many voters turning away from
the SPD and Green Party and turning to the Left Party.
In 2013, however, there has been a notable rise in the share of votes for radical right-wing
parties, which is entirely driven by the success of the newly founded right-wing populist
party AfD. The AfD was founded in April 2013 to oppose German federal policies
12Figure 2: Poverty Rate of German Counties between 1998 and 2017
13
Notes: This figure shows the poverty rate across counties for 1998, 2009, and 2017. The poverty rate is measured in percent.Figure 3: Average Vote Shares in German Counties
concerning the eurozone crisis and just missed the five percent election threshold in 2013.
In 2017, the AfD received 12.6 percent of the votes and became the third-largest party in the
federal parliament, having completed the turn from a Eurosceptical conservative party to a
radical right-wing party favoring anti-immigration policies.
Thus, whereas in 1998 the combined county vote shares of radical right- und left-wing
parties was on average 9.9 percent, it more than doubled to 22.9 percent in 2017. However,
these averages conceal substantial differences in voting outcomes between East and West
Germany. East German counties exhibit considerably larger vote shares for radical parties.
This is not only due to the success of the Left Party (Die Linke), but also the AfD enjoys greater
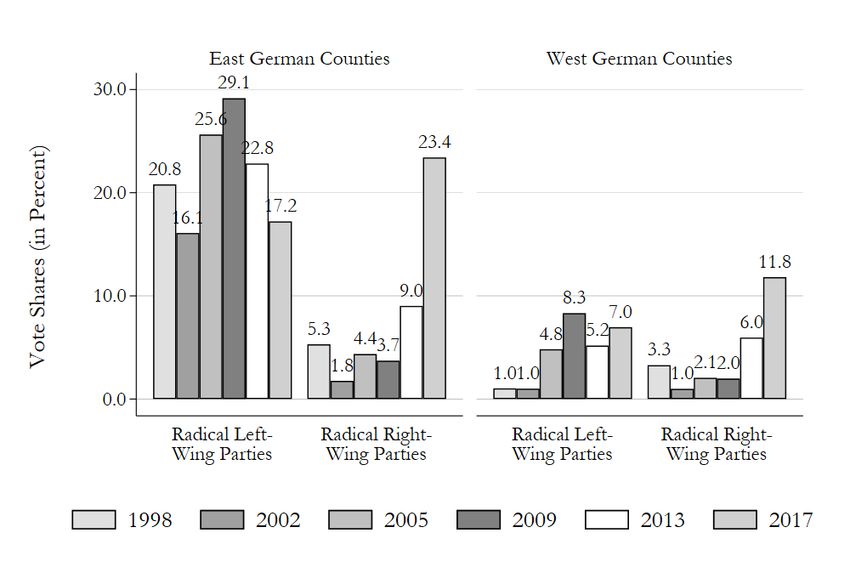
popularity in the East than in the West. In 2017, the average vote share of radical left-wing
(right-wing) parties was 17.2 (23.4) percent in East German counties and 7.0 (11.8) percent
in West German counties (see Figure A1 in the appendix).
5 Empirical Approach
To study the association between economic deprivation and support for radical parties, we
estimate the following empirical panel data model:
14Yit = αi + β Deprivationit + γ Xit + δt + ε it (3)
Index i refers to the county and index t to the year of the federal election. Our sample covers
six federal elections: 1998, 2002, 2005, 2009, 2013, and 2017. We use two dependent variables
in our empirical model (see Section 3.3): the vote share of radical right-wing parties and
the vote share of radical left-wing parties. Deprivationit is a measure of regional economic
deprivation. We consecutively employ three deprivation measures: (i) the poverty rate,
(ii) the poverty gap and (iii) the median gap (see Section 3.2). The vector Xit includes the
control variables described in Section 3.4 Finally, αi is a county-fixed effect that is included
to account for time-invariant regional-specific factors related to economic conditions and δt
is a year-fixed effect included to capture the effect of nation-wide events.
Identifying the causal effect of economic deprivation on voting behavior is challenging
since there are several confounding factors that are correlated with both election outcomes
and regional economic conditions. First, households may sort into regions depending
on their socio-demographic characteristics as well as political preferences. For example,
households may prefer to live among people who are similar to them with regard to
lifestyle and political views. Spatial segregation of households based on their economic
situation may also occur due to regional differences in labor market conditions, housing
prices, and costs of living. All those factors could also be related to election outcomes,
implying that omitting them from the regression would lead to biased estimates when using
OLS to identify the parameters of Equation (3). Unfortunately, the data we would need
to control for those factors are typically not available at the county-level, and neither are
suitable proxy variables. Furthermore, there are a number of regional characteristics that
are potentially correlated with both regional economic deprivation and voting behavior such
as, for example, factors related to labor supply in a county, household structure, geographic
features, etc. While some important variables can be controlled for, we cannot exclude the
possibility that there are other relevant variables we cannot observe.
To address concerns regarding biased OLS estimates due to the endogeneity of our
covariates, we construct instrument variables for our deprivation measures that are similar
to the instrument proposed by Boustan et al. (2013). The construction proceeds in four
steps. In step one, we compute the average household income for each income percentile
of the national income distribution and for all survey years (i.e., 1991-2017). In the second
step, we compute percentile-specific annual national income growth rates for each survey
year. In step three, we focus on household incomes in a base year, determine to which
percentile of the national income distribution each household in that base year belongs,
and multiply each household’s income with the percentile-specific annual national income
growth rates. That way, we obtain a time-series of hypothetical incomes for each household
15that we observe in the base year. In the final step, we use these hypothetical incomes to
compute counterfactual economic deprivation measures which we then use as instruments
for the actual realizations of the regional deprivation measures.
The counterfactual deprivation measures indicate how regional economic deprivation
would have developed in the absence of inward and outward migration and if
each household’s income would have changed over time in accordance with the
percentile-specific national average. Consequently, our instruments only capture changes in
the regional income distribution that are driven by national trends and cannot, by design, be
influenced by county-specific trends such as mobility into and out of regions or asymmetric
economic and political developments (Boustan et al., 2013). The cross-sectional variation in
our instruments stems entirely from the variation in the base year’s income distribution,
whereas the time-variation comes from the percentile-specific income growth rate at the
national level.
The results of our first-stage IV regressions demonstrate that the instruments are highly
relevant. The coefficients of all instrumental variables are highly significant with coefficient
estimates that are close to unity.10 The relevance of our instruments is further indicated by
the Cragg-Donald F statistics for exclusion restriction tests, which are far larger than the
critical values proposed by Stock and Yogo (2005) (cf. Section 6.2).
An additional challenge specific to the use of county-level data in Germany is that the
number of counties in East Germany has changed considerably after German unification due
to various administrative-territorial reforms. For example, from 1990 to 1996, the number of
counties in East Germany (excluding East-Berlin) decreased from 215 to 111. For this reason,
we are forced to use 1997 as our base year for the construction of our instruments for East
German counties. For West Germany, our base year for the constructions of the instrumental
variables is 1991.
6 Results
6.1 Baseline Specification
We start with the results of OLS estimation, which are presented in Table 2. The left panel
shows the results for radical left-wing parties, the right panel for radical right-wing parties.
The estimates reveal a statistically significant relationship between the level of economic
deprivation in a county and the vote share of radical left-wing parties. The estimated effects
10 Results available on request.
16Table 2: Support for Radical Parties - OLS Estimates
Radical Left-Wing Parties Radical Right-Wing Parties
(1) (2) (3) (4) (5) (6)
Poverty Rate 0.062∗∗∗ 0.013
[0.007] [0.455]
Poverty Gap 0.152∗∗ -0.008
[0.016] [0.849]
Median Gap 0.123∗∗∗ -0.022
[0.001] [0.428]
Unemployment 0.317∗∗∗ 0.325∗∗∗ 0.303∗∗∗ -0.429∗∗∗ -0.423∗∗∗ -0.417∗∗∗
[0.000] [0.000] [0.000] [0.000] [0.000] [0.000]
Transfer Recipients -0.002 0.007 -0.005 0.003 0.009 0.014
[0.975] [0.876] [0.909] [0.935] [0.781] [0.678]
Population Density 7.242∗∗∗ 7.118∗∗∗ 7.180∗∗∗ -7.336∗∗∗ -7.435∗∗∗ -7.482∗∗∗
[0.000] [0.000] [0.000] [0.000] [0.000] [0.000]
Age 15 - 24 0.237∗∗∗ 0.232∗∗∗ 0.236∗∗∗ -0.420∗∗∗ -0.417∗∗∗ -0.416∗∗∗
[0.000] [0.000] [0.000] [0.000] [0.000] [0.000]
Age 25 - 34 0.202∗∗∗ 0.197∗∗∗ 0.206∗∗∗ -0.271∗∗∗ -0.268∗∗∗ -0.268∗∗∗
[0.000] [0.000] [0.000] [0.000] [0.000] [0.000]
Age 35 - 44 0.178∗∗∗ 0.169∗∗∗ 0.183∗∗∗ -0.257∗∗∗ -0.259∗∗∗ -0.262∗∗∗
[0.006] [0.008] [0.005] [0.000] [0.000] [0.000]
Age 45 - 54 0.167∗∗∗ 0.160∗∗∗ 0.179∗∗∗ -0.228∗∗∗ -0.230∗∗∗ -0.234∗∗∗
[0.001] [0.001] [0.001] [0.000] [0.000] [0.000]
Age 55 - 64 0.077∗ 0.069∗ 0.085∗∗ -0.161∗∗∗ -0.164∗∗∗ -0.168∗∗∗
[0.068] [0.096] [0.047] [0.000] [0.000] [0.000]
Age 65+ 0.110∗∗∗ 0.107∗∗∗ 0.111∗∗∗ -0.207∗∗∗ -0.207∗∗∗ -0.207∗∗∗
[0.007] [0.009] [0.007] [0.000] [0.000] [0.000]
Schooling Lowest Track 0.049 0.053 0.051 0.104∗∗∗ 0.105∗∗∗ 0.105∗∗∗
[0.206] [0.172] [0.188] [0.000] [0.000] [0.000]
Schooling Interm. Track -0.005 -0.004 -0.002 0.066∗∗ 0.065∗∗ 0.065∗∗
[0.892] [0.912] [0.946] [0.016] [0.017] [0.018]
Schooling Highest Track 0.151∗∗∗ 0.151∗∗∗ 0.152∗∗∗ 0.033 0.033 0.033
[0.000] [0.000] [0.000] [0.266] [0.261] [0.261]
Foreigners 0.185∗∗∗ 0.184∗∗ 0.185∗∗∗ 0.028 0.030 0.031
[0.010] [0.010] [0.009] [0.739] [0.720] [0.711]
Year FE Yes Yes Yes Yes Yes Yes
County FE Yes Yes Yes Yes Yes Yes
Mean Dep. Variable 8.51 8.51 8.51 4.95 4.95 4.95
R2 0.958 0.958 0.958 0.911 0.911 0.911
N 2510 2510 2510 2510 2510 2510
Notes: p-values in brackets; * p < 0.1, ** p < 0.05, *** p < 0.01; standard errors are clustered at the
county-level. Broad definition of radical parties.
17are of modest size, though. The coefficient estimates suggest that a one pp increase in the
poverty rate is associated with an increase in the share of votes for radical left-wing parties
of 0.06 pp. In relation to the sample mean, this is equivalent to an increase in the vote share
of 0.7 percent. For the poverty gap (median gap), the estimated effect of a one pp increase is
0.15 (0.12) pp, implying a 1.8 (1.5) percent increase in votes compared to the sample mean. In
contrast, for radical right-wing parties, we do not detect any significant association between
the share of votes these parties receive and our deprivation measures.
A glance at the coefficient estimates of the control variables reveals some interesting
findings. An increase in the unemployment rate as well as population density is associated
with an increase in the vote share of radical left-wing parties, but a decrease in the vote share
of radical right-wing parties. The latter result suggests that right-wing parties are more
popular in rural areas, which is well in line with anecdotal evidence. Older people appear
to be less likely to vote for radical left-wing and radical right-wing parties, as suggested by
the decrease in the magnitudes of the corresponding coefficient estimates. People with a
low level of education show stronger support for radical right-wing parties, whereas highly
educated people appear to be more likely to support radical left-wing parties. Interestingly,
the share of foreigners is significantly positively related to the vote share of radical left-wing
parties, but not significantly related to the share of votes for radical right-wing parties.
The OLS estimates should be interpreted with caution, though, as we cannot rule out that
they are affected by confounding factors. Table 3 reports the results of the IV estimation
where we instrument the actual realizations of our deprivation measures by measures that
are computed based on counterfactual incomes. Again, the left panel shows the results for
the share of votes for left-wing parties, the right panel for right-wing parties.
Comparing the IV estimates to the OLS estimates suggests that the OLS estimates are indeed
severely biased. With regard to the vote share of radical left-wing parties, the results we
obtain based on IV estimation are very different to the OLS results. We detect a significantly
negative effect of the poverty rate on the vote share of radical left-wing parties. The effect
is not huge, but not negligible either. I.e., a rise in the share of households with an income
below the poverty line decreases the vote share of radical left-wing parties by 0.26 pp or
about three percent of the sample mean, respectively. However, the coefficient estimates of
the other two deprivation measures, that is, the poverty gap and the median gap, are not
statistically different from zero at reasonable levels of significance. Note that it is unlikely
that the insignificance of these deprivation measures is due to inefficient estimation, as the
Cragg-Donald F statistics are far above the critical values of the weak instrument test by
Stock and Yogo (2005).11
11 The critical values for the Stock-Yogo weak IV F-test are 16.38 (10 percent maximal IV size), 8.96 (15 percent),
6.66 (20 percent), and 5.53 (25 percent).
18Table 3: Support for Radical Parties - IV Estimates
Radical Left-Wing Parties Radical Right-Wing Parties
(1) (2) (3) (4) (5) (6)
Poverty Rate -0.261∗∗ 0.496∗∗∗
[0.039] [0.000]
Poverty Gap 0.213 1.243∗∗∗
[0.329] [0.000]
Median Gap 0.050 0.683∗∗∗
[0.775] [0.003]
Economic Controls Yes Yes Yes Yes Yes Yes
Demogr. Controls Yes Yes Yes Yes Yes Yes
Foreigners Yes Yes Yes Yes Yes Yes
Education Yes Yes Yes Yes Yes Yes
Year FE Yes Yes Yes Yes Yes Yes
County FE Yes Yes Yes Yes Yes Yes
Mean Dep. Variable 8.51 8.51 8.51 4.95 4.95 4.95
N 2510 2510 2510 2510 2510 2510
Cragg-Donald 56.37 98.48 44.98 56.37 98.48 44.48
Kleibergen-Paap 42.25 54.33 5.64 42.25 54.33 5.64
Notes: p-values in brackets; * p < 0.1, ** p < 0.05, *** p < 0.01; standard errors are clustered at
the county-level. Broad definition of radical parties.
In contrast, the IV estimates indicate that economic deprivation has a positive impact on
the vote share of radical right-wing parties. The estimated effects are statistically significant
even at the one percent level of significance and of relevant magnitude. According to the
estimates, a one pp increase in the poverty rate leads to a rise in the vote share of radical
right-wing parties by 0.5 pp. In relation to the sample mean, this implies an increase in the
vote share by ten percent. The effects of an increase in the poverty gap and median gap are
even larger. Here, a one pp increase leads to 1.24 and 0.68 pp higher vote shares, implying
a 25 percent and 14 percent increase in votes, respectively. The fact that a change in the
average shortfall from the poverty line has a larger effect on the share of radical right-wing
votes than a change in the average shortfall from the median income suggests that people
are more prone to support radical right-wing parties the more deprived they are.
6.2 Extensions and Robustness Checks
To test the robustness of our results, we modify our empirical specification in several ways.
In a first robustness test, we apply a narrow definition of radical parties that includes
only those parties that are entirely under the Office for the Protection of the Constitution’s
surveillance (cf. Section 3.3). With regard to radical left-wing parties, the only party included
19in the broad definition, but excluded from the narrow definition, is the Left Party. Of the
radical right-wing parties, five out of twelve do not meet the narrow definition, among them
the AfD. The results of the IV approach are presented in Table A1 in the appendix.
For left-wing radical parties, we detect a positive effect of all three economic deprivation
measures that is significant at every reasonable level of significance. It thus appears that
in the baseline specification, the significant negative coefficient estimate for the poverty
rate and the insignificant estimates for the poverty gap and median gap are entirely
driven by the Left Party. The coefficient estimates indicate that a one pp increase in the
poverty rate/poverty gap/median gap increases the share of radical left-wing votes by
0.03/0.12/0.06 pp, which implies an increase in the vote share by 50/200/100 percent.
However, in light of the small vote share radical left-wing parties other than the Left Party
received in federal elections, the effects are still far too small to have a meaningful impact. In
contrast, the results we obtain for radical right-wing parties remain qualitatively unchanged
when changing the definition of radical parties. The fact that the coefficient estimates
become notably smaller compared to the baseline results is most likely due to the exclusion
of five out of twelve parties when moving from the broad to the narrow definition, among
them the AfD, the most popular right-wing party in recent years.
Second, we investigate how changes in economic deprivation affect the share of votes of
established parties. The results are presented in Table A2 in the appendix. We detect a
significantly negative effect of the poverty gap on the share of votes for established parties.
The coefficient estimate of the median gap is negative as well, but just above the ten percent
level of significance. It thus appears that the gain in votes for radical parties in response to
an increase in economic deprivation comes to the expense of established parties.12
Third, we examine whether the effect of economic deprivation differs across West and East
Germany. In Section 4, we highlighted that economic deprivation is much more prevalent
in East Germany, although the West-East divide appears to have decreased over the past
decades. At the same time, radical parties at both ends of the political spectrum enjoy greater
popularity in East Germany than in West Germany. It is thus interesting to check whether
the effect economic deprivation has on the vote share of radical parties varies across the two
regions. To this end, we estimate separate coefficients for our deprivation measures across
West and East German counties by including two dummy variables, i.e., one dummy that is
equal to one for West German counties and one dummy that is equal to one for East German
counties, and interacting these dummies with the deprivation measures. The results of the
IV estimation are presented in Table 4.
12 Further analyses suggest that the reduction in the combined vote share of established parties is primarily
due to a reduction in the votes for the Social Democratic Party (SPD) and the Green Party, which both lean
to the left. The results are available on request.
20Table 4: Support for Radical Parties in West and East Germany - IV Estimates
Radical Left-Wing Parties Radical Right-Wing Parties
(1) (2) (3) (4) (5) (6)
East × Poverty Rate -0.556∗ 0.708∗∗∗
[0.055] [0.000]
West × Poverty Rate 1.269 -0.605
[0.598] [0.688]
East × Poverty Gap -0.113 1.084∗∗∗
[0.660] [0.000]
West × Poverty Gap 0.920 1.590∗∗
[0.225] [0.040]
East × Median Gap -2.373 0.912∗
[0.123] [0.060]
West × Median Gap 3.689 0.339
[0.278] [0.791]
Economic Controls Yes Yes Yes Yes Yes Yes
Demogr. Controls Yes Yes Yes Yes Yes Yes
Foreigners Yes Yes Yes Yes Yes Yes
Education Yes Yes Yes Yes Yes Yes
Year FE Yes Yes Yes Yes Yes Yes
County FE Yes Yes Yes Yes Yes Yes
Mean Dep. Variable 8.51 8.51 8.51 4.95 4.95 4.95
N 2510 2510 2510 2510 2510 2510
Cragg-Donald 0.36 5.15 0.93 0.36 5.15 0.93
Kleibergen-Paap 0.20 3.21 0.49 0.20 3.21 0.49
Notes: p-values in brackets; * p < 0.1, ** p < 0.05, *** p < 0.01; standard errors are clustered at
the county-level. Broad definition of radical parties.
According to our estimates, an increase in the poverty gap has a somewhat stronger effect on
the support for radical right-wing parties in West Germany than in East Germany. In West
German counties, a one pp increase in the poverty gap leads to a 1.6 pp increase in the vote
share for radical right-wing parties, compared to 1.1 pp in East German counties. However,
for the poverty rate and the median gap, we only find significant coefficient estimates for
East Germany.
Finally, we investigate whether the effect of deprivation on the support for radical parties
varies across urban and rural areas. It is often argued that people living in rural areas are
more prone to support radical parties, especially nationalistic ones. As before, we estimate
separate coefficients by interacting the deprivation measures with two dummy variables,
taking the value of one for urban or rural counties, respectively.13 Our results do not support
13 The classification of urban counties and rural counties is taken from the Federal Institute for Research on
Building, Urban Affairs and Spatial Developments. Basis for the classification is the population density.
21You can also read