Estimating the Regional Economic Importance of Auckland Airport - Auckland International Airport Limited
←
→
Page content transcription
If your browser does not render page correctly, please read the page content below
Final Report: 27 February 2014

Estimating the Regional Economic
Importance of Auckland Airport
PREPARED FOR

Auckland International Airport Limited
INSIGHT ECONOMICS          CLEAR AND CONCISE SOLUTIONS BASED ON RIGOROUS RESEARCH AND ANALYSIS
Authorship
This document was written by Fraser Colegrave, Stephen Hoskins and Kim Mundy. For
further information, please contact Fraser at the details below:

DDI: (09) 366 6416

Mobile: (021) 346 553

Email: fraser@insighteconomics.co.nz

Web: www.insighteconomics.co.nz

© Insight Economics Ltd, 2014. All rights reserved.

Disclaimer
Although every effort has been made to ensure the accuracy of the material and the integrity
of the analysis presented herein, Insight Economics Ltd accepts no liability for any actions
taken on the basis of its contents
Contents
1      Executive Summary ....................................................................................................... 1

2      Introduction .................................................................................................................... 6
    2.1     Context and Purpose of this Report ........................................................................6
    2.2     About Auckland Airport .............................................................................................6
    2.3     Components of the Analysis .....................................................................................6
    2.4     Structure of this Report ...............................................................................................7

3      Methodology .................................................................................................................. 8
    3.1    Introduction to Multiplier Analysis .............................................................................8
    3.2    Advantages and Limitations of Multiplier Analysis ................................................8
    3.3    Bottom-Up vs Top-Down Multiplier Analysis ............................................................9
    3.4    Input Output Table Used in the Analysis .................................................................9
    3.5    Regional vs National Impacts ...................................................................................9

4      Impacts of the Airport Company (AIAL) ................................................................... 10
    4.1   Steps in the Analysis ................................................................................................. 10
    4.2   Definition of Airport Company............................................................................... 10
    4.3   Direct Impacts........................................................................................................... 11
    4.4   Indirect Impacts........................................................................................................ 12
    4.5   Induced Impacts ...................................................................................................... 14
    4.6   Overall Economic Impacts ..................................................................................... 14
    4.7   Projected Future Impacts ....................................................................................... 15

5      Impacts of the Wider Airport Complex ...................................................................... 18
    5.1   Steps in the Analysis ................................................................................................. 18
    5.2   Geographic Extent of the Wider Airport Complex ............................................ 18
    5.3   Employment Within the Airport Complex ............................................................ 19
    5.4   Airport-Related Shares ............................................................................................ 21
    5.5   Conversion from Employment to Turnover .......................................................... 22
    5.6   Industry Mapping and Multiplier Overlay ............................................................ 23
    5.7   Gross Impacts............................................................................................................ 23
    5.8   Accounting for Cross-Linkages .............................................................................. 24
    5.9   Net Impacts ............................................................................................................... 26
    5.10 Summary .................................................................................................................... 26

6      Airport’s Role in International Tourism ....................................................................... 28
    6.1    Overview of International Tourism Market ........................................................... 28
    6.2    Overall Value of International Tourism to New Zealand ................................... 29
    6.3    Airport’s Role in Facilitating International Tourism .............................................. 30

7      Airport’s Role in Facilitating Trade .............................................................................. 33
    7.1    Role of New Zealand’s Air Trade Market ............................................................. 33
    7.2    Auckland Airport’s Market Share .......................................................................... 33
    7.3    Types of Goods Freighted Via Auckland Airport................................................ 33
    7.4    Summary .................................................................................................................... 34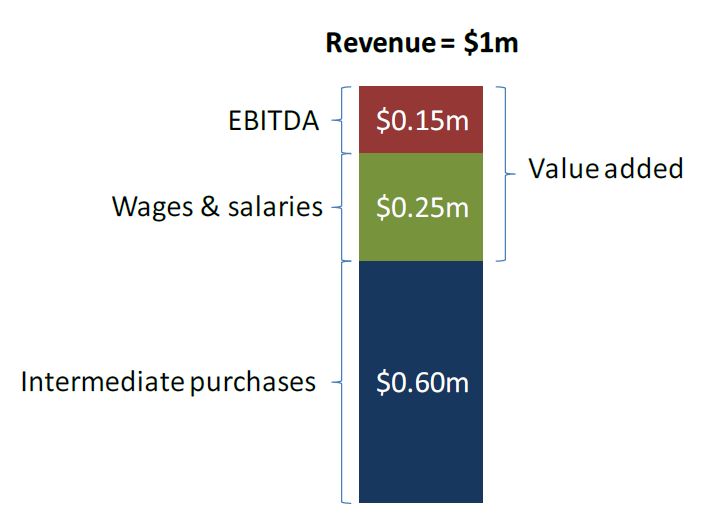
8      Wider Strategic/Economic Benefits ........................................................................... 35
    8.1    Fostering and Maintaining Business Relationships .............................................. 35
    8.2    Wider Benefits of Increased Connectivity ........................................................... 36
    8.3    The Airport as a Major Growth Node ................................................................... 37
    8.4    Direct Customer Benefits ........................................................................................ 37
    8.5    Economic Impacts of Future Capital Expenditures ........................................... 39
    8.6    Contribution to Taxes and Council Rates ............................................................ 39
    8.7    Convenience and Social Inclusion ....................................................................... 39

Appendix 1: Detailed Cross Linkage Analysis .................................................................. 40
  A1:1 Nature of the Problem ............................................................................................. 40
  A1:2 AIAL Company Expenditures ................................................................................. 41
  A1:3 AIAL Company Wages ............................................................................................ 41
  A1:4 AIAL Company Expenditures ................................................................................. 41
  A1:5 Inter-Catchment Double-Counts .......................................................................... 42
  A1:6 Intra-Catchment Double-Counts .......................................................................... 42
  A1:7 Overall Extent of Double Counts Removed ........................................................... 43

Appendix 2: Detailed Airport Activity Shares ................................................................... 44

Appendix 3: Airport Share Sensitivity Testing .................................................................... 45
1        Executive Summary
Context and Scope of Report
Auckland Airport is New Zealand’s largest airport and our main gateway to the world.
In 2013, 155,000 flights carried more than 14 million passengers and moved more than
$13 billion of freight. To assist the airport’s submission on the Auckland Unitary Plan,
this report assesses its regional economic importance by considering:

    1.   The economic impacts of the airport company as a business in its own right,
    2.   The economic impacts of the wider airport area,
    3.   The airport’s role in facilitating tourism and trade, and
    4.   A range of other benefits provided to local businesses and consumers

Methodology
The majority of the report is based on a particular type of analysis called multiplier
analysis, which estimates both direct economic effects, and also flow-on effects. The
latter arise from the interrelated nature of business supply chains, in which the outputs
of one firm become inputs to another, and vice versa. These business interactions are
traced throughout the regional economy to determine the overall economic impact of
the airport and its associated activities. Effects are measured in terms of regional GDP,
incomes and employment.

The remainder of the analysis is more exploratory in nature, and focuses on the wider
macroeconomic contributions made by the airport, particularly with respect to
international tourism and trade. In addition, it briefly lists a range of other important
benefits provided by the airport.

Economic Model
In order to accurately estimate the economic impacts of the airport company and wider
airport complex, a detailed economic model was developed. This was particularly
important, because a number of inter-linkages exist between the companies that
comprise the airport, and failing to account for these would have caused the impact
estimates to be systematically overstated. Each potential source of double-counting was
therefore carefully identified and managed to ensure that the resulting estimates of
economic impact were robust and reliable.

Economic Impact of the Airport Company as a Business Entity
As noted above, the first part of the analysis related to the economic impact of the
airport company as a business in its own right. This refers to the entity otherwise known
as Auckland International Airport Limited (AIAL), which owns and controls the
majority of airport assets, but which accounts for only a fraction of airport activity and
hence total airport impacts.

The following table shows the overall economic impact of AIAL in 2013 ignoring wider
airport activity. In summary, the airport company directly contributed $322 million in
regional value added (GDP), 330 fulltime equivalent jobs and $36 million in household
incomes. Including flow-on effects, its contribution was $415 million in regional GDP,
1,730 fulltime equivalent jobs and $92 million in household incomes.

 Regional Economic Importance of Auckland Airport                                           1
Table 1: Estimated Economic Impacts of AIAL in 2013
Impact Measures Direct Flow-On Total
Value-Added ($m) $322 $93 $415
Employment (FTEs) 330 1,400 1,730
Household Incomes ($m) $36 $56 $92
To consider AIAL’s potential future impacts, we quantified the relationship between
historic impacts and historic passenger numbers, and overlaid future passenger
projections to derive high-level estimates. According to our analysis, by 2044, the airport
company alone could contribute more than $1.1 billion to Auckland’s GDP including
flow-on effects.
Economic Impact of the Wider Airport Complex
Next, we estimated the regional economic impacts of the wider airport complex, which
comprises both the general airport precinct plus a range of nearby industrial activities.
The analysis involved a number of detailed steps, all of which are explained at length.
The following table shows the resulting impact estimates for 2013 (excluding the
economic impacts of AIAL itself).
Table 2: Estimated Impacts of the Wider Airport in 2013 (excl. AIAL)
Impact Measures Direct Flow-On Total
Value-Added ($m) $1,430 $1,670 $3,100
Employment (FTEs) 12,200 19,200 31,400
Household Incomes ($m) $920 $880 $1,800
To summarise: including flow on effects, the wider airport complex is estimated to
contribute $3.1 billion to regional GDP, 31,400 jobs and $1.8 billion in household
incomes.
Combined with the estimated airport company impacts above, these suggest that the
overall operation of Auckland airport and associated activity contributed the following
to Auckland’s economy in 2013:
$3.5 billion in value added (GDP)
33,100 jobs, and
$1.9 billion in household incomes.
Airport’s Role in Facilitating International Tourism
In addition to the significant economic activity that occurs in and around it, the airport
also plays a number of other important roles in the regional and national economies. Of
these, one of the most significant is its role in international tourism.
As a distant island nation, international tourism is very important. For instance, in 2013:
2.7 million international visitors travelled here, up from 1.7 million in 2000,
Tourism contributed almost 9% to national GDP,
Regional Economic Importance of Auckland Airport 2 172,100 people were employed directly or indirectly in tourism-related sectors,
accounting for 8.8% of national employment, and
72% of all international visitors arrived at Auckland Airport.
While Auckland airport clearly already plays a significant role in our tourism industry,
it will become even more important because it is the main arrival port for tourists from
China – our fastest-growing and highest-yielding international market. Indeed, 92% of
all visitors from China landed at Auckland Airport last year, and the number of these
visitors has more than doubled since 2009. Further, according to official tourism
forecasts, Chinese visitors will spend over $1.2 billion in New Zealand by 2019, or about
$2,700 per person. This is more than double the forecast average spend of visitors from
our biggest market, Australia.
Clearly, Auckland airport is a critical component of our tourism supply chain, and will
become even more important in future.
Airport’s Role in Facilitating Trade
While sea freight accounts for the bulk of trade volumes due to its lower cost structure,
air-freight still plays a key role in the export of just-in-time and perishable goods that
achieve a much higher return than their sea-freight counterparts. In addition, air freight
is critical to the movement of goods that are low in weight but high in value. This is why
air-freighted goods were worth around 50 times more per kilogram than sea-freighted
goods last year.
Just as Auckland Airport has a dominant share of international tourist arrivals, so too
does it have a dominant share of international air freight. For instance, in 2013,
Auckland Airport moved 92% of airborne imports and 81% of airborne exports by
weight. By value, it carried 94% of air imports and 72% of air exports.
Imports and exports via Auckland Airport are both dominated by industrial parts and
machinery. These accounted for 23% of all exports and 25% of all imports, with over $10
billion of these products moved via Auckland Airport between 2010 and 2012.
Other key imports and exports include medical/optical/photographic parts and
machinery, audio/video parts and machinery, pharmaceuticals, gems and precious
stones. All are examples of high-value, low-weight, time-critical commodities.
Overall, imports via Auckland Airport outweigh exports. Specifically, for every dollar of
goods exported, $1.92 of goods are imported. However, there are some particular goods
where exports via Auckland Airport outweigh imports. These include food and plant
products, particularly fish, crustaceans, live animals, flowers and dairy products.
Other Strategic/Economic Benefits
Finally, we identified and summarised a range of other strategic/economic benefits
provided by Auckland Airport. These include:
Regional Economic Importance of Auckland Airport 3 Fostering and Maintaining Business Relationships – while new technologies such
as videoconferencing can be useful, many companies still consider face-to-face
contact important for winning business. As one might expect, Auckland airport
accounts for a significant share of business related international (and domestic)
travel. In fact, in 2013 Auckland Airport accounted for 76% of international business
arrivals, and 82% of international business departures.
Other Benefits of Increased Connectivity - In addition to fostering business
relationships and enabling tourism and trade, increased connectivity provides a
range of other benefits by raising business productivity. These productivity
impacts manifest through two main channels: (i) through the effects on domestic
firms of increased access to foreign markets and increased foreign competition in
the home market; and (ii) through the freer movement of investment capital and
workers between countries. In addition, improved connectivity can make it easier
for firms to invest overseas, thereby further boosting economic performance.
The Airport as a Major Growth Node – Since 1999, the Mangere South census
area unit (which encapsulates the Airport) experienced the highest non-
residential floorspace growth of all census area units in New Zealand (and was
48 times the national average). This rampant growth is expected to continue
with the airport having up to 400 hectares of land available for commercial
development, and with it adopting a place-based strategy to capitalise on this
major opportunity. As a result, the airport is likely to be a significant node of
future economic growth and development.
Direct Customer Benefits – One of the key benefits provided by the aviation
sector are those accruing to its customers. In economics, these customer
benefits are measured by the associated consumer surplus. Put simply, this
equals the difference between what a consumer would have been willing to
pay for a good or service, and what they actually pay. According to a recent
study by Oxford Economics, the consumer surplus for aviation is about a third
of the airfare. Since New Zealanders (including businesses and Government)
spent around $3 billion on airfares last year, total consumer benefits may be
around $1 billion per annum.
Economic Impacts of Future Capital Expenditures - According to the airport’s
latest investor presentation, it intends to spend around $2.4 billion on core
infrastructure over the next 30 years. Using multiplier analysis, we estimated
that this could boost regional: GDP by $2 billion, employment by 27,800 full
time jobs, and household incomes by $1.4 billion. It is also worth noting that
these capital expenditures are unlikely to feature much (if any) public funding.
Thus, not only will future capital works provide significant economic benefits,
but they will also not create any significant fiscal strain on the Government.
Contribution to Taxes and Council Rates - The airport company is a major
contributor to both local and central Government finances via its rates and tax
payments. For example, during the financial year ended 30 June 2013, the
Regional Economic Importance of Auckland Airport 4airport paid over $58 million in corporate income tax and a further $5 million
or so in Council rates.
Convenience and Social Inclusion - Large international airports like Auckland
Airport provide direct convenience benefits by reducing the length of surface
commutes required to access air services. In doing so, they improve
connectivity and improve quality of life. Without air services, remote areas
(such as NZ) would be denied easy and continued participation in the modern
world, and hence reduce social inclusion.
Summary and Conclusion
This report has estimated the regional economic impacts of Auckland airport and found
that it generates and supports a diverse range of economic activity. In doing so, it makes
a significant contribution to regional GDP, provides employment for thousands of
people and generates many millions of dollars in regional income. In addition, the
airport plays a critical role in facilitating international tourism and trade and also
provides a range of strategic benefits, particularly by strengthening connectivity and
enabling international engagement. This is why Auckland airport is arguably New
Zealand’s most important strategic infrastructure asset.
Regional Economic Importance of Auckland Airport 52 Introduction
2.1 Context and Purpose of this Report
Auckland Council has released its proposed Unitary Plan, and Auckland International
Airport is lodging a submission. This report seeks to inform the airport’s submission by
assessing its economic importance to the Auckland region.
2.2 About Auckland Airport
Auckland Airport is New Zealand’s largest airport, and the second largest in
Australasia by international passenger numbers. It operates non-stop 365 days a year,
and in 2013 there were:
155,000 annual aircraft movements,
14 million annual passengers,
$13 billion in annual freight movements, and
65,000 daily vehicle visits
2.3 Components of the Analysis
This report estimates the economic importance of Auckland airport in several steps. It
starts with a fairly narrow focus on the airport company itself, then gradually expands
to include a range of broader impacts. This approach is reflected in the figure below.
Figure 1: Components of the Analysis
Step 4:
Broader
Impacts
Step 3:
Tourism and
Trade
Step 2:
Wider Airport
Complex
Step 1:
Airport
Company
(AIAL)
Regional Economic Importance of Auckland Airport 6Specifically, this report considers the economic importance of the airport based on:
1. The economic impacts of the airport company as a business in its own right,
2. The economic impacts of the wider airport complex
3. The airport’s role in facilitating tourism and trade, and
4. A range of other benefits provided to local businesses and consumers
At each step (or in each successive layer of effects in Figure 1), the benefits increase
substantially in value and reach, but also become increasingly harder to measure with
any degree of confidence.
2.4 Structure of this Report
The remainder of this report is structured as follows:
Section three describes our overall approach to the analysis.
Section four estimates the economic impacts of the airport company as a
business entity in its own right.
Section five estimates the economic impacts of the wider airport complex,
including associated industrial activity.
Section six discusses the value of international tourism to New Zealand and
describes the airport’s role in facilitating it.
Section seven briefly describes the value of airfreight and the airport’s role in
transporting it, and
Section eight summarises a range of other benefits provided by the airport.
Regional Economic Importance of Auckland Airport 73 Methodology
This section briefly describes ley aspects of our methodology.
3.1 Introduction to Multiplier Analysis
The economic impacts of the airport company and wider airport complex have been
estimated using a specific type of analysis called multiplier analysis. This incorporates a
highly-detailed matrix – called an input-output table – which shows the particular set of
inputs that each sector requires to produce its own outputs. As a result, it reveals how
the various sectors of an economy are interrelated.
Consider the following example. Suppose a local construction company wins a large
building contract. In addition to labour requirements, the company will need to source a
range of building products from its suppliers to complete the job. These suppliers, in
turn, will need to source various inputs from their own suppliers, and so on. The input-
output table traces all these interdependencies so that the wider economic impact of the
new building work can be estimated.
Specifically, the economic impacts estimated by multiplier analysis comprise three parts,
(the second and third of which are often grouped together as ‘flow-on effects’).
1. Direct Effects – these are the direct effects of the entity (or entities) in question.
2. Indirect effects – these are the overall economic impacts of the wider supply
chain that supports the entity in question. It captures the full range of inter-
industry impacts arising from the direct effect.
3. Induced effects – the direct and indirect effects will result in increased
employment, and hence increased household income. A proportion of this new
income will be spent in the regional economy, and give rise to further economic
stimulus. This is known as the induced effect.
The overall economic impact is the sum of the direct, indirect and induced effects. These
effects are measured in terms of:
Value added (GDP),
Employment, and
Household incomes
3.2 Advantages and Limitations of Multiplier Analysis
Like all types of analysis, multiplier analysis has its advantages and limitations. The key
advantages are that it:
is able to estimate the economic impacts of a wide range of activities,
can estimate both direct effects and flow-on effects,
is relatively simple and transparent, and
relatively easy to explain.
Regional Economic Importance of Auckland Airport 8However, multiplier analysis makes a number of limiting assumptions, including:
that production functions exhibit constant returns to scale, so that a doubling of
all inputs leads to a doubling of all outputs
there are no supply constraints,
there is no short-term substitution between capital and labour, and
relative prices are fixed.
While these assumptions may not always hold true, multiplier analysis is widely used
for this sort of analysis, and we consider it the best method for the job at hand.
Accordingly, we use it here to estimate economic impacts.
3.3 Bottom-Up vs Top-Down Multiplier Analysis
There are a number of different ways to implement a multiplier analysis. The most
complex is a bottom-up multiplier analysis, in which an organisation’s structure and
operation is examined at length to determine its overall economic footprint and hence
resulting economic impacts. This was the approach used to estimate the impacts of the
airport company as a business entity in its own right.
At the other end of the spectrum are top-down multiplier analyses. These take a much
more pragmatic approach, and convert the output of a firm to estimates of economic
impacts using pre-defined multipliers. These multipliers are sourced by ‘solving’ the
input-output table so that all the inter-industry linkages are boiled down to a smaller set
of numbers (i.e. the multipliers). This was the approach used to analyse the economic
impacts of the wider airport complex. i.e. the numerous airport-related businesses in
and around the airport.
3.4 Input Output Table Used in the Analysis
The specific input output table used in the analysis was supplied by Butcher Partners,
and reflects the Auckland regional economy as at 2007. This table is the latest available
and has been widely used for analyses of this sort over the last few years.
3.5 Regional vs National Impacts
Throughout this report, we report impacts only for the Auckland region. In all cases, the
corresponding national impacts are at least as great as, if not greater than, the Auckland
regional impacts.
Regional Economic Importance of Auckland Airport 94 Impacts of the Airport Company (AIAL)
This section estimates the current and future economic impacts of the airport company–
Auckland International Airport Limited (AIAL) – as a business entity in its own right.1
4.1 Steps in the Analysis
Figure 2 shows the key steps in the analysis:
Figure 2: Methodology Used to Estimate Impacts of the Airport Company Itself
Define the Airport •Define the relevant scope of the analysis by identifying the size and location
Company (AIAL) of the airport company (AIAL)
Calcuate Direct •Analyse the airport company’s 2013 profit and loss statement to identify its
Effects direct economic impacts.
Map Expenditures •Map each expenditure item in the profit and loss statement to an industry in
to Industries the regional input-output table.
Calculate Indirect •Overlay industry-level multipliers from the Auckland regional input-output
Effects table to translate supply chain expenditures into measures of indirect effects.
Calculate Induced •Convert the wages and salaries paid by the airport and its suppliers into
Effects measures of induced effects.
Calculate Total •Sum the direct, indirect and induced effects to yield the current overall
Impacts economic impact of the airport as a business entity in its own right.
Project Future
•Project future impacts broadly on the basis of forecast passenger growth.
Impacts
The rest of this section works through each step.
4.2 Definition of Airport Company
To begin, we must first define what is meant by the airport company. In technical terms,
it refers to the publicly-listed entity known as Auckland International Airport Limited
(AIAL). In practical terms, it refers to the company that owns and controls the bulk of
the airport’s assets. However, the airport company itself is not responsible for many of
the airport’s day-today operations, most of which are performed by other organisations
on the airport’s land. As a result, the economic impacts derived in this section capture
only a small fraction of total airport impacts. The majority are picked up in the next
section, which analyses the economic impacts of the wider airport complex.
1 Some of the discussion in this section has been adapted from a 2013 Covec report titled How businesses
that serve tourists add value to the New Zealand economy.
Regional Economic Importance of Auckland Airport 10As shown in the figure below, the airport company is currently located a small distance
from the terminals on Leonard Isitt Drive.
Figure 3: Location of AIAL Relative to the Airport Terminals
AIAL
Domestic
International Terminal
Terminal
4.3 Direct Impacts
The airport, like all other businesses, adds value to the economy by purchasing goods
and services from other organisations (intermediate purchases), transforming them
through its “production processes” and selling the resulting goods and services to its
own customers. Described in this way, value-added (or GDP) simply captures the
difference between an organisation’s own revenues and the intermediate purchases it
makes to earn those revenues.
As shown in the diagram below, a firm’s contribution to value-added can also be
measured simply by adding its earnings before interest, tax depreciation and
amortisation (EBITDA) to its wages and salaries payments. The two produce identical
results, at least in theory, and the particular method used to calculate value-added will
often reflect the information available.
Regional Economic Importance of Auckland Airport 11Figure 4: Two Ways of Calculating Value Added (GDP)
Since the profit and loss statement provided by the airport was very detailed – excellent
for the calculation of flow-on effects – the simplest option was to just add its wages and
salaries payments to its EBITDA. This resulted in an estimated direct contribution to
value added of $322 million for the year ended 30 June 2013. Over the same period, the
airport employed 330 fulltime equivalent staff and paid salaries and wages of $36
million. These metrics represent the airport company’s direct contribution to the
economy for the past financial year, and are summarised in Table 3.
Table 3: Direct Economic Impacts of AIAL in 2013
Impact Measures Direct Effects
Value Added ($m) $322
Employment (FTEs) 330
Household Incomes ($m) $36
Please note that the impacts above relate only to the daily operations of the airport
company itself. Hence, they do not reflect the significant economic activity that occurs in
and around the terminals, which is captured in the analysis of the wider airport
complex.
4.4 Indirect Impacts
Each year, the airport purchases goods and services from a wide range of suppliers,
who in turn purchase items from their own suppliers and so on. The movement of
money through these supply chains allows other businesses in the economy to further
redistribute the original expenditure and add value via their own production processes,
giving rise to indirect impacts.
To measure the indirect (supply chain) impacts of the airport’s annual expenditures, we:
1. Determined the proportion of each of the 79 expenditure items in its profit and
loss statement that was likely spent in Auckland2
2 This was done based on our understanding of the airport’s supply chains and also by using some
simple rules of thumb.
Regional Economic Importance of Auckland Airport 122. Mapped the resulting estimated Auckland expenditures to industries in the
input-output table, and
3. Overlaid the corresponding multipliers to determine indirect impacts.
Before showing the results, Table 4 first shows the composition of the airport’s
annual expenditures, which totalled $118 million. This was dominated by salaries
and wages (34%), repairs and maintenance (8%), outsourced operations (8%) and
marketing (also 8%).
Table 4: Composition of Airport Expenditure for Year Ended 30 June 2013
Expense Cost $m Share
Salaries & Wages (incl ACC etc) $40 34%
Repair & Maintenance $10 8%
Outsourced Operations $10 8%
Marketing $9 8%
Rates $7 6%
Cleaning $7 6%
Electricity $6 5%
Consultancy $5 4%
Promotions $4 4%
Insurance $3 2%
Other Expenses $17 15%
Total $118 100%
Next, the following table shows the estimated geographic spread of expenditures based
on our line-by-line allocations. In summary: Auckland is estimated to receive 84% of
airport expenditures, the rest of New Zealand 12%, and overseas 4%.
Table 5: Estimated Destination of AIAL Expenditures
Expenditure Destinations Cost $m Share
Auckland $99 84%
Rest of NZ $14 12%
International $4 4%
Total $118 100%
Finally, following are the estimated Auckland regional indirect impacts based on the
inputs and assumptions above.
Table 6: Indirect Economic Impacts of AIAL in 2013
Impact Measures Indirect Effects
Value-Added ($m) $55
Employment (FTEs) 921
Household Incomes ($m) $35
In summary: the airport’s expenditures give rise to further economic impacts, which
include full time employment for 921 people, household incomes of $35 million and $55
million in additional value added.
Regional Economic Importance of Auckland Airport 134.5 Induced Impacts
The airport and its suppliers employ hundreds (if not thousands) of people and pay
them each a wage or salary. A lot of this income will be re-spent in the regional
economy and thus give rise to further economic stimulus, known as the induced effect.
To estimate induced effects, we identified the total amount paid to airport and supply
chain employees, stripped out taxes, savings and leaked expenditure, then allocated the
remainder to different expenditure categories using the Household Economic Survey
(HES). Then we overlaid the corresponding industry multipliers from the input-output
table to determine the corresponding regional economic impacts.
For the sake of this exercise, we assumed that:
1. 33% of household income was lost to taxes and savings,
2. 10% of the balance was spent outside the region, and
3. the remaining 90% was spent in Auckland
These give rise to the following estimates of induced impacts for 2013.
Table 7: Induced Economic Impacts of AIAL in 2013
Impact Measures Induced Effects
Value-Added ($m) $39
Employment (FTEs) 477
Household Incomes ($m) $21
The induced economic impacts of the airport and its suppliers adds a further $39 million
to regional GDP, 477 fulltime equivalent jobs, and $21 million in regional household
incomes.
4.6 Overall Economic Impacts
The following table summarises the overall economic impacts of the airport as a
business entity for the year ended 30 June 2013.
Table 8: Overall Economic Impacts of AIAL in 2013
Impact Measures Direct Indirect Induced Total
Value-Added ($m) $322 $55 $39 $415
Employment (FTEs) 330 921 477 1,728
Household Incomes ($m) $36 $35 $21 $92
To summarise: including flow-on effects, the regional economic impacts of the airport
company as a business entity in its own right are:
$415 million in regional value added
1,728 fulltime equivalent jobs, and
$92 million in regional household incomes.
Regional Economic Importance of Auckland Airport 144.7 Projected Future Impacts
In addition to estimating the airport company’s current impacts, we also wanted to
produce high-level forecasts of future impacts for value-added (GDP). After testing
several potential methodologies, we found that passenger numbers provided the best
explanatory power. Accordingly, we formed a statistical relationship between historic
economic impacts and historic passenger volumes, and used that relationship to project
future economic impacts on the basis of future passenger projections.
Following are the key steps in the analysis:
1. Create a time series of annual economic impacts from 2001 to 2013 (the longest
period over which reliable information was available).
2. Identify annual passenger numbers over the same period
3. Create a scatter plot of passenger numbers against direct value added
4. Fit a trendline to the scatter plot
5. Obtain forecasts of future passenger numbers
6. Apply the trendline to the passenger forecasts to yield estimates of future value
added.
To begin, Figure 5 shows the airport company’s direct contribution to value added from
2001 to 2013. This has increased from $139 million in 2001 to $322 million in 2013 – an
annual growth rate of 7.3%.
Figure 5: Airport Company Direct Value Added from 2001 to 2013
$350
$300
$250
Direct Value-Added $m
$200
$150
$100
$50
$0
2001 2002 2003 2004 2005 2006 2007 2008 2009 2010 2011 2012 2013
Next, we sourced historic passenger numbers, which are graphed below. These have
also grown steadily, with an annual growth rate of 5% between 2001 and 2013.
Regional Economic Importance of Auckland Airport 15Figure 6: Auckland Airport Passenger Volumes (by Financial Year)
16
14
12
Annual Passenger Numbers (millions)
10
8
6
4
2
0
2001 2002 2003 2004 2005 2006 2007 2008 2009 2010 2011 2012 2013
To identify a statistical relationship between the variables, Figure 7 creates a scatter plot
of value added versus passenger numbers, and adds a linear trendline.
Figure 7: Scatter Plot of Passengers vs AIAL Direct Value Added
$350
y = 27.6x - 89.3
$300 R² = 0.92
$250
Direct Value-Added $m
$200
$150
$100
$50
$0
0 2 4 6 8 10 12 14 16 18 20
Annual Passengers (millions)
Regional Economic Importance of Auckland Airport 16The R2 value attached to the trendline suggests that there is a good statistical fit between
the variables. In fact, the value of 0.92 means that variation in passenger volumes alone
“explained” 92% of variation in direct value-added.
To generate forecasts of direct-value added using this relationship, we just needed
forecasts of future passenger volumes. These were provided by DKMA - an airport
market research and advisory services company – on behalf of the airport and are
shown in the figure below. While these are indicative and subject to considerable
uncertainty around macro-economic trends, they stress the importance of ensuring
adequate future capacity to meet demand.
Figure 8: Master Plan Passenger Forecasts (from DKMA)
40
DKMA Forecast
Actual
35
30
Annual Passengers (millions)
25
20
15
10
5
0
2000 2004 2008 2012 2016 2020 2024 2028 2032 2036 2040 2044
Finally, we fed the passenger forecasts above into the trendline equation to project the
airport company’s direct contribution to value-added. The results of the analysis
suggest that the airport company’s direct contribution to value added could reach $870
million per annum by 2044.
If we now assume that flow-on effects grow pro-rata, the airport company’s overall
contribution to regional value-added could be as follows by 2044:
1. Direct - $872m
2. Indirect - $149m
3. Induced - $106m
4. Total - $1,127m
According to our calculations and underlying assumptions, by 2044, the airport
company alone could contribute more than $1.1 billion of value added to the Auckland
regional economy (including flow-on effects).
Regional Economic Importance of Auckland Airport 175 Impacts of the Wider Airport Complex
This section analyses the economic impacts of the wider airport complex.
5.1 Steps in the Analysis
Figure 9 shows the key steps in the analysis:
Figure 9: Methodology for Assessing Economic Impacts of the Wider Airport Complex
Define the Wider •The first step is to delineate the geographic area comprising the wider
Airport Complex airport complex.
Identify Airport-
•The nature of employment within the wider airport complex is
Related determined using detailed employment data from Statistics NZ.
Employment
Determine Share •The share of employment for each industry that is likely to be airport-
Related to Aiport related is estimated.
Convert
•Airport-related employment is converted to turnover using the Annual
Employment to Enterprise Survey
Turnover
Map Industries to
•Airport-related employment is mapped to industries in the input-
Input-Output output table
Table
Overlay •Multipliers from the input-output table are overlaid using the industry
Multipliers mappings in the previous step.
Calculate Gross •Gross impacts (including double counts) are calulated for airport-
Impacts related businesses. These include direct and flow-on effects.
Remove Double •Double counts are removed by carefully analysing the nature and
Counts extent of supply chain linkages.
Calculate Net •Double counts are subtracted from gross impacts to yield net
Impacts economic impacts of the wider airport complex.
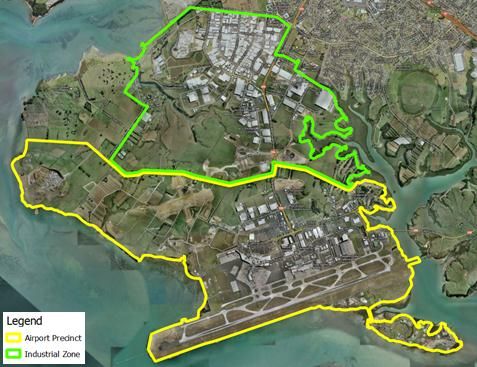
5.2 Geographic Extent of the Wider Airport Complex
The first step was to define the geographic extent of the wider airport complex. To this
end, we grouped neighbouring, airport-related businesses into two areas:
1. An airport precinct – this encapsulates the two airport terminals and a number
of airside businesses, such as flight caterers, and
2. An industrial zone – this is the large business zone to the north, which houses a
large number of airport-related activities, including freight and logistics.
The following map, which is based on 2013 meshblock boundaries, shows the
geographic extent of each area as defined in the remainder of the analysis.
Regional Economic Importance of Auckland Airport 18Figure 10: Geographic Extent of the Wider Airport Complex
5.3 Employment Within the Airport Complex
Detailed employment data was used to determine the nature of economic activity
occurring within the airport complex. The following table shows a snapshot as at
February 2013, the latest date for which data is currently available.
Table 9: Airport Complex Employment as at February 2013
Airport Industrial Complex Complex Regional
Level 1 Industries
Precinct Zone Total Shares Share
Accommodation and Food Services 1,150 362 1,512 7% 7%
Administrative and Support Services 60 735 795 4% 6%
Agriculture, Forestry and Fishing 0 23 23 0% 1%
Arts and Recreation Services 39 24 63 0% 2%
Construction 9 95 104 1% 5%
Education and Training 9 97 106 1% 8%
Electricity, Gas, Water/Waste Services 25 9 34 0% 1%
Financial and Insurance Services 84 15 99 0% 4%
Health Care and Social Assistance 51 38 89 0% 10%
Information Media & Telecoms 75 12 87 0% 3%
Manufacturing 1,259 1,235 2,494 12% 11%
Mining 3 0 3 0% 0%
Other Services 113 364 477 2% 3%
Professional, Scientific & Tech Services 112 266 378 2% 11%
Public Administration and Safety 1,066 36 1,102 5% 5%
Rental, Hiring and Real Estate Services 216 483 699 3% 2%
Retail Trade 874 194 1,068 5% 10%
Transport, Postal and Warehousing 5,998 3,715 9,713 48% 5%
Wholesale Trade 78 1,384 1,462 7% 8%
Totals 11,221 9,087 20,308 100% 100%
Regional Economic Importance of Auckland Airport 19Table 9 shows that a broad range of economic activity occurs within the wider airport
complex, but (as expected) there is a significant concentration of transport, postal and
warehousing activity. In fact, transport, postal and warehousing activity accounts for
nearly half of all employment within the airport complex, compared to only 5% for the
Auckland region.
To better understand the nature of economic activity occurring within the airport
complex, we estimated location quotients. These measure the relative importance of
different industries to a particular area relative to the regional average. Specifically, the
location quotient for each sector is calculated by dividing its share of local area
employment by the corresponding share of regional employment. For instance, if a
certain sector represents 20% of local employment but 10% of regional employment, the
location quotient for that sector is 20%/10% = 2. Thus, location quotients greater than
one reflect sectors in which an area specialises, and vice versa.
With that definition in mind, the following chart shows all industries in the airport
precinct whose location quotient was greater than one. As expected, economic activity is
dominated by airport-related businesses. For instance, the share of employment in air
and space transport is 36 times higher than the regional average.
Figure 11: Location Quotients for the Airport Precinct
Air and Space Transport
Transport Equipment Manufacturing
Postal and Courier Pick-up and Delivery Services
Transport Support Services
Public Order, Safety and Regulatory Services
Rental and Hiring Services (except Real Estate)
Internet Service Providers, Web Search Portals and Data…
Warehousing and Storage Services
Public Administration
Other Transport
Food and Beverage Services
Accommodation
Other Store-Based Retailing
Heritage Activities
0 5 10 15 20 25 30 35 40
Next, the following graph shows the location quotients for the industrial zone. These
reveal large concentrations of activity in sectors related to the storage and distribution of
goods (amongst other things).
Regional Economic Importance of Auckland Airport 20Figure 12: Location Quotients for the Industrial Zone
Transport Support Services
Warehousing and Storage Services
Commission Based Wholesaling
Rental and Hiring Services (except Real Estate)
Road Transport
Accommodation
Non Store Retailing and Retail Commission Based Buying…
Beverage and Tobacco Product Manufacturing
Machinery and Equipment Wholesaling
Food Product Manufacturing
Water Transport
Basic Material Wholesaling
Administrative Services
Polymer Product and Rubber Product Manufacturing
Non-Metallic Mineral Product Manufacturing
Personal and Other Services
Basic Chemical and Chemical Product Manufacturing
Other Goods Wholesaling
Wood Product Manufacturing
Other Transport
Motor Vehicle and Motor Vehicle Parts Wholesaling
Machinery and Equipment Manufacturing
Library and Other Information Services
0 5 10 15 20 25 30
Finally, we note that not only does the nature of airport economic activity differ from
the regional average, but so too does its historic rate of growth. For instance, between
2000 and 2013, regional employment grew 25%. However, over the same period,
employment within the airport complex grew more than twice as fast (58%).
5.4 Airport-Related Shares
To determine the economic impact of airport-related businesses in the wider airport
complex, we first needed to determine the extent to which these businesses were indeed
airport-related. With so many businesses to work through – more than 900 – it was not
feasible to consider each individually. Instead, we worked through each of the detailed
260 industry classifications and allocated a proportion of each industry’s employment as
airport related. In many cases, a zero percentage was assigned, while for many others
the percentage was high.
The allocations were guided by a range of information, including site visits, desktop
research, information provided by the airport and our own previous experience. The
exercise was also performed separately for the two areas that comprise the catchment
(precinct and industrial) so that the assumed degree of airport dependency could differ
between them on an industry-by-industry basis. Where allocations were uncertain we
erred towards lower figures to ensure that our resulting estimates of economic impacts
were conservative. The appendix also conducts some simple sensitivity tests to show the
impacts of different assumptions around airport-related activity shares.
The following table shows the results of these allocations after grouping them up to
high-level industry codes. Overall, 85% of employment in the airport precinct was
assumed to be airport-related, and 55% of employment in the nearby industrial area.
Regional Economic Importance of Auckland Airport 21Table 10: Shares of Airport Complex Employment Attributed to the Airport
High Level Industries Precinct Industrial
Accommodation, Food Services 65% 85%
Administrative and Support Services 55% 40%
Agriculture, forestry, fishing and hunting 0% 0%
Arts and Recreation Services 70% 55%
Construction 35% 0%
Education and Training 80% 50%
Electricity, gas and water supply 50% 0%
Finance and insurance 0% 0%
Health Care and Social Assistance 50% 50%
Information Media and Telecommunications 0% 0%
Manufacturing 100% 5%
Mining 0% 0%
Other Services 55% 35%
Professional, Scientific and Technical Services 45% 15%
Public Administration and Safety 100% 40%
Rental, Hiring and Real Estate Services 95% 95%
Retail trade 45% 15%
Transport and storage 100% 95%
Wholesale trade 50% 5%
All Industries 85% 55%
5.5 Conversion from Employment to Turnover
The preceding step produced a detailed list of industries along with estimates of the
amount of employment in each considered to be airport related. The next step was to
convert these estimates of airport-related employment into turnover by industry. This
was done using the Annual Enterprise Survey, which provides detailed financial
information for more than 100 different industries. By mapping the industries in the
catchment to the industries in the survey and overlaying the survey’s estimates of
turnover per employee, the following industry-level turnover estimates were derived.
To summarise: Our analysis suggests that around $2.6 billion of airport-related
economic activity occurs within the airport precinct (excluding AIAL), and a further $1.1
billion in the nearby industrial zone. All up, around $3.7 billion of airport-related
economic activity is estimated to occur in the wider airport complex each year (again,
excluding AIAL).
Regional Economic Importance of Auckland Airport 22Table 11: Estimated Airport-Related Turnover excluding AIAL ($ millions)
High-level Industries Precinct Industrial Total
Accommodation, Food Services $58 $27 $85
Administrative and Support Services $4 $29 $33
Agriculture, forestry, fishing and hunting $0 $0 $0
Arts and Recreation Services $3 $1 $5
Construction $1 $0 $1
Education and Training $1 $4 $5
Electricity, gas and water supply $3 $0 $3
Finance and insurance $0 $0 $0
Health Care and Social Assistance $2 $1 $3
Information Media and Telecommunications $0 $0 $0
Manufacturing $311 $10 $321
Mining $0 $0 $0
Other Services $6 $13 $19
Professional, Scientific and Technical Services $9 $7 $17
Public Administration and Safety $317 $4 $321
Rental, Hiring and Real Estate Services $76 $165 $241
Retail trade $97 $9 $106
Transport and storage $1,675 $790 $2,465
Wholesale trade $32 $73 $105
All Industries $2,595 $1,134 $3,729
5.6 Industry Mapping and Multiplier Overlay
Next, we mapped airport-related industries to industries in the input-output table so
that multipliers derived from the latter could be applied to the turnovers of the former
to produce the gross impacts reported below.
5.7 Gross Impacts
Table 12 shows the estimated economic impacts of nearby, airport-related businesses.
Please note that these include some double-counts, which are removed in the next step.
Table 12: Gross Economic Impacts of the Wider Airport Complex
Value Added ($m) Precinct Industrial Total
Direct $980 $670 $1,650
Indirect $770 $280 $1,050
Induced $600 $250 $850
Total $2,340 $1,200 $3,540
Employment (FTEs) Precinct Industrial Total
Direct 9,500 5,100 14,600
Indirect 10,500 2,400 13,000
Induced 6,600 2,000 8,700
Total 26,700 9,500 36,200
Household Income ($m) Precinct Industrial Total
Direct $740 $320 $1,060
Indirect $430 $160 $590
Induced $290 $120 $410
Total $1,460 $600 $2,060
Regional Economic Importance of Auckland Airport 23To summarise: the gross economic impacts of the wider airport complex (excluding
AIAL but including flow-on effects) are estimated to be:
$3.5 billion in regional value added
36,200 fulltime equivalent jobs, and
Over $2 billion in regional household incomes.
5.8 Accounting for Cross-Linkages
One of the key steps in a multiplier analysis is to identify the underlying supply chain
for the entity (or entities) in question, so that flow-on effects can be determined. In most
cases, this is straightforward. However, because this part of the analysis considers the
economic impact of hundreds of businesses simultaneously, the situation becomes more
complex.
The problem is that, unless interactions between these businesses are explicitly taken
into account, the analysis will inadvertently count some impacts more than once and
hence cause impact estimates to be overstated. To understand the nature of the problem,
consider the simple diagram below, which depicts the airport company, plus companies
in both the industrial zone and airport precinct.
Figure 13: Representation of Inter-Linkages and Intra-Linkages
Airport Company
(AIAL)
Rest of the Airport
Inter-linkages Industrial Zone
Precinct
The grey lines connecting each box represent inter-linkages, in which the outputs of one
group are inputs to another. For instance, rental space provided by the airport company
(which would be counted as one of its outputs) would also be counted as an input to the
retailers that occupy those spaces. If this is not taken into account, then some of the
direct impacts attributed to one group of businesses will also be counted as indirect
impacts for another group.
In addition to these inter-linkages, which occur between groups, there will also be
linkages that occur within groups. For instance, the outputs of one business in the
Regional Economic Importance of Auckland Airport 24industrial zone may be supplied to a neighbouring business, who in turn may supply
their outputs to yet another nearby business. These so-called intra-linkages are
represented by the small curved arrows at the bottom right of each box.3
To properly account for all these inter- and intra-linkages when estimating economic
impacts, we constructed a highly-detailed model that enabled us to identify – and then
control for – supply relationships between firms. In doing so, we were able to control for
potential double-counting and thus improve the accuracy of our impact estimates.
The appendix contains more information about how inter- and intra-linkages were
handled in the analysis, as well as their effects on our estimates of economic impact. For
now, it is enough to know that the following types of double-counts have been explicitly
estimated and removed to arrive at net economic impacts.
a) AIAL company expenditures – these occur when the airport company
purchases goods and services from other businesses in the airport complex.
b) AIAL wages – these occur when the airport company’s employees purchase
goods and services from other businesses in the airport complex.
c) AIAL revenues – these occur when the airport company sells goods and services
to other businesses in the airport complex.
d) Inter-catchment linkages – these occur when businesses in the airport precinct
purchase goods/services from businesses in the industrial zone, and vice versa.
e) Intra-catchment linkages – these occur when businesses in the airport precinct
purchase goods/services from one another (and similarly for businesses within
the industrial zone).
Following are the estimated double counts produced by our model, which were
subtracted from the gross impacts above to yield the net impacts below.
3 This icon does not appear in the Airport company box, because it is only one firm and hence there is
no scope for intra-linkages to occur.
Regional Economic Importance of Auckland Airport 25You can also read