Expert Opinion Valuation Method to Quantify Digital Water Metering Benefits - MDPI
←
→
Page content transcription
If your browser does not render page correctly, please read the page content below
water
Article
Expert Opinion Valuation Method to Quantify Digital
Water Metering Benefits
Ian Monks 1,2 , Rodney A. Stewart 1,2, * , Oz Sahin 1,2 , Robert Keller 3,4 and
Samantha Low Choy 5
 1   School of Engineering and Built Environment, Griffith University, Gold Coast, QLD 4222, Australia;
     ian.monks@griffithuni.edu.au (I.M.); o.sahin@griffith.edu.au (O.S.)
 2   Cities Research Institute, Griffith University, Gold Coast, QLD 4222, Australia
 3   Civil Engineeering Department, Monash University, Clayton, VIC 3800, Australia; rjkeller@optusnet.com.au
 4   R. J. Keller & Associates, Edithvale, VIC 3196, Australia
 5   Arts, Education and Law Group/Researcher Education & Development/ Environmental Futures Research
     Institute, Griffith University, Mt Gravatt, QLD 4122, Australia; s.low-choy@griffith.edu.au
 *   Correspondence: r.stewart@griffith.edu.au

 Received: 30 March 2020; Accepted: 13 May 2020; Published: 18 May 2020

 Abstract: Business cases promoting the introduction of digital water metering (DWM) have, to date,
 focused on a limited number of benefits, especially water savings, metering costs, occupational health
 and safety (OHS), and deferral of capital works. An earlier study by the authors catalogued 75 possible
 benefits and developed a taxonomy based on a literature review, interviews and water industry reports.
 The objective of the present study was to elicit the opinions of Australian water industry experts on
 the benefits, then use the opinions to form probability distributions which, in future work, could be
 used to model the value of DWM benefits. The study findings have implications for researchers and
 practitioners seeking to accurately and stochastically model the benefits of DWM transformation
 programmes. Thematic analyses on the open ended responses scaled likelihood and estimated value
 of benefits into comparable units. We found 82% support for the benefits of DWM with only 6%
 disagreement and 12% non-commital; the savings value of cost of water benefits were predominately
 expected to range between 5% and 10% and much higher in some individual situations, while
 charges/operational costs benefits were predominately expected to range between 45% and 100%;
 and, moreover, we indicated how a risk-based range of project benefit could potentially be calculated.
 Opportunities for further investigations were identified.

 Keywords: digital water metering; smart water networks; expert opinion; benefit valuation; modelling

1. Introduction
     Many benefits of digital water metering (DWM) have been reported since one of the first reports
on the “new automated meter reading” (AMR) systems emanated from the US in 1994 [1]. Use of
AMR was being promoted as both “strategic” and “best practice” just three years later [2], with further
deployments being reported in US cities from 1997–1999 [3,4]. Deployments have continued in the US
and other countries since, and documented in case studies and reviews [5–12].
     Research into specific issues has been conducted, increasing both awareness and knowledge
of the potential benefits. Australian researchers have canvassed new opportunities to exploit the
“big data” from DWM for water end-use analytics, leak identification, infrastructure planning,
and sustainability issues [11,13–16]. International researchers have reported the benefits to tourist and
holiday precincts, vacant properties, and water conservation practices from trials and case studies of
DWM implementations [5–12].

Water 2020, 12, 1436; doi:10.3390/w12051436                                       www.mdpi.com/journal/water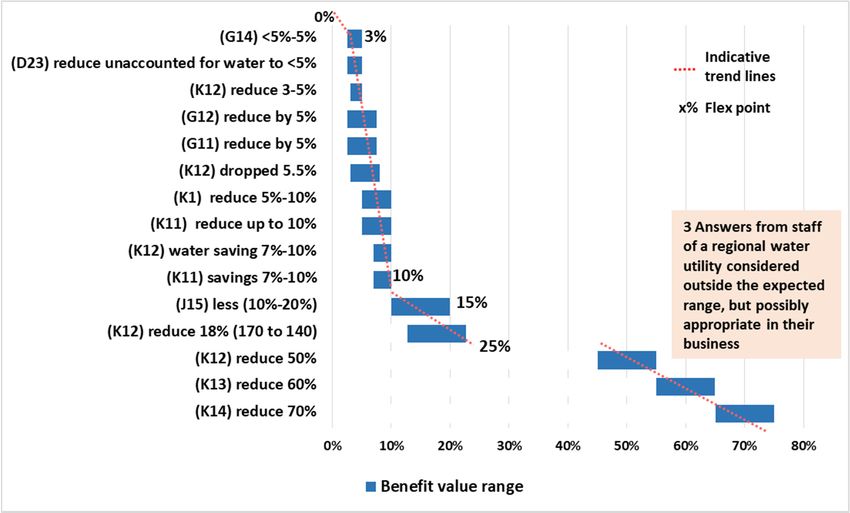
Water 2020, 12, 1436                                                                                 2 of 21

      Uptake of DWM among Australian water utilities has been slow. A review in 2014 reported a
number of Net Present Value (NPV) analyses of automated metering infrastructure (AMI) projects [12].
To date, a number of small-sized water utilities operated within Local Councils in regional areas
have deployed DWM [17,18], two mid-size water utilities have started their upgrades [19,20],
some metropolitan water utilities have limited deployments for specific situations usually involving
access issues [21,22]. Other water utilities are running trials to evaluate technologies, better understand
change issues and measure benefits [11,23,24]. In the state of Victoria, during the 2018 pricing
submissions to the Essential Services Commission (ESC), most of the 16 water utilities advised that they
are considering the opportunity to switch to digital meters. In a comment on each utilities’ proposal,
the Consumer Action Law Centre (CALC) requested more information on digital water meters and
that success criteria be provided, before stating their opposition to time-of-use tariffs [25]. In response
to the submissions and public comments, the ESC required water utilities to proceed to deliver positive
net present value from full roll-outs [26].
      The negative impact of the rollout of electricity smart meters continues to impact the move to
“smart-meters” for water [25,27]. Consumers in Victoria, Australia were required to pay for their
electricity smart meters, but the benefits were seen to go almost exclusively to the electricity companies.
The Energy and Water Ombudsman (Victoria) dealt with the complaints and reported them annually
and in a special report [28,29]. A case study describes the Victorian electricity smart meter rollout as a
failed business case [24,30].
      While the electricity industry has had issues with customer acceptance of digital metering, where
DWM is used, and used for direct customer benefit, the response by customers has been positive [5,24,31].
Insight into successful deployments are reported in published case studies, unpublished reports and
local press reports [6,10,24,32–39], as well as general reviews of DWM trials and implementations [11,40].
The literature review that preceded this study identified 75 benefits, many of them previously
unreported, and catalogued them in a taxonomy [41]. Well-known benefits included identification of
concealed leaks within properties, improved water balance analysis, meter reading cost savings, reduced
mis-reads and estimated readings, reduced occupational health and safety issues, and more detailed
water consumption data for network planning. Some of the less well-known benefits were improved
cash flow through monthly billing [42], reduced administrative overhead of the current monthly
payment plans from monthly billing [43–46], easier resolution of billing disputes, and identification of
fire service cross-connections. Other less well-known benefits involve sub-metered properties such as
strata-titled residences [47,48], water appliance performance monitoring [49–52], improved home and
business security [53] and unauthorized water use monitoring at vacant properties [10].
      To improve the chance of succeeding with business case, managers need to recognize that
“business cases are multi-faceted” and “focus obsessively on turning perceived intangibles into
hard numbers” [30], be smart with their strategies, consider opportunities more broadly across the
business [54,55], and include some risk modelling that would better inform executive management of
the range of possible outcomes [56,57]. However, the likelihood of the lesser-known benefits DWM
from the catalogue being achievable, and them contributing to a business case, remained unknown
from the literature review [1]. Spreadsheets aimed at calculating the Net Present Value (NPV) of DWM
projects lacked any risk modelling [58–60].
      The objective of this study was to measure the likelihood and value of the benefits of DWM,
and to consider using the results in a benefit value modelling tool. This paper reports the methods
used (Section 2), the outcomes of structured interviews (Sections 3.1 and 3.2), and the quantification of
the responses to develop frequency distributions used in a stochastic model (Section 3.3). The paper
concludes with the limitations of the study (Section 4), a discussion of the findings and opportunities for
further research (Section 5) and a conclusion (Section 6). The costs of DWM projects are not included here
as they are considered to be water utility-specific and based on many factors including infrastructure
requirements, purchasing power, tendering requirements, project strategies and technological advances.
Water 2020, 12, 1436                                                                                 3 of 21

2. Research Method
    The use of structured interviews, and qualitative and quantitative analysis, was designed to
address the lack of empirical evidence covering all benefits from previous studies.

2.1. Structured Interview Development
      Structured interviews were used to elicit the opinions of experts on a very high number of issues
(71) across many business areas where they might or might not have expertise. Group sessions,
such as workshops, offered the opportunity to explore issues and build consensus. However, logistical
issues such as gaining the attendance of all the necessary participants at the same time, the duration
required to cover the issues and maintain participant interest, made in-person workshops unworkable.
One-on-one interviews were ruled out for similar reasons, as well as the impact on the interviewer’s
time and travel requirements. The use of an online survey offered many advantages including
providing participants with the option of suspending and resuming the survey at a later time to enable
work commitments to be met. A disadvantage of online surveys is the lack of opportunity to clarify
questions and avoid misunderstandings. To counter this issue, and achieve a common understanding
and a consistency of input, the questions were supplemented with some background information [61].
      The question for the benefit of potentially reducing the number of special readings, D12, illustrates
the typical question structure used in the survey: “D12. From your experience/knowledge will water
businesses benefit from a reduction in special meter reads and to what extent? BACKGROUND:
When customers leave properties the water meter needs to be read to enable the leaving customer to
be billed and the arriving customer to start from zero. By taking the electronic reading of the meter at a
nominated date and time can eliminate meter readers having to visit the property.”
      Qualitative analysis was used to encode the expert assessments of likelihood and benefit value
which could then be examined via quantitative analysis. Firstly a qualitative approach was used to
elicit which benefits were supported as being achievable, and to what degree. Open-ended questions
were chosen to allow the experts to quantify their knowledge using the units most familiar to them
and ensure elicitation could be more accurate [60]. Secondly, quantitative analysis enabled probability
distributions to be developed from the expert assessments. No attempt was made to establish a
consensus among the expert opinions, so that the various ‘raw’ views have been used to establish the
range and frequency of possible outcomes [62]. Thirdly, modelling of the benefit value demonstrated
that cost benefits could be presented as statistical distributions [63].
      In addition to the collection of opinions on the benefits, the survey instrument collected profiling
data for each participant to enable any differences between expert cohorts to be identified.

2.2. Structured Interviews

2.2.1. Interview Design
      A long survey raises issues around participant fatigue and maintaining interest [64,65]. The DWM
benefits were grouped into blocks based on the business expertise relevant to the benefit. This ‘blocking’
filtered questions so that experts could avoid questions they would not be able to answer and, instead,
concentrate their attention in areas in which they had the knowledge and/or expertise. Experts were
able to select which blocks they would answer with the exception of the block of questions on customer
goodwill, which appeared as the last block. While the Goodwill question-block was not mandatory,
the experts were asked to answer as a customer as well as an expert, if they had expertise in the area.
      For each benefit, experts were asked their views on the likelihood of the benefit being achieved and
the extent of the benefit on savings or improvements. They were asked to describe any experience or
evidence of the benefit that they were aware of. Each question was supported by some neutrally worded
background information to assist the participant in understanding the context of the benefit [61].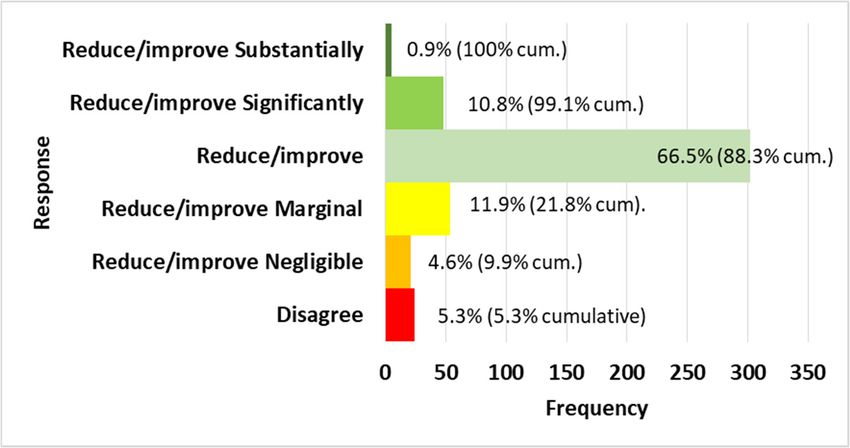
Water 2020, 12, 1436                                                                              4 of 21

     The online survey included all benefits that had been identified at the time. Four additional
benefits were identified during the course of the structured interviews. The number of questions in the
different sections of the structured interviews comprised:

•    1 question on ‘Consent’ to participate;
•    8 questions covering participant profiling (1 open-ended, 2 multi-choice and 5 rating);
•    71 questions seeking participants’ opinions of the benefits (grouped for knowledge/expertise into
     13 blocks, open-ended); and,
•    1 question to ‘Close’ the interview (open-ended)

2.2.2. Interview Approval, Testing and Recruitment
     Ethics approval for the survey was obtained from Griffith University Ethics Department (2018/271)
before proceeding.
     Validity checks were conducted on the interview questions using an academic in the field and
piloted the survey using a water industry professional, which refined question flow and wording.
     The target audience were staff within water utilities and supporting organisations who had an
involvement in key business areas. These areas include digital metering, water metering, operational
planning, non-revenue water, customers, complaint handling or business support functions. We also
recruited independent experts who had industry experience. Invitations were sent to liaising staff at
water businesses who identified subject matter experts within the business and passed the invitation
to them. Invitations were sent directly by the researchers to the independent experts.

2.2.3. Data Cleansing and Analysis Procedure
      The experts’ responses were downloaded from the survey system and imported into a SQL
database [66] for analysis. Limited data cleansing was applied to provide clarity in a number of ways:
spelling and other obvious typographical errors, answers of “as above” and similar derivatives were
modified to include the previous answer being referred to, where identifiable, and names of water
utilities were removed to ensure their anonymity.
      A sample of the responses were manually reviewed to identify keywords describing the experts’
assessments of the likelihood that the benefit could be achieved, and the extent of that benefit.
An automated thematic analysis system was then iteratively developed [67–70] using SQL-queries and
online dictionaries to group keywords and phrases into common levels [71,72].

2.2.4. Quantitative Analysis
     We indicate how expert opinions could eventually be utilized, in a benefit value model for DWM.
A model could be built using the @Risk [73] add-on to MS Excel [74] to demonstrate the use of
distributions developed from expert assessments, and the Monte Carlo simulation of benefit value
for a DWM project. The aim would be to provide a probablistically-weighted range of outcomes that
could be a plausible input to business cases [63]. A set of hypothetical annual operating costs was
developed by the researchers from published reports of water utilities and regulators, then used to test
such a model. Here we merely illustrate the type of outputs available from such a model.

3. Results

3.1. Descriptive Statistics of Participant Profiles
     Experts participating in the survey (n = 52) came from a cross-section of water utility types in
Australia (large metropolitan authorities, regional urban authorities, water authorities within Local
Government bodies) and related organisations (regulators, advocates, service industries). Their range
of expertise and experience represented by their years in the industry, business areas and previous work
with DWM are recorded in the following tables. Twenty-nine (56%) came from experts in Metropolitan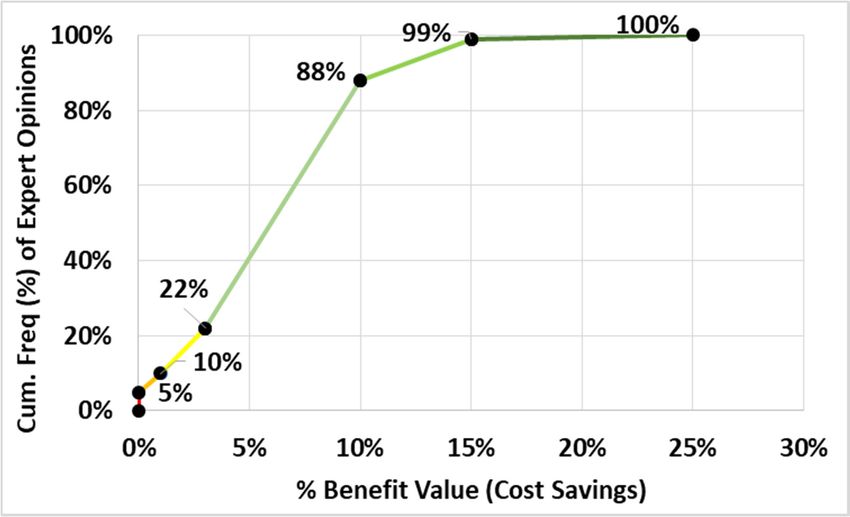
Water 2020, 12, 1436                                                                                                            5 of 21

water utilities, sixteen (31%) from regional water utilities and seven (13%) were former employees of
water utilities or who work for organisations servicing the industry. Table 1 shows a breakdown of the
number of years of experience of the participants for each of the service organization types. Participants
were asked to identify the business areas in which they had experience and/or expertise. Table 2
shows the break-down for major business groups characterized as customer, technical and support.
The survey asked for their level of specific experience and knowledge of DWM. Table 3 summarises
the participants’ level of experience within the organization types.

         Table 1. Years of experience in the water industry by water business service organisation type.

           Years in the Water Industry                  Metro                   Regional                 Independent
                      0–2 years                          2                          1                         0
                      3–5 years                          5                          3                         0
                      6–10 years                          6                         6                         0
                     11–20 years                         10                         3                         5
                  more than 20 years                     6                          3                         2
                        Total                            29                        16                         7

      Table 2. Respondents’ areas of experience/expertise by organisation type (multiple selected questions).

         Group                   Expertise/Experience                   Metro           Regional    Independent        Total
        Customer                 Customer Service                        16                13             6                35
                             Communications and digital 1                 0                 0             1                1
                                ADR, complaints 1                         0                 0             1                1
                                 Water efficiency 1                       1                 2             1                4
        Technical               Engineering Planning                     11                3              2                16
                               Engineering Operations                     7                2              1                10
                                      Metering                           10                8              3                21
                             Planning and Maintenance 1                  0                 1              0                1
                           Integrated Water Management 1                 1                 0              0                1
                          Contract Management, Stakeholder
                                                                          0                0              1                1
                                    Engagement 1
         Support                  Senior Management                       5                5              2                12
                                        Finance                           4                1              0                5
                          Legal/Regulation/Corporate Services             4                1              0                5
                                   Human Resources                        0                1              0                1
                                Information Technology                    1                1              1                3
                                     Data science 1                       0                1              0                1
                                         R&D 1                            0                1              0                1
                                      Academic 1                          0                1              1                2
                                          1   Answer from the free text option “Other”.

                             Table 3. Level of experience with DWM by organisation type.

           Level             Level of Experience                Metro           Regional        Independent       Total
           High              Full rollout of DWM                  -                4                 -                 4
                         In progress rollout of DWM               1                2                 -                 3
                          Completed or in-progress
                                                                  8                2                 2             12
                               trial(s) of DWM
         Minimal         Planning a trial(s) of DWM               6                4                 2             12
                          Peripheral role in metering
                                                                 10                1                 3             14
                         and/or digital metering area
                           Public information and
                                                                  1                2                 -                 3
                         presentations on DWM only
                          No current knowledge or
           Zero           experience/water industry               3                1                 -                 4
                           general knowledge only
Water 2020, 12, 1436 6 of 21
3.2. Agreement Levels for DWM Benefits
The first thematic analysis identified codes describing the experts’ assessments for the first
question of “agreement level”, and six themes were formed: strongly agree, agree, somewhat agree,
low-agreement, do not agree, do not know (see Table 4). Codes were categorized into themes [71,72]
with a Likert style scoring.
Table 4. Coding keywords for agreement level scoring from expert assessments.
Theme
Agreement Level Score Sample of Codes
(Meaning)
Strong Agreement
4 (interpreted as a higher enthusiasm level Absolutely, Definitely
than YES or PROBABLY, etc)
Agree
3 Yes, Probably, Should, Agree
(interpreted as better than 50% chance)
Possibly, Potentially, Potential, Somewhat,
Somewhat agree
2 To some extent, It will not be a significant benefit,
(interpreted as up to 50% chance)
Minimal impact, To be confirmed
Weak agreement
Maybe, Perhaps, Could, Doubtful, Unsure,
1 (interpreted as more than no chance, but
Difficult to say, Not necessarily
less than possibly)
No, Highly doubtful, Customers expect this,
Disagree Would not expect so, Not applicable,
0
(interpreted as no chance) Not particularly, Not to my knowledge,
A dis-benefit
Do not know, No opinion, Not Sure,
Have not heard of, I do not understand,
−1 NULL answer
Not my area, Unable to answer,
Have not considered, ‘-‘
The thematic analysis and Likert style scoring allowed responses to be scored and frequency
distributions built for the agreement level of each benefit. While the level of agreement varied between
individual benefits, overall 82% agreed that digital water meters would deliver benefits with only 6%
disagreeing and 12% not offering an opinion (‘do not know’). The benefits for water businesses scored
higher levels of acceptance (83% agree, 7% disagree) than those benefits for customers (76% agree,
7% disagree) (see Figure 1). The level of ‘do not know’ responses jumped from 10% for the business
benefits to 17% for the customer benefits. The number of ‘do not know’ responses was unexpected as
questions had been blocked into 13 areas of expertise and participants were asked to select the block or
blocks that
Water they
2020, 12, xfelt
FORthey
PEERcould
REVIEWanswer, but it may indicate that experts had not considered the benefit
7 of 23
previously and were unwilling to make an assessment at the time.
Figure 1. Within each beneficiary group (colour), the Percentage response (x-axis) for each agreement
Figure 1. Within each beneficiary group (colour), the Percentage response (x-axis) for each agreement
level (y-axis) aggregated across all benefits.
level (y-axis) aggregated across all benefits.
The level of agreement scores by experience with digital metering again showed the discrepancy
between business benefits and customer benefits, but also showed that inexperienced staff were more
inclined to answer “do not know” (see Figure 2). After ignoring the ‘do not know’ responses the levels
of agreement were consistent, ranging between 7.3% (experienced staff, business benefits) to 9.3%
(experienced staff, customer benefits) with inexperienced staff in the middle (7.8%) for bothWater 2020, 12, 1436
Figure 7 of 21
1. Within each beneficiary group (colour), the Percentage response (x-axis) for each agreement
level (y-axis) aggregated across all benefits.
The
Thelevel ofof
level agreement
agreement scores byby
scores experience
experience with digital
with digitalmetering
metering again
againshowed
showed the
thediscrepancy
discrepancy
between business benefits and customer benefits, but also showed that inexperienced
between business benefits and customer benefits, but also showed that inexperienced staff staff were
were more
more
inclined to answer “do not know” (see Figure 2). After ignoring the ‘do not know’ responses
inclined to answer “do not know” (see Figure 2). After ignoring the ‘do not know’ responses the levels the
levels of agreement were consistent, ranging between 7.3% (experienced staff, business
of agreement were consistent, ranging between 7.3% (experienced staff, business benefits) to 9.3% benefits) to
9.3% (experienced staff, customer benefits) with inexperienced staff in the middle
(experienced staff, customer benefits) with inexperienced staff in the middle (7.8%) for both (7.8%) for both
beneficiary
beneficiarygroups.
groups.
Figure 2. Within each beneficiary group (y-axis), depending on the level of the expert’s experience
in digital
Figure metering
2. Within each(inner y-axis):group
beneficiary the relative percentage
(y-axis), dependingresponse (x-axis)
on the level forexpert’s
of the each agreement level
experience in
(coloured).
digital metering (inner y-axis): the relative percentage response (x-axis) for each agreement level
(coloured).
Experts with more years of experience were more likely to provide an opinion than inexperienced
participants.
ExpertsAlso,withcustomer benefits
more years of attracted more
experience ‘do not
were know’
more responses
likely acrossan
to provide all opinion
years in the
than
Water
industry2020, 12, x FOR
(see Figure PEER
3). REVIEW 8 of 23
inexperienced participants. Also, customer benefits attracted more ‘do not know’ responses across all
years in the industry (see Figure 3).
Figure 3. Within each beneficiary group (y-axis), depending on the level of the experts’ years of industry
experience
Figure (inner
3. Within eachy-axis): the relative
beneficiary grouppercentage response (x-axis)
(y-axis), depending for each
on the level agreement
of the experts’ level
years(coloured).
of industry
experience (inner y-axis): the relative percentage response (x-axis) for each agreement level (coloured)
The level of agreement scores by the job role of staff is shown in Figure 4. Technical staff were
more likely to provide
The level opinions
of agreement and,by
scores unexpectedly,
the job role 15% of the
of staff time, experts
is shown in 4.
in Figure customer service
Technical job
staff were
more likely to provide opinions and, unexpectedly, 15% of the time, experts in customer service job
roles did not provide an opinion for customer benefits. However, after excluding the ‘do not know’
responses, the levels of agreement were consistent across benefits regardless of the job role.Figure 3. Within each beneficiary group (y-axis), depending on the level of the experts’ years of industry
experience (inner y-axis): the relative percentage response (x-axis) for each agreement level (coloured)
Water 2020, 12, 1436 8 of 21
The level of agreement scores by the job role of staff is shown in Figure 4. Technical staff were
more likely to provide opinions and, unexpectedly, 15% of the time, experts in customer service job
roles did
roles not
did provide
not provideanan
opinion forfor
opinion customer
customerbenefits.
benefits.However,
However,after
afterexcluding
excludingthe
the‘do
‘donot
notknow’
know’
responses, the levels of agreement were consistent across benefits regardless of the job role.
responses, the levels of agreement were consistent across benefits regardless of the job role.
Figure 4. Within each beneficiary group (y-axis), depending on the type of the experts’ job roles (inner
y-axis):
Figure the relative
4. Within percentage response
each beneficiary (x-axis)
group (y-axis), for each agreement
depending level
on the type (colour).
of the experts’ job roles (inner y-
axis): the relative percentage response (x-axis) for each agreement level (colour).
A general observation from the preceding graphs is that the level of agreement is increased
with previous
A generaldigital metering
observation experience
from or years
the preceding in theisindustry.
graphs The graph
that the level for job role
of agreement shows that
is increased with
technical staff appear more aware of the benefits of DWM than customer service
previous digital metering experience or years in the industry. The graph for job role showsstaff, whereas staff in
that
other areas are least aware. It is notable that the business benefits consistently achieve a
technical staff appear more aware of the benefits of DWM than customer service staff, whereas staff higher level of
acceptance than customer
in other areas benefits.
are least aware. It is notable that the business benefits consistently achieve a higher
A summary of responses for eachbenefits.
level of acceptance than customer benefit, including reasons given for disagreeing with the benefits,
and theAfrequency
summaryofof scores for each
responses forof each
the benefits
benefit,for the thematic
including analysis
reasons givenarefor
listed in Sectionswith
disagreeing 2 andthe
3 of Supplementary Material A respectively.
benefits, and the frequency of scores for each of the benefits for the thematic analysis are listed in
Section 2 and Section 3 of Supplementary Material A respectively.
3.3. Benefit Quantification and Model Development
Having qualified the level of agreement among the experts, the study proceeded to quantify the
extent of the value of each benefit to operationalise those qualitative findings into a quantitative model.
3.3.1. Initial Analysis
The second thematic analysis of responses looked to identify the extent of the benefit “value”.
This analysis was limited to those responses with a positive level of agreement (ie. levels other than
“do not know” or “disagree”). The extent of benefit was indicated by numbers, or by words and
phrases such “substantial”, “significant”, “small”, “marginal”, and “negligible”. Forty-six (6%) of
the 806 responses were quantified by a number, over half, 461 (57%), were quantified by the phrase,
but 299 (37%) were neither quantified by number or phrase. Codes for the experts’ assessments of the
extent of the benefit “value” grouped into five themes: substantial, significant, reduce (or improve),
marginal and negligible. Table 5 lists a sample of codes categorized into themes [71,72] and a Likert
style scoring that was applied to these themes.Water 2020, 12, 1436 9 of 21
Table 5. Coding keywords of benefit value scoring from expert assessments.
Theme
Benefit Value Score Sample of Codes
(Meaning)
Substantial, Reduce substantially, Reduce dramatically, Up to 100%, Up
5 Reduce/improve Substantially
to 3 mths of leak, Should disappear, No readers no incidents, Eliminate
Significant reduction, Vastly improve, Reduce by nearly 90%, Reduce
significantly 70%, Rapid engagement, Rich data, Faster identify, Easier
4 Reduce/improve Significantly
identification, Early resolution, Far less, Highly satisfied, Contribute
largely
Reduce, Improve, Less, Gain, Useful, Tailored, Reduce unrecorded,
3 Reduce/improve Much easier, Not major, Not drastic, Not large, More accurate,
Measurable, Better, Assist responsiveness, Delay a few years, Help
Marginal, Reduce slightly, Small, Very low, Reduce some, Not big, Add
2 Reduce/improve Marginal
little,
1 Reduce/improve Negligible Negligible
Where a descriptive word/phrase was not provided but a numeric benefit value was, the descriptive
word was taken from the question (eg. reduce, improve) and this was then qualified by the benefit value,
Water 2020,. 12,
e.g., Q:“ . . xreduce . . . REVIEW
FOR PEER ?” A: “Yes—60%” Interpreted as “Reduce 60%”. Benefit values ranged10from of 23
near 0% to near 100%. The wide range of values indicated in the expert assessments (see Figures 5
leaky
and 6)network
lead to an infrastructure
examinationand/or water theft).
of the business Furthermore,
context if used in modelling, this information
of each benefit.
would need to be tailored to local conditions.
Figure 5.5.Cost
Figure Costof of
water benefits,
water phrase
benefits, used toused
phrase describe %-benefit%-benefit
to describe value (y-axis) in expert
value (y-axis)assessments,
in expert
shown as high-low ranges (rectangles), against the expected %-benefit value,
assessments, shown as high-low ranges (rectangles), against the expected %-benefit value,i.e., savings
i.e., (x-axis).
savings
These are arranged in ascending order of value (top to bottom), annotated with the relevant
(x-axis). These are arranged in ascending order of value (top to bottom), annotated with the relevant benefit
question (brackets, y-axis), as well as indicative trend lines (red dotted line) with flex points
benefit question (brackets, y-axis), as well as indicative trend lines (red dotted line) with flex pointsadded to
aid description.
added to aid description.Water 2020, 12, 1436 10 of 21
Water 2020, 12, x FOR PEER REVIEW 11 of 23
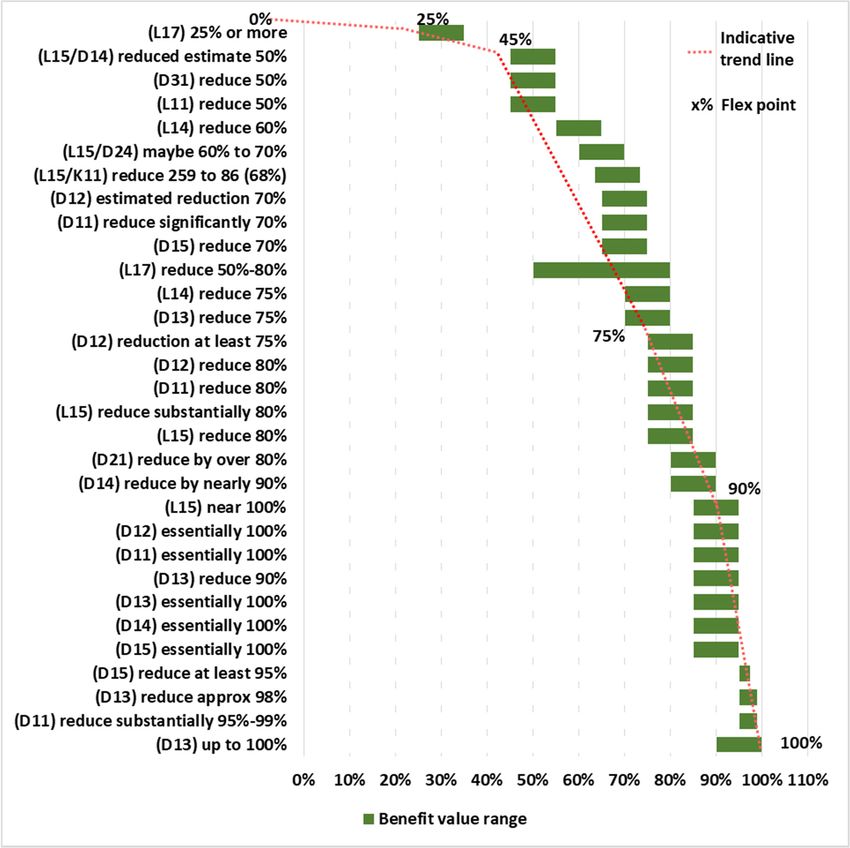
Figure 6.
Figure Charges and
6. Charges and operational
operational costs
costs benefits:
benefits: the
the phrase
phrase used
used to
to describe
describe %-benefit
%-benefit value
value (y-axis)
(y-axis)
in expert assessments, shown as high–low ranges (rectangles), against the expected %-benefit
in expert assessments, shown as high–low ranges (rectangles), against the expected %-benefit value value i.e.,
savings (x-axis). Same annotations as in Figure 5.
i.e., savings (x-axis). Same annotations as in Figure 5.
3.3.2. Examination of Benefit Value Assessments
In Figure 5 and Figure 6, trend lines shown on the graph are illustrative only. The x-axis labels
showThe the forty-six responses
extent of benefit valuethat includedin
nominated both
the descriptive word/phrase
experts’ assessment and questions.
to benefit value, provided the
The y-axis
bridge show
labels betweenthe qualitative
benefit value to quantitative
phrase usedanalysis, and were
in the experts’ the foundation
assessment to thefor quantifying
assessed the
question
ranges of benefit
(indicated value. The
by the question code encoded values
in brackets from of the
benefits
survey appeared
questions toinhave two3distinctly
Section different
of Supplementary
patterns—low
Material A). Many rate (less thanquantified
experts 5% and uptheir
to 25%) and a high
assessments of rate (between
benefits 25% and
as ranges, 100%)
so all (see Figures
quantified values5
and 6).interpreted
were The benefits as in each
both pattern were
indicative, ratheridentified as beingand
than absolute, for two distinctrather
as ranges, contexts.
thanThe “low”
single rate
values.
was common
The rules for the
for this 15 benefitswere:
interpretation related to the cost of water to the business or customer. The “high”
•rate was common
A single numberfor the
was 31converted
benefits related to charges
to a range and operational
by adding costs. 5%
and subtracting Threefromhigh
thewater saving
nominated
estimates
valueamong
(less was theadded
46 expert assessments
or subtracted when were
the noted.
numberThese were
was near thevalue estimates provided
extremes—100% and 0%).by
experts of (L15)
(e.g., a regional
reduce water
80%utility with low
interpreted direct
to 75% experience of digital metering. Such estimates are
to 85%)
•
well above reported
Where a range was ranges of 3–8%
indicated by (percentile
phrase, but 10–90%) [40]. High
not specifically expectations
provided, 10% was may be valid
added for
or taken
particular
from thesituations (e.g.,provided.
limit value an existing Forhigh non-revenue
example, “25% orwater
more”(NRW) rate due toas
was interpreted ageing
25–35%,and“up
leaky
to
network infrastructure and/or water theft). Furthermore, if used in modelling,
100%” was interpreted as 90–100%. When the nominated number was 10% or under, or 90% or this information would
needover
to behalf
tailored to local
the value conditions.
to the limit was added or subtracted
(e.g., (D15) reduce at least 95% interpreted as 95% to 97.5%)Water 2020, 12, 1436 11 of 21
In Figures 5 and 6, trend lines shown on the graph are illustrative only. The x-axis labels show the
extent of benefit value nominated in the experts’ assessment to benefit questions. The y-axis labels
show the benefit value phrase used in the experts’ assessment to the assessed question (indicated by
the question code in brackets from the survey questions in Section 3 of Supplementary Material A).
Many experts quantified their assessments of benefits as ranges, so all quantified values were interpreted
as both indicative, rather than absolute, and as ranges, rather than single values. The rules for this
interpretation were:
• A single number was converted to a range by adding and subtracting 5% from the nominated
value (less was added or subtracted when the number was near the extremes—100% and 0%).
(e.g., (L15) reduce 80% interpreted to 75% to 85%)
• Where a range was indicated by phrase, but not specifically provided, 10% was added or taken
from the limit value provided. For example, “25% or more” was interpreted as 25–35%, “up to
100%” was interpreted as 90–100%. When the nominated number was 10% or under, or 90% or
over half the value to the limit was added or subtracted (e.g., (D15) reduce at least 95% interpreted
as 95% to 97.5%)
The frequency of scores for each of the benefits for the second thematic analysis is listed in Section
3 of Supplementary Material A.
3.3.3. Quantification of Benefit Value
Ranges of benefit value for percentage savings were assigned to the five themes using the flex
points on the trend lines in Figures 5 and 6 as the bounds of each range (see Table 6). While this was
done for both contexts it should be noted that there was scant data for the low ends of both contexts, so
assumptions have been made by the researchers for the ranges of Negligible and Marginal benefits.
Table 6. Percentage benefit value ranges for themes by context.
Context: Cost of Water Charges/Operational Costs
Theme (Score) Start Pct (%) End Pct (%) Start Pct (%) End Pct (%)
Disagree (no benefit, 0) 0 0 0 0
Reduce/improve Negligible (1) 0Water 2020, 12, 1436 12 of 21
The surrogate method was adopted as use of mode biased the frequencies due to the number of
responses involved, and the proportionate method had no impact on the relative frequencies. The use
of the Agreement Level score was considered a suitable surrogate as it included a level of enthusiasm
as part of the agreement. That is, weak agreement (1) could be equated to negligible benefit value
(1), etc. Assessments with the fourth agreement level group, strong agreement, were distributed to
benefit levels 4 and 5 proportionately based on the overall levels of benefit levels 4 and 5. The confusion
matrix (see Table 7) shows the number of responses by agreement level for each of the benefit value
levels with benefit levels 4 and 5 grouped to enable comparison to the highest agreement level, 4.
Table 7. Number of benefit value scores by agreement level scores for quantified answers.
Agreement Level Score
Context: Cost of Water 1 2 3 4
4/5 1 0 1 43 3
3 12 14 126 4
Benefit Value Score 2 11 4 18 1
1 1 1 0 0
Context: Charges/Operational Costs
4/5 1 0 5 86 2
3 12 14 115 7
Benefit Value Score
2 0 6 19 0
1 0 2 0 0
1 Benefit Value levels 4 and 5 have been grouped together for this analysis so as to equate to Agreement Level 4.
Empirical distributions of the scores were transformed into relative frequency probability
distributions [79,80] for the benefit modelling themes and combined with the benefit value ranges for
use in stochastic modelling. Table 8 provides a transformation of the frequency distributions to the
benefit value ranges, for each theme, for the benefits of the cost of water context. The ranges are based
on the flex points on the trend lines. Column 4 provides the raw sfrequencies for the themes. Column 5
includes both raw and imputed values for each theme. Column 6 is the cumulative frequencies and
column 7 is the relative cumutaive frequncy (%). Table 9 provides the transformation, for each theme,
for the benefits of the charges/operational costs context. The column definitions in Table 9 match the
columns definitions in Table 8.
Table 8. Qualitative-to-quantitative transformation of benefit value—cost of water.
Context: Cost of Water Number Answers Relative.
Number Including Cumulative
Start of End of Scoring This Benefit Cumulative
Benefit Value Theme Imputed Score 2 Frequency
Range % Range % Value Frequency
Disagree (no benefit) 3 0 0 24 24 24 5
Negligible 0Water 2020, 12, 1436 13 of 21
Table 9. Qualitative-to-quantitative transformation of benefit value—charges/operational costs.
Context: Charges/Operational Costs Number Answers Number Including Cumulative Relative. Cumulative
Benefit Value Start of End of Scoring This Benefit Imputed Score 2 Frequency Frequency
Theme Range % Range % Value
Disagree (no
0 0 40 40 40 10
benefit) 3
Negligible 0without any quantified values being provided in the answers of the benefits for these phrases. 2 The
299 answers that were not quantified by number or phrase have been given a default Benefit Value
score equivalent to the Agreement level score (see discussion above). 3. The number of participants
that disagreed with benefits within the Context is included as they represent views of achieving no
Water benefit
2020, 12,(i.e.,
14360%). 14 of 21
Based on the quantification table (see Table 9), a transformation from the cumulative frequency
of expected %-benefit
The cumulative valuechart
frequency for the charges/operational
is shown costs
(see Figure 10). context
Based has
on the been developed
cumulative (see Figure
frequency, 10% of
9). The cumulative
experts would scorefrequency
a benefitchart is shown
of 0%, (see
another 2%Figure
(>10, 10). Based
10,Water 2020, 12, 1436 15 of 21
was used on a set of hypothetical costs for a mid-sized water utility (500,000 customers) created by the
researchers from published reports of water utilities, regulators and advocates. The type of output
from such a model, in the form of a range of possible total benefit values that could be estimated for a
single year for 50,000 simulations, is illustrated in Figure 11. Excel formulas could be used to aggregate
theWater
individual outcomes of each benefit to determine the total cost savings.
2020, 12, x FOR PEER REVIEW 17 of 23
Figure
Figure 11.11. Indication
Indication of how
of how benefit
benefit values
values cancan be used,
be used, as input
as input to Monte
to Monte Carlo
Carlo simulations
simulations (histogram,
(histogram, red
red bars) to show relative frequency (y-axis) of total benefit value (AUD$ millions, x-axis) based on
bars) to show relative frequency (y-axis) of total benefit value (AUD$ millions, x-axis) based on hypothetical
hypothetical annual operating costs and @Risk v7.6, 50,000 iterations. (Results are illustrative only and
annual operating
included costs
to show and @Risk
potential v7.6, 50,000 iterations. (Results are illustrative only and included to show
outputs).
potential outputs).
Using such an approach (e.g., Figure 11), a model running against a set of hypothetical annual
operating costs returned a near bell-like distribution of possible outcomes with a median (50% quantile)
4. Limitations
value of $13.3 M savings per annum. There could be a 95% probability of achieving at least $8.1 M pa
While the experts’ structured interviews had a relatively low number of participants (N=52) they
and a 5% probability of achieving in excess of $17.4 M pa. Further development of such a model will
were drawn from water utilities that covered city, urban and regional areas of Australia plus other
be detailed
industry in a future
experts, andpaper
were which will specify
representative all the functions
of business inputs to of
thewater
model and include: annual costs
businesses.
for every kind of benefit, use of the distributions and the calculation formulas.
Recruitment of experts within water authorities was undertaken by the liaison officers within
the water authority. While this appears to have been generally successful, it is not known if other
4. Limitations
expert staff might also have been available to complete the survey.
Thethe
While useexperts’
of an online surveyinterviews
structured to collect the
hadopinions meant
a relatively lowthat participants
number needed(N
of participants = 52) they
a common
level
were of understanding
drawn of whatthat
from water utilities they were being
covered askedand
city, urban to pass an opinion,
regional areas of since thereplus
Australia was other
no
interaction with the interviewer. The ‘background’ notes that accompanied
industry experts, and were representative of business functions of water businesses. each benefit question
were intended to
Recruitment of provide sufficient
experts within detail
water to establish
authorities wasa common
undertaken understanding.
by the liaisonThis may not
officers havethe
within
always
water been achieved
authority. While thisas appears
five answers to been
to have the question
generally of successful,
reduced claims by known
it is not customers for water
if other expert
damage from concealed leaks and theft from behind
staff might also have been available to complete the survey. the meter (question number 62 (L18)) referred
toThe
claims
useagainst the water
of an online surveyutility (question
to collect the number
opinions11meant
(E19)).that participants needed a common level
As the benefit questions invited open commentary through free text responses, the answers
of understanding of what they were being asked to pass an opinion, since there was no interaction
required interpretation to synthesise into consistent outcomes. Where answers included terms like
with the interviewer. The ‘background’ notes that accompanied each benefit question were intended
“as above”, care has been taken to identify the answer being referred to. Additionally, the answers
to provide sufficient detail to establish a common understanding. This may not have always been
reflect each individual’s use of language and expressiveness.
achieved as five answers to the question of reduced claims by customers for water damage from
Forty of the benefits were identified as impacting customers (some shared with the water
business). There has not been any attempt in the structured interviews to collect customer opinions
on the benefits and the value of these benefits to them. At this stage, the only value of these benefits
is the view of the expert participants. The demonstration benefit modelling tool has not attempted to
model any of the customer only benefits. Results shown are based on the hypothetical set of annual
operating costs for a water utility’s business and shared benefits only.Water 2020, 12, 1436 16 of 21
concealed leaks and theft from behind the meter (question number 62 (L18)) referred to claims against
the water utility (question number 11 (E19)).
As the benefit questions invited open commentary through free text responses, the answers
required interpretation to synthesise into consistent outcomes. Where answers included terms like “as
above”, care has been taken to identify the answer being referred to. Additionally, the answers reflect
each individual’s use of language and expressiveness.
Forty of the benefits were identified as impacting customers (some shared with the water business).
There has not been any attempt in the structured interviews to collect customer opinions on the benefits
and the value of these benefits to them. At this stage, the only value of these benefits is the view of the
expert participants. The demonstration benefit modelling tool has not attempted to model any of the
customer only benefits. Results shown are based on the hypothetical set of annual operating costs for a
water utility’s business and shared benefits only.
5. Discussion
The benefits of DWM put forward in the structured interviews were predominantly agreed with
or strongly agreed with by the participants. Overall, 67.5% agreed or strongly agreed with the benefits
proposed, another 14.5% offered muted agreement while only 6% disagreed and 12% offered no opinion.
The authors’ previous literature review [41] identified sources of benefits of DWM, including the
outcomes of academic research and reviews, which collectively reflect this strong level of support.
Water savings and operational savings expressed by the experts were consistent with findings by
researchers and practitioners in Australia [5,40] and overseas [6].
The benefits to water utilities were better understood than benefits to customers. This suggests
that water utilities should put more focus on the customer and how they might benefit, that is, become
more customer-centric [81]. This might be achieved by inviting greater involvement of customer-facing
and back-office staff in discussions and workshops on the impact of digital water meters. Similarly,
and while the participants were considered experts, the number of “don’t know” and “don’t agree”
comments suggests that more work needs to be done internally to bring all staff into discussions and
workshops to canvass the opportunities and to reach consensus. Academics and vendors of DWM
solutions have a role to play in this by promoting their studies and success stories [82] to water utilities
while also documenting any issues encountered, less favourable outcomes and mitigating actions.
In a business environment, at least in Australia, where the negative sentiment towards electricity
smart meters dominates customer perceptions, the ability to promote the innovation would be enhanced
if the customer benefits were well understood and articulated. Victoria’s water Ombudsman is of
the opinion that water companies need to take the initiative to collect and promote the many success
stories coming out of DWM trials [29].
Three benefits stood out for the mixed or qualified responses that they received.
• Call Centre impact—rather than an expected decrease in calls as suggested by the benefit questions,
many participants expected calls to actually increase, due to increased information and questions
raised in the minds of customers as to what the information meant.
• Meter reading costs—many participants were skeptical that the meter reading cost-savings could
be achieved and mention the new costs of data communication, collection and storage.
• Failing meter detection—the operating life of batteries was often noted as a limiting factor when
considering the extended life of meters and meter failure detection.
The issues raised for these three benefits might be the subject of short studies to determine the
actual situation or, for battery life, mitigating strategies.
The model developed in this study has been based around the digital metering taxonomy.
The taxonomy provides generalised categories of benefits and is sufficiently flexible in design to allow
for benefit items to be included or removed depending on the business operations of the water utilityWater 2020, 12, 1436 17 of 21
and their corporate goals. Such a modelling tool has the potential to be applied to metering within
other industries such as energy [83].
6. Conclusions
This study has focused on the benefit likelihood and value of DWM. It has not considered the cost
of implementing changes to achieve the benefits as these are considered subject to advances in AMI
technologies, implementation strategies, contract negotiations and purchasing rules within individual
water utilities.
Expert opinions have been collected to verify and quantify the benefits identified in the preceding
literature review of DWM. In doing so the study identified two distinct probability distributions
covering the expected value of benefits in two contexts: cost of water, charges/operational costs.
Empirical distributions formed through thematic analysis and quantification of expert opinions have
been transformed into probability distributions. A benefit value modeling tool could be developed in
order to make use of these distributions. Here we provide an indication of the kind of results that could
be obtained. If such a tool were used to run models, using a hypothetical set of annual operating costs.
to simulate DWM benefits and it could provide stochastic outcomes for possible use in business cases.
Further studies seeking empirical evidence of benefits considered intangible is warranted to add
further to business cases. Forty of the benefits (over half) relate to customer satisfaction and, while the
experts generally agreed with the benefits, the opinions of customers themselves should be considered.
Future work by the researchers will present the results of a study of the possible impact on customer
satisfaction resulting from the change to DWM [84].
Further development of a modelling tool such as is described here, and used to illustrate how cost
savings analysis can be conducted from expert opinion, will be presented in a future paper.
Supplementary Materials: Supplementary Material A provides a detailed summary of the range of opinions
provided by the experts for each of the 75 benefits, the quantified views of both likelihood and benefit value,
and an extended profiling of each respondent. Supplementary Material B provides a copy of the survey instrument.
The following are available online at http://www.mdpi.com/2073-4441/12/5/1436/s1, Water-773749 Supplementary
Material A.docx: Detailed Summary of Opinions, Frequency Distributions and Expert Profiles; Water 773749
Supplementary Material B.docx: Experts Survey Instrument.
Author Contributions: Conceptualization, I.M., R.A.S., O.S. and R.K.; methodology, I.M., R.A.S., O.S., R.K.
and S.L.C.; software, I.M.; validation, I.M.; formal analysis, I.M. and S.L.C.; investigation, I.M.; data curation,
I.M.; writing—original draft preparation, I.M.; writing—review and editing, I.M., R.A.S., O.S., R.K. and S.L.C.;
visualization, I.M., and S.L.C.; supervision, R.A.S., O.S. and R.K. All authors have read and agreed to the published
version of the manuscript.
Funding: This research received no external funding.
Acknowledgments: The authors wish to thank the many organisations and participants who gave their time
freely to respond to the rather lengthy structured interviews and for sharing their experiences, concerns and
opinions. Special thanks to those water company staff who assisted with the development and fine-tuning of the
interview questions and structure and to the study liaison officers who recruited staff within their organisations.
Conflicts of Interest: The authors declare no conflict of interest.
References
1. Anonymous. Technology flows into water meter reading. Water Eng. Manag. 1994, 141, 2.
2. Schlenger, D. Meter management: Best practices for water utilities. Water Eng. Manag. 1997, 144, 3.
3. Hastreiter, J. City cuts costs, improves accuracy with radio frequency meter reading. Water Eng. Manag. 1997,
144, 33–35.
4. Hastreiter, J. AMR expands across the country. Water Eng. Manag. 1999, 148, 5.
5. Taggle Systems P/L. Mackay Regional Council Helping Residents Save on Water Bills. 2016. Available online:
https://taggle.com/mrc/ (accessed on 6 July 2018).
6. Thiemann, R.; Haas, J.; Schlenger, D. Reaping the benefits of AMI: A kansas city case study. Am. Water Work.
Assoc. J. 2011, 103, 38–41. [CrossRef]Water 2020, 12, 1436 18 of 21
7. City of Lincoln Nebraska. Automated Water Meter Reading Improves Efficiency, Accuracy, Safety. 4 March
2008. Available online: http://lincoln.ne.gov/city/mayor/media/2008/030408a.htm (accessed on 15 July 2018).
8. Consultant‘s Corner Journal AWWA. Detroit selects Itron‘s water fixed network solution. J. Am. Water Work.
Assoc. 2007, 99, 53. [CrossRef]
9. IBM. District of Columbia Water & Sewer Authority to Automate Water and Sewer System and Create Business
Intelligence Systems, with Help from IBM 2009; IBM: Armonk, NY, USA, 2009; Available online: https:
//www-03.ibm.com/press/us/en/pressrelease/28859.wss (accessed on 3 October 2018).
10. March, H.; Morote, Á.-F.; Rico, A.-M.; Saurí, D. Household smartwater metering in Spain: Insights from the
experience of remote meter reading in alicante. Sustainability 2017, 9, 582. [CrossRef]
11. Boyle, T.; Giurco, D.; Mukheibir, P.; Liu, A.; Moy, C.; White, S.; Stewart, R. Intelligent metering for urban
water: A review. Water 2013, 5, 1052–1081. [CrossRef]
12. Beal, C.; Flynn, J. The 2014 review of smart metering and intelligent water networks in Australia & New
Zealand. In 2014, Report Prepared for WSAA by the Smart Water Research Centre; Griffith University: Gravatt,
Australia, 2014.
13. Nguyen, K.A.; Stewart, R.A.; Zhang, H.; Sahina, O.; Siriwardene, N. Re-engineering traditional urban water
management practices with smart metering and informatics. Environ. Model. Softw. 2018, 101, 256–267.
[CrossRef]
14. Britton, T.C.; Stewart, R.A.; O’Halloran, K.R. Smart metering enabler for rapid and effective post meter
leakage identification and water loss management. J. Clean. Prod. 2013, 54, 166–176. [CrossRef]
15. Gurung, T.R.; Stewart, R.A.; Sharma, A.K.; Beal, C.D. Smart meters for enhanced water supply network
modelling and infrastructure planning. Resour. Conserv. Recycl. 2014, 90, 34–50. [CrossRef]
16. Warren, C.; Becken, S.; Nguyen, K.; Stewart, R.A. Transitioning to smart sustainable tourist accommodation:
Service innovation results. J. Clean. Prod. 2018, 201, 599–608. [CrossRef]
17. NBN News. Narrabri Gets Tech Savvy with Water Meter Systems. 12 April 2018. Available online:
http://www.nbnnews.com.au/2018/04/12/narrabri-gets-tech-savvy-with-water-meter-systems/ (accessed on
21 June 2019).
18. Taggle Systems P/L. Taggle Blog. 2019. Available online: https://taggle.com.au/blog/ (accessed on
21 June 2019).
19. TasWater. Water Meter Renewal Program. 2018. Available online: https://www.taswater.com.au/News/
TasWater-News/Water-meter-renewal-program (accessed on 17 January 2019).
20. Coliban Water. Frequently Asked Questions Digital Meters Program Stage 1—February 2018; Coliban Water:
Bendigo, VIC, Australia, 2018; Available online: https://coliban.com.au/site/root/projects/documents/
ColibanWaterDigitalMetersFAQ.pdf (accessed on 3 March 2018).
21. Sydney Water. Water Meters Policy. 2018. Available online: https://www.sydneywater.com.au/web/groups/
publicwebcontent/documents/document/zgrf/mdq3/~{}edisp/dd_047498.pdf (accessed on 26 December 2018).
22. City West Water. 2018 Water Price Review City West Water Price Submission 2017-09-28.
2017. Available online: https://www.citywestwater.com.au/about_us/reports_publications/2018_pricing_
submission (accessed on 29 June 2018).
23. Digital Metering Trial. Internal Report (Author and Company details withheld). Unpublished. 2016.
24. Digital Metering Progress; Interviewed by author (I.M.): Melbourne, VIC, Australia, 22 June 2018.
25. Consumer Action Law Centre. Consumer Action Law Centre (1) Barwon Water; Consumer Action Law Centre:
Melbourne, Australia, 2017. Available online: https://www.esc.vic.gov.au/water/water-prices-tariffs-and-
special-drainage/water-price-reviews/water-price-review-2018#tabs-container2 (accessed on 22 June 2018).
26. Essential Services Commission. Water Price Reviews 2018. (Home page to 2018 Price Submissions and
Determinations for all 16 water authorities in Victoria, Australia). Available online: https://www.esc.vic.gov.
au/water/water-prices-tariffs-and-special-drainage/water-price-reviews/water-price-review-2018 (accessed
on 22 June 2018).
27. Johnston, M. Victorian electricity meters would need to be changed under new rules. In Sunday Herald Sun.
April 7, 2018; News Limited: Sydney, Australia, 2018.
28. Energy and Water Ombudsman (Victoria) Ltd. Final Solar and Smart Meter Report. 2016. Available online:
https://www.ewov.com.au/files/solar-and-smart-meter-report-july-2016.pdf (accessed on 18 July 2018).
29. Gebert, C. Energy & Water Ombudsman (Victoria), Impact of Billing Disputes; Interviewed by Author (I.M.):
Melbourne, Australia, 2018.You can also read