IMPROVING THE RESILIENCE OF EXISTING HOUSING TO SEVERE WIND EVENTS
←
→
Page content transcription
If your browser does not render page correctly, please read the page content below
IMPROVING THE RESILIENCE OF
EXISTING HOUSING TO SEVERE WIND
EVENTS
Final project report

John Ginger1,3, Korah Parackal1,3, David Henderson1,3, Martin Wehner2,3,
Hyeuk Ryu2,3 & Mark Edwards2,3
1 Cyclone Testing Station, James Cook University
2 Geoscience Australia
3 Bushfire and Natural Hazards CRC

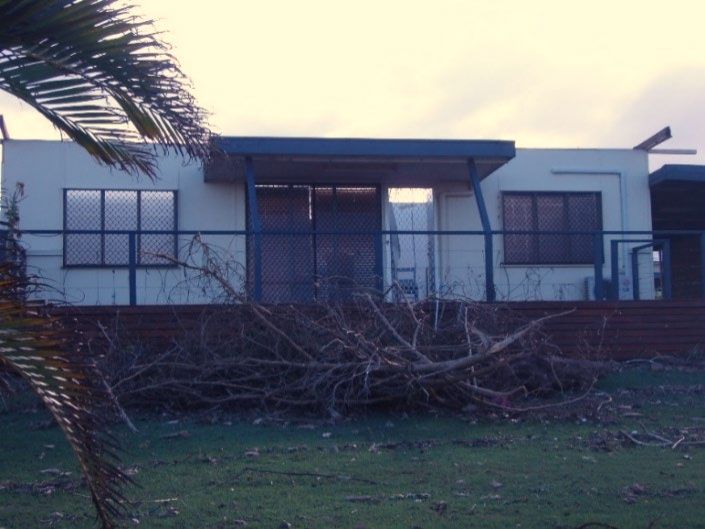
IMPROVING THE RESILIENCE OF EXISTING HOUSING TO SEVERE WIND EVENTS – FINAL PROJECT REPORT | REPORT NO. 656.2021

 Version Release history Date

 1.0 Initial release of document 30/03/2021

 © Bushfire and Natural Hazards CRC 2021

 All material in this document, except as identified below, is licensed under the
 Creative Commons Attribution-Non-Commercial 4.0 International Licence.

 Material not licensed under the Creative Commons licence:
 • Department of Industry, Science, Energy and Resources logo
 • Cooperative Research Centres Program logo
 • Bushfire and Natural Hazards CRC logo
 • All other logos
 • All photographs, graphics and figures

 All content not licenced under the Creative Commons licence is all rights
 reserved. Permission must be sought from the copyright owner to use this
 material.

 Disclaimer:
 James Cook University, Geoscience Australia and the Bushfire and Natural
 Hazards CRC advise that the information contained in this publication comprises
 general statements based on scientific research. The reader is advised and needs
 to be aware that such information may be incomplete or unable to be used in
 any specific situation. No reliance or actions must therefore be made on that
 information without seeking prior expert professional, scientific and technical
 advice. To the extent permitted by law, James Cook University, Geoscience
 Australia and the Bushfire and Natural Hazards CRC (including its employees and
 consultants) exclude all liability to any person for any consequences, including
 but not limited to all losses, damages, costs, expenses and any other
 compensation, arising directly or indirectly from using this publication (in part or in
 whole) and any information or material contained in it.

 Publisher:
 Bushfire and Natural Hazards CRC

 March 2021

 Citation: Ginger J, Parackal K, Henderson D, Wehner M, Ryu H & Edwards M
 (2021) Improving the resilience of existing housing to severe wind events - final
 project report, Bushfire and Natural Hazards CRC, Melbourne.

 Cover: Wind induced damage to a legacy house, TC Yasi.

 1

IMPROVING THE RESILIENCE OF EXISTING HOUSING TO SEVERE WIND EVENTS – FINAL PROJECT REPORT | REPORT NO. 656.2021

TABLE OF CONTENTS
EXECUTIVE SUMMARY 3

END-USER PROJECT IMPACT STATEMENT 5

PRODUCT USER TESTIMONIALS 6

INTRODUCTION 7

KEY MILESTONES 8
Selection of house types 8
VAWS modelling 8
Selection of retrofitting options 8
Benefit-cost analysis 8
Web-based retrofitting guidelines 8

BACKGROUND 9

RESEARCH APPROACH 10
House types 10
Estimation of vulnerability 11
Case study: House type 1 – high-set Australian house 17
Calculation of benefit-cost 23
Costs of retrofitting 23
Benefits and costs other than building repair 24
Calculation of benefit 25

FINDINGS 28

CONCLUSIONS 30

UTILISATION AND IMPACT 31
Summary 31
The Queensland Government Household Resilience Program 31
Vulnerability and Adaption to Wind Simulation (VAWS) 32
Web-based guidelines 33
Queensland Reconstruction Authority cyclone and storm tide resilience building guidelines 36

PUBLICATIONS LIST 38
2019 – 2020 38
2018 – 2019 38
2017 – 2018 39
2015 – 2016 40
2014 – 2015 41

TEAM MEMBERS 42
Research team 42
End-users and stakeholders 42

REFERENCES 44

APPENDIX A: GENERIC HOUSE TYPES 45

APPENDIX B: RETROFIT OPTIONS AND COSTS 48

APPENDIX C: BENEFIT-COST 50

 2
IMPROVING THE RESILIENCE OF EXISTING HOUSING TO SEVERE WIND EVENTS – FINAL PROJECT REPORT | REPORT NO. 656.2021

EXECUTIVE SUMMARY
This BNHCRC project titled: Improving the resilience of existing housing to severe
wind events prescribes practical structural retrofits that will make improvements
to the performance of Pre-80s (Legacy) houses in windstorms as well as measures
to reduce damage and loss to contemporary houses.
Damage investigations carried out by the Cyclone Testing Station (CTS) following
severe windstorms have typically shown that houses built prior to the mid-1980s
in Australia perform worse than houses constructed to contemporary building
standards, during windstorms. Given that these older houses are a significant
proportion of the housing stock, practical structural upgrading based on the
latest research may improve performance of housing and the economic and
social wellbeing of a community.
Some details for structural retrofitting currently exist, but their uptake is limited,
and there is also evidence that these are not carried out when houses require
repairs following severe storms. Therefore, the issues of retrofitting legacy housing,
including feasibility and benefit-cost are analysed in this project.
The primary objective of this study was to identify vulnerable legacy house types
across Australia and develop cost-effective retrofits for mitigating damage
during windstorms. These evidence-based strategies will (a) aid policy
formulation and decision making by Government and industry, and (b) provide
guidelines detailing various options and benefits to homeowners and the industry
for retrofitting typical at-risk houses in Australia. The main aims were to:
 • Categorise houses into types based on building features that influence
 windstorm vulnerability using Geoscience Australia and CTS survey data.
 Following this, define a suite of ten (10) typical, representative house types
 across cyclonic and non-cyclonic regions of Australia.
 • Develop the software VAWS (available at
 https://github.com/GeoscienceAustralia/vaws) to quantify the
 vulnerability of the houses before and after retrofits. Define a series of
 practical retrofit options for each house type and quantify the benefit-
 cost ratio of each option. Validate these outputs from available data and
 empirical/expert opinion.
 • Produce Internet-based guidelines (www.weatherthestorm.com.au) and
 enable utilisation by involving end-users and stakeholders (i.e.
 homeowners, builders, regulators, insurers).
This report presents an overview of the research approach used for this project
including the selection of house types, the development of the VAWS software
and the Internet-based guidelines. A case study is presented of the vulnerability
and benefit cost assessment of one of the selected house types, with the
complete set of results presented in the Appendices. These results show that tile
roofed houses in cyclonic regions of Australia benefit the most from retrofitting
for severe wind events. The benefit-cost ratios for these tile roof houses and other
house types are expected to improve when accounting for intangible costs,
which are currently not included in the analyses presented in this report. In

 3
IMPROVING THE RESILIENCE OF EXISTING HOUSING TO SEVERE WIND EVENTS – FINAL PROJECT REPORT | REPORT NO. 656.2021

addition, examples of the impacts and utilisation of this project including the
Queensland Government Housing Resilience Program are also presented.

 4

IMPROVING THE RESILIENCE OF EXISTING HOUSING TO SEVERE WIND EVENTS – FINAL PROJECT REPORT | REPORT NO. 656.2021

END-USER PROJECT IMPACT STATEMENT
Leesa Carson, Community Safety Branch, Geoscience Australia, ACT
Year after year Australia has witnessed the damage that severe wind, in
particular cyclones, can do to houses and consequently people's wellbeing and
livelihoods. Post-event surveys undertaken by James Cook University and
Geoscience Australia and analysis of insurance losses have established the
significant contribution that wind-induced damage to pre-modern code legacy
housing makes to the total losses.
This project has sought to provide an evidence base to inform future mitigation
work to reduce the contribution that legacy housing makes to the nation's
natural disaster repair bill and improve the lives of their inhabitants. This aligns with
the aims of the National Disaster Risk Reduction Framework. The project has
developed guidance information, contained in a publicly available website, to
inform people of the steps required to retrofit a house together with typical
details of the kind of work required. Furthermore, the project has examined the
benefit-cost of undertaking such work and identified that the return on
investment is sensitive to the cost of undertaking the retrofit work. The cost can
be reduced by such factors as:
 • Incentive schemes which subsidise the cost of retrofit;
 • Undertaking the work simultaneously with other work such as roof
 maintenance so that access costs are amortised across two or more
 projects;
 • Undertaking retrofit work as part of a wider retrofit campaign so that
 economies of scale are realised.
The modelled benefit can be increased by incorporating the reduction in
indirect costs, arising from retrofit, such as mental and physical health,
absenteeism, etc. when such costs can be quantitatively estimated.
The project's outputs have been tested with stakeholders either through
workshops or online focus groups. This strong stakeholder engagement has
ensured the project outputs will be of practical use.
It is pleasing to note that the project's outputs will be utilised by a project, led by
Queensland Fire and Emergency Services, to examine the benefit of mitigation
in reducing potential severe wind impact and risk in south-east Queensland.

 5

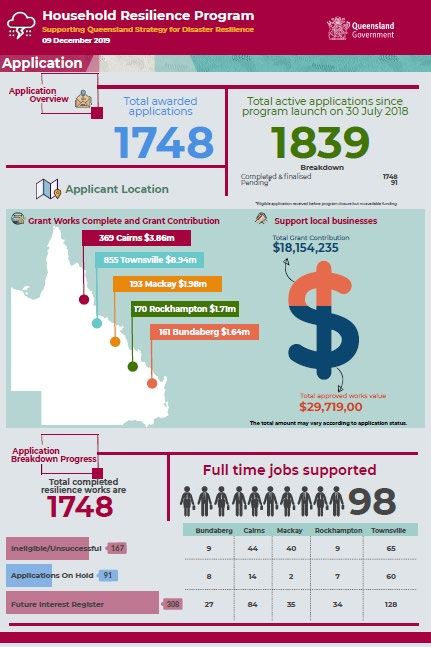
IMPROVING THE RESILIENCE OF EXISTING HOUSING TO SEVERE WIND EVENTS – FINAL PROJECT REPORT | REPORT NO. 656.2021

PRODUCT USER TESTIMONIALS
Lindsay Walker, Director Building and Legislation Policy Division, Queensland Department
of Energy and Public Works, QLD
The groundbreaking work undertaken by JCU – CTS through the BNHCRC project
‘Improving the resilience of existing housing to severe wind events’ continues to
improve our understanding of the dangers posed by cyclones to the built
environment and the practical steps that can be taken to improve the resilience
of new and existing buildings.
The report findings, recommendations and web tools developed through this
project have the potential to provide valuable information to assist government,
industry and the community to understand the options and benefits associated
with improving the resilience of housing.
The user-friendly website builds on the truth that a house “is only as strong as its
weakest point” and identifies critical points in an easy-to-understand way across
a variety of different house designs and provides a range of practical measures
to minimise potential risks.
The fact that these measures are supported by extensive research and on-the-
ground real-life evidence gathered after a number of severe wind events, lends
to the credibility of the project.
Additionally, the development of VAWS to assess the risk of wind-related
damage, including water penetration, to a broader range of building types, has
the potential to identify those buildings most at risk of failure and the most cost-
effective strategies to improve the resilience of these buildings.
Based on feedback from the stakeholder workshops conducted during the
project, the outcomes from the project are expected to be used by many in the
regulatory, engineering/building, education and insurance industries.
There would be a need for the outputs (software, websites etc.) to be updated
and maintained. Additionally, further research and development will enable
more reliable vulnerability and losses to be calculated.
The Household Resilience Program demonstrates the power of combining a clear
pathway for action with the pre-existing awareness of the dangers posed by
cyclone season. Under this program 1,749 Queensland households from
Bundaberg to the Cape were able to negotiate reduced insurance premiums
by an average of $310.
Additional funding for continued research into how to improve the resilience of
the built environment would be of benefit to government regulators, emergency
services and the wider community.

 6
IMPROVING THE RESILIENCE OF EXISTING HOUSING TO SEVERE WIND EVENTS – FINAL PROJECT REPORT | REPORT NO. 656.2021

INTRODUCTION
Post windstorm damage investigations carried out by the Cyclone Testing Station
(CTS) have shown that Pre-80s legacy houses across Australia are vulnerable to
wind damage. This damage is mostly due to design and construction
deficiencies such as poor connection details. These studies also show that wind-
driven rainwater ingress related damage at low to moderate wind speeds is
common across all (including Post-80s) house types.
This project titled, "Improving the resilience of existing housing to severe wind
events" prescribes practical structural retrofit measures that will reduce damage
to houses in windstorms. This project defines a range of broadly classified
common house types across cyclone and non-cyclone regions of Australia, and
their roof and wall components and fixings.
Wind loads acting on these houses and the structural response to these loads are
specified in probabilistic terms to determine their vulnerability. A series of
practical, structural retrofit measures for each of these house types are given,
and their enhanced performance quantified. A Software Package, developed
during this project, called VAWS is used for this analysis. The viability of carrying
out these retrofits are measured by Benefit-Cost ratios.
Web-based guidelines are produced as part of this project's outcomes, allowing
users to gain a basic understanding of the vulnerability of common Australian
house types, and practical structural retrofit measures to improve their
performance.
This report describes the research methods, outputs, impact and utilisation.

 7

IMPROVING THE RESILIENCE OF EXISTING HOUSING TO SEVERE WIND EVENTS – FINAL PROJECT REPORT | REPORT NO. 656.2021

KEY MILESTONES
The following are the key milestones of the project.

SELECTION OF HOUSE TYPES
House types across Australia were compiled from survey data, other databases
and insurance claims data analysis. The structural systems and construction
methods of houses across Australia have been collated. This information and the
NEXIS database were used to define the ten generic house types studied in this
project. In addition, commonly encountered maintenance and construction
shortcomings have been documented.

VAWS MODELLING
The Vulnerability and Adaptation to Wind Simulation (VAWS) software package
for assessing the vulnerability of Australian houses to windstorms was developed
through the duration of the project. This software package forms a significant
part of the project and is used to determine the vulnerability and calculate the
damage index for each house type in the unretrofitted sate and following each
retrofit option.

SELECTION OF RETROFITTING OPTIONS
Practical and cost-effective retrofit options for each house type are developed
to address components of the house structure and envelope that are points of
failure commonly observed in post-windstorm surveys and hence significantly
contribute to a house's vulnerability. These retrofit options are also provided in
the web-based guidelines.

BENEFIT-COST ANALYSIS
The economic benefit of applying each of the specified retrofits to each generic
house type is assessed via a benefit-cost analysis based on the output from the
VAWS software.

WEB-BASED RETROFITTING GUIDELINES
A website that provides some basic information on wind loading and the
structural system of common generic Australian houses has been produced. The
website also presents the benefits of maintenance and retrofitting in reducing
damage to a house during windstorms and describes the nature of possible
connection retrofits.

 8

IMPROVING THE RESILIENCE OF EXISTING HOUSING TO SEVERE WIND EVENTS – FINAL PROJECT REPORT | REPORT NO. 656.2021

BACKGROUND
This project examines the benefit-cost of retrofitting the legacy housing stock in
cyclonic and non-cyclonic regions of Australia to improve their performance
when exposed to severe winds.
Damage investigations carried out by the Cyclone Testing Station (CTS) following
severe wind storms have typically shown that Australian houses built prior to the
mid-1980s do not offer the same level of performance and protection during
windstorms as houses constructed to contemporary building standards
(Henderson, Ginger et al. 2006, Boughton, Henderson et al. 2011, Boughton, Falck
et al. 2017).
Structural retrofitting details exist for some forms of legacy housing, but the
uptake of these options is limited. There is also evidence that retrofitting is not
carried out even when houses require major repairs following severe storm
events, thus missing an opportunity to improve the resilience of the house and
community.
Table 1 shows the proportion of legacy houses (here defined as those built
before1982) and contemporary houses in Australia. In the non-cyclonic regions,
legacy houses represent approximately 42% of the housing stock, whilst in
cyclonic regions, legacy houses comprise approximately 45% of the housing
stock. Hence, there is a significant proportion of the Australian housing stock built
prior to the introduction of contemporary standards in the 1980s that may benefit
from structural retrofitting against severe windstorms.

 Wind regions Pre 1982 (legacy) 1982+ (modern)

 Non Cyclonic A and B 2,977,295 4,121,781

 Cyclonic C and D 164,432 204,317

TABLE 1 NUMBERS OF HOUSES IN AUSTRALIA BY AGE AND WIND REGION EXTRACTED FROM NEXIS (NADIMPALLI, EDWARDS ET AL. 2007)

 9
IMPROVING THE RESILIENCE OF EXISTING HOUSING TO SEVERE WIND EVENTS – FINAL PROJECT REPORT | REPORT NO. 656.2021

RESEARCH APPROACH
The research approach to answering the question "is it worthwhile to retrofit
legacy houses exposed to severe wind" is a four-stage process.
 1. Define a series of typical House Types and their structure that is
 representative of houses commonly found across Australia. Determine
 relevant data for the house types chosen:
 a. Structural systems and strengths of connections, both in the
 unretrofitted house and retrofitted house and,
 b. The magnitudes of wind loads acting on the house envelope.
 2. Using the data developed in Stage 1, model the vulnerability of the
 chosen house types both in the unretrofitted state and with each retrofit
 scenario installed.
 3. From the modelled vulnerability curves, compute the benefit-cost ratio for
 each retrofit scenario for each chosen house type.
Prepare guidelines on retrofitting legacy houses to improve their resilience to
severe wind.

HOUSE TYPES
There is a large variety of house types across Australia. The project has selected
ten generic house types of simple geometry based on surveys from different parts
of Australia, interviews and extraction from databases. The selected house types
are intended to broadly reflect the variety of houses found in the Australian
building stock. Table 2 lists the ten (10) generic house types together with some
descriptive attributes which are also provided in Appendix A, containing
drawings of the overall form and dimensions for each of the generic house types.

 Generic house type Vintage Wall construction Roof material Roof shape

 1 Legacy Fibro (high set) Metal sheeting Gable, low pitch

 2 Modern Reinforced block Metal sheeting Gable, medium pitch

 3 Legacy Double brick Metal sheeting Gable, medium pitch

 4 Legacy Double brick Tile Gable, medium pitch

 5 Legacy Double brick Metal sheeting Hip, medium pitch

 6 Legacy Double brick Tile Hip, medium pitch

 7 Legacy Brick veneer Metal sheeting Gable, medium pitch

 8 Legacy Brick veneer Tile Gable, medium pitch

 9 Legacy Brick veneer Metal sheeting Hip, medium pitch

 10 Legacy Brick veneer Tile Hip, medium pitch

TABLE 2 GENERIC HOUSE TYPES

 10
IMPROVING THE RESILIENCE OF EXISTING HOUSING TO SEVERE WIND EVENTS – FINAL PROJECT REPORT | REPORT NO. 656.2021

ESTIMATION OF VULNERABILITY

In order to estimate the benefit of retrofit, it is necessary to quantitatively model
the vulnerability of the subject house and how the vulnerability changes due to
retrofit. To achieve this, the project developed a software package called
Vulnerability and Adaptation to Wind Simulation (VAWS). The primary output of
the software is a numerical definition (as a series of x, y points) of the modelled
house's mean vulnerability curve.

The VAWS software and accompanying user manual are publically available on
Github (Geoscience Australia 2020).

Vulnerability and Adaptation to Wind Simulation (VAWS) model
Vulnerability and Adaptation to Wind Simulation (VAWS) is a software package
that has been developed to model the vulnerability of small buildings such as
domestic houses and light industrial sheds to wind loading. VAWS uses
probability-based reliability analysis and structural engineering for the loading
and response coupled with an extensive test database and field damage
assessments of component properties to calculate the damage experienced by
the ten Australian house types selected for this project. VAWS is used to estimate
the change in vulnerability afforded by retrofit measures which improve a
building's resilience to windstorms.
VAWS consists of modules for:
 1. Wind hazard – external and internal pressures generated by the
 atmospheric wind.
 2. Structural response – related to the structural system and load effects, and
 strengths of the components and connections.
 3. Costing the repair of damage. The program is able to accommodate
 house types for which the structural system and their response, and the
 external pressure distribution for wind exposure from directions around the
 compass are given.
The critical structural components are probabilistically assigned their strengths,
and the wind loads are applied for winds approaching from a specified
direction. Failure is initiated when the load exceeds the capacity of a critical
component or connection as the wind loads increase with wind speed. When
components fail, loads are redistributed through the structural system. The cost
of repair is calculated for the given level of damage, and the damage index is
calculated at each wind speed increment.
Figure 1 describes the logic of VAWS including the main modules: the house type
and structural system, external and internal pressure distribution, structural
response, initiation and progression of damage, and other effects such as wind-
borne debris impact, water ingress and cost of repair. A case study for a high-set
legacy Australian house (Type 1 as defined in Table 2) is presented to show the
outputs from VAWS, retrofit scenarios and the follow-on calculations for the
benefit-cost of retrofitting.

 11
IMPROVING THE RESILIENCE OF EXISTING HOUSING TO SEVERE WIND EVENTS – FINAL PROJECT REPORT | REPORT NO. 656.2021

 Set up individual house and wind simulation

 Apply wind pressures to building envelope

 Calculate loads at connections and check for failure

 Redistribute loads from failed connections to other connections

 Calculate wall failure based on number of failed roof connections

 Run debris simulation and check for internal pressurisation

 Save Results Calculate water ingress and damage index

 Increase wind speed to next increment

 Set up new model and repeat

FIGURE 1 VULNERABILITY AND ADAPTION TO WIND SIMULATION (VAWS) MODEL LOGIC

The VAWS model applies a component-based approach to modelling
vulnerability, based on the premise that overall building damage is related to the
failure of key connections. The program requires a user-specified building model
for the House Type and assigns values to parameters from probability
distributions. These parameters include structural component spacings,
component and connection strengths, external pressure coefficients, shielding
factors, wind speed profile with height, building orientation, debris damage
parameters, and component masses. Then, for progressive wind speed
increments, it calculates the forces in all critical connections using influence
coefficients, assesses which connections have failed and translates these into a
damage scenario and costs the repair, and calculates a damage index at each
wind speed.
VAWS makes the following simplifications to solve the complex problem of
modelling the structural vulnerability of houses:
 • Damage is related to the failure of connections
 • The contributions of components such as wall linings, cornices, etc. to the
 house's capacity to resist wind loads are accommodated by adjusting the
 strengths of modelled connections,
 • The effects of fatigue are accounted for by adjusting connection strength
 rather than modelling time-varying loads
 • Redistribution of loads in roof cladding and battens occurs independently
 without accounting for the interaction between components or their
 relative stiffnesses

 12
IMPROVING THE RESILIENCE OF EXISTING HOUSING TO SEVERE WIND EVENTS – FINAL PROJECT REPORT | REPORT NO. 656.2021

 • The loads in connections are analysed using influence coefficients.
 Redistribution of loads are modelled by overwriting influence coefficients
 with revised values assuming single failed connections, and
 • The proportion of internal linings and fittings that require repair due to
 wetting from water ingress is related to the degree of envelope damage
 and wind speed.

Key parameters and variability simulation modules
The variabilities in wind loading and component parameters are captured by a
Monte Carlo process. The parameter values are assigned for each realisation of
the modelled house and kept the same, as the wind speed is increased
incrementally up to a set maximum.
 • For each house, its orientation with respect to the approach wind is either
 randomly chosen from the eight cardinal directions or assigned by the
 user.
 • Variation in the gust wind speed profile with height is captured by random
 sampling from a suite of profiles related to the approach terrain category.
 • External pressure coefficients for different zones of the house envelope are
 chosen from a Type III (Weibull) extreme value distribution based on wind
 tunnel model test data for different zones of the house envelope. The
 internal pressures are then derived from the external pressures and the
 openings in the envelope.
 • Wind-borne debris impact on the envelope and the resulting damage is
 simulated by modelling the generation, trajectories and impact of debris
 in VAWS by a dedicated module (Holmes, Wehner et al. 2010, Wehner,
 Sandland et al. 2010).
 • Connection strengths and dead loads for each realisation are sampled
 from log-normal probability distributions specified by the user.
Water ingress is estimated to account for the repair costs associated with water
damage to internal linings. Predefined relationships for the extent of water
damage as a function of the extent of damage to the house envelope and of
wind speed are applied.

Roof damage and load redistribution

The VAWS program accounts for load redistribution and progressive failures of
the roof structure by using structural analysis methods with several simplifying
assumptions. Connections considered in the analysis include: cladding fasteners,
batten to rafter connections and rafter to top plate connections. The program
relates pressures applied on envelope zones to the loads on cladding
connections and the supporting structure using influence coefficients. Once
connections have failed, the effects of redistribution are preserved for
subsequent wind speed increments, thus ensuring that increasing wind loads act
on the damaged structure. Following connection failures, redistribution of loads
is modelled by changing the values of influence coefficients depending on the
position of the failed connection in the load path.

 13
IMPROVING THE RESILIENCE OF EXISTING HOUSING TO SEVERE WIND EVENTS – FINAL PROJECT REPORT | REPORT NO. 656.2021

A database of influence coefficients is provided as input data for each intact
house type. The influence coefficients are determined from structural analysis
and full-scale tests on house systems. Another database of influence coefficients
defines the changes in structural response and load paths that occur after the
failure of connections in the roof structure, i.e. connections below the batten-to-
rafter connections such as the rafter-to-top-plate or collar-tie-to-rafter, etc.
Revised influence coefficients are provided for each connection on the rafter
line of the failed connection and the adjacent rafter line.

Wall collapse

The extent of damage to walls in a house in a windstorm depends on many
factors such as loss of support to the top plate occurring when the rafter to top
plate connections fail; the location of internal cross-walls; wall types; and wind
speed. Damage surveys have shown that the extent of wall collapse can vary
markedly across similar house types. For example, after total roof loss, the house
shown in Figure 2 has lost approximately 75% of its walls whilst, the house shown
in Figure 3 experienced minimal wall collapse following total roof loss.

FIGURE 2 DAMAGE TO A HOUSE DURING TC LARRY

FIGURE 3 DAMAGE TOA HOUSE IN TC YASI

The collapse of walls contributes to a large component to the cost of repairs and
hence should be taken into account.
VAWS models the collapse of walls, based on the extent of roof-to-wall
connection failures that may typically occur during a windstorm. Figure 4 shows
the empirical relationships between wall collapse and the failure of roof-to-wall

 14
IMPROVING THE RESILIENCE OF EXISTING HOUSING TO SEVERE WIND EVENTS – FINAL PROJECT REPORT | REPORT NO. 656.2021

connections determined in this project through engineering judgement and
observations from damage surveys.

FIGURE 4 RELATIONSHIP BETWEEN WALL COLLAPSE AND FAILURE OF ROOF TO WALL CONNECTIONS BY PRIMARY WALL STRUCTURE.

Water ingress

Water ingress is estimated in order to account for the costs associated with water
damage to internal linings, using user-defined empirical relationships, as a
function of wind speed based on the extent of damage to the house envelope,
as shown in Figure 5.

 100

 90

 80
 Percentage water ingress

 70

 60
 Envelope DI 0.0 -0.10
 50
 Envelope DI 0.11-0.20
 40
 Envelope DI 0.21-0.50
 30 Envelope DI 0.51-1.00
 20

 10

 0
 0 10 20 30 40 50 60 70 80 90
 0.2s Gust Wind Speed at 10m [m/s]

FIGURE 5 EMPIRICAL WATER INGRESS CURVES FOR A HOUSES WITH METAIL ROOF CLADDING IN THE UNRETROFITTED STATE.

Wind-borne debris induced damage

The effects of wind-borne debris are simulated in VAWS. The method requires the
user to define the following parameters:
 • The urban environment within which the modelled house is sited. This, in
 turn, defines the mix of debris (type and mass) that may become airborne.

 15
IMPROVING THE RESILIENCE OF EXISTING HOUSING TO SEVERE WIND EVENTS – FINAL PROJECT REPORT | REPORT NO. 656.2021

 • The number and distribution of upwind debris sources (usually houses)
 together with the population of debris pieces that may become airborne
 from each source house.
 • The relationship between wind speed and the number of entrained debris
 items from each source house.
At each wind speed, the debris module samples the number of entrained debris
items, assigns their properties probabilistically, computes their flight distance and
determines their landing location. From this, the number of debris items that
impact the modelled house together with their momenta is computed.
Debris items that impact the modelled house contribute to damage in two ways:
firstly if they have sufficient momentum to pierce the envelope (doors and
windows only) they cause direct envelope damage which requires repair; and
secondly, if they pierce a window or door internal pressure is increased which
affects the wind load on the house's envelope and structure.

Damage costing
The program determines a repair cost for a damaged house by modelling the
damage state(s) that a house is in at each wind speed and then costing the
required repair work. The modelled house may have experienced one or more
damage states (for example, loss of roof sheeting and debris damage to walls).
The repair cost for any particular damage state is made up of three components:
repair damage to the external envelope, repair of consequential damage to the
interior, and repair to internal linings and fittings caused by water ingress
calculated separately. Thus, the total repair cost for a house type at a wind
speed is:

Total repair cost

= � � External envelope repair cost i + Consequential internal repair cost i �
 All damage states i
+ Water ingress repair cost

The two components of the repair cost for each damage state, i, are calculated
as below. The calculation allows for each damage state to only affect part of
the total susceptible area (for example, only a corner of the roof may have lost
its roof sheeting).

External envelope repair cost i
= Total quantityi × Percent damagei × Repair ratei × fi (Percent damage)

Consequential internal repair cost i
= Internal repair cost i × Percent damagei × fi (Percent damage)

Where fi(Percent damage) are functions adjusting the repair rate to allow for
higher repair rates for extents of repair less than full repair. It is in the form of a
quadratic equation (a1 x 2 + a2 x + a3 ) where x is the percent damage in a
particular damage state, and a1 to a3 are user-supplied coefficients.

 16
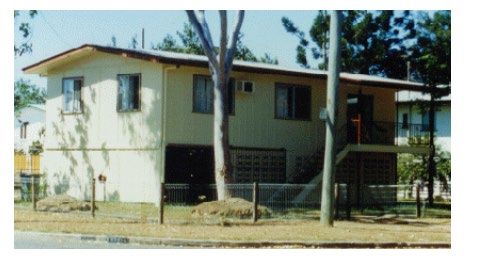
IMPROVING THE RESILIENCE OF EXISTING HOUSING TO SEVERE WIND EVENTS – FINAL PROJECT REPORT | REPORT NO. 656.2021

The repair cost due to water ingress is calculated from the modelled degree of
water ingress, the dominant damage state and repair costs supplied in the
costing data as follows.

Water ingress repair cost i = Water ingress repair cost i,% × fi (Percent damage)

Here Water ingress repair cost i,% is repair cost data supplied as part of the costing
module for the repair of damage caused by water ingress for a house. The
costing algorithm contains logic to prevent double-counting of repair to building
components where component repair is nominated in multiple damage states.
The project expresses repair costs as a damage index calculated as:

 Total building repair cost
Damage Index =
 Building replacement cost

This permits the results to be applied to other houses of similar generic type but
different floor areas. The repair cost is then calculated by multiplying the
damage index by the floor area and the replacement rate for the house type.

CASE STUDY: HOUSE TYPE 1 – HIGH-SET AUSTRALIAN HOUSE
The VAWS software is used to model the vulnerability of the high-set Northern
Australian house. The details of the model and an interpretation of the results are
presented in the following sections. The house is a high-set timber-framed
structure with metal roof cladding and fibre cement wall cladding, an example
is shown in Figure 6. The dimensions and structural system were determined from
survey data, and the resulting representative house was originally described in
Henderson and Harper (2003) as the Group 4 House. Further study on the
vulnerability of this house type was performed by Henderson and Ginger (2007).
The house is 12.6 m long, 7.3 m wide and 4.4 m tall, constructed on 2.0 m high
stumps. The roof structure consists of rafters at 10° pitch spaced at nominally 900
mm centres supporting battens also at 900 mm centres, which support
corrugated metal cladding. The overall dimensions and locations of windows
and doors are shown in Figure 7 and the structural system of the roof shown in
Figure 8.

 17
IMPROVING THE RESILIENCE OF EXISTING HOUSING TO SEVERE WIND EVENTS – FINAL PROJECT REPORT | REPORT NO. 656.2021

FIGURE 6 EXAMPLE OF A HOUSE TYPE 1 HENDERSON AND GINGER (2007)

FIGURE 7 OVERALL DIMENSIONS OF HOUSE TYPE 1, DIMENSIONS IN mm

 Roof Cladding
 Battens
 Rafter

 Collar Tie on Alternate Rafter Pairs Ceiling Joist
 Top Plate

FIGURE 8 ROOF STRUCTURE OF HOUSE TYPE 1

Wind pressures
Wind loads on the generic house types analysed in this project were determined
by carrying out wind tunnel model studies. The tests were carried out in the 2.0 m
high × 2.5 m wide × 22 m long Boundary Layer Wind Tunnel at the Cyclone Testing
Station, James Cook University. The approach atmospheric boundary layer

 18
IMPROVING THE RESILIENCE OF EXISTING HOUSING TO SEVERE WIND EVENTS – FINAL PROJECT REPORT | REPORT NO. 656.2021

profile (suburban terrain, category 2.5 as per AS/NZS 1170.2) was simulated at a
length scale of 1/50 using a 250 mm high trip board at the upstream end followed
by an array of blocks on the tunnel floor.
Pressure taps were installed on the external surfaces of the models to measure
the external pressures. Each pressure tap was connected to transducers located
below the wind tunnel floor/turntable via a length of tuned PVC tubing. External
pressures on the roof, walls and floor were obtained for approach wind directions
(θ) of 0° to 360° in steps of 10°. The fluctuating pressures were low-pass filtered at
500 Hz, sampled at 1000 Hz for 30 s (corresponding to ~ 10 min in full-scale) and
and analysed to give the pressure coefficients referenced to the mean dynamic
pressure at roof height:
 2
 C p (t ) = p (t ) ( 12 ρU h )
 U
Where, h is the mean velocity at roof height and ( ) is the recorded time
varying pressure. The spatial pressure distributions were used to identify regions
experiencing large wind loads, and for consistency with data given in AS/NZ
1170.2. The AS/NZS 1170.2 equivalent quasi-steady aerodynamic shape
factor = / 2, where are the maximum and minimum pressure
coefficients within an observation time equivalent to 10 min in full scale and
GU = (Uˆ h U h ) is the velocity gust factor. Here, Û h and U h are the 0.2 s gust wind
speed, and 10 min mean wind speed respectively at roof height.

Pressure distributions
The average of the peak pressure coefficients obtained for approach winds
within a 45° sector was used to derive the pressure distributions used for eight
cardinal directions. The wind pressure distributions for a cornering wind sector
225o ± 25° on House Type 1 is shown in Figure 9. These wind tunnel derived
pressures account for local pressure effects in flow separation regions and are
used for the application of load to cladding and immediate supporting members
such as batten to rafter connections. The pressures are factored by 0.5 for loads
applied to major structural elements to account for area averaging effects of
pressure fluctuations on the tributary area of the element.

 19
IMPROVING THE RESILIENCE OF EXISTING HOUSING TO SEVERE WIND EVENTS – FINAL PROJECT REPORT | REPORT NO. 656.2021

 A B C D E F G H H I J K L M N O

 -0.59 -0.59 -0.58 -0.59 -0.63 -0.68 -0.65 -0.57 -0.60 -0.58 -0.55 -0.50 -0.48 -0.47 -0.47 -0.49

 -0.58 -0.58 -0.56 -0.55 -0.55 -0.57 -0.53 -0.35 -0.34 -0.52 -0.50 -0.48 -0.46 -0.46 -0.46 -0.50

 -0.55 -0.56 -0.56 -0.53 -0.53 -0.53 -0.51 -0.50 -0.53 -0.49 -0.48 -0.48 -0.46 -0.46 -0.46 -0.50

 -0.56 -0.56 -0.57 -0.54 -0.54 -0.56 -0.51 -0.50 -0.50 -0.50 -0.49 -0.48 -0.46 -0.46 -0.45 -0.49

 A B C D E F G H H I J K L M N O
 -0.56 -0.56 -0.56 -0.58 -0.59 -0.58 -0.57 -0.54 -0.53 -0.54 -0.52 -0.47 -0.44 -0.42 -0.45 -0.49

 A B C D E F G H H I J K L M N O
 -1.17 -1.15 -0.84 -0.76 -0.66 -0.52 -0.46 -0.43 -0.42 -0.42 -0.40 -0.39 -0.38 -0.39 -0.51 -0.52

 -0.57

 -0.54

 -0.52

 -0.48
 0.83

 0.88

 0.91

 0.92
 -1.19 -1.21 -0.89 -0.76 -0.64 -0.52 -0.45 -0.42 -0.36 -0.37 -0.36 -0.38 -0.38 -0.39 -0.41 -0.53
 I

 -0.53

 -0.52

 -0.47

 -0.44
 0.77

 0.83

 0.84

 0.85

 -1.23 -1.27 -0.99 -0.76 -0.62 -0.50 -0.42 -0.41 -0.40 -0.38 -0.38 -0.38 -0.39 -0.42 -0.42 -0.66
 H

 -0.53

 -0.49

 -0.47

 -0.47
 0.70

 0.75

 0.78

 0.79

 -1.56 -1.45 -1.04 -0.76 -0.61 -0.50 -0.45 -0.48 -0.45 -0.42 -0.41 -0.43 -0.44 -0.43 -0.55 -0.72
 G

 -0.54

 -0.51

 -0.51

 -0.53
 0.68

 0.71

 0.74

 0.75

 -2.17 -1.17 -1.02 -0.76 -0.67 -0.56 -0.49 -0.51 -0.49 -0.48 -0.49 -0.51 -0.47 -0.51 -0.25 -0.76
 F

 -0.51

 -0.51

 -0.52

 -0.56
 0.65 0.65

 0.71 0.71

 0.72 0.72

 0.70 0.70

 E -1.84 -1.81 -1.18 -0.99 -0.91 -0.82 -0.80 -0.77 -0.74 -0.73 -0.73 -0.72 -0.71 -0.67 -0.65 -0.58

 -0.43

 -0.45

 -0.46

 -0.49
 E 6 -1.60 -1.56 -0.97 -0.76 -0.69 -0.65 -0.63 -0.65 -0.59 -0.59 -0.57 -0.54 -0.56 -0.54 -0.51 -0.50

 -0.47

 -0.45

 -0.46

 -0.47
 0.68

 0.71

 0.74

 0.75

 D 5 -1.39 -1.01 -0.89 -0.59 -0.57 -0.50 -0.51 -0.57 -0.57 -0.57 -0.54 -0.56 -0.52 -0.52 -0.26 -0.52

 -0.47

 -0.46

 -0.47

 -0.49
 0.70

 0.75

 0.78

 0.79

 C 4 -1.46 -1.64 -0.75 -0.55 -0.55 -0.58 -0.66 -0.75 -0.70 -0.67 -0.65 -0.63 -0.61 -0.59 -0.57 -0.53

 -0.45

 -0.47

 -0.46

 -0.47
 0.77

 0.83

 0.84

 0.85

 B 3 -1.77 -1.04 -0.67 -0.71 -0.77 -0.85 -0.96 -1.02 -0.88 -0.89 -0.82 -0.82 -0.81 -0.73 -0.65 -0.56

 -0.44

 -0.45

 -0.48

 -0.51
 0.83

 0.88

 0.91

 0.92

 A 2 -2.00 -1.52 -0.73 -0.92 -1.12 -1.17 -1.17 -1.16 -1.03 -1.03 -1.02 -0.99 -0.90 -0.81 -0.73 -0.65

 1.00 2.00 1 -2.20 -2.02 -1.50 -1.35 -1.29 -1.27 -1.36 -1.35 -1.27 -1.32 -1.31 -1.29 -1.33 -1.36 -1.29 -0.97
 A B C D E F G H H I J K L M N O

 Eaves: 0.97 0.90 0.81 0.78 0.79 0.79 0.77 0.77 0.68 0.67 0.67 0.64 0.60 0.56 0.57 0.47
 A B C D E F G H H I J K L M N O

 0.97 0.90 0.85 0.82 0.81 0.79 0.78 0.78 0.68 0.68 0.67 0.67 0.67 0.61 0.57 0.47
 4

 0.95 0.89 0.84 0.81 0.80 0.77 0.77 0.75 0.65 0.66 0.66 0.67 0.65 0.61 0.56 0.42
 3

 0.95 0.87 0.82 0.79 0.78 0.77 0.76 0.82 0.74 0.65 0.63 0.65 0.63 0.59 0.54 0.42
 2

 0.89 0.82 0.76 0.75 0.74 0.73 0.70 0.70 0.63 0.61 0.61 0.60 0.57 0.55 0.50 0.40
 1
 A B C D E F G H H I J K L M N O

FIGURE 9 PRESSURE DISTRIBUTION FOR THE SECTOR 225 ± 25° ON THE ROOF, WALLS AND THE UNDERSIDE OF THE EAVES OF HOUSE TYPE 1

Analysis of pressure coefficients with wind direction, θ show that the windward
edge of the roof experiences the largest peak suction pressures and the
(windward) wall is subjected to high positive pressures. These pressures are
generally close to values given in AS/NZS1170.2. The underside of the eaves is
subjected to pressures similar to that on the adjacent wall surface. Roof cladding,
battens and rafters near the windward gable-end experience the largest wind
pressures.
Internal pressure coefficients are derived in accordance with AS/NZS 1170.2
depending on the distribution and sizes of openings in the walls. The presence of
openings is ascertained by modelling debris impact during a storm and pressure-
induced failures of windows and doors. The internal pressure in the nominally
sealed house with the envelope intact is small, i.e. the internal pressure
coefficient = 0. However, the failure of a door or window on the windward
wall from wind pressure or debris impact with increasing wind speed can result in
the internal pressure reaching the values of the external wall pressure at the
dominant opening = 0.6 or more.

Component strengths
The assessment of vulnerability relies on many inputs and one of the most
important is the assessment of connection strengths for both unretrofitted legacy
houses and houses with retrofitted connections. VAWS does not model time-
varying fluctuating loads; hence the connection strengths for those components
susceptible to fatigue have to be reduced to account for the loss of strength due
to fatigue. Table 3 presents the strengths and coefficients of variation adopted
for the unretrofitted house type 1 considered in this study.

 20
IMPROVING THE RESILIENCE OF EXISTING HOUSING TO SEVERE WIND EVENTS – FINAL PROJECT REPORT | REPORT NO. 656.2021

 Connection type Connection Mean Strength Strength CoV

 Metal Roof Sheeting 3-4-3 fastener arrangement 2.6 kN per m Length 0.2
 Connections - Legacy
 (Cyclonic)

 Metal Roof Sheeting 3-4-3 fastener arrangement 3.6 kN per m length 0.2
 Connections - Legacy (Non
 Cyclonic)

 Metal Roof's Batten rafter 2x plain shank nails 1.5kN 0.12
 connection - Legacy

 Roof to wall connection - Skew nails 2kN* 0.23
 Legacy High-set

 Ridge Connection - Legacy Skew nails 4kN* 0.3

 Collar tie connection - Plain shank nails 2.4kN* 0.2
 Legacy

 Racking of Piers 70kN/house

TABLE 3 STRENGTHS OF CONNECTIONS IN UNRETROFITTED HOUSE TYPE 1

*Connections adjusted to 5kN in the modelling to account for load sharing effects.

Retrofit scenarios
For each of the house types, several retrofit scenarios were modelled to explore
the benefit-cost of a variety of retrofit measures. Table 4 sets out the practical
retrofit scenarios considered by the project for House Type 1. Table 5 gives the
revised strengths adopted for each upgraded connection type in house type 1.

 Retrofit Scenario Retrofit Scenario Description

 - Nil (existing house)

 1.1 Window protection and door upgrade

 1.2 Roof sheeting upgrade

 1.3 Roof sheeting and batten connection upgrades

 1.4 Roof sheeting, batten connection and roof structure upgrade

 1.5 All upgrades 1.1 to 1.4

TABLE 4 RETROFIT SCENARIO DESCRIPTIONS FOR HOUSE TYPE 1

 Connection type Connection Mean Strength Strength CoV

 Metal Roof Sheeting New roof cladding 4.1 kN per m length 0.2
 Connections - Legacy
 (Cyclonic)

 Metal Roof Sheeting New roof cladding 4.1 kN per m length 0.2
 Connections - Legacy (Non-
 Cyclonic)

 Metal Roof's Batten rafter Addition of batten screw or Additional 3.6kN 0.2
 connection - Legacy strap

 Roof to wall connection - Addition of a strap 12kN 0.1
 Legacy High-set

 21
IMPROVING THE RESILIENCE OF EXISTING HOUSING TO SEVERE WIND EVENTS – FINAL PROJECT REPORT | REPORT NO. 656.2021

 Ridge Connection - Legacy Addition of new collar tie - Additional 4kN 0.2
 MGP10, with 2x 14 gauge
 Type 17 screws each end

 Collar tie connection - Addition of a type 17 screw Additional 4kN 0.2
 Legacy through collar tie into rafter

TABLE 5 STRENGTHS OF RETROFITTED CONNECTIONS HOUSE TYPE 1

VAWS outputs
The output from VAWS is a series of coordinates defining a graph of damage
index versus gust wind speed at the house, as shown for House Type 1 in Figure
10. These are the mean curves obtained from multiple realisations (typically n =
100). Each house is initially modelled in its baseline or unretrofitted condition.
Following this, each retrofit scenario of each house is modelled separately by
changing the strength properties for the selection of connections shown in Table
3 according to retrofitted details shown in Table 5 appropriate to the retrofit
scenario under consideration as defined in Table 4.
 1.000

 0.900

 0.800

 0.700
 Unretrofitted house
 Damage Index

 0.600
 Retrofit scenario 1.1
 0.500
 Retrofit scenario 1.2
 0.400 Retrofit scenario 1.3
 0.300 Retrofit scenario 1.4
 Retrofit scenario 1.5
 0.200

 0.100

 0.000
 30 40 50 60 70 80
 0.2s, 10m gust wind speed (m/s)

FIGURE 10 DAMAGE INDEX VS WIND SPEED FOR HOUSE TYPE 1: UNRETROFITTED HOUSE AND WITH A RANGE OF RETROFIT SCENARIOS

The vulnerability curves for the unretrofitted House Type 1, together with each
retrofit scenario, are shown in Figure 10. It can be seen that there are small
reductions in vulnerabilities when strengthening windows (scenario 1.1) and
strengthening batten to rafter connections (scenario 1.3). There is no significant
change in vulnerability when upgrading roof cladding alone (scenario 1.2) as
initial failures are most often associated with the batten or rafter connections.
The onset of damage for these retrofitting scenarios and the unretrofitted case
begins at approximately 40m/s and complete damage occurs at approximately
65m/s.
The case study of a high-set Australian house (Type 1) shown, quantifies the
vulnerability of a population of these house types. VAWS allows the reduction in

 22
IMPROVING THE RESILIENCE OF EXISTING HOUSING TO SEVERE WIND EVENTS – FINAL PROJECT REPORT | REPORT NO. 656.2021

vulnerability afforded by retrofit to be modelled by re-running a simulation with
the connection strength parameters adjusted to suit the strengthening work.
VAWS estimates similar extents of failure that would occur in a windstorm. The
simulation of n = 100 realisations of House Type 1 allowed the fitting of vulnerability
curves to the calculated damage index at each wind speed increment. Wind
speeds of onset and complete failure of houses compare satisfactorily with
observations from damage investigations.
The cost of repair of a house that has been damaged by severe wind is
dependent on many factors. Of all the types of damage that contribute to the
repair cost, damage caused by water ingress is the hardest to quantify yet can
contribute a substantial proportion of the repair cost, particularly at low levels of
structural damage. VAWS adopts the empirical approach outlined above,
together with a simplified costing of water ingress damage.

CALCULATION OF BENEFIT-COST
The economic advantage of retrofitting is often expressed as a benefit-cost ratio
where the cost is the cost of installing the retrofit and the benefit is the reduction
in average annual loss over the remaining life of the building plus any reduction
in indirect costs such as temporary housing required whilst repairs are carried out
following wind damage. A ratio greater than one indicates a positive economic
advantage of undertaking retrofit.
The method used by the project to calculate benefit-cost is described in Wehner,
Ryu et al. (2019)and summarised below.

COSTS OF RETROFITTING
Estimates of the cost of retrofit were determined through a contract with a
professional quantity surveyor (Turner & Townsend 2019). The estimates included
sufficient data to establish a full cost estimate for each retrofit scenario. Apart
from the work of installing the actual retrofit, costs were also provided that cover
access, removal and replacement of linings and fittings for access to install
retrofit, builders' preliminaries and profit.
Appendix B provides out the computed costs to implement each retrofit scenario
for each generic house type for the year 2019. The costs assume a builder is
retrofitting a single house. A significant portion (from 15 to 47%) of each retrofit
cost is the cost of scaffolding for roof access.
Table 6 is an extract from Appendix B that provides costs for retrofitting House
Type1 in cyclonic and non-cyclonic regions of Australia. If retrofit can be
undertaken when other work is being undertaken, such as roof sheeting
replacement, the retrofit cost will be substantially cheaper as costs such as
scaffolding will be removed from the retrofit cost. Additionally, experience from
the Queensland Household Resilience Program has indicated that widespread
retrofit programs can lead to significantly reduced retrofit costs (e.g. reducing
the cost from $35000 to approximately $20000 in 2019).

 23
IMPROVING THE RESILIENCE OF EXISTING HOUSING TO SEVERE WIND EVENTS – FINAL PROJECT REPORT | REPORT NO. 656.2021

 Retrofit Scenario Cost to retrofit in non-cyclonic region Cost to retrofit in cyclonic region ($)
 ($)

 1. Window and door protection 15865 15016

 2. Roof sheeting upgrade 27784 26812

 3. Roof sheeting and batten upgrade 29233 28210

 4. Roof sheeting, batten connection 35592 34346
 and roof structure upgrade

 5. Full roof upgrade and door and 51457 49752
 window protection

TABLE 6 ESTIMATED RETROFIT COSTS HOUSE TYPE 1

BENEFITS AND COSTS OTHER THAN BUILDING REPAIR
Whilst the repair of the building fabric is perhaps the most obvious cost incurred
due to wind-induced damage; there are other costs which should be
considered. This section discusses the non-building fabric costs that the project
incorporated into the benefit-cost calculations. No allowance has been made
for demand surge following a large storm such as a cyclone.

Casualties
In the modern Australian environment, casualties from the actions of severe wind
on buildings are rare due to good education about the dangers posed by
cyclones and storms, pre-cyclone season preparation and sensible behaviour by
the population seeking shelter prior to storm arrivals. Thus, for this project,
estimation of casualties arising from wind-induced building damage and
reduction in casualty numbers afforded by retrofit was not considered.

Building contents
Wind-induced damage to the house envelope and structure together with water
ingress may also damage contents within the house. The reduction in contents
damage due to the retrofit of the house is a benefit that is accounted for in this
analysis.
The replacement value of contents is taken as $893 per m2 of floor area. This is an
average figure derived from a small survey of Geoscience Australia staff's
contents value and house floor areas.
The contents loss is taken as the damage index multiplied by the contents
replacement value where the damage index is the damage index calculated
using the VAWS software tool incorporating damage to the house envelope,
structure and internal linings and fittings.

Temporary accomodation
If a house is substantially damaged during a storm, it is most likely that the
occupants will require temporary accommodation while the damage is
assessed, a builder found to undertake the repairs and the repair work executed.
The project used the relationship shown in Figure 11 to establish the length of time

 24
IMPROVING THE RESILIENCE OF EXISTING HOUSING TO SEVERE WIND EVENTS – FINAL PROJECT REPORT | REPORT NO. 656.2021

for which temporary accommodation is required. The relationship is a heuristic
relationship developed by the project team members based on damage survey
experience and regional knowledge.
The rates for temporary accommodation were taken as, $1600 per month in
cyclonic regions and $2000 per month in non-cyclonic regions. The values were
sourced from a short survey of rental properties, of similar size to generic house
types, advertised on the internet in Canberra, Townsville and Cairns, in 2019.

FIGURE 11 THE HEURISTIC RELATIONSHIP RELATING LENGTH OF TEMPORARY ACCOMMODATION REQUIRED TO DEGREE OF ENVELOPE DAMAGE IN A
HOUSE

CALCULATION OF BENEFIT
The calculation of benefit represents the largest task when calculating a benefit-
cost ratio.
The present value of benefit is taken as:
 1
 � �( − ) × � ��
 (1 + )

Where:
 AALbi is the average annual loss of the unretrofitted house at year i,
 AALri is the average annual loss of the retrofitted house at year i,
 i is the year number from current year varying from 1 to the remaining
number of years in the house's lifespan and is taken as 30 years in this analysis.
 r is the interest rate.
The average annual loss is calculated as the area under the loss-probability
curve for the particular house in a particular retrofit scenario.
The loss-probability curve is determined by transforming the vulnerability curve
for the house whether mitigated or retrofitted. For this project, the mean
vulnerability curve, a plot of damage index versus the 0.2s, 10m gust wind speed
at the house of interest, is output from the project-developed VAWS software.

 25
IMPROVING THE RESILIENCE OF EXISTING HOUSING TO SEVERE WIND EVENTS – FINAL PROJECT REPORT | REPORT NO. 656.2021

The vertical axis of the vulnerability curve is Damage index defined as repair cost
divided by replacement cost. Hence, damage index is transformed to loss (the
vertical axis of a loss-probability curve) by multiplying by the house's replacement
cost. At this point, the loss can be included by adding any indirect losses, such
as temporary accommodation losses, to the house's repair cost.
The horizontal axis of the vulnerability curve is the 0.2s gust wind speed at 10m at
the house, which can be transformed into probability by relating the gust wind
speed to an annual probability of exceedance. For this project, this relationship
is modelled using the formulae provided in AS/NZS1170.2 Table 3.1 and modified
for local wind speed effects. The relationship is shown in the equation:
 10
 ( 1 3 )
 = � �

 � 1 2 − �
 3

where:
R is the return period or inverse of the annual exceedance probability,
V is the local 0.2s gust wind speed at 10m at the house,
C1, C2 and C3 are constants provided in AS/NZS1170.2 and reproduced in Table
7, for each wind region.
M3 is the product of the local wind multipliers accounting for upwind terrain
category, shielding and topography.
The benefit-cost ratios calculated using the method outlined for all ten house
types are presented in Appendix C. The benefit-cost ratios for the Type 1 house
are given in Table 8.

 Constant Wind Region A Wind Region B Wind Region C Wind Region D

 C1 1 1 1.05 1.1

 C2 67 106 122 156

 C3 41 92 104 142

TABLE 7 CONSTANTS FROM AS/NZS 1170.2 TABLE 3.1 FOR COMPUTING RETURN PERIOD

 Retrofit scenario Benefit-cost in a non-cyclonic wind Benefit-cost in a cyclonic wind region
 region

 1. Window and door protection 0.00 0.48

 2. Roof sheeting upgrade 0.00 0.00

 3. Roof sheeting and batten upgrade 0.00 0.15

 4. Full roof upgrade 0.00 0.43

 5. Full roof upgrade and door and 0.00 0.36
 window protection

TABLE 8 ESTIMATED BENEFIT-COST RATIOS FOR RETROFIT TO HOUSE TYPE 1

 26
IMPROVING THE RESILIENCE OF EXISTING HOUSING TO SEVERE WIND EVENTS – FINAL PROJECT REPORT | REPORT NO. 656.2021

Benefit-cost analyses showed that there is generally no economic benefit for
retrofitting older houses for wind hazard, especially in the non-cyclonic regions of
Australia where the probabilities of damaging wind speeds are lower than in the
cyclonic regions. The present value of benefit for retrofitting in non-cyclonic
regions is very low, and therefore, further reductions in retrofitting costs would still
not be able to justify retrofitting.
The most obvious way to improve the economic benefit of retrofitting is to reduce
the cost of retrofit. Typically the cost to undertake the actual retrofit (i.e.
upgrading connection strengths or fitting window protection) is quite small. Often
the largest component of the total retrofit cost is for access (scaffolding and fall-
restraints) and removal of the existing envelope to expose the structure. For
example, for House Type1 whose benefit-cost ratios are shown in Table 8, the
contribution of access cost to the total retrofit cost ranges from 48% for retrofit
scenario 2 to 26% for retrofit scenario 5. Thus if the retrofit work could be
undertaken when the house is scaffolded for another reason, such as the
replacement of corroded roof sheeting, the economic benefit of retrofit
becomes more attractive.
At some point in the life of a house, its roof cladding (metal sheet or tiles) will
need to be replaced due to damage or deterioration. It is recommended that
retrofitting of roof connections be done at a time when roof cladding is being
replaced. In both cyclonic and non-cyclonic regions, retrofitting cladding and
battens alone is not recommended as this causes connections to fail lower down
in the tie-down chain.
Further reductions in costs can occur when there is increased demand in the
market for retrofitting. For example, the average retrofitting costs for a full roof
upgrade (scenario .4) during the Queensland Household Resilience Program was
approximately $18,000 which would produce a benefit-cost ratio of
approximately 0.9 for House Type 1. Additional benefits that are not accounted
for in this study are potential reductions in insurance premiums that may be
offered to customers for implementing retrofitting measures.
Structural damage, contents damage and costs of temporary accommodation
are only a part of the costs to a town or community due to damaged houses
during a cyclone or thunderstorm. Costs related to the disruption of economic
activity in the community and mental health impacts of the event on citizens and
other intangible costs also add to the overall cost to the community. Accounting
for these community-level costs would provide additional information on the
benefit to cost of retrofitting older houses. However, this level of analysis is outside
the scope of the current project.

 27
You can also read