Survey of financial mentoring and budgeting services in Aotearoa on high cost loans, debt collection and other consumer credit issues Dr. Liz ...
←
→
Page content transcription
If your browser does not render page correctly, please read the page content below
Justice Innovation Centre
 Community Law Canterbury
  Te Ture Whānui o Waitaha

Research report

Survey of financial mentoring and budgeting services in
Aotearoa on high cost loans, debt collection and other
consumer credit issues

Dr. Liz Gordon, Justice Innovation Centre, Community Law Canterbury

With the team:
Tim Barnett and Soraiya Daud, FinCap
Emeritus Professor Jeremy Finn, Justice Innovation Centre, Community Law
Canterbury and The University of Canterbury
Victoria Stace, Victoria University of Wellington, and
Dr. Ganesh Nana and Sam Green, BERL

February 2019
About the Project and the Researchers
This research is part of a collaborative project between:

    •   FinCap, New Zealand’s umbrella body for financial capability and budgeting services;
    •   Canterbury Community Law, a not-for-profit organisation working to reduce and remove
        barriers to the law;
    •   Dr. Liz Gordon, social science researcher from Pukeko Research Ltd and Justice Innovation
        Centre, Community Law Canterbury;
    •   Victoria Stace, lecturer at the School of Law at Victoria University of Wellington;
    •   Emeritus Professor Jeremy Finn from Justice Innovation Centre and the College of Business
        and Law at The University of Canterbury; and
    •   Dr. Ganesh Nana, chief economist and Sam Green at Business and Economic Research
        Limited (BERL).

Visit:
www.fincap.org.nz
www.canlaw.org.nz

Michael and Suzanne Borrin Foundation
This report was produced with a grant from the Michael and
Suzanne Borrin Foundation. The Borrin Foundation believes law is
essential to a flourishing society – one that is just, inclusive,
tolerant and free. It supports legal education, research and
scholarship through effective philanthropy.

See: www.borrinfoundation.nz

Creative Commons Copyright
                         Some rights reserved. This work is licensed under a Creative Commons
                         Attribution 4.0 International Licence. To view a copy of this licence, visit
                         https://creativecommons.org/licenses/by/4.0/

As a summary of this license, you are free to:
    • Share — copy and redistribute the material in any medium or format
    • Adapt — remix, transform, and build upon the material
As long as there is attribution.

Gordon, L. et al (2019) Research report: Survey of financial mentoring and budgeting services in
Aotearoa on high cost loans, debt collection and other consumer credit issues. FinCap

                                                                                                    2
Contents
Executive summary ................................................................................................................................. 5
About this survey .................................................................................................................................... 7
The organisations and clients ................................................................................................................. 8
Client debt............................................................................................................................................. 12
High-cost loans ...................................................................................................................................... 14
Implications of debt .............................................................................................................................. 21
Debt collection ...................................................................................................................................... 24
Insolvency ............................................................................................................................................. 27
Making complaints ................................................................................................................................ 30
Other issues .......................................................................................................................................... 32
Final comments ..................................................................................................................................... 36
Appendix 1. Survey questions ............................................................................................................... 40
Table of Figures
Figure 1. Services offered by number of participant organisations (n=76). ........................................... 8
Figure 2. Presenting debt, by agency and proportion of clients. .......................................................... 12
Figure 3. Average number of loans held by presenting clients, by agency (n=73) ........................... 13
Figure 4. Participants’ estimates of proportion of clients with high-cost loans ................................... 15
Figure 5. Reasons for taking out high-cost loans ranked (by participants), top 3 ranks ...................... 16
Figure 6. Opinions of agencies about why clients take out high-cost loans. ........................................ 17
Figure 7. Level of client understanding of high-cost loan fees and costs, as reported by agencies (n=76)
.............................................................................................................................................................. 18
Figure 8. Reasons given by clients for holding multiple high-cost loans, agency reporting (n=76) ..... 18
Figure 9. Proportion of clients with three or more high-cost loans (estimate by agencies) (n-76) ..... 19
Figure 10. Amount borrowed on high-cost loans (agency estimate % of total agencies) .................... 20
Figure 11. Views of agencies about effects of debt on overall client wellbeing................................... 21
Figure 12. Proportion of clients with high-cost loans referred to a debt collector by number of agencies
(n=76). ................................................................................................................................................... 24
Figure 13. Count (number of agencies) of debt collection practices experienced by agency clients
(n=76). ................................................................................................................................................... 25
Figure 14. Proportion of high-cost loan clients recommended for insolvency procedure by number of
agencies (n-76). ..................................................................................................................................... 27
Figure 15. Percent agencies reporting general number of complaints by clients (n=19)..................... 30
Figure 16. Level of satisfaction with outcome of complaint about lender behaviour (n=19). ............. 31
Figure 17. Views on “the more vulnerable the client, the less likely they are to be influenced by interest
rates” (n=76). ........................................................................................................................................ 32
3Table of tables
Table 1. Location of services participating in survey .............................................................................. 9
Table 2. Number of organisations by number of clients seen in 2018 ................................................... 9
Table 3. Most considered insolvency procedure by % agencies........................................................... 27
Table 4. Main factors influencing overall borrowing behaviour (n=76). .............................................. 32
4Executive summary
This survey of local financial capability and budgeting services is part of a larger research collaboration
between FinCap and the Justice and Innovation Centre, Community Law Canterbury, funded by the
Borrin Foundation. It was carried out in December 2018, and reported in February 2019. Responses
were included from 76 agencies from all regions of Aotearoa (“participant agencies”)
Data findings are reported here, but little further analysis is completed. This is because this report will
feed into the larger study, which aims to provide sound evidence to inform the legislative reform of
the Credit Contracts and Consumer Finance Act (2003).
Around 15,000 clients were seen by participant agencies in 2018, in organisations ranging from quite
small (less than 50 clients) to very large (up to 1700). Women make up more than half of those clients,
with around half being Māori and 20% Pasifika overall. There are relatively low levels of migrant and
Asian clients. Overall, client type differs according to the location and focus of the agency, with a
“great diversity” of people.
The clients often come to agencies as a “last resort”, and in “dire straits”. Most have high levels of
consumer debt, and payments are often in arrears. Most debts are triggered by particular factors such
as unemployment, change in circumstances, mental illness, family demands or other.
The main types of debt are to Work and Income, store or consumer debt, direct sales, overdraft/ credit
card or loans. Most have more than one type of debt, an increasing debt burden, the inability to make
minimum payments and/ or the need to borrow for basic items. Multiple loans are the norm.
A major section of this study is around high-cost loans. These are defined as those with interest rates
in excess of 50%, often taken out on a short-term basis. The growth of high-cost debt has been marked
in recent years. Many such loans have real interest rates in hundreds of percent. One example given,
using fees and costs of a particular agency, show a person borrowing $100 for two weeks being
required to pay back over $250 on time, with, of course, default fees if the deadline is missed. Such
loans can often be applied for online and are easy to get, even with a poor credit rating.
Most high-cost loans are taken out to cover household expenses, car repairs/ registration or rent. As
they are usually short term, they appear to fill a gap between the cost of basic needs and the ability
to pay for these. This means, in effect, that many whānau end up struggling to pay their basic costs
plus the very high burden of servicing/repaying a high-cost loan.
Most people who take out high-cost loans do so because they are unable to obtain credit in other
ways, and/ or because these loans are accessible and convenient and can be processes quickly,
alongside other factors. Most agencies reported that, on average, clients are unable to repay such
loans on time, causing higher fees and – often - further debt.
Agencies report that most clients with high-cost loans have a low or very low understanding of the
fees or costs they are incurring. Also, most appear to have more than one high-cost loan, with either
the same or, more often, different lenders. Reasons for multiple borrowing include a worsening of
their general financial situation, to repay prior debt, for new and different reasons or they are
encouraged by lenders to borrow more. More than 1 in 4 appear to have three or more high-cost
loans. Most such loans are of low value, up to $1000, although many are also larger.
5In a forced-choice response, 90% of agencies believed that clients were worse off overall (not just
financially) by having borrowed a high-cost loan. A further question moderated that finding, noting
that some were better off with such loans.
Alternatives to high-cost debt included: “very few” options; good budgeting to alleviate household
debt; Work and Income loans; a new low- or no- interest scheme and non-financial support (e.g.
foodbanks).
Around half of agency clients with high-cost loans appear to have been referred to debt collectors.
Debt collectors nearly always add additional collection fees. Many also continue to charge interest on
the debt, which agencies almost unanimously object to. Collectors engage in a range of collection
practices, most of which appear to be punitive. A small number engage positively with agencies and
clients to resolve debt. Agencies note a small number of disturbing practices by debt collectors. Some
agencies note that clients make it harder for themselves.
A number of questions were asked about the use of insolvency procedures by high-cost loan clients.
Only a small number recommend such procedures, most that do advocating a no-asset procedure for
their clients (i.e. when they have no means to repay the debt). Agencies note that insolvency is not
always the best option. Barriers include one NAP per lifetime, secured and government debt excluded,
other options including microfinance community loans and KiwiSaver financial hardship withdrawals,
good budgeting with a repayment regime and the need to avoid the personal ramifications of
insolvency.
A number of agencies (19/76) report that they or their clients had made complaints to either the
Commerce Commission or relevant Dispute Resolution Scheme about lenders, most (70%) to the
former. All but one of these alleged a breach of the Credit Contracts and Consumer Finance Act and
most agencies were satisfied or very satisfied with the outcome of these complaints.
There was strong support (84%) for a suggestion of a Tribunal to deal with issues around high cost
loans.
The main influences on client borrowing overall were the ability to borrow funds when needed and
widespread advertising promising ‘easy’ money. Nearly all agencies agree or strongly agree that “the
more vulnerable the client, the less likely they are to be influenced by interest rates”. In a range of
qualitative responses, agencies discuss the implications of this in terms of the fee and cost burden on
the borrower, their vulnerability, the lack of understanding of the implications of the debts and the
absence (often) of viable alternatives.
The final question opened up the debate and invited participants to make any comments they wished
on the matters covered in the survey. There were comments on borrowers, lenders, lending practices,
regulation and examples of effects of current lending practices. Finally, agencies provided some
recommendations on what should happen.
The survey is attached as an appendix.
6About this survey
This survey is the first output of a larger study of consumer credit and high-cost debt being carried out
by FinCap and Community Law Canterbury. FinCap is the national umbrella organisation for local
financial capability and budgeting organisations, and the Justice Innovation Centre at Community Law
Canterbury is committed to investigating the contemporary operation of legal systems. The project is
funded by the Borrin Foundation. The aim of the overall project is to collect and analyse data to inform
upcoming changes to the Credit Contracts and Consumer Finance Act (2003) and its amendments.
The survey (attached as Appendix 1) was launched on 10 December and closed on 26 December 2018.
The survey was developed on the Qualtrics platform and included a range of qualitative and
quantitative questions. In total it included 52 questions, of which seven provided the participants with
the opportunity to respond qualitatively (in their own words). Questions included list rankings, Likert-
type scales, choosing among semi-qualitative options and various numerical choices.
The expected completion time for the survey was around 15 minutes. No ethical approval was needed
for the survey as the organisations were approached as professional bodies and were not asked to
reveal individual client data. Nevertheless, the confidentiality of individual respondents and the data
they revealed was assured.
An initial email was sent out to 194 local organisations on the mailing list of FinCap. Five emails were
non-deliverable, so 189 organisations received the initial email.
Reminders were sent on 17 December and again (final reminder) on 19 December. The final response
was received on 24 December. One email was received from an organisation explaining that it had no
time left to complete the survey.
In total 86 responses were received, but a number of these only completed up to 31% of the survey,
which was largely demographic data. In the data-cleaning phase these were removed, leaving 76
responses. Two were incomplete: one at 67% and one at 90%. All the others completed the survey.
The overall response rate of included responses against total potential respondents was therefore just
over 40% of the total client population.
7The organisations and clients
Nearly all of the organisations participating in the survey (75/76) offered financial mentoring and
budgeting advice. Most offered at least one other service including advocacy, support or access to
loans. The services offered by number are shown in Figure 1 below.
Other, please specify
Practical help, access to loans
Other forms of support
Advocacy services
Financial mentoring and budgeting advice to clients
0 10 20 30 40 50 60 70 80
Figure 1. Services offered by number of participant organisations (n=76).
The organisations also carry out a range of other services. A number employ staff who are qualified to
supervise SIOs (summary instalment orders), while some offer further financial capability services,
such as community education, negotiating settlements with credit providers or running money
management systems for vulnerable people. In addition to financial capability services, some provide
free clothing, furniture and food, including food parcels.
A number also have in-house social services including counselling, family support, family violence
services, empowerment programmes, youth services and others. Some mentioned having a Justice of
the Peace in-house and offering other justice-related services.
The responses demonstrate that few services, only 4 out of 76, offer solely budgeting advice. Most
offer at least two, and often three or more, services within their organisation. Many are multi-lateral
services, including financial, social and other forms of support under one roof. In the cities,
organisations might be more or less specialist in the services they offer. In smaller towns, diversity is
more likely to be needed due to a lack of other services, as one participant noted: “All sorts as being
a small town and operating out of a Church we get all sorts of people with all sorts of issues, especially
the homeless”.
The 76 budgeting services were located in every region of Aotearoa. The sample provided an extensive
regional spread, as shown in Table 1.
8Location Number
Northland, Auckland 15
Waikato, Bay of Plenty, East Cape and Taupo 23
Taranaki, Manawatu, Whanganui, Hawkes Bay 15
Wellington, Wairarapa 8
Nelson, Marlborough, Canterbury, West Coast 11
Otago, Southland 4
TOTAL 76
Table 1. Location of services participating in survey
Participants were asked to estimate how many clients they had seen in 2018 “on issues relating to
consumer credit, debt or loans”. Services range from quite small, with 7 seeing less than 50 clients in
the year, to very large. Results are shown in Table 2.
Number of clients in 2018 Number of organisations
Less than 50 7
51-100 18
101-200 14
201-300 12
301-400 10
More than 400 15
TOTAL 76
Table 2. Number of organisations by number of clients seen in 2018
Of those agencies reporting more than 400 clients, actual numbers of clients ranged from 500 to 1000,
with one very large organisation reporting 1700 clients in 2018. A moderate estimate is that the
agencies responding to this survey had 15,000 debt-related clients in 2018.
Clients seek budgeting and financial capability support for a whole range of reasons, and not all of
them involve debt. The survey asked what proportion of clients seen by organisations had non-
mortgage debts. Around two-thirds of agencies noted that between 80 and 100% of clients had such
debt. Another 20% stated that between 61 and 80% of clients had debt. The remainder of agencies
(around 12%) thought that between nil and 60% of clients had debt at the time of consultation. These
figures are very significant. Most clients who arrive at budgeting services hold non-mortgage debt.
The implications of this large figure are considered later in the report.
9Most agencies report that women make up more than half of all their clients. The modal figure cited
in the survey response was 70%, with a range from 50% to 100%. The proportion of Māori clients
differs significantly across the country, ranging at agency level from 10% to 100% of all clients.
Northland, the Waikato, East Cape and parts of Whanganui/ Manawatu cite very high rates of Māori
clients, with low figures in the South Island. Rates of Pasifika clients also vary greatly, with many citing
around 10% of Pasifika clients and a few agencies noting up to 50% in South Auckland and the Waikato.
Between 0 and 10% of clients are of Asian origin. Finally, a few Auckland agencies note elevated rates
(20-30%) of new migrants and refugees, but most have few such clients.
Participant organisations were asked to describe their clientele in their own words. Many participants
noted that there was a wide diversity of people seeking assistance. The following three quotes sum
up many of the ‘diverse’ characteristics:
Great diversity of clients and what they require help with. Typical thing is they are all over
committed and not getting enough income to meet the basic requirements for family life.
We have a diverse range of clients who come from all walks of life - from high income earners,
vagrants, beneficiaries, people with learning, speech & hearing difficulties & those with mental
health issues.
We have a great diversity of clients that present, although they all have one common thread
for about 90% and that is they have low disposable income, rent costs are high and for the
10% there has been a major event in their lives which has altered their finances.
Many come to the financial capability and budgeting agency in dire straits:
Majority are seeking help as a last resort, about to be evicted from their rental, power about
to be cut off, no money for food, debt collectors knocking at the door.
They often have little knowledge and understanding of financial products, high
accommodation costs, casual employment, have children to support, pressures to assist
extended family.
Carrying a heavy weight -they have nowhere else to turn. They don't know what to do,
overwhelmed, some are horrified it has come to this, some have got loans to buy food for their
families.
Consumer debt is a major driver of those seeking assistance.
Most of our clients have consumer debt or utilities debt, with the average debt being $10,000.
Tempted by consumer culture but not able to afford the goods they buy. Some are genuinely
under hardship. Many do not fully understand what they are committing to in loan contracts,
or they are desperate.
Across all socioeconomic levels including homeless. Usually have debts that are in arrears or
with collection agencies.
There are no real characteristics of clients who present with debt other than debt is mostly
historical collection agency debt, cumulative large power bills, and large weekly car payments
10which is not provisioned for in their income. Significant increase in clients who were previously
employed and unable to continue paying these loans/debts on a benefit. Increase of assistance
with KiwiSaver Hardship applications.
It is Māori and Pasifika clients who come to seek advice on to control debts. They are bound to
take loans and also because of family problems. They take these loans because it is very easily
available
Participants discuss the drivers of debt, from buying food to aiming for the latest consumer goods.
Factors that put clients into debt include family demands, mental illness, a sudden change in
circumstances (especially unemployment or illness), chronic unemployment (as one person put it:
“those who have been out of work for a long time or have never had a job, and are more or less
resigned to the situation“) disability and being on benefits, which limits spending opportunities
markedly. The participants emphasise that debt is a problem for people of all ages, from youth,
through younger people forming families, older adults and pensioners.
11Client debt
Figure 2 below provides a summary of the types of debt held by presenting clients, by number of
agencies, by frequency of debt.
70%
Proportion of agencies citing number of clients with debt by frequency
60%
50%
40%
30%
20%
10%
0%
0-20 21-40 41-60 61-80 81-100
Proportion of clients with levels of debt by type
Student debt
Unsecured overdraft, bank loan or credit card debt
Debt to store or consumer card (e.g. HP, QCard)
Debt relating to financing a car
Debt to Work and Income
Debt to Inland Revenue (tax, GST, child support)
Medium cost finance 'cash' loans (up to 50% interest rate)
High cost finance 'cash' loans (over 50% interest rate)
Debt to family, friends or employer
Debt incurred through direct sales (e.g. retail trucks)
Other, please specify
Figure 2. Presenting debt, by agency and proportion of clients.
As an example, take the aqua-shaded line denoting ‘Debt to Work and Income’. In the graphic, less
than 10% of agencies report that 10-20% of clients have such debt, whereas over 40% of agencies
report that 80-100% of clients are in debt to Work and Income. The blue line travelling from top left
12to bottom right denotes student debt. Over 60% of agencies report that 0-20% of clients have no
student debt, while no agencies report that all clients have such debt.
Looking to the types of debt most commonly held by clients, in order from most to least common,
they are: Work and Income debt, store or consumer debt, direct sales debt (e.g. retail trucks),
overdraft or credit card debt, medium cost finance, high-cost finance, IRD debt, debt to family, friends
or employer and student loan debt.
Other debt types were also noted by participants. These included Ministry of Justice fines and fees,
power suppliers and other utilities, mortgage debt, tenancy debt, debt to services (e.g. doctors,
dentists, schools). Some of the day to day debts are incurred because “money often used to pay huge
loan repayments”.
Participants were asked to “please describe the common sources of the debt burden of a person
seeking assistance from your agency”. The responses reflected a large diversity of debt types and
patterns. Other than factors already mentioned, the responses emphasised: the growth of multiple
loans and the inability to meet minimum payments, the growth of ‘quick’ (payday) loans, the increase
in indebtedness and repayment requirements to Work and Income, borrowing for unexpected costs,
debt to utility companies and loans taken out in response to advertising of ‘easy’ finance.
Participants were asked to estimate, on average, how many different loans their clients had at the
point of entry to the budgeting agency. The results are shown in Figure 3.
6
23
1 loan
2 loans
24 3 loans
4 loans
5 or more loans
20
Figure 3. Average number of loans held by presenting clients, by agency (n=73)
No agencies estimated the average number of client loans to be one only. Most thought that clients,
on average, held three, four, five or more loans of all kinds, the mean figure being 4 loans.
This section has examined the types of loans held by clients and the number of loans by client, on
average. The next section examines what we have called ‘high-cost loans’.
13High-cost loans
In the survey, high-cost loans were defined as those with interest rates in excess of 50%, often taken
out on a short-term basis. The growth of high-cost debt in Aotearoa New Zealand in the past few years
has been marked, with the emergence of a large number of agencies offering easy-to-access
unsecured debt at high and compounding interest rates, plus fees and penalties. High-cost loans are
easy to distinguish from ordinary finance loans, as noted in MBIE’s June 2018 discussion paper on the
review of consumer credit regulations (p. 11):
There is a disjunction between most finance companies, which charge up to around 36% p.a.,
and high-cost lender rates that range from 100-400% p.a. for a 3-12 month loan, and are many
hundreds of percent interest p.a. for a short (under six week) loan.
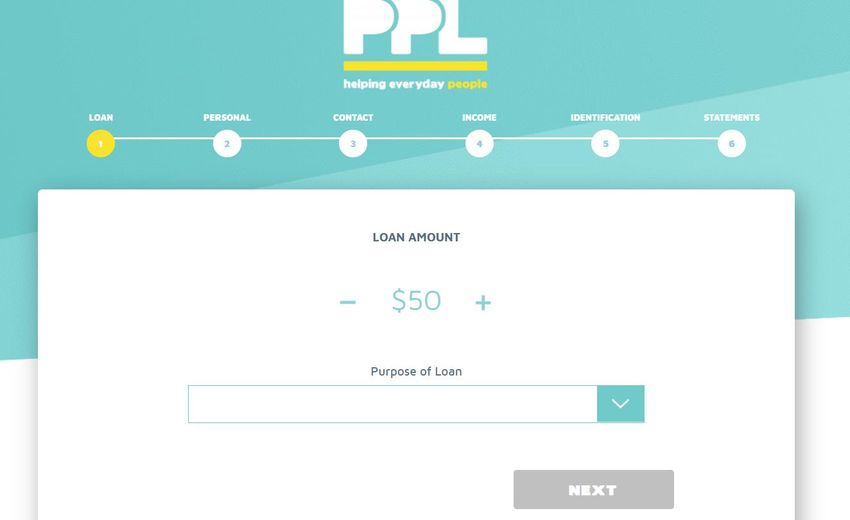
Companies such as DTR, Cash Converters, Pretty Penny, and others, as well as retail trucks, may supply
high-cost loans. They are often friendly and inviting, offering easy money online or in shopfronts. The
screenshot below is of Pretty Penny (PPL), one of the lenders cited several times by survey
respondents, “helping everyday people”. This is the landing page for people who click ‘apply’ from a
Google search. It asks the person to cite how much they wish to borrow and the purpose of the loan.
Purposes listed are: car maintenance (rego), council and water rates, education expenses, family
emergency, home repairs, household goods, medical/dental, other, phone bill, utilities, rent/bond or
travel expenses.
The terms and conditions are available on another page. In this case, on a $100 loan paid urgently for
the period of two weeks, the repayments will include set-up and establishment fees ($88), interest at
1% per day (365% per annum) and - potentially - same-day deposit and extension of first payment fees
of $44. All fees are part of the debt and are subject to interest. After two weeks, if the loan is paid
back on time and in full, the amount due will be up to $264.48 – more if the daily interest rate is
compounded (i.e. interest is paid on each day’s interest), which it usually is. If not, penalties apply. It
is not clear if borrowers are required to read and understand the terms and conditions before
committing to the loan.
14This is just one example of a high-cost loan. Companies have essentially been able to charge whatever
fees and interest rates they like, in an essentially unregulated market. Also, a significant portion of
those seeking assistance from local financial capability and budgeting agencies have one or more high-
cost loans, with most having two or three.
30
25
20
Axis Title
15
10
5
0
1-20% 21-40 41-60 61-80 81-100
Axis Title
Figure 4. Participants’ estimates of proportion of clients with high-cost loans
There was significant variance in the responses to this question by agencies. Some suggest that the
visibility of high-cost lender outlets in town centres affects the number of loans. Others think that it is
about how quickly communities have embraced this type of loan, with big city dwellers more likely to
take on this kind of debt. There is little doubt also that high-cost debt is targeted at some communities,
for example Pasifika communities who face cultural obligations to supply funds to support families in
other countries.
Participants were asked to rank the reasons that clients take out high-cost debt, from the most
common reason to least common. The results of the ranking exercise are shown in graphic format in
Figure 5, showing the top 3 rankings only. The list of reasons covered is not comprehensive, covering
about 90% of reasons.
1540.00% To cover living costs or household
expenses (e.g. food)
To meet the cost of a vehicle
35.00%
To cover rent
30.00%
To purchase a household appliance
25.00%
For a family event (e.g. wedding,
funeral)
20.00% To cover costs relating to children
(school uniforms, camps etc)
To travel (e.g. to see family)
15.00%
10.00%
5.00%
0.00%
RANK 1 RANK 2 RANK 3
Figure 5. Reasons for taking out high-cost loans ranked (by participants), top 3 ranks
The strongest reason by a distance is living and/or household costs, followed by housing rental costs,
vehicle costs and purchase of household appliances. From the perception of the agencies, then, the
majority of high-cost loans are taken out to meet ordinary living costs rather than special or
emergency events that arise unexpectedly.
A picture emerges from the answers above of high-cost debt filling a gap between what it costs a
whānau to meet their basic needs, and the income they have available to pay for those things.
This is of concern because if incomes are so low that basic costs cannot be met, the very high fees and
charges that need to be repaid over a short period of time will put further strain on the whānau
budget.
Participants note that other common reasons for borrowing from high-cost lenders include to
consolidate debt or pay off other debts, to meet medical costs and to meet the costs of addictions
such as cigarettes and gambling.
The next question in the survey addressed the drivers of high-cost loans. There is a need to understand
why this type of debt has risen so quickly over recent years. Figure 6 charts the views of the agencies
about the main reason their clients take out high-cost loans.
16Other, please specify
Friendly advertising
To borrow a small amount for a short term
To pay off other debt
Convenience and quick processing
Unable to obtain credit in other ways
0 10 20 30 40 50 60 70 80
Figure 6. Opinions of agencies about why clients take out high-cost loans.
Not surprisingly, given that clients primarily borrow to meet normal household costs, they tend to
borrow from high-cost lenders as the only avenue available to them. A second reason is the
accessibility of these loans. They are available quickly (at additional cost, in the example given above)
and quite easily. Around half of agencies are of the view that many clients take out high-cost loans to
pay off other debt, or to borrow a small amount for a short time. A range of other reasons are given
by agencies, including pressure from salespeople, family problems, ease of borrowing and the fact
that it can be done online.
Agencies were asked what proportion of their clients were able to pay off their high-cost loans within
the original timeframe and without further borrowing. In total, 70 of the 74 agencies who responded
to this question noted that 1-20% of clients (55 agencies) or 21-40% of clients (15 agencies) were able
to repay their high-cost loans within the original agreement. The main implication of this low rate of
on-time repayment would be that clients would face further fees and penalties added onto the cost
of their borrowing. Default in the high-cost loan sector is a costly business.
Complicating this picture is reports from agencies that many clients hold more than one high-cost loan
at a time. A small number of agencies (3) report that 80-100% of clients have more than one loan, but
most agencies (29) report that only 1-20% have more than one. Eighteen agencies report 41-60%, and
14 agencies report 21-40%, of clients have more than one high-cost loan.
In a further question on this, two thirds reported that most often multiple loans were held with
different lenders, or (25%) about half and half with the same or different lenders. This means that
local financial capability and budgeting agencies were obliged to deal with a range of agencies in trying
to negotiate repayment of the loan debts.
Agencies were asked about the level of understanding clients had of the fees and costs incurred in
taking out a high-cost loan. The responses are shown in Figure 7 below.
1745
40
35
30
25
20
15
10
5
0
Very poor Poor Fair Good Very good
Figure 7. Level of client understanding of high-cost loan fees and costs, as reported by agencies (n=76)
The overwhelming response was that clients had a very poor, or poor understanding of the costs they
incur in taking out a high-cost loan. As these costs can escalate very quickly, as shown in the ‘Pretty
Penny’ example above, this is of significant concern.
Other, please specify
Their original lender encouraged them to take out new
loans
They borrow for new and different reasons
They borrow to repay prior debt (serial borrowing)
They borrow because their general financial situation has
worsened
0 10 20 30 40 50 60 70 80 90 100
Figure 8. Reasons given by clients for holding multiple high-cost loans, agency reporting (n=76)
Figure 8 above probes further into multiple high-cost loans, and asks agencies to list all the reasons
that clients give for having such loans. The responses indicate that clients generally give more than
one reason. Over 80% borrow because their general financial situation has worsened. This may be
driven either by the need for new and different spending (58%), to repay prior debt (66%) and/or by
the lender encouraging them to take out new debt. Other reasons given include:
They are so desperate to get cash.
Their benefit does not cover their cost of living
They had no other option, they needed essentials for their children i.e. medication, food,
clothing
18Driven by addictions
These companies make it so easy for clients with poor credit to borrow money.
The agencies were also asked: “What proportion of the clients you have seen in the last twelve months
have three or more high-cost loans (with any lender)?” The aim of this question was to probe the
extent of multiple loans held by client. The responses are shown in Figure 9 below.
60%
50%
40%
30%
20%
10%
0%
1-20% 21-40% 41-60% 61-80% 81-100%
Figure 9. Proportion of clients with three or more high-cost loans (estimate by agencies) (n-76)
In 60% of agencies, only 1-20% of client have three or more high-cost loans, but in 40% of agencies, a
higher proportion of clients have such loans, including one (smaller) agency reporting that 81-100%
of clients have three or more loans.
Agencies were also asked to estimate the value of these high-cost loans. The results are shown in
Figure 10 below. While the amounts borrowed at high-cost tend to be small, this also means that, with
mandatory costs added, the actual amount repaid can be many times the amount borrowed,
especially if the client defaults on a loan instalment or repayment. In Figure 10, more than half (55%)
on average have borrowed less than $1000, while only 3% have borrowed more than $10,000. The
median amount borrowed is $600-1000.
19More than $10001
Up to $6001-10000
Up to $3001 - 6000
Up to $1001-3000
Up to $1000
Up to $600
Up to $300
0 5 10 15 20 25 30
Figure 10. Amount borrowed on high-cost loans (agency estimate % of total agencies)
This section of the report has shown information provided by local financial capability and budgeting
agencies about high-cost loans and debt. The following section examines some broader issues around
high-cost loans and debt more generally, and asks for agency views on a number of matters.
20Implications of debt
The ability to borrow money is important for a wide variety of reasons in Aotearoa New Zealand today.
It can be completely unproblematic, and indeed can lead to financial gain (for example mortgage
borrowing), important goods (e.g. a car to get around in) or timely spending on important items. On
the other hand, it can quickly become a millstone around the necks of borrowers, of repayments are
unable to be made on time. We were therefore interested in how local financial capability and
budgeting agencies viewed high-cost debt, and in particular whether it was a net positive or a net
negative in the lives of their clients. This was particularly important because earlier answers have
made it clear that this is often the only kind of debt available to low income whānau.
100%
90%
80%
70%
60%
50%
40%
30%
20%
10%
0%
Worse off Much the same Better off
Figure 11. Views of agencies about effects of debt on overall client wellbeing
The response we received was unequivocal: over 90% of the agency responses stated that clients were
worse off in an overall sense (not just financially) as a result of taking out high-cost loans. See Figure
11.
Only 3 agencies thought that, overall, people were better off from having borrowed a high-cost loan,
and 4 thought that the situation of borrowers remained much the same regardless of whether or not
they have taken out high-cost loans.
The survey probed further on this issue, asking the agencies what proportion of their clients would
have been better off if they had been denied access to a high-cost loan. Nine participants noted that
up to 20% would have been better off. Five thought 21-40% would have been better off without the
high-cost loan. Fourteen thought between 41-60% would have been better off. Overall, 45 participants
thought more than 60% of clients would have been better off if they had been denied access to a high-
cost loan.
These figures are interesting but need to be read within context. The local financial capability and
budgeting agencies have the role of sorting out often complex financial debt problems for their clients,
and it may seem as if the loans were not worth the problems they caused. But, presumably, the clients
did think so at the time, and others have managed to repay their high-cost loans without getting into
difficulties.
21Agencies were asked what alternatives exist for their clients. Responses were of five kinds. The first
noted that there were no options: “very few, they can’t get other loans”:
There are not very many alternatives out there for clients, Loans are so easy to access these
days and sometimes this is the only way out they can see, especially if they are too ashamed
to see a Budget Navigator/Financial Mentor until after the fact, by this time it is too late to
change your mind - you are stuck with this loan.
The second option emphasised that financial mentors (budget advisers) were able to help alleviate,
mitigate or resolve debt problems:
Negotiate with creditors, no interest loan, following a budget
They needed to engage with budget service sooner, we could have ensured wrap around
services with social workers & food plan to assist with addressing needs. In some cases, clients
have had income insurance and not realised, they could have made use of their hardship
application as part of their purchase agreement for cars they are repaying. WINZ could have
reduced their advance offsets & debt repayments to minimum repayment amounts instead of
maximum. There are so many ways we could've relieved pressure earlier.
Consider discussing with existing creditors if they would consider short term lowering of their
current debt repayments for a specific period to allow them to get back on track with their
budget.
Many of the responses mention Work and Income. Advances from that agency have to be paid back
(and there is no discretion to write off money owed) but there are no interest charges or set-up costs.
However:
They could also talk to their WINZ Case Manager about their situation, but some feedback we
are getting is that they feel judged by WINZ staff and they are not approachable.
A number of suggestions are made about what might be seen essentially as a national loans scheme
through Work and Income with reasonable terms and conditions:
They currently obtain advances from WINZ which they pay back at no interest, why not expand
this scheme. Especially for total dental care or debt consolidation loans.
Borrowing from Work & Income for car repairs, rent arrears, power arrears and food
insolvency.
Such a scheme might be quite separate from the benefit scheme and may be available to everyone.
In the absence of such a government scheme, a number of microfinance low and no interest loans
have sprung up in recent year, and financial mentors see these as a viable alternative for some:
No interest lending through Sal Army, Good Shepherd, Nga Tangata Micro Finance, but
generally can only be accessed through Social Service or Financial Mentor. W&I advances are
not well known to be available to non-beneficiaries.
22There are some low-cost lenders around but you must fit the criteria and a lot of people who
come to our service would not fit the criteria. They would have too much debt and not enough
income. There is limited access to nil interest loans, but they are required to demonstrate that
they can afford to repay the loan. Insolvency is often the only avenue left for them.
Reorganising the whole budget with advice and doing hardship repayments with current
creditors to release some cash---Nga Tangata loans are interest free. If urgent we can organise
a stop payment for a short time and use that money.
Other non-financial help in the community, such as foodbanks or goods to support whānau are also
important tools in the arsenal of some of these agencies.
Finally, there are a range of insolvency options that are available when the debt burden becomes too
large. These are explored in an ensuing section.
23Debt collection
Agencies were asked what proportion of their clients with high-cost loans had their debts referred to
a debt collector. Estimates were given across the spectrum, from 1-20% of clients right up to 80-100%.
There are shown in Figure 12 below.
25
20
15
10
5
0
1-20% 21-40% 41-60% 61-80% 81-100%
Figure 12. Proportion of clients with high-cost loans referred to a debt collector by number of agencies
(n=76).
On average, across the agencies, it appears that around half of clients have been referred to debt
collectors. This section briefly considers issues around debt collection approaches.
Debt collection doesn’t come free. Agencies are almost unanimous (96%) that it is very common
(somewhat common = 4%) for debt collectors to add additional fees and costs to the debt, in the
process of seeking to have it repaid.
As well, it is common for interest on debts to continue to be charged when they have been passed to
a debt collector. With only two or three dissenting voices, budgeting agencies decried this practice:
NO NO NO! We need to stop the clock and allow people to take responsibility for what they
are trying to deal with without ongoing penalties.
No The debt has been sold on with the Debt Collection fee added that should be the final
amount owing.
Definitely not. Understand a fee, but this too should be reasonable and standardised, there is
huge variation between collection agencies.
Feel all interest should be frozen until repayment plan is established. Companies who sell debt
to collection companies - collection companies should pay for privilege of collecting the debt.
No. If it has gone to a debt collector because they could not pay anyway why carry this on?
24No. The company that has passed the debt on has cut their losses and were not getting paid
at all so recovering the debt that is outstanding at the point of being passed on to debt
collectors should suffice. If the debt collectors are charging interest it just makes it even harder
for the client to repay the debt and means that they are in the same position as when the debt
was with the originating company.
No, have found also that the creditor and debt collection agency set fees as a percentage and
they would not be regarded as fair and reasonable. example - mortgagee sale - $32, 000 added
and client had 2 letters only, insolvency will be only option for client.
The practices of debt collectors are an important issue for local financial capability and budgeting
agencies. Aside from the question of collection costs and interest, the survey explored what other
practices by debt collectors were experienced by agency clients, whether helpful or punitive. Figure
13 below outlines the responses provided, by number of agencies.
Talking to neighbours
Other, please specify
Offers to defer or remove interest
Helpful approaches to resolve the debt
Offers to write off part of the debt
Knocking on doors
Recording bad credit ratings
Letters that are frightening or threatening
Phone calls
0 10 20 30 40 50 60 70
Figure 13. Count (number of agencies) of debt collection practices experienced by agency clients
(n=76).
The most common practices cited in Figure 13 are also the most punitive, except that an old practice
of knocking on neighbour’s doors appears to have been significantly reduced due, perhaps, to privacy
concerns. A couple of agencies commented that debt collectors can show a human face:
We do have the odd collector who is quite engaging and wants to help their customer when
applying for hardship.
Some companies can be helpful when they know the client is working with a budget adviser to
try to resolve the debt.
But most of the “other” practices cited by agencies are punitive. Several noted debt collectors
approaching employers about the person’s debt. Some note demands for direct payments from
benefits, leaving “no essentials money available (food and rent)”.
25Other practices include the use of private investigators, attachment orders, Facebook ‘stalking’, text
messaging, emails or threats to repossess goods.
A couple of agency responses noted that clients make it harder for themselves:
Mixed results due to persons ability to articulate their personal situation
Unfortunately, many of these clients ignore the first approaches and only seek help when there
is nowhere else to avoid paying and need to seek other sources to loan money
Finally, several agencies outlined some disturbing financial practices:
Write off one part but replace it with a MUCH larger amount. BULLY tactics.
Threats to repossess, offers to defer interest if the client takes out more debt with same
company
Threatening to take further action BUT if they pay in full including a little bit of interest then
no further action will be taken.
The issue of debt collection evoked quite passionate responses from local financial capability and
budgeting agencies, and is worthy of further study. One person noted that these questions should
really be directed at the clients themselves, so a future study may involve interviews with clients.
26Insolvency
Insolvency in its various legal forms is a solution for people who have got into debt to such an extent
that they have no possibility of repaying it under normal conditions. Agencies were asked what
proportion of clients with high-cost loans were recommended to, or seriously considered, going into
an insolvency procedure to address their debt situation. Responses are outlined in Figure 14 below.
40
35
30
25
20
15
10
5
0
1-20% 21-40% 41-60% 61-80% 81-100%
Figure 14. Proportion of high-cost loan clients recommended for insolvency procedure by number of
agencies (n-76).
Although responses indicated such recommendations were at the lower end of the scale (mode = 1-
20%, median = 21-40%), there were still a number of agencies reporting multiple recommendations
for use of such procedures. The actual procedure selected varies according to the means of the client
and the size of the debt. The most often considered procedures (by % of total agencies) are outlined
in Table 3 below.
No Assets Procedure (owe less than $47,000 and have no means to pay it off) 77
Summary Instalment Order (owe less than $47,000 and are able to pay it off) 18
Bankruptcy 5
Table 3. Most considered insolvency procedure by % agencies
Agencies were also asked whether there were any reasons why insolvency procedures were not
considered a viable option. The reasons given fell into five main categories, which can be summarised
as ethical matters, usefulness, access to other avenues to clear debt, using budget discipline to repay
and the impact of insolvency (both practical and personal) on the lives of the people.
The ethical issues raised by agencies related to both “fairness to creditors” and the responsibility of
debtors as debts are “taken knowingly and the clients have commitments to pay that”. There were
only a small number of such comments.
Agencies question the usefulness of insolvency in many cases:
27The clients were managing to repay the debts. You can only do a NAP once in your life, so if
you owe a minimal amount it would not be worth proceeding. Also, if the company has been
contacted they may review their payments. Also, an SIO needs a surplus in the budget. Most
clients don't have one but just manage to get on with it and repay the debts.
Can't enter SIO with secured debt, NAP not that helpful if not making payments on any debt
Debts that were owed to the government made it not worth it.
Other avenues to relieve debt include a range of microfinance community loan models, the use of
KiwiSaver hardship withdrawals and further options.
Insolvency is only considered after budgeting has failed - even when the client requests it.
Although most people ask for help with KiwiSaver withdrawal nowadays.
Many people choose KiwiSaver financial hardship over insolvency
This depends on the client’s personal and living situation, we have clients that have done NAPs,
and we try to negotiate with creditors in the first instance if clients can afford to repay some
debt weekly. However, some clients avoid creditors and change their mobile numbers so
creditors cannot get hold of them and don't want to address their debts. We have been able
to help clients with Debt Relief Loans through Nga Tangata Microfinance. This is the best
option for those who only owe $2,000-$3,000.
In many cases agencies prefer to work with their clients on alternatives to insolvency.
We do not recommend Insolvency if we believe the client will be able to repay the debt in a
certain time frame, or their circumstances are likely to change. E.g. within the year they may
have found work.
Ability to actually clear debt with a clear focused budget.
Only one client in +300 clients in 2018 proceeded to Insolvency. Generally, we have been able
to work through debt, come to amicable arrangements with creditors and avoid this action.
We consider all options but negotiation with creditors is best option.
Insolvency is starting to affect ability to get housing. Last resort.
Finally, many responses emphasise the personal and financial ramifications of insolvency. The first few
responses below touch on issues of stigma, shame and potential discrimination:
Stigma of being bankrupt.
Shame, public information, credit record.
Some clients were embarrassed about taking this course of action - a cultural issue.
Some clients thought it was shameful, or they would not be able to have a bank account so
how would they get their benefit. Some just would not even consider going Bankrupt because
28it would be advertised in the newspaper. SIO was accepted as OK as clients felt they should
pay back what they had spent so it was fair.
Yes, the stigma, can't travel without permission
The second set of responses examine the actual potential effects of insolvency:
I don't believe in these procedures as clients will not be better off in the long run, their names
will be tarnished in the future, they will have trouble long after they have paid their debt in
full. I believe in negotiating with the creditor to set a plan that is both acceptable and
achievable by both parties.
Impact on future work opportunities.
We consider all options but negotiation with creditors is best option. Insolvency is starting to
affect ability to get housing. Last resort.
Effect on credit rating
Risk to employment, not able to open a new bank account.
Clients have car as security and are scared of losing it.
Decisions around insolvency involve agencies working with clients to weigh up alternatives. While
insolvency does have some advantages, it is reasonably clear that there are also significant
disadvantages to the individuals concerned, both material and personal. The main impression from
the qualitative responses is that budgeting agencies prefer to help individuals repay their debts,
through negotiation with lenders and good budgeting practices, rather than opting for insolvency,
where an alternative is possible.
From a regulatory perspective, there appears to be significant costs to insolvency options for the
individuals and whānau concerned. There may be a need to rethink insolvency systems in Aotearoa
New Zealand, as too many people appear to be stuck “between a rock and a hard place”.
29Making complaints
One third of agencies reported that one or more of their clients with high-cost loans have “challenged
the claims of the lender either by legal action or by complaint to regulatory authorities”. To get a
clearer picture, agencies which reported such action (n=19) were then asked how many client files
resulted in a complaint about lender behaviour to either the Commerce Commission or a Dispute
Resolution Scheme. Responses are provided in Figure 15 below.
70%
60%
50%
40%
30%
20%
10%
0%
Most Many About half Some One or a very
small number
Figure 15. Percent agencies reporting general number of complaints by clients (n=19)
One agency reported most clients complained, and one “about half”. Most, however, reported only a
few or one or two complaints were made by their clients.
Eighteen of the agencies indicated that complaints were made alleging a breach of the Credit
Contracts and Consumer Finance Act. Four agencies alleged a breach of the Fair Trading Act. One
agency noted that the complaint was about a retailer offering a cashback to a client, but on condition
that they added some more goods to the bill.
One complaint was made on the basis of the common law, which was where a creditor was “trying to
make a widow pay an account of her late husband even though she was not a signatory to the debt
and did not benefit from the goods”.
Two other complaints were noted. One noted that clients do not always know what they are signing.
Of the 19 agencies responding in this section, 14 reported they would be most likely to complain to
the Commerce Commission, and five to a Dispute Resolution Scheme.
Levels of satisfaction with the outcomes of complaints about lender behaviour are outlined in Figure
16 below.
30You can also read