Working Paper Series The link between labor cost and price inflation in the euro area
←
→
Page content transcription
If your browser does not render page correctly, please read the page content below

Working Paper Series
              Elena Bobeica, Matteo Ciccarelli,   The link between labor cost and
                         Isabel Vansteenkiste
                                                  price inflation in the euro area

                                                   No 2235 / February 2019

Disclaimer: This paper should not be reported as representing the views of the European Central Bank
(ECB). The views expressed are those of the authors and do not necessarily reflect those of the ECB.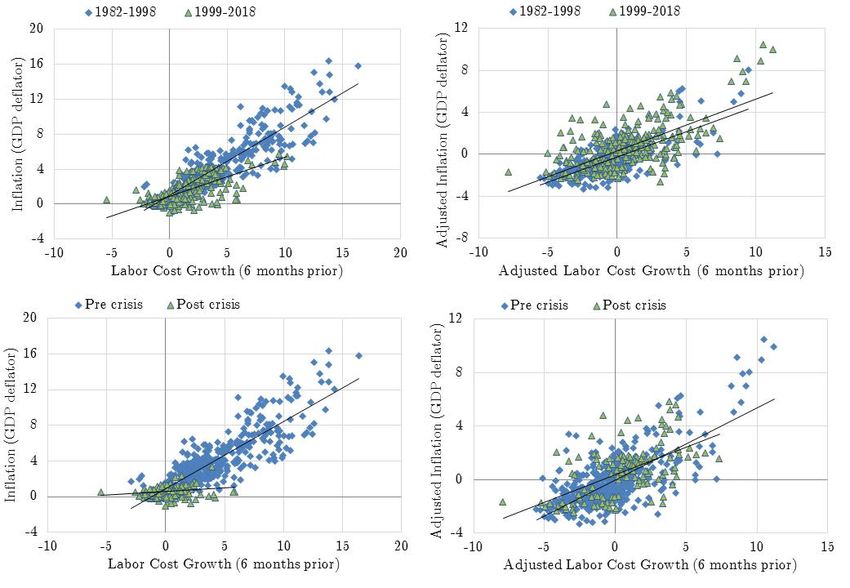
Abstract
          This paper documents, for the first time in a systematic manner, the link between labor
      cost and price inflation in the euro area. Using country and sector quarterly data over the
      period 1985Q1-2018Q1 we find a strong link between labor cost and price inflation in the
      four major economies of the euro area and across the three main sectors. The dynamic
      interaction between prices and wages is time-varying and depends on the state of the econ-
      omy and on the shocks hitting the economy. Our results show that it is more likely that
      labor costs are passed on to price inflation with demand shocks than with supply shocks.
      However, the pass-through is systematically lower in periods of low inflation as compared to
      periods of high inflation. These results confirm that, under circumstances of predominantly
      demand shocks, labor cost increases will be passed on to prices. Coming from a period of
      low inflation, however, this pass-through could be moderate at least until inflation stably
      reaches a sustained path.

      JEL Classification: C32, E24, E31
      Keywords: Inflation, pass-through, labor costs, structural VAR, euro area

ECB Working Paper Series No 2235 / February 2019                                                     1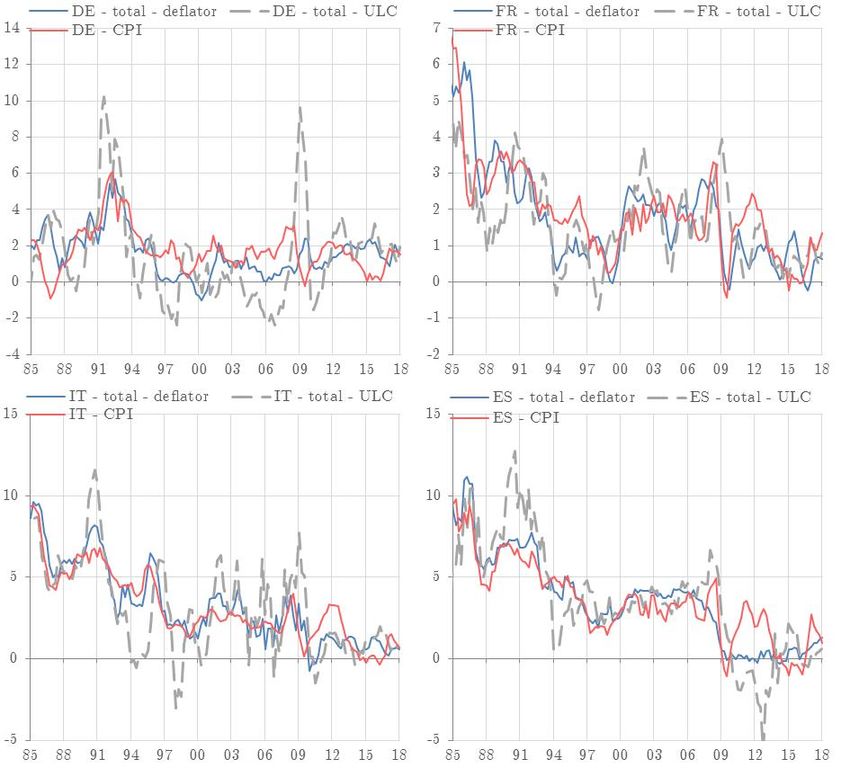
Non-technical summary
This paper documents and analyses, for the first time in a systematic manner, the link between
labor cost inflation and price inflation in the four largest euro area countries. Having a deeper
understanding of the signal that labor cost developments provide for the inflationary process
is of key relevance from a policy perspective. When explaining past inflationary dynamics, as
well as the inflation outlook, policy makers often invoke a so-called cost-push view of inflation,
whereby labour cost inflation (i.e. wage inflation adjusted for productivity developments) is
considered to be one of the main causes of price inflation.
    In the US, both the academic literature and the Federal Reserve have however cast doubt
on this link between labor costs and inflation, in particular at shorter horizons. First, the US
literature finds no conclusive results on whether empirically, labor costs tend to precede or
follow prices. And second, studies suggest that the relationship between labor cost inflation
and price inflation may have weakened over time, potentially due to an improved anchoring of
inflation expectations as the credibility of the monetary policy would play a larger role for price
setting than cost pressures (see Peneva and Rudd (2017)). When looking at the theoretical
literature, these findings are rather unsurprising. Indeed, in the shorter run it is not at all
obvious that rising labor costs should translate into price inflation. In New Keynesian models,
for instance, the correlation and lead-lag relationship between labor cost inflation and price
inflation can be expected to depend on the relative degree of the prevailing price and wage
rigidities, which differ in time, driven for instance by the low/high inflation regime prevailing
in the economy or the type of shock that hits the economy. As a result, we should in fact
expect that the link between labor cost inflation and price inflation varies across time, across
countries and also across sectors.
    We aim to contribute to the empirical literature by providing a systematic investigation for
the euro area and provide an answer to the following questions: (i) does a link between wages
and prices exist in the euro area at a cyclical frequency? (ii) does this link depend on the state
of the economy (in particular on the level of inflation)? (iii) does the link depend on the shocks
hitting the economy? We make use of quarterly data over the period 1985Q1-2018Q1 at the
country-wide level and for the 3 largest sectors in each economy (manufacturing, construction
and services).
    Overall, our results show that in the four biggest euro area countries, contrary to the US,
there is a clear link between labor cost and price inflation. This result is confirmed across a
battery of approaches and tests. We conduct analyses that have become commonplace in the
US literature. More specifically, we (i) look at the cross-correlation between labor cost and price
inflation, (ii) test Granger causality, and (iii) conduct both a conditional and unconditional
forecast evaluation. Subsequently, we consider the link between labor cost and price inflation

ECB Working Paper Series No 2235 / February 2019                                                  2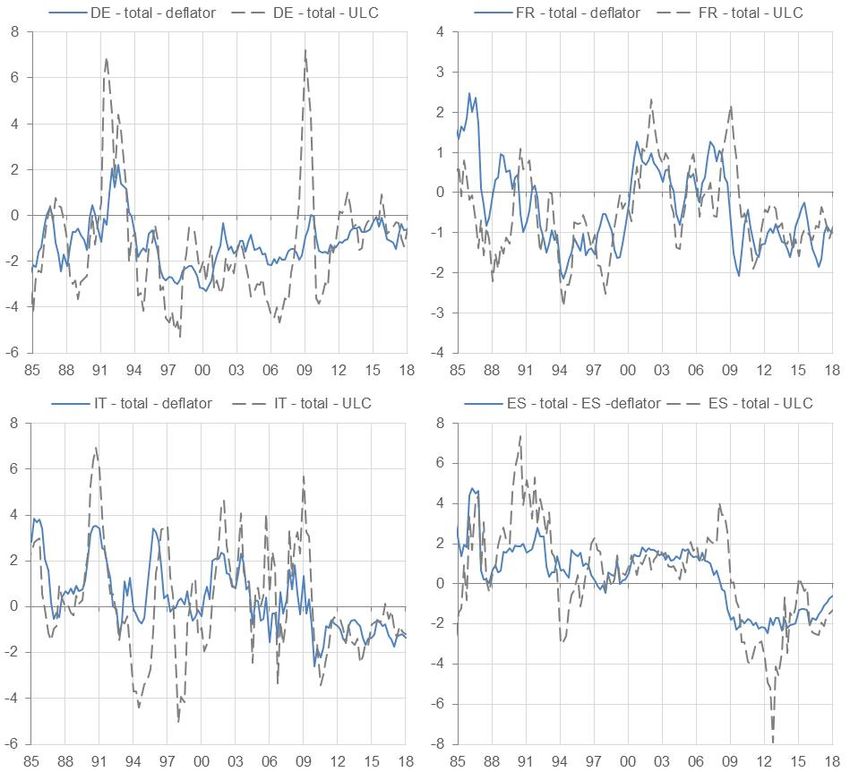
in a dynamic and conditional set-up by estimating small-scale VAR models for each sector of
each country. This exercise confirms the existence of the labour cost - price inflation link in
the analyzed countries.
    Our results also suggest that this link depends on the inflation regime prevailing in the econ-
omy: when inflation is high, the link becomes stronger. Finally, the link is shock-dependent:
when the economy is hit by a demand shock, there is a clear and relatively strong link between
labor cost and price inflation. This is not the case for supply shocks, where the link appears
to be less conclusive.
    Our results have important policy implications. In particular, these findings suggest that
monitoring and analyzing labor cost developments in the euro area is indeed relevant to un-
derstand the evolution of price inflation. However the importance of these developments does
depend on the level of price inflation and on the shocks that prevail in the economy. In an
environment of expansionary demand the information contained in labor cost developments in
much more relevant for price inflation than when the economy is hit by supply-type shock. Also,
when coming from a prolonged period of low inflation, this pass-through could be moderate
until inflation stably reaches a sustained path.

ECB Working Paper Series No 2235 / February 2019                                                  3
1        Introduction
To gauge inflationary pressures, policy makers generally pay close attention to labor cost
developments. A key reason has been the widely held view that labor cost inflation (i.e. wage
inflation adjusted for productivity developments) is one of the main causes of price inflation.
From a theoretical perspective, this assumption represents the post-Keynesian cost-push/price-
markup view of the inflationary process whereby wage increases in excess of productivity are
seen as putting upward pressure on prices, and wages are the exogenous variable determining
the future direction of inflation.1
        Such a cost-push view of inflation was often invoked in the 1970s to explain inflationary
dynamics2 and to this date often remains the underlying assumption in policy communication
on the outlook for inflation. For instance, in the years leading up to the 2008-2009 global
financial crisis, labor cost dynamics were closely monitored to sniff out signals of a possible
build up of excessive inflation (ECB (2004)), in part due to concerns of a return of the 1970s
type wage-spiral. In the aftermath of the Great Recession, with concerns having shifted from
perceiving inflationary and labor cost pressures from being too high to too low, forecast nar-
ratives see a pickup in labor cost growth often as a necessary condition for rising inflation (see
for instance ECB (2018)).3
        While these labor cost-based explanations of inflation dynamics continue to take a promi-
nent place in the policy debate, the academic literature has expressed more skeptical views.
Empirical studies – which generally focused on US data – have drawn mixed conclusions on
the link between labor cost and price inflation, in particular at shorter horizons. First, it re-
mains unclear whether labor costs tend to precede or follow prices (see for instance Knotek and
Zaman (2014) and Bidder (2015)). And second, studies suggest that the relationship between
labor cost inflation and price inflation may have weakened over time, potentially due to an
improved anchoring of inflation expectations (see for instance Peneva and Rudd (2017)).
        However, when looking at the theoretical literature, it is rather unsurprising that empirical
studies have not been able to draw any firm conclusion on the link between labor cost inflation
and price inflation at shorter horizons. Theoretical models generally do not put into question
that in the long run labor cost inflation and price inflation are closely interrelated and that
    1
     In the paper we will refer to labor cost as compensation per employee developments adjusted for productivity,
whereas wages will refer to compensation per employee. In some studies what we consider as the labor cost is
also referred to as unit labor cost (ULC).
   2
     In the 1970s the so called wage-price spiral was seen as causing inflationary dynamics whereby higher labor
cost growth resulted in higher price inflation which in turn led workers to push for higher wage growth and
subsequently even faster price increases.
   3
     Similar references on the link between labour cost and price inflation developments were made in a Bank of
England speech by the external MPC member Saunders (20/4/2018) who noted that the Committee forecasts
a gradual pickup in domestic cost growth that would help keep inflation slight above target two and three years
ahead even as currency effects fade. For the Bank of Japan, the Deputy Governor Iwata (31/1/2018) noted in
a recent speech that the inflation rate is projected to rise in line with wage increases.

ECB Working Paper Series No 2235 / February 2019                                                                4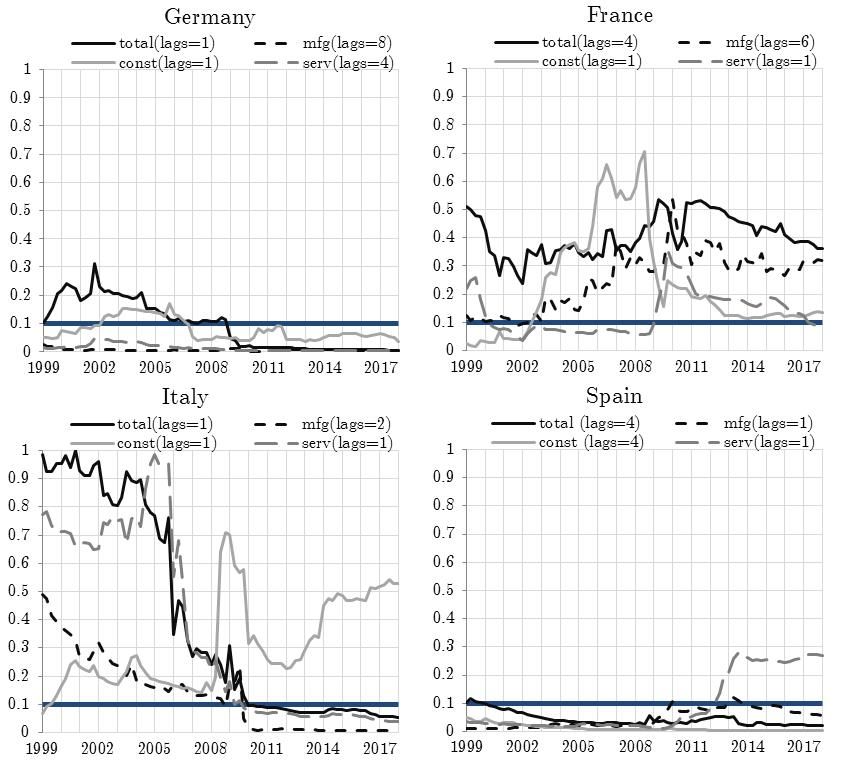
we should eventually expect wage inflation, adjusted for productivity, to move together with
price inflation.4 However, in the short to medium run it is not at all obvious that rising labor
costs should translate into price inflation.
       In the industrial organization literature, an alternative to the cost-push view is that firms
will charge whatever the market will bear, regardless of their actual costs. If the markets
acceptance of higher prices is the dominant determinant of inflation, the cost-push model
would have less validity (see Banerji (2005)). Also, the cost-push view abstracts from any
influences that monetary policy may have on the inflation process. For instance, if a central
bank is pursuing a contractionary policy trying to keep inflation low, firms might not be able
to pass on higher labor costs into prices. In fact, the causality between prices and labor
costs might go the other way: in the case of excess demand, firms would be able to increase
prices, which would lead to higher demand for wages. Reflecting these differentiations, in New
Keynesian models, the correlation and lead-lag relationship between labor cost inflation and
price inflation can be expected to depend not only on the degree of the prevailing price and
wage rigidities in the economy but also on the type of shock that hits the economy. As a result,
we should in fact expect that the link between labor cost inflation and price inflation varies
across time, across countries and also across sectors.
       Having a better understanding of the signal that labor cost developments provide for the
inflationary process is of key relevance from a policy perspective. In the euro area for instance,
it is well-known that the reaction of inflation dynamics to accelerating growth has been atyp-
ically slow in the aftermath of the Great Recession (see Draghi (2018)). While there are a
number of plausible explanations for this, it nevertheless sheds some uncertainty on the in-
flation outlook. Having a deeper understanding of the drivers of the inflationary process can
help reduce this uncertainty. However, to date there exists no study that has systematically
documented and analyzed the empirical link between labor cost inflation and price inflation in
the euro area.
       In this paper, we aim to contribute to the literature by documenting and analyzing the link
between labor cost inflation and price inflation for the largest four euro area countries, using
quarterly data over the period 1985Q1-2018Q1 at the country-wide level and for the 3 largest
sectors in each economy (manufacturing, construction and services). We argue that the link
between labor cost inflation and price inflation is not only state but also shock dependent. The
   4
     In the long run, the real wage is determined by factors such as productivity, bargaining power, and the
ability of firms to mark up prices over costs. Consequently, prices and nominal wages must adjust relative to
each other to be consistent with these fundamentals. In this case, long-run growth in the real wage can only
come from productivity growth. Because of this, if nominal wages grow faster than productivity, they must,
in the long-run, be associated with price inflation. Otherwise workers would ultimately claim all proceeds of
production and business owners would be left with nothing. If wage inflation substantially exceeds productivity
growth, then inflation must also be high to be consistent with real wages rising in line with long-run productivity
improvements.

ECB Working Paper Series No 2235 / February 2019                                                                 5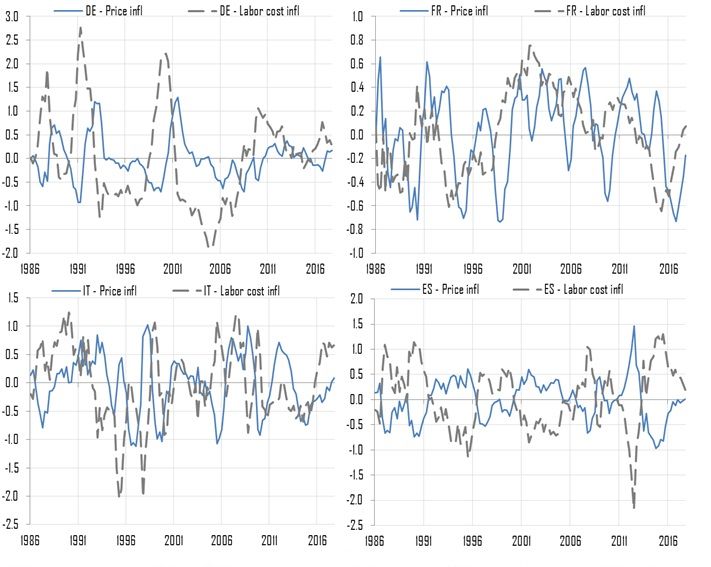
idea that the relationship between variables is shock dependent is not new. It has already been
more extensively explored in the exchange rate literature (see Forbes et al. (2018), Comunale
and Kunovac (2017)), but also for understanding the Phillips curve relationship (see Gali and
Gambetti (2018)). However, its relevance for the link between labor cost and price inflation
has also already been suggested. Gumiel and Hahn (2018) present evidence based on one of
the ECB core models for policy simulations that the response of the GDP deflator to wage
increases/decreases is different for supply shocks (in this case wage markup shocks) than for
demand shocks.
    Our paper builds on these findings. Concretely, we analyze empirically the link between
labor cost and price inflation in the euro area over the short to medium term horizon, and
check if the extent to which the link has changed over time depends on the level of inflation and
the type of shocks that hit the economy. We focus on the developments in the total economy
and three main sectors of the four largest euro area economies.5 As the link between labor cost
and price inflation has been less documented for the euro area countries, we start by presenting
some stylized facts and by conducting preliminary analyses that have become commonplace in
the US literature on this topic. More specifically, we (i) look at the cross-correlation between
labor cost and price inflation, (ii) test Granger causality, and (iii) conduct both a conditional
and unconditional forecast evaluation. Subsequently, we consider the link between labor cost
and price inflation in a dynamic and conditional set-up by estimating a 3 variable VAR model
for each sector of each country. This allows us to answer questions, such as: (i) whether
the conditional correlations are different from the unconditional ones; (ii) by how much price
inflation rises when labor costs increase, and (iii) the extent to which this ”pass-through” has
evolved over time or depends e.g. on the level of price inflation. In the final part of the paper
we move to a more structural set-up and analyze whether and how the link between labor cost
and price inflation depends on the type of shocks that hit the economy.
    Overall our results show that in the four biggest euro area countries, contrary to the US,
there is a clear link between labor cost and price inflation. This result is confirmed across a
battery of approaches and tests. The link has also remained overall rather stable over time,
albeit with some differences across sectors and countries. However, at the same time, and in line
with the findings in the US literature, the link appears to depend on the level of price inflation:
when inflation is high, the link becomes stronger. Finally, the link is shock-dependent: when
the economy is hit by a demand shock, there is a clear and relatively strong link between labor
cost and price inflation. This is not the case for supply shocks, where the link is less conclusive.
    These findings have important policy implications. In particular, the results suggest that
   5
     Note that we focus on the short to medium term horizon in this paper as this is the most relevant horizon
from a policy perspective. Moreover, this is also the horizon at which a clear consensus and view still lacks on
the link between wage and price inflation

ECB Working Paper Series No 2235 / February 2019                                                              6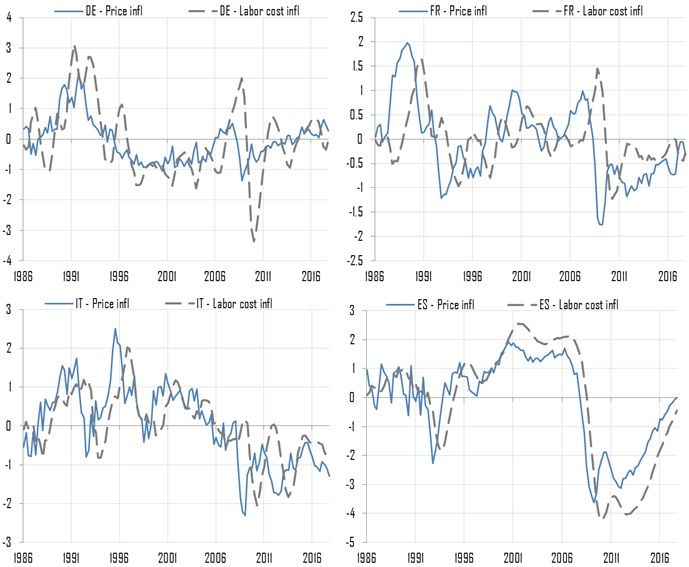
monitoring and analyzing labor cost developments in the euro area is indeed relevant to un-
derstand the evolution of price inflation. However the importance of these developments does
depend on the level of price inflation and on the shocks that prevail in the economy. In an
environment of expansionary demand the information contained in labor cost developments in
much more relevant for price inflation than when the economy is hit by supply-type shock. In
other words, under circumstances of predominantly demand shocks, one can be confident that
labor cost increases will be passed on to prices. However, after a period of low inflation (such
as the one between 2012 and 2018) this pass-through could be moderate at least until inflation
stably reaches a sustained path.
        The remainder of the paper is organized as follows. Section 2 connects the paper to the
existing literature. Section 3 discusses some preliminary analysis of the data and presents
unconditional stylized facts on the link between labor cost and price inflation. Section 4
analyses the link in a VAR set up and considers to what extent the link has changed over time
or depends on the level of price inflation. Section 5 presents results based on a structural VAR
model. Section 6 summarizes and concludes.

2        Link to the Existing Literature
Labor markets have been a focus of interest in the study of price inflation ever since Phillips
uncovered the negative relationship between the rate of change in wages and the unemployment
rate, i.e. the so called Phillips curve.6 Since then an extensive literature has developed
that studies the interrelationship between labor market developments and price inflation. An
important share of this research has explored how informative labor cost inflation is for price
inflation, in particular in the short to medium run.7
        Studies have taken a number of avenues to analyze this question. A first important strand in
the literature has focused on the causal relationship between wage inflation and price inflation.
From a theoretical view, the post-Keynesian view would suggest that the excess of wage gains
over productivity gains lead price inflation. Instead, according to the neoclassical theory, the
causality between wages and inflation would run in the opposite direction. In this case, the
real wage is considered the relevant wage variable in the wage-employment relationship and
nominal wages are expected to respond to price changes so as to preserve the real wage, for
a given productivity level. Empirically, analyses based on in-sample Granger causality type
of tests have yielded mixed conclusions. A number of studies tend to favor the idea that
price inflation causes wage inflation and that the causality can differ across sectors. Hu and
    6
     Fisher (1926) already uncovered the link between price inflation and the unemployment rate earlier, however
he saw price inflation as driving the rate of unemployment.
   7
     In the long run, the relationship between labor cost inflation (i.e. wage inflation adjusted for productivity)
and price inflation is rather uncontroversial, both from a theoretical and empirical point of view.

ECB Working Paper Series No 2235 / February 2019                                                                 7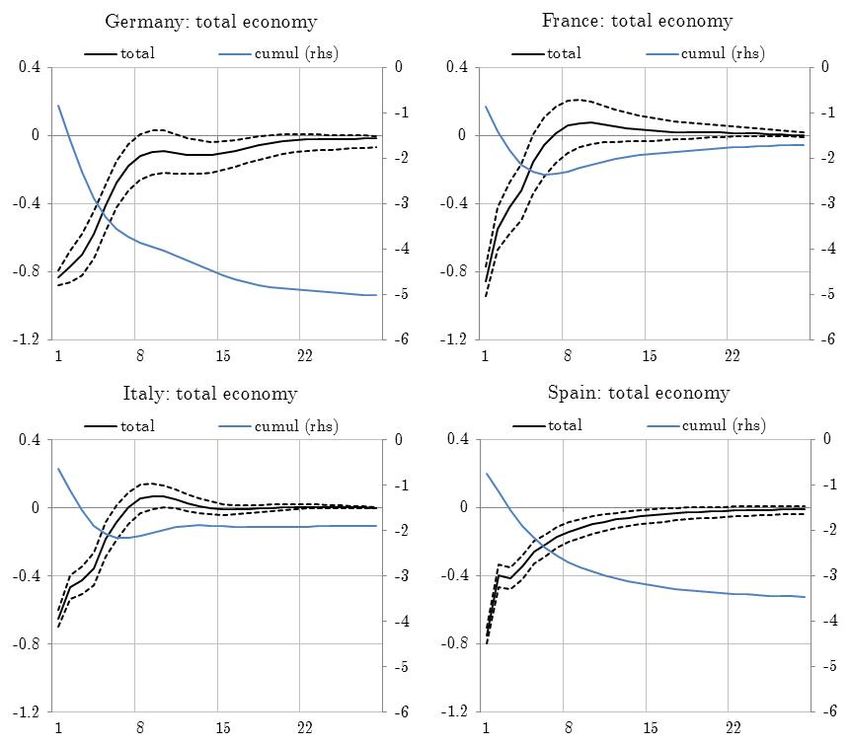
Toussaint-Comeau (2010) find that wage growth does not cause price inflation in the Granger
causality sense, especially after the mid-80s. By contrast, price inflation does Granger cause
wage growth. Similarly, Emery and Chang (1996) and Sbordone (2002) find some evidence
that rising prices precede the growth in unit labor costs (see Bidder (2015)). However, some
other studies find actually no causal link between price and wage inflation. For instance, Hess
and Schweitzer (2000) find that price and wage changes are best predicted by their own lags,
meaning that none Granger causes the other. Along similar lines, Gordon (1988) and Darrat
(1994) concluded that wages and prices are irrelevant to each other and that they ”live a life
of their own”. Finally, Banerji (2005) approaches this changing relationship from a different
angle, looking at cyclical turns. He finds that labor cost inflation leads price inflation at peaks,
but lags it at troughs, which would make changes in labor cost a lagging indicator of upturns
in price inflation. Finally, Rissman (1995) finds that only in manufacturing and trade services,
wages granger cause inflation.
    A second strand of the literature has investigated whether wages add any information
when trying to forecast inflation (see for instance Stock and Watson (2008), Knotek and
Zaman (2014)). Overall, these studies have found that for out-of-sample forecasts, wages do
not provide significant additional information beyond what can already be gleaned from other
sources, including prices themselves (Bidder (2015)). At the extreme, Stock and Watson (2008)
even show that models using common wage measures may perform worse than their preferred
benchmark without wages.
    A final strand of the literature has examined whether the link between labor cost inflation
and price inflation is time varying. Studies here tend to find that, while in the past (i.e. prior
to the mid 1980s) labor cost inflation did provide signals for price inflation, there is little
evidence that in recent years movements in average labor cost growth have been an important
independent influence on price inflation. Concretely, Knotek and Zaman (2014) shows how the
correlation between wages and prices has decreased since the mid-80s. Similarly, Peneva and
Rudd (2017) show how the pass-through of labor cost growth to price inflation in the US has
declined over the past several decades (to the point where it is currently close to zero). One
explanation put forward has been the better anchoring of inflation expectations in recent years.
Another one is that low levels of inflation changes the wage-price nexus because of downward
wage ridigities (Daly and Hobijn (2014)). Such a view was also empirically uncovered by Mehra
(2000) who finds that in periods of low inflation, wages do not help to predict inflation while it
does in high inflationary environment. Zanetti (2007) found similar results using Swiss data.
    From these studies it thus appears generally difficult to ascertain that over shorter horizons
wages have an independent influence on prices and that the link has weakened over recent years.
However, most of them are based on US data. Instead, for the euro area, only few studies have
examined this link. IMF (2018) replicates the Peneva and Rudd (2017) approach for the EU15

ECB Working Paper Series No 2235 / February 2019                                                   8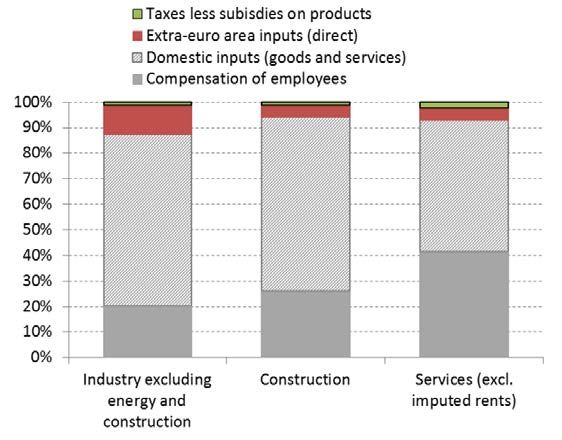
panel and they find that there is a statistically significant pass-through from labor cost growth
to inflation for these countries. Dees and Guntner (2014) explore the cost-push factors to
inflation dynamics from the supply side across four sectors (industry, construction, services
and agriculture) in the four largest euro area countries over the period 1995-2012. In their
analysis the authors find that disaggregated information improves the inflation forecasting
performance and that their model, which also accounts for unit labor cost developments, fares
comparatively well against common alternatives. Forecast errors however do tend to be larger
during the financial crisis period. Jarocinski and Mackowiak (2017) in turn consider whether
unit labor cost, among a large set of potential indicators, add information when trying to
forecast inflation. They conduct their exercise for both the US and the euro area. The authors
find that the unit labor cost ranks low in the US (28th among 38 variables) while ranking
somewhat better for the euro area (18th among 38 variables). Using a different approach,
Tatierska (2010) finds by estimating a New Keynesian Phillips Curve that in eight out of
eleven euro area countries there is a plausible relationship between inflation and labor cost
growth. Finally, at the micro level, Druant et al. (2009) find that wage and price changes
feed into each other. Around 40 percent of the firms surveyed acknowledge that there exists a
relationship between wages and prices. However, only 15 percent state that this relationship
is relatively strong. For half of them decisions on price changes follow those on wage changes.
The opposite holds for another 3 percent, while decisions are simultaneous in the remaining 4
percent.

3        A First Exploratory Look at Labor Costs and Inflation in
         the euro area
We concentrate in our analysis on the link between labor cost and price inflation in the four
largest euro area countries (Germany, France, Italy and Spain) for the economy as a whole and
for the three main economic sectors: services, manufacturing and construction.8
        For this purpose we collected quarterly data over the period 1981Q1-2018Q1. Details on
the data sources and the data series included are provided in Appendix A. To measure labor
costs, we use nominal compensation per employee adjusted for productivity (in line for instance
with Peneva and Rudd (2017)) rather than nominal compensation per employee as the former
    8
    The three economic sectors combined represent between 70% (in Germany) and 80% (in France) of total
value added. We did not include the agricultural sector which represents only between 0.7% (in Italy) and 2.9%
(in Spain) of total value added.

ECB Working Paper Series No 2235 / February 2019                                                            9
is a better proxy of the true cost pressure faced by the firm.9 For inflation, we use the implicit
sectoral gross value added deflator.10
Figure 1: Cost structure of production of manufacturing and services firms in the euro area
Sources: Eurostat, authors’ calculations. Latest observation: Input/output tables 2015.
We conduct our investigation for each country separately, given the substantial heterogene-
ity in labour market institutions and in the wage formation process. Moreover, we believe that
it is important not just to conduct the analysis at the country level but also to exploit the
sectoral dimension. Sectors differ in terms of labor market tightness and many other labor
9
Our wage measure is compensation per employee. Alternative measures of wages across euro area countries
exist, such as compensation per hour or hourly labor cost. The latter encompasses employee compensation
(which includes wages, salaries in cash and in kind, employers social security contributions), vocational training
costs, and other expenditure (such as recruitment costs, expenditure on work clothes, and employment taxes
regarded as labor costs minus any subsidies received). However, these alternatives are generally consistently
available across sectors and countries on a quarterly basis only since 1995 and in some cases (in particular Spain)
only later. For this reason, our preferred wage proxy is compensation per employee. Moreover, we find that
the correlation between our wage measure (i.e. compensation per employee) and the other measures is rather
strong in their overlapping sample periods. For compensation per hour the correlation is on average above 0.8.
The only outlier is the Italian manufacturing sector, where the correlation is 0.5. When comparing our measure
with Eurostat’s labor cost index during overlapping periods, the average correlation is around 0.6.
10
Note that CPI inflation is not available at sectoral level. The gross value added deflator at sectoral level
has been obtained by dividing nominal value added by real value added at sectoral level. The key difference
between the implicit gross value added deflator and the consumer price index is that the latter measures price
developments from the perspective of the consumer whereas the former considers price developments from the
perspective of domestic production of goods and services. In practice this implies that import prices matter for
the consumer price index, but not for the gross value added deflator (where export prices do matter). Appendix
B plots the evolution of the GDP deflator, labor cost and CPI inflation for the total economy for the 4 countries
of the analysis. The chart shows that the correlation between the annual growth rate of GDP deflator and of
the Consumer Price Index is very high.
ECB Working Paper Series No 2235 / February 2019 10Figure 2: Unit Labor Cost and GDP deflator, year on year % change Sources: Various sources, authors’ calculations. Latest observation: 2018Q1. market characteristics that affect the pass-through of labor cost to price inflation. The cost structure of production firms is different, with services having a bigger share of labor costs (see Figure 1). At the same time, manufacturing is subject to a larger degree to international com- petition. Furthermore, other characteristics, such as workers’ turnover rates, capital intensity or the degree of wage bargaining institutions are also sector dependent. Finally, sectors differ in terms of their degree of wage rigidity. For instance Du Caju et al. (2009) show (using a Belgian firm-level data set) that wages in construction are particularly sticky, less so in services and even less so in manufacturing. Tatierska (2010) also argues that the sensitivity of price to labor cost inflation differs across sectors, reflecting the different degree of price stickiness; the services sector exhibits stickier prices, so she finds that for most analyzed countries (out of 11 euro area countries), labor cost inflation Granger causes price inflation for the total economy in more instances than for services. ECB Working Paper Series No 2235 / February 2019 11
3.1      Data

Figure 2 plots the year-on-year growth rate of the labor cost and our measure of price inflation,
for the total economy for each of the four countries. The high correlation (ranging between
0.85 and 0.91) between the two series demonstrates why analysts have paid close attention
to labor costs when assessing price inflation.11 However, what is not clear from the Figure is
whether movements in labor costs precede movements in price inflation, or vice versa.
       At the same time, Figure 2 does clearly demonstrate that in part the high co-movement
between the two data series can be explained by a strong common (downward) trend over
an important part of the sample (in particular in the 1980s and early 1990s) which can be
attributed to the convergence process in the run-up to EMU and the improvements in the
anchoring of inflation expectations towards lower levels. These common patterns are visible
across all countries and sectors (not reported). Therefore, before choosing the appropriate level
of aggregation where to remove the trend, we compute a single common factor across all price
and labor cost inflation series as well as within-country factors (common to labor cost and price
inflation series of all sectors belonging to the same country), and check the variance explained
by these factors. It turns out that the variance of the two variables of interest explained by
country factors is not only higher on average (60% vs 50%) but also consistently higher across
countries than the variance explained by a single common factor. The latter would explain a
high variance of the two variables in France, Italy and Spain (and not in all sectors) but not
in Germany.
       Based on this evidence and on the fact that this common movement is related to the
improvements in the anchoring of inflation expectations to lower levels, we decided to adjust
the series for the common movements at the country rather than sectoral level. To do so, we
follow Knotek and Zaman (2014) which is in turn inspired by the forecasting literature that
has found gains in inflation forecasting accuracy by specifying inflation in gap form as the
deviation from a slow-moving long-run trend (Kozicki and Tinsley (2001) and Zaman (2013)).
Concretely, we construct labor cost and price inflation gaps as the year-on-year growth rates in
these variables minus the Consensus survey-based long-run inflation expectations. As inflation
expectations for the countries in our sample are only available since 1989 (and for Spain even
only since 1995), we rely on an unobserved components model to create labor cost and price
inflation gaps in the period prior to that.12 The adjusted series are shown in Figure 3. This
adjustment also implies that the series are stationary, according to a standard ADF unit root
  11
     These high correlations are generally also confirmed at the sectoral level. The correlation is however some-
what lower for the construction sector, where it ranges between 0.31 (for Spain) and 0.64 (for Italy).
  12
     The unobserved component model is estimated on the price inflation series and assumes that the inflation
trend follows a random walk. This trend estimate from the unobserved component model is then applied to
both the labor cost and price inflation series.

ECB Working Paper Series No 2235 / February 2019                                                              12
Figure 3: Adjusted Labor Cost and GDP deflator, year on year % change
Sources: Various sources, authors’ calculations. Latest observation: 2018Q1.
test.13
The common trend is crucial in understanding the link between labor cost and price in-
flation. As shown in Figure 4, the correlation between price and labor cost inflation appears
to have changed after the crisis when looking at unadjusted data, but there is no striking
difference when considering the adjusted series. For the remainder of the paper, we will base
our analysis on the adjusted series of labor cost and price inflation.
3.2 Cross correlations
In this subsection, we analyze the unconditional connection between labor cost inflation and
price inflation by looking at cross-correlations, which allow for a simple examination of the
lead-lag structure of the correlation and the strength of the connection between the series.
13
To ensure that our results do not depend on the approach taken, we also construct alternative price inflation
and labor cost inflation gaps as year-on-year growth in these variables less a series-specific or shared long-run
trend. Specifically we use an HP filter to adjust the series for the time span where inflation expectations were
not available considered. The results in the paper were unchanged when applying this approach.
ECB Working Paper Series No 2235 / February 2019 13Figure 4: Adjusted and unadjusted labor cost growth (6 months prior) and price inflation in
the euro area
Sources: Various sources, authors’ calculations. Latest observation: 2018Q1.
If labor cost inflation reliably comes ahead of price inflation in the data, then the strongest
cross-correlation should be between labor cost inflation in quarter t and price inflation in some
k-th quarter after t.
The unconditional cross-correlations (Figure 5) of the adjusted series continue to show
a high contemporaneous correlation (albeit lower than on the non-adjusted series) ranging
between 0.4 (France) and close to 0.8 (Spain).
At the same time, we do not observe a systematic lead/lag pattern across countries or
sectors. While in Italy the highest correlations occur mostly contemporaneously, in the German
total economy and service sector, labor costs seem to lead prices. In France, except for the
service sector, prices lead labor costs. Similarly, in the Spanish service sector and the total
economy, prices lead labor costs, while labor costs are clearly leading prices in the construction
sector.
Examining the same cross-correlations on a rolling sample we noticed only small changes
over time, though in the post-crisis period the correlations have tended to become more con-
temporaneous (except in the Spanish construction and the French service sector) (see Figure
13 in Appendix C).
ECB Working Paper Series No 2235 / February 2019 14Figure 5: Cross correlation between adjusted labor cost and price inflation
Sources: Various sources, authors’ calculations. Note: the charts show the cross correlation between price
inflation gaps at time t and labor cost inflation gaps at time t-k. Sample period: 1985Q1-2018Q1.
3.3 Granger Causality and Forecast Evaluation
Another angle to look at the link between labor cost and price inflation is to ask whether
past changes in labor costs contain useful information for predicting future changes in prices.
We consider here two commonly adopted approaches to analyze this question from an in-
and out-of-sample perspective, namely Granger Causality and a pseudo out-of-sample forecast
evaluation.
As regards the Granger Causality test, we adopt here the classical approach whereby in a
single equation model price inflation is regressed on p lags of price and labor cost inflation and
the exclusion of the labor cost inflation lags is tested. The test is performed on a recursive
basis, starting by estimating the equation over the period 1985Q1-1998Q4 and subsequently
adding one quarter at a time. Lags are optimally chosen with a grid search to minimize the
p-values of the Granger Causality test. In other words, we look for the best specification which
is the most likely to result in labor cost inflation being Granger causally prior to price inflation.
ECB Working Paper Series No 2235 / February 2019 15Figure 6: Recursive Granger Causality Test Results (p-values)
Note: mfg stands for manufacturing, const for construction and serv for services. The lags for the Granger
causality test were optimally chosen. The horizontal dark blue line represents the threshold for the significance
of the test at a 10% level. Sources: Authors’ calculations.
Results (Figure 6) show that contrary to what found for US data (see section 2), we can
find Granger causality from labor cost to price inflation at 10 and 5% significance. Moreover,
and confirming the conclusions from the unconditional cross-correlations, we see that the labor
cost and price inflation link has not weakened in the recent period (the notable exceptions are
the Italian construction and Spanish service sectors). In fact, in most cases the causality from
labor cost to price inflation has strengthened over time. France is the only country where this
causality has been less evident throughout the sample, except the construction sector and the
service sector until the financial crisis.
In the second approach we focus on the out-of-sample forecasting power of labor cost
inflation for price inflation. For this purpose we estimate a simple trivariate VAR model for
each sector which includes: real value added growth, labor cost inflation and price inflation.
We subsequently perform two exercises: an unconditional and a conditional forecast. In the
first case, we compare the unconditional forecast of price inflation from the trivariate VAR
ECB Working Paper Series No 2235 / February 2019 16with a bivariate VAR (i.e. a model which only includes activity and prices). Our benchmark
evaluation period is 1999-2018 but we also checked the results for the periods 1999-2007 and
2008-2018. Besides the unconditional forecast, we also consider a conditional forecast exercise.
In this case, we compare the inflation forecast from the trivariate VAR conditional on the true
path of labor costs with the forecast of price inflation from the same model where we condition
on a constant path for labor costs (i.e. we assume a random walk).14
The results from the unconditional and conditional forecasts are shown in the Tables in
Appendix D. Overall, while the unconditional forecast presents mixed results and would seem
to suggest that labor costs can, in our exercise, add some useful but limited information to
the price inflation forecasts across samples, the conditional forecasts strikingly show that labor
cost inflation has indeed some forecasting power for price inflation in this setup. This result
appears consistently across sectors and countries with the exceptions of the construction and
service sectors in Spain. Evaluating the forecast before and after (the beginning of the) global
financial crisis we observe a tendency to improve the forecasting over the latter part of the
sample in case of the total economy for all countries except Italy (where we do not see a
change). When checking the opposite direction (from prices to labor costs), overall we observe
many more ratios bigger than 1 and a better forecasting performance over the last part of the
sample for Germany and Spain.
3.4 Summary
This Section can easily be summarized: labor cost and price inflation show a consistent and
strong (unconditional) link across euro area countries and sectors at a cyclical frequency,
i.e. even after removing a common trend. In fact, without removing a common trend, the
correlation between labor cost and price inflation would have spuriously changed after the
real and financial crisis, as found for the US data by Peneva and Rudd (2017). The direction
of causality is not obvious to ascertain but, contrary to the evidence typically based on US
data, it is possible to find some in- and out-of-sample forecasting power of labor costs for
price inflation. No obvious country- or sector-specific pattern emerges from this preliminary
analysis.
14
Concretely, the strategy is the following: (i) we run an initial estimate of the model until 1998Q4; (ii) we do
a rolling estimate thereafter and project inflation (for each sector) 8 steps ahead conditional on the true path
of labor cost inflation and conditional on a constant labor cost inflation; (iii) we evaluate the ratios of RMSE
obtained in both cases.
ECB Working Paper Series No 2235 / February 2019 174 A Simple VAR Analysis
4.1 Empirical Approach
To examine in a dynamic and more conditional manner the relationship between labor cost
and price inflation we use VAR models for each sector of each country, in total of 16 VARs. We
do not exclude the possibility of cross-countries/sectors interrelationships, which could be ac-
counted for in a panel VAR approach as in Canova and Ciccarelli (2009), but the sparse number
of dynamic interrelationship among countries and sectors can make a fully-fledged panel VAR
setup inefficient for our aim. Moreover, the heterogeneity in the data makes the approach used
here preferable to approaches that restrict the dynamics of the endogenous variables to homo-
geneity in a pooling panel. Estimating sector by sector allows us to look at average results, if
needed, by simply using consistent mean group estimators on the disaggregated results.
Our baseline VAR system contains three variables: the growth rates of (i) real value added,
(ii) unit labor cost and (iii) the value added deflator. The latter two variables have been ad-
justed as explained in Section 3 to remove a common trend. The baseline estimation period
ranges from 1985Q1 to 2018Q1. The VARs are estimated with four lags and Bayesian tech-
niques assuming a normal-diffuse prior with a Minnesota prior on the matrix of coefficients to
deal with the curse of dimensionality (see e.g. Kadyiala and Karlsson (1998)). We also conduct
a robustness check of our results by adding the spread between a long and a short-term interest
rate to the VAR system. The included variable is intended to proxy for monetary policy. Our
findings are largely unaffected by this extension, as shown in the Figures in Appendices H and
K.
In this simple set up we use the estimates of the 16 VARs to evaluate impulse response
functions of inflation to a shock in unit labor cost inflation by means of a Choleski orthogonal-
ization with the variables ordered as listed above. The dynamic responses are used to answer
the question: how much does inflation rise when labor costs rise by one-standard deviation.
Standardized multipliers are computed mimicking the fiscal literature (see e.g. Mountford and
Uhlig (2009)) as the ratio of the cumulative responses of price and labor cost inflation over
the horizons 1 (impact) through 28 quarters. With such standardization, the multipliers are
comparable across countries and sectors.
4.2 Main Findings: Baseline VAR Specification
We first report the estimated contemporaneous correlations between labor cost and price infla-
tion computed from the moving average representation of the VARs (i.e. the impulse response
estimates) truncated to 40 lags.
Table 1 reports the correlation estimates between the two variables of interest conditional
ECB Working Paper Series No 2235 / February 2019 18Table 1: VAR based correlation between labor cost and price inflation
conditional on Total Manufacturing Construction Service
all shocks 0.62 0.62 0.50 0.57
DE shock to y 0.78 0.91 0.84 0.79
shock to ulc 0.88 0.77 0.39 0.89
shock to p 0.03 0.06 0.56 -0.18
all shocks 0.40 0.35 0.27 0.48
shock to y 0.49 0.39 0.02 0.52
FR
shock to ulc 0.82 0.83 0.83 0.70
shock to p -0.04 0.28 0.35 0.29
all shocks 0.63 0.52 0.55 0.63
shock to y 0.74 0.88 0.61 0.68
IT
shock to ulc 0.90 0.27 0.74 0.85
shock to p 0.34 0.03 0.58 0.45
all shocks 0.75 0.65 0.37 0.41
ES shock to y 0.85 0.92 0.53 0.77
shock to ulc 0.96 0.90 0.50 0.42
shock to p 0.63 0.65 0.31 0.54
Notes: Table 1 reports estimates of conditional correlations between labor cost and price inflation.
Significance (values in bold) is based on 68% Bayesian credible intervals.
on all shocks (which is equivalent to the unconditional correlation discussed above in Section 3)
and conditional on shocks to real value added growth, labor cost inflation and price inflation.
In most cases, the estimates point to relatively large, positive and significant correlations,
confirming the previous results that over the sample of analysis the link between labor cost
and price inflation across euro area countries and sectors is quite strong, also after controlling
for the own dynamics and for the dynamic relationships with a real activity indicator. The only
exception is the correlation conditional on shocks to price inflation which in several occasions
is insignificant or negative, and in any event almost consistently lower than the correlations
conditional on other shocks. The same correlation conditional on shocks to labor cost inflation
is instead always positive and significant and can be as high as 0.96 (Spain, total economy).
An interesting result based on the same estimates is given by the forecast error variance
decomposition (see Figure 16 in Appendix F) which indicates that almost systematically (with
the exception of Italian construction) the variance of inflation explained by shocks to labor cost
inflation is bigger than the variance of labor cost inflation explained by price inflation. These
percentages are not very high on average but can reach values as high as 70% (in France).
ECB Working Paper Series No 2235 / February 2019 19In order to better understand these results, Figure 7 plots the impulse response functions of
price inflation to a shock to labor cost inflation, standardized as explained above in Section 4.1.
The estimates can be interpreted as pass-through multipliers from labor cost to price inflation.
The full set of results can be found in Figure 15 in Appendix F where we also report the
recursive estimates of the steady state pass-through distributions (median and 68% credible
interval) for all sectors and countries.
Figure 7: Choleski decomposition based pass-through from labor cost to price inflation
Sources: Authors’ calculations.
These charts show that the steady state pass-through values are almost always signifi-
cantly different from zero. Moreover, they confirm the finding from the unconditional cross-
correlations (see Appendix C) that there is no apparent structural break or significant change
in the link between labor cost and price inflation over time and that there are important
heterogeneities across countries and sectors.
ECB Working Paper Series No 2235 / February 2019 20How does the pass-through differ across countries?
Another aspect worth considering is how and why our pass-through results differ across
countries. Figure 7 in this regards shows that France exhibits the highest pass-through values
across all sectors. A cross-check of the conditional and the unconditional cross-correlations
would confirm that the construction and manufacturing sectors in France drive up the pass-
through across the economy. A strong pass-through from wage growth adjusted for productivity
to price inflation was also found in Quevat and Vignolles (2018), based on a model for core
inflation where also changes in VAT are accounted for. Charsonville et al. (2017) confirm
the pattern that we find across sectors in France, namely an initial higher pass-through in
manufacturing and a subsequently more important one for services. One reason for such a
relatively high pass-through for France could be the presence of stronger second round effects
(see also Gautier et al. (2016)).15
The pass-through in Germany is lower and clearly driven by services. Nevertheless, a 0.4
pass-through suggests that labour costs are being passed through to prices in a noticeable
manner. The Bundesbank also acknowledges the importance of wage developments for con-
sumer prices and confirms that the pass-through from wages to prices is below 50% (see Kohns
(2018)). Why would the pass-through be lower in Germany than in France? Following the
line of thought of Kuegler et al. (2018), the wage setting process in the two countries differs
substantially. Germany has witnessed an unprecedented decentralization of the wage forma-
tion process since mid 90s and a fall in union coverage rates; trade unions were responsible
for a prolonged period of wage restraint. In France there was no similar decentralization of
the wage setting process and labour unions play a more prominent role. In a situation of sim-
ilar productivity growth (see Kuegler et al. (2018)) and an increased convergence in inflation
rates across countries, the wage moderation process which occurred in Germany would imply,
mechanically, a lower pass-through to inflation.
Also in Italy the pass-through of labour costs to prices is driven by services, confirming
the results based on unconditional contemporaneous correlations. The relatively strong pass-
through of labour costs to Italian prices is supported by findings based on firm-level data,
whereby firms inflation expectations are significantly affected by wage changes, particularly in
high inflation regimes (see Conflitti and Zizza (2018)).
Spain stands out with a low steady-state pass-through in the services sector. This is un-
surprising in light of previous findings, such as the fact that in this sector it is price inflation
which appears to lead labor cost inflation, as reported in Figure 5.
15
In France the indexation of the minimum wage to HICP inflation feeds through to a large part of base
wages and thereby leads to an informal wage indexation; the minimum wage also acts as a benchmark for wage
agreements.
ECB Working Paper Series No 2235 / February 2019 21In order to put in perspective these findings, we cross-checked our findings against two main
results of the euro area Wage Dynamics Network (WDN), bearing in mind that those results
are based on firm-level (survey) data that do not cover the post-crisis sample (see ECB (2009)).
First, our general result that on average across sectors and countries the pass-through from
labor cost to price inflation is positive and significant is consistent with the WDN result that
a large percentage of firms surveyed declare that they use a strategy of increasing prices when
faced with a (permanent) unexpected increase in wages, especially if firms produce interme-
diate goods. Second, the WDN finds that at the micro level the strength of the link between
prices and labor cost depends on the labor share. In particular, firms with a high labor cost
share report more frequently that there is a tight link between price and wage change. If
we check the sectors that drive the highest pass-through across countries we are not able to
confirm this result. With the exception of France, where the construction sector has the high-
est pass-through and the highest labor share, for the other countries the highest pass-through
happens in sectors that have had the lowest labor share over the sample of the analysis (service
in Italy and Germany; manufacturing in Spain, see Charts in Appendix E).
These results, together with the findings in Section 3 would suggest that, contrary to
the results of the empirical literature based on US data (e.g. Peneva and Rudd (2017) and
references therein), there is no evident or systematic decline in pass-through across euro area
countries or sectors. One possible explanation for this divergent finding can simply be the
consequence of the different detrending strategy that we adopt, i.e. by imposing a theory-based
long-run restriction that the gap between productivity-adjusted nominal wage growth and price
inflation disappears in the long-run because the two variables share a common trend.16
Implications for the behavior of the price-cost markup
From a theoretical perspective, the markup should be measured by the price-marginal cost
fraction. Empirically, however, measuring the marginal cost is often fraught with important
difficulties.17 For this reason, marginal cost is often proxied by average cost, and more precisely
by average labor cost. Theoretically, a number of conditions exist under which the marginal
cost equals the average cost. For instance with a Cobb-Douglas technology and no labor
adjustment costs, the marginal wage would equal the average wage, and hence the price-
average labor cost fraction would represent the markup. With a CES technology and perfect
substitution of labour vis-a-vis other non-labour inputs it is also possible to show that the
difference between price and labor cost inflation is the price-cost markup. Since we find an
incomplete pass-through from labour costs to prices, our results have thus implications for the
16
We have computed a time-varying pass-through for the US data using the same specification as in Peneva
and Rudd (2017), removing a common trend from adjusted labor cost and price inflation and the results confirm
this intuition.
17
For a detailed discussion on the issues related to and existing approaches to measure the price-cost markup,
see Nekarda and Ramey (2013).
ECB Working Paper Series No 2235 / February 2019 22price-cost markup.18
The implication from our estimation results for the price-cost markup is shown in Figure
17 in Appendix G. The Figure shows the evolution of the price-cost markup as the difference
between the impulse response of price inflation and labor cost inflation. Moreover, it also shows
the cumulative response on the price-cost markup for the total economy. Overall, the Figure
confirms, by looking at the results through a different lens, the incomplete pass-through with
price-cost markups being squeezed following a positive labor cost shock. Concretely, following
a 1% shock to labor cost inflation, the price-cost markup instantaneously declines in the total
economy by around 0.8% across countries.
4.3 Main Findings: State-Dependent VAR Specification
Another important dimension in the context of the pass-through from labor cost to price
inflation is to test the empirical proposition that this pass-through could depend on the level of
price inflation. We look at this particular variable because reduced-form estimates of the pass-
through from labor costs to price inflation capture the underlying nominal rigidities and the
literature has highlighted that these rigidities may, inter alia, depend on the level of inflation.
A low pass-through can be associated to a low inflation environment either because low
inflation and low expected inflation persistence cause a low pass-through (Taylor (2000)),
or because low levels of price inflation could be expected to reduce the pass-through due to
downward wage rigidities (Daly and Hobijn (2014)). Another argument that has been suggested
as to why the pass-through from costs to inflation could increase with the level of inflation
is linked to the search intensity of consumers. Concretely, at low levels of inflation, a large
fraction of buyers observe a single price. In that case, any given shock would increase price
dispersion sharply, which would increase the search intensity of consumers, thereby reducing
firm market power, which limits the ability of firms to pass on the cost increase to prices.
At higher levels of inflation, price dispersion is higher and hence any given shock has only a
limited impact on price dispersion and the search intensity of consumers. As a result, prices
are at higher levels of inflation more responsive to shocks (see Head et al. (2010)).
Finally, in a high-inflation environment profits might act less as a buffer than in a low-
inflation regime due to an intertemporal smoothing of the profit path. For instance, when
inflation is high and wages increase firms may expect an increase in interest rates which worsens
their borrowing conditions and squeezes their future profit margins; hence, they will maintain
their profits in the present, which would favor the pass-through from labor costs to prices.
18
We acknowledge that other costs might make up part of the difference between price and labour costs
growth, in particular the cost of capital. Nevertheless, grasping the cost of capital is a complicated problem
beyond the scope of this paper and encompasses issues such as the price of intangible assets or quality-adjusted
prices of information and communications technology goods.
ECB Working Paper Series No 2235 / February 2019 23You can also read