Shocks in the Stacked Sunyaev-Zel'dovich Profiles of Clusters I: Analysis with the Three Hundred Simulations
←
→
Page content transcription
If your browser does not render page correctly, please read the page content below
Shocks in the Stacked Sunyaev-Zel’dovich Profiles of Clusters I: Analysis with the Three Hundred
Simulations
Eric J. Baxter,1 Susmita Adhikari,2, 3 Jesús Vega-Ferrero,4, 5 Weiguang
Cui,6, 7 Chihway Chang,8, 9 Bhuvnesh Jain,10 and Alexander Knebe11, 12, 13
1
Institute for Astronomy, University of Hawai’i, 2680 Woodlawn Drive, Honolulu, HI 96822, USA
2
Kavli Institute for Particle Astrophysics and Cosmology and Department of Physics, Stanford University, Stanford, CA 94305, USA
3
SLAC National Accelerator Laboratory, Menlo Park, CA 94025, USA
4
IFCA, Instituto de Física de Cantabria (UC-CSIC), Av. de Los Castros s/n, 39005 Santander, Spain
5
Artificial Intelligence Research Institute (IIIA), Campus UAB, 08193 Bellaterra, Spain
6
Departamento de Físicaa Teórica, Módulo 15, Facultad de Ciencias,
Universidad Autónoma de Madrid, E-28049 Madrid, Spain
7
Institute for Astronomy, University of Edinburgh, Royal Observatory, EH9 3HJ Edinburgh, United Kingdom
arXiv:2101.04179v1 [astro-ph.CO] 11 Jan 2021
8
Department of Astronomy and Astrophysics, University of Chicago, Chicago, IL 60637, USA
9
Kavli Institute for Cosmological Physics, University of Chicago, Chicago, IL 60637, USA
10
Department of Physics and Astronomy, Center for Particle Cosmology,
University of Pennsylvania, Philadelphia, PA 19104, USA
11
Departamento de Física Teórica, Módulo 15, Facultad de Ciencias,
Universidad Autónoma de Madrid, 28049 Madrid, Spain
12
Centro de Investigación Avanzada en Física Fundamental (CIAFF),
Facultad de Ciencias, Universidad Autónoma de Madrid, 28049 Madrid, Spain
13
International Centre for Radio Astronomy Research, University of Western Australia,
35 Stirling Highway, Crawley, Western Australia 6009, Australia
Gas infalling into the gravitational potential wells of massive galaxy clusters is expected to experience one
or more shocks on its journey to becoming part of the intracluster medium (ICM). These shocks are important
for setting the thermodynamic properties of the ICM and can therefore impact cluster observables such as X-
ray emission and the Sunyaev-Zel’dovich (SZ) effect. We investigate the possibility of detecting signals from
cluster shocks in the averaged thermal SZ profiles of galaxy clusters. Using zoom-in hydrodynamic simulations
of massive clusters from the Three Hundred Project, we show that if cluster SZ profiles are stacked as a function
of R/R200m , shock-induced features appear in the averaged SZ profile. These features are not accounted for
in standard fitting formulae for the SZ profiles of galaxy clusters. We show that the shock features should be
detectable with samples of clusters from ongoing and future SZ surveys. We also demonstrate that the location
of these features is correlated with the cluster accretion rate, as well as the location of the cluster splashback
radius. Analyses of ongoing and future surveys, such as SPT-3g, AdvACT, Simons Observatory and CMB-S4,
that include gas shocks will gain a new handle on the properties and dynamics of the outskirts of massive halos,
both in gas and in mass.
I. INTRODUCTION physical origin and properties. Accretion shocks can be de-
fined as the shocks associated with the deceleration of baryons
In the standard picture of structure formation, gas falling that are infalling into a cluster [15]. In contrast, merger
into galaxy clusters experiences one or more shocks before shocks are generated by the infall of massive substructure
becoming part of the intracluster medium (ICM). The shock- merging with the main halo, which can result in an an out-
ing process is essential to the conversion of the kinetic energy wardly propagating shock. Recently, Zhang et al. [67] have
associated with infall into the thermal energy of the gas, and is pointed out that sufficiently strong merger shocks can propa-
therefore at least partly responsible for setting the thermody- gate to large distances, forming so-called merger-accelerated
namic properties of the ICM [25]. For this reason, shocks accretion shocks. Cluster shocks can also be divided into
are closely connected to our interpretation of cosmological two classes based on their relative location: external and in-
observables tied to the ICM, such as the X-ray and Sun- ternal shocks. External shocks are associated with pristine,
yaev Zel’dovich (SZ) signals from clusters [e.g. 40], and the previously unshocked gas, falling onto the cluster and being
SZ power spectrum. The properties and geometry of cluster shocked for the first time [40]. Internal shocks can result from
shocks are connected to the large-scale cluster environment continued infall of gas after an external shock, from merg-
[43] and to processes like accretion and mergers [67]. A bet- ers of multiple halos, and from bulk flows [43]. External ac-
ter understanding of cluster shocks — in both theory and data cretion shocks typically occur at several virial radii and have
— is therefore important both from a cosmological perspec- high Mach number (roughly 50-300), while internal accretion
tive and for understanding how clusters grow and evolve over shocks are typically found near the virial radius and have low
time. Additionally, cluster shocks are also thought to be sites Mach number (less than about five) [e.g. 43]. Internal accre-
of cosmic-ray acceleration [32]. tion shocks are sometimes referred to as virial shocks. We
Gas shocks near clusters can be divided into several (not note that these categorizations of shocks are complicated by
necessarily mutually exclusive) classes depending on their the fact that shocks often appear very differently in simplified2
spherically symmetric simulations relative to realistic cosmo- is associated with a rapid change in the pressure profiles of
logical simulations in which the shock geometry is impacted these objects, which in turn leads to an SZ signal that could be
by, for instance, the presence of filaments. Indeed, in spher- identified in high-resolution observations from e.g. ALMA.2
ically symmetric simulations, gas experiences a single accre- Several attempts have been made at detecting the SZ signa-
tion shock near the splashback radius [15, 54]. tures from cluster shocks in data. Basu et al. [11] report a de-
Here we do not attempt to distinguish between the different tection of a cluster merger shock using high resolution obser-
physical origins of shocks, but rather study their impact on the vations with ALMA. Similar measurements have been made
SZ profiles of galaxy clusters. We focus mainly on external by Ueda et al. [60] and Di Mascolo et al. [22]. Hurier et al.
shocks at several virial radii that likely result from merger- [31] claim detection of a virial shock around Abell 2319 using
accelerated accretion shocks. Recent studies have shown that much lower resolution, and lower sensitivity Planck data.
such shocks are nearly ubiquitous in the outskirts of galaxy In this work, we investigate the observational prospects for
clusters [e.g. 9, 67]. For simplicity, we will refer to these as identifying shock features in SZ observations around large
external shocks.1 We will also occasionally consider internal cluster samples from current and future wide-field SZ clus-
accretion shocks, i.e. virial shocks. ter surveys. Ongoing and planned CMB surveys — includ-
In spherically symmetric, self-similar models of halo for- ing SPT-3G [14], AdvACT [29], Simons Observatory [3], and
mation, the location of the external shock is related to the CMB Stage 4 (CMB-S4; Abazajian et al. 2) — will map large
current turnaround radius of the cluster (i.e. the radius at fractions of the submillimeter sky to sensitivities 10 to 30
which matter stops expanding with the Hubble flow and be- times higher than the Planck satellite [6], and with better an-
gins infall towards the cluster) as well as to the halo accretion gular resolution. Furthermore, unlike ultra-high resolution ob-
rate [15, 54]. Self-similar models, however, are not expected servations with e.g. ALMA, these wide-field surveys will nat-
to describe real clusters for a few reasons. First, the effects urally obtain measurements to very large cluster-centric radii
of dark energy at late times induce departures from this self- with their wide fields of view. Given that these surveys are
similar picture [40]. Moreover, in realistic hydrodynamic sim- expected to detect many tens of thousands of galaxy clusters
ulations, where halos deviate from spherical symmetry and ac- [2] it is useful to consider whether we can detect shock fea-
cretion is not smooth, the shock geometry can be complicated, tures around these clusters, and what we can learn from such
with shocks having different radii depending on direction [e.g. measurements.
25, 43, 49, 56]. As we show below, we are unlikely to obtain high sig-
While external shocks have long been predicted by the- nificance measurements of external shocks around individual
ory and simulations, detection of these shocks around galaxy clusters with current and near-term wide-field SZ survey data.
clusters in data is complicated by the low density of gas However, by combining measurements from many clusters,
in the cluster outskirts. X-ray observations of thermal it may be possible to enhance the signal-to-noise. We show
bremsstrahlung emission from clusters, for instance, scales as that although there is significant scatter in shock positions and
the square of the gas density, making its detection in cluster amplitude from cluster to cluster, the y profile averaged over
outskirts challenging [51]. X-ray and γ-ray emission is also many clusters does contain distinct features connected to ex-
expected from cluster shocks as a result of electrons being ternal shocks, and that these features are detectable with near-
highly accelerated in the shock fronts and inverse Compton term surveys.
scattering with cosmic microwave background (CMB) pho- External shocks form in some sense the boundary of the
tons [e.g. 42]. Detection in γ-rays, however, is challenging be- gaseous component of the halo, separating infalling gas from
cause of the small number of photons produced by the shocks the higher temperature gas inside shock boundary. Analo-
and the low resolution of γ-ray telescopes [33]. The electrons gous to the gas boundary, the dark matter component has
accelerated in shock fronts can also produce a synchrotron sig- a boundary at the splashback radius, i.e the surface formed
nal in the radio [16]. by the apocenters of the most recently accreted particles
A promising avenue for detecting cluster shocks is via the [4, 24, 44, 54]. In an idealized spherical solution there is a
thermal Sunyaev-Zel’dovich effect [SZ; 58]. The SZ effect is density caustic at this location [15, 26]. Self-similar collapse
caused by inverse Compton scattering of CMB photons with solutions predict that the location of the external shock and
hot electrons, leading to a spectral distortion of the CMB. The the dark matter caustic coincide for moderately accreting ha-
amplitude of the SZ spectral distortion, typically expressed in los when the gas has an adiabatic index of γ = 5/3 [54]. Real-
terms of the Compton y parameter, is proportional to a line istic hdrodynamical simulations, however, find that the shock
of sight integral of the electron gas pressure. Unlike X-ray can extend much further outside the splashback boundary of
observations — which are sensitive to the square of the gas a halo [e.g. 40]. As both the shock radius and the splashback
density — the tSZ scales linearly in the gas density, making it radius correlate strongly with the accretion rate of the halo,
a powerful probe of gas in the cluster outskirts where shocks self-similar models and hydrodynamical simulations both pre-
are expected [e.g. 37]. Kocsis et al. [37] and Molnar et al. dict that the cluster shock and splashback radii are correlated
[43] have shown that the shock radius in simulated clusters [9, 15, 40, 54, 63]. Hurier et al. [31] use a comparison be-
tween the measured shock and splashback radii of a massive,
1 We note that some authors refer to such external shocks as accretion shocks
[e.g. 43]. 2 https://www.almaobservatory.org/3
low-redshift cluster detected by Planck to derive a constraint gizmo-simba (Cui et al. 2020 in preparation). Given the large
on the gas adiabatic index. The boundary of the gas compo- volume of the re-simulated regions (which exclusively include
nent and its relation to the dark matter boundary is relevant to the cluster environment) and the multiple models employed to
understanding galaxy evolution in clusters, as this boundary simulated the baryonic physics, these clusters have been used
delineates the onset of intra-cluster processes. We investigate in several studies [see 7, 8, 18, 28, 35, 39, 41, 45, 61, 64].
correlations between shock features in the cluster-averaged The analysis in this work is based on the gadget-x model.
SZ profiles and the cluster splashback radius. This correla- It is a modified version of gadget3 Tree-PM code and in-
tion is potentially measureable in data given a suitable proxy cludes an improved SPH scheme with Wendland interpolat-
for the cluster accretion rate. ing C4 kernel, and time dependent artificial thermal diffusion
Our analysis relies on a suite of hydrodynamical simula- and viscosity. Some other main features of this simulation are
tions from the Three Hundred Project3 . These are a set of the gas cooling with metal contributions, star formation with
re-simulations of 324 cluster-centered regions extracted from chemical enrichment with AGB phase [59], Supernovae and
the The MultiDark Planck 2 simulation4 (hereafter MDPL2). AGN feedback [57]. The re-simulated clusters have a mass
The Three Hundred project provides a large number of mas- resolution of mDM = 1.27 × 10⁹ h−1 M for the DM particles
sive clusters, while also providing high resolution gas physics and mSPH = 2.36 × 10⁸ h−1 M for the gas particles. We note
necessary to capture shocks. that the stability of simulated cluster entropy profiles to the
The paper is organized as follows. In §II we describe the choice of numerical code has been studied by Sembolini et al.
Three Hundred project simulations, how we extract Comp- [53].
ton y maps from the simulations, and how we use these to
construct mock-observed Compton y profiles. We present our
analysis of these simulated profiles in §III and conclude in B. y-maps from the Three Hundred simulations
§IV.
Compton y maps for each cluster are generated with the
II. SIMULATED DATA pyMSZ package7 , which has been presented in [21] (see Baldi
et al. [10] for the kinetic SZ effect maps generated by this
package). To generate the y-maps, we use all the simulation
A. The Three Hundred Project
data within a radius of 12 Mpc/h from the center of the re-
simulation region. The signal is smoothed into a 2D-mesh
The simulated galaxy clusters studied in this work belong with size of 5 kpc using the same SPH kernel as the simula-
to the Three Hundred Project, which is described in [21]. The tion. This pixel size corresponds to an angular resolution of
sample consists 324 spherical regions centered on each of the 2.5316", significantly higher resolution than the current and
most massive clusters identified at z = 0 within the MDPL2 planned datasets that we consider. In this work, we mainly fo-
simulation [34], a (1 h−1 Gpc)3 dark matter (DM) only simu- cus on Compton y maps generated at a redshift of z = 0.193.
lation containing 38403 DM particles and using Planck 2016 This choice is motivated by the fact that ongoing and future
cosmological parameters [48] (Ω M = 0.307, Ωb = 0.048, SZ surveys will detect many clusters near this redshift, and it
ΩΛ = 0.693, σ8 = 0.823, n s = 0.96, h = 0.678). The clus- is sufficiently low that narrow shock features are likely to be
ters are initially selected according to their halo virial mass5 resolved by roughly 1 arcminute resolution experiments.
Mvir,c ' 8 × 10¹⁴ h−1 M at z = 0. However, a much larger
region (beyond the Lagrangian volume of the cluster) with
radius R = 15h−1 Mpc and centered on the minimum of the
C. Cluster selection: identifying relaxed and not relaxed
cluster potential at z = 0 is used to generate the initial condi- clusters
tions for each cluster with multiple levels of mass refinement
using the ginnungagap code,6 i.e. the particle number at the
outer region is decreased based on their distance to the cluster As we show below, relaxed clusters can provide a cleaner
center to provide the gravitational field at the largest scales. environment in which to look for shock features in the cluster
These initial conditions are re-simulated with several simu- y profiles than not relaxed clusters. Recent mergers and sig-
lation codes which use different baryon models and hydro- nificant substructure introduce features in the y profiles that
dynamic solvers: gadget-x [46, 50], gadget-music [52], and could interfere with our ability to identify features caused by
shocks. For the most part, therefore, we will focus our analy-
sis on a subset of clusters deemed to be relaxed. Since one of
the main aims of this analysis is to determine the feasibility of
3 https://the300-project.org/
detecting shock features in future data, we will adopt a relax-
4 https://www.cosmosim.org ation criterion that can (at least approximately) be determined
5 In this paper, we indicate with R∆c/m the radius of the sphere whose den- from data.
sity is ∆c/m times the critical density (denoted by c) or the mean density
(denoted by m) of the Universe at that redshift ρ(R∆c/m ) = ∆ρc/m (z). We
specifically use overdensities equal to ∆ = 500,200, and vir, where ∆vir
corresponds roughly to 98 for the assumed cosmological model[17].
6 https://github.com/ginnungagapgroup/ginnungagap 7 https://github.com/weiguangcui/pymsz4
We use the fsub criterion (defined as the mass fraction in the shock features occur in roughly the same location for each
substructures identified within R200c of the main halo) to de- cluster, and significantly enhances the signal-to-noise of the
termine the relaxation state of the clusters, as this quantity can shock features in the average y profile. However, for real data,
be inferred from observations through (satellite) galaxy-halo the true cluster R200m is unknown. Instead, we envision that a
relations. The halo and galaxy catalogue was identified with noisy estimate of the cluster mass will be formed from some
the AMIGA Halo Finder [36]. The lowest mass structure has SZ observable (such as the amplitude of y within some aper-
at least 32 particles, which has a mass of ∼ 3 × 10¹⁰ M . Our ture), and this estimate of cluster mass will be used to form
“relaxed” selection is an estimate of R200m . We model the uncertainty in the clus-
ter mass estimates by assigning each cluster an “observed”
fsub < 0.1, (1) mass drawn from a Gaussian centered on the true cluster mass,
M200m and with scatter σ = 0.05M200m , fairly typical of the
which contains 68 clusters. We note here that fsub correlates level of scatter expected for the SZ observable YSZ [27]. These
with the center of mass offset [20]. Including center of mass observed masses can then be used when estimating R200m for
offset as an additional parameter to quantify the cluster dy- the purposes of stacking.
namical state only results in a small change to the sample.
When stacking clusters, we throw out an additional 6 clusters
for which R200m 8 is so large that we cannot reliably estimate
the y profile at large R/R200m because of the restrictions im-
posed by the finite high-resolution regions of the simulation.
As we discuss in more detail in §III F, fsub correlates with the
shock radius, as expected since higher fsub halos will gener-
ally be faster accreters. The measured shock radius is there- E. Compton y profiles
fore somewhat sensitive to our fsub selection.
We compute the azimuthally averaged Compton y profiles
D. Mock observations of all the simulated clusters. The profiles are first computed
using 50 logarithmically spaced radial bins between 0.05 Mpc
Several observational effects are expected to degrade our and 12 Mpc. These profiles are then interpolated onto log-
ability to detect shock features around galaxy clusters with fu- arithmically spaced bins of R/R200m . As discussed in Lau
ture SZ data sets. These include instrumental and foreground et al. [40], the infall of gas onto a galaxy cluster after de-
noise, the washing out of small-scale features by the telescope parture from the Hubble flow is determined by the enclosed
beam, and scatter in the mass-observable relations (which in- mass at that time, which is set by the matter density. Since the
terferes with our ability to correctly scale the sizes of clusters outer gas profiles of low redshift galaxy clusters are formed
when averaging their profiles). We will explore the conse- at late times during dark energy domination, the critical den-
quences of these effects by adding them to simulated data. sity of the Universe departs significantly from the matter den-
We incorporate y noise into the analysis by generating sity, and ρm provides a better measure of the enclosed mass
Gaussian noise realizations of the expected instrumental and than ρc . Therefore, the outer profiles of clusters are more self-
foreground noise for observations by CMB-S4. The y noise similar when scaled by R200m rather than R200c . For the cases
forecasts for CMB-S4 are taken from Abazajian et al. [1]. where we include observational scatter in the mass-observable
The impact of the telescope beam is simulated by convolv- relation, we use the mock-observed mass discussed above to
ing the two-dimensional Compton y images with a Gaussian compute R200m . Within each radial bin, we compute the av-
beam. We assume σbeam = 1 arcmin, corresponding roughly erage Compton y value for the mock clusters to construct an
to the resolution of y maps that will be produced by CMB- azimuthally averaged y profile. The cluster y profiles are then
S4. As noted previously, all clusters are placed at z = 0.193. averaged across various subsets of clusters, as we discuss be-
Real clusters will of course be spread over some distribution low. The covariance of the average profile is computed using
in redshift, and will therefore experience different levels of a leave-one-out jackknife.
beam smoothing in terms of physical scale. However, as long
as the cluster sample is at z . 1, we do not expect a significant In several cases, we find it useful to compute the logarith-
impact of the beam on the identification of shock features, as mic derivatives the measured Compton y profiles. To do so,
we show below. we follow the procedure introduced in Diemer and Kravtsov
When computing the averaged Compton y profiles for the [24]. For each cluster, we smooth its logarithmic y profile us-
simulated clusters, we re-scale each profile in the radial direc- ing a Savitsky-Golay filter of window size 5 and polynomial
tion by the value of R200m for each cluster (see discussion and order 2. The smoothed profile is then fit with a cubic spline,
motivation for using R200m in §II E). This scaling ensures that evaluated on a very fine radial grid, and the derivative is com-
puted with finite differences. We find that our results are not
very sensitive to the window size or polynomial order of the
Savitsky-Golay filter, provided these are not chosen to intro-
8 Note that because the mean overdensity ρm = Ωm ρc at z = 0, R200m is much duce so much smoothing that the profile features are washed
larger than R200c . out.5
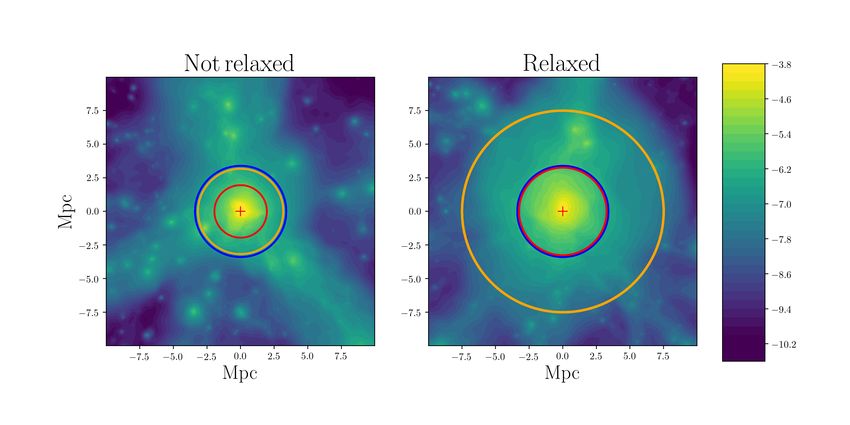
FIG. 1. Example Compton y maps from the Three Hundred simulations. The image on the left shows a cluster with M200m = 1.45 × 10¹⁵ h−1 M
which has been determined to be not relaxed based on the criteria discussed in §II C; the figure on the right shows a relaxed cluster with
approximately the same mass. Both clusters are at z = 0.193. The blue, red, and orange rings indicate the locations of R200m , the first minimum
in the logarithmic derivative of the cluster y profile, and the second minimum, respectively.
III. RESULTS more scatter and more fluctuations in their y profiles owing to
the presence of large nearby halos.
A. The Compton y profiles of individual clusters Gas within the external shock boundary has significantly
higher pressure than gas outside the shock. Consequently,
such shocks are associated with a sudden decline in the clus-
We first consider the Compton y profiles of individual clus- ter pressure profile as one moves away from the cluster center.
ters, arguing that features due to external shocks can be seen This decline is often preceded by a flattening of the pressure
in these profiles. However, we will show that detecting these profile, as one nears the recently shocked gas [43]. Since y is
features in data from future SZ surveys will require averag- proportional to the line-of-sight integral of the pressure pro-
ing across clusters to increase the signal-to-noise, motivat- file, we expect shocks to lead to similar behavior in the y pro-
ing the subsequent analysis discussed in §III B. Fig. 1 shows file, albeit smoothed out by the line-of-sight integration. In-
example Compton y maps for an not relaxed (left) and re- deed, in several of the profiles of the relaxed clusters shown in
laxed (right) cluster; the determination of relaxation state is Fig. 2, there is an apparent flattening of the profile, followed
described in §II C. The clusters have close to the same mass, by a subsequent steepening at roughly 2R200m . This feature is
M200m ≈ 1.45 × 10¹⁵ h−1 M . The central crosshair indicates especially clear for the relaxed cluster in Fig. 1 (shown with
the location of the halo center as determined from the maxi- the black curves in the right-hand panels of Fig. 2), but can
mum density peak in AHF. The not relaxed cluster has a less be easily seen for the other relaxed clusters, and some of the
circular and less extended y signal, shows an indication of sub- not relaxed clusters, as well. These features, and their loca-
structure, and exhibits a larger contribution from nearby fila- tion at roughly 2R200m , are consistent with the shock features
ments. The blue circle in each panel indicates R200m for the identified in the analysis of Molnar et al. [43]. There is also a
clusters. We will return to the other colored circles below. weaker minimum in the logarithmic derivative of several clus-
Fig. 2 shows a sample of the cluster y profiles (top panels) ters near R200m .
for some of the not relaxed (left) and relaxed (right) clusters In order to more clearly see the flattening and subsequent
in the full sample. The black lines indicate the profiles for steepening of the Compton y profile that is associated with
the two clusters seen in Fig. 1. We have normalized the radial shocks, we take the logarithmic derivatives of the y profiles
coordinates relative to the R200m of each cluster, as discussed using the procedure described in §II E; these are shown in the
in §II E. There is clearly large scatter between the profiles, bottom panels of Fig. 2. The logarithmic derivative profiles
as the clusters have different masses and different levels of for several clusters exhibit minima at near to 2R200m . We note
nearby structure. The not relaxed clusters typically exhibit that some of the relaxed and not relaxed clusters exhibit min-6
10−5
Unrelaxed 10−5
Relaxed
10−6 10−6
10−7 10−7
y
10−8 10−8
CMBS4 noise
10−9 10−9
5 5
d ln y/d ln R
0 0
−5 −5
−10 −10
−15 −15
0.7 0.8 0.9 1.00 2.0 3.0 0.7 0.8 0.9 1.00 2.0 3.0
R/R200m R/R200m
FIG. 2. Example Compton y profiles of not relaxed (left) and relaxed (right) clusters. Top panels shows the Compton y profiles, while the
bottom panels show the logarithmic derivatives of this quantity. Steepening of the y profiles of the relaxed clusters at roughly 2R200m is evident
for many of the clusters. The black lines correspond to the profiles of the two clusters shown in Fig. 1.
ima in their logarithmic derivative profiles at multiple radii. 0.1 and 4R200m . It is clear from Fig. 2 that it will be difficult
This is not surprising: clusters can have multiple shocks, and to directly measure shock features around individual clusters
some features in the y profiles may not be due to shocks at all, in data from CMB-S4: the standard deviation of the noise is
but rather to variations in the gas density around the clusters. larger than the amplitude of the y profile at 2R200m , where the
The red and orange rings in Fig. 1 indicate the locations of the shocks features occur. This motivates our decision to focus
first and second minima in the logarithmic derivative profiles on the Compton y profiles averaged over many galaxy clus-
of the clusters, respectively. ters. However, detection of shock features in the y profiles of
Fig. 2 also shows the noise level projected for y profile mea- individual clusters may still be possible, particularly for fea-
surements with CMB-S4 (dotted black line). This noise curve tures at lower radial distances (such as virial shocks) and for
represent the standard deviation of the profile from noise very massive clusters. Indeed Hurier et al. [31] have recently
alone, where the noise is calculated using Gaussian realization claimed a detection of a virial shock around a massive cluster
of the y noise power spectrum described in §II. Note that the using Planck y maps.
noise profile is sensitive to the radial binning: finer bins will In addition to measuring the cluster y profiles at fixed red-
have higher noise variance as they average over a smaller area shift, it is also useful to consider the evolution of the loga-
of sky. For the purposes of this plot, we adopt 10 bins between rithmic derivative profiles as a function of redshift. Taking7
0
0.8 d ln y/d ln x -6
0.6
∂ ln y/∂ ln R
−4
0.4
−6
z = 0.304
z = 0.247
z = 0.193 0.2
−8
z = 0.141
z = 0.092
0.0
−10
2 × 100 3 × 100 4 × 100 6 × 100 101 0 1 2 3 4 5 6 7
R [Mpc] Rminima/R200m
FIG. 3. Evolution of the logarithmic derivative of the Compton y pro- FIG. 4. The distribution of locations of minima in the logarithmic
file. The profiles shown correspond to the relaxed cluster in Fig. 1. derivatives of the Compton y profiles of the simulated clusters. Min-
ima tend to occur at roughly R200m and 2R200m . The minima near
2R200m are typically deeper (corresponding to more negative loga-
rithmic slopes) than those near R200m .
as an example the relaxed cluster shown in the right panel of
Fig 1, Fig. 3 shows the evolution of the logarithmic derivative
of this cluster’s y profile over the range of z ≈ 0.3 to z ≈ 0.1. B. The stacked Compton y profiles
Although nearby matter (halos and gas) is infalling into the
cluster, the evolution of the logarithmic derivative minimum Motivated by the discussion above, we now explore the pos-
is a movement outward. This is consistent with the associa- sibility of averaging y profiles from multiple clusters to im-
tion of the minimum in the logarithmic derivative with cluster prove the signal-to-noise of external shock measurements. It
shock features, since the shock boundary is expected to grow is not obvious that averaging the y profiles of multiple clus-
as the cluster accumulates more gas. ters is a sensible way to improve the signal-to-noise of shock
measurements. As seen in Fig. 2, there is considerable scatter
We next consider the distribution of minima in the loga- in the y profiles of clusters, and this scatter could cause the
rithmic derivatives of the y profiles of all the simulated clus- shock features to disappear in the stack. However, we will
ters. Fig. 4 shows this distribution, split on the depth of the show below that as long as the profiles are rescaled by R200m ,
minima in the logarithmic derivative. The deep minima with a clear feature emerges in the stacked Compton y profiles that
slopes less than −6 group together around 2R200m , which we is associated with external shocks.
associate with the external shocks. The clusters also show a
The top panel of Fig. 5 shows the uncertainty band on the
preference for shallow minima at roughly R200m , which may
average Compton y profile of the relaxed sample of clusters,
be due to so-called virial shocks [43].
computed as described in §II E. The profile exhibits a flatten-
While the minima in the logarithmic derivative profiles are ing, followed by a rapid steepening at roughly 2R200m . The
(at least sometimes) associated with external shocks, we em- bottom panel of Fig. 5 shows the constraints on the averaged
phasize the location of this minimum does not necessarily co- logarithmic derivative profile. There is a deep minimum in
incide with the location of the shock identified from the peak the logarithmic derivative profile near 2R200m , which we as-
of the entropy profile (e.g., as in Lau et al. 40). For one, y is sociate with external shocks. The appearance of this feature
a projected quantity while the peak of the entropy profile is in the stacked Compton y profile is one of the main results of
measured in 3D. Furthermore, as seen in Molnar et al. [43], our analysis. We note that the feature still appears to some
even in 3D, the entropy profile does not peak exactly at the lo- extent when stacking the profiles of not relaxed clusters, but it
cation of the steepest slope of the pressure profile. However, is less pronounced. When stacking the cluster profiles without
the two are closely related as they are caused by the same rescaling by R200m , the sharp minimum feature again becomes
phenomenon. We have not attempted to quantify the small weaker; again, this reflects the greater universality of the outer
shift between the location of the shock and the location of cluster profiles when scaled by R200m [40]. We note that the
the minimum of the logarithmic derivative of y, as our main shallow minimum seen at roughly R200m may be due to the
purpose here is to identify features in the y profile associated inner (virial) shock.
with shocks that can be measured in the data. The minimum The green dotted curve in the top panel of Fig. 5 the ex-
of the logarithmic derivative of the y profile serves exactly that pected y profile derived from the Battaglia et al. [12] pressure
purpose. profile. The Battaglia et al. [12] profile was derived from fit-8
10−5 C. The impact of nearby halos on the y profile
One-halo term
(Battaglia et al. 2012)
Two-halo term One might worry that the presence of nearby halos could
Total halo model impact our ability to detect features associated with external
shocks in the cluster-averaged Compton y profile. As shown in
10−6
Power et al. [49], massive infalling substructures can produce
clear signatures of shocks in the direction of their motions.
Furthermore, overdensities of gas in nearby halos could pro-
y
duce features in the y profile that appear similar to the features
caused by shocks. We will argue below that while nearby ha-
10−7
los do have an impact on the Compton y profiles of clusters,
they do not significantly impact our main conclusions about
the shock features in the average y profile of many clusters.
In the language of the halo model [19], the contributions
All relaxed clusters to the cluster-centric y profile coming from nearby halos is
10−8
the two-halo term. The two-halo term in the context of the
2
halo-y correlation has been considered by several authors [e.g.
38, 62]. The expected two-halo term for the clusters in the
sample is shown as the purple dashed curve in the top panel of
0
Fig. 5. We compute the two-halo term as described in Pandey
et al. [47], adopting the Battaglia et al. [12] pressure profile
model and a linear bias model to describe halo clustering. The
d ln y/d ln R
−2
two-halo term offers a reasonable description of the y profile
at large R/R200m , despite simplifications such as our assump-
tion of linear bias. The total halo model profile is the sum
−4
of the one and two-halo terms, shown as the orange curve in
the top and bottom panels of Fig. 5. While the shock feature
in the cluster-averaged y profile occurs near to the one-to-two
−6 Total halo model halo transition, it appears qualitatively different from the halo
No nearby neighbors model prediction for this transition. The shock feature results
All relaxed clusters in a plateauing of the y profile, followed by a steep decline,
−8
0.5 1.0 2.0 3.0 followed by the resumption of a less steep profile (top panel
R/R200m of Fig. 5). The one-to-two halo transition, however, does not
exhibit any such steep decline. The bottom panel of Fig. 5
FIG. 5. Top: the averaged Compton y profile of the relaxed clus-
shows that the logarithmic derivative of the total halo model
ters as a function of R/R200m (blue band). The width of the band prediction never goes below -3, while the logarithmic deriva-
represents the 68% confidence interval, computed by jackknifing the tive of the simulated cluster profiles reaches slopes as steep as
cluster sample. The green dotted curve shows a cluster y profile com- -5 and steeper. In other words, assuming the cluster pressure
puted from the Battaglia et al. [12] fitting function (i.e. the one-halo profile of Battaglia et al. [12], the halo model fails to provide
term), while the purple dashed curve represents the expected con- an accurate description of shock features in the Compton y
tributions from nearby halos (i.e. the two-halo term). The orange profile. This is not surprising, as the halo model prediction
curve represents the sum of the one and two-halo terms. The stacked includes no information about the shocking of gas.
cluster profile exhibits a plateau at R/R200m ∼ 2, followed by a rapid
To test the impact of large nearby halos on the inferred
decline. We associate this feature with outer shocks in the individ-
ual cluster y profiles. Bottom: logarithmic derivative of the stacked
shock locations, we repeat our analysis after removing any
Compton y profile, which shows a narrow minimum at R/R200m ∼ 2. of the clusters that have a neighbor with M > 8 × 10¹³ M
The orange curve represents the logarithmic derivative of the sum of within 10 Mpc. This selection reduces the number of relaxed
the one and two-halo terms from the top panel. The red dashed curve clusters to 13. A comparison between our results with all re-
shows the measured logarithmic derivative profile when the cluster laxed clusters and the results found when additionally exclud-
sample is restricted to those clusters that do not have massive nearby ing clusters with massive neighbors is shown in the bottom
neighbors. panel of Fig. 5. Since the exclusion criterion significantly
changes the cluster sample, we do not expect the y profile
to remain unchanged. Indeed, selecting halos without nearby
ting the inner part of the cluster pressure profiles in hydrody- massive neighbors amounts to a selection on cluster environ-
namical simulations, so it is not surprising that it agrees with ment, which correlates strongly with accretion rate. We ex-
our results very well at small scales. At large scales, however, pect then, that this selection may modify the shock location
the profile departs from the measurements as a result of the to some extent (see further discussion of this point in §III F).
shock feature, and the contributions from nearby halos, which Nonetheless, Fig. 5 shows that the appearance of the shock
we discuss in more detail below. feature is fairly robust to the selection of clusters without mas-9
sive neighbors. In principle, one could also attempt to remove
two-halo contributions to the cluster-y profile by selecting iso- 2
lated clusters; however, see Hill et al. [30] for an explanation
of why this approach presents additional difficulties.
0
−2
d ln y/d ln R
−4
−6 No beam, no noise
beam, no noise
0 −8 beam, noise, 1000 clusters
beam, noise, M-obs scatter, 1000 clusters
d ln y/d ln R
−2 −10
10−1 100
R/R200m
−4
−6 FIG. 7. The impact of telescope beam and observational uncertain-
ties on measurements of the logarithmic derivative of the cluster-
0.5 1.0 2.0 3.0 averaged Compton y profile. The red curve shows the true log-
R/R200m derivative of the average Compton y profile of the simulated galaxy
clusters. The orange dashed curve shows the impact of smoothing of
−200 the Compton y maps by a 1 arcmin beam. The black band shows the
expected errorbars resulting from CMB-S4-like noise when averag-
vradial [km/s]
−400 ing across 1000 clusters (note that the band does not include scatter
due to variations in the profile shapes). The blue band additionally
−600 adds scatter in the mass-observable relation.
−800
−1000
0.5 1.0 2.0 3.0
r/R200m D. Connecting the y profile with other halo properties
1
0
Accreting gas rapidly decelerates and increases in tempera-
d ln T /d ln r
ture as it passes through the external shock. Consequently, we
−1 expect the shock features observed in the y profile to be re-
lated to features in the gas velocity and temperature profiles.
−2 Fig. 6 explores these connections.
−3 The top panel of Fig. 6 shows the logarithmic derivative of
0.5 1.0 2.0 3.0
r/R200m
the cluster-averaged y profile, as in Fig. 5. For this figure,
we consider only the relaxed sample of clusters. The middle
panel of Fig. 6 shows the average radial velocity profile of
the gas for the same set of clusters. The narrow minimum in
logarithmic derivative of Compton y closely corresponds with
the minimum in the radial velocity profile. This supports our
FIG. 6. Top: logarithmic derivative of the average Compton y profile
interpretation of the feature in the averaged y profile as be-
of the relaxed clusters. The profile is plotted as a function of the pro-
jected radius, R/R200m . Middle: the averaged radial velocity profile
ing due to the outer shock. Note we use two different radii in
of gas around the same sample of clusters. The location of the narrow Fig. 6: the y profile is a projected quantity and we therefore
minimum in the logarithmic derivative of Compton y (seen in the top plot it as a function of the projected radial distance, R, while
panel) roughly aligns with the minimum in the radial velocity pro- the radial velocity profile and temperature profiles are mea-
file, as expected because of shocks experienced by the infalling gas. sured as functions of the three-dimensional radial distance, r.
The profile is plotted as a function of the 3D cluster-centric radius,
r/R200m . Bottom: the logarithmic derivative of the averaged radial The bottom panel of Fig. 6 shows the logarithmic derivative
temperature profile of gas around the same sample of clusters. The of the averaged cluster temperature profile. As one moves to
temperature profiles exhibit a steepening near the shock radius. larger radius near the shock location, the temperature profile
becomes steeper and steeper. This is expected, as the temper-
ature of the gas increases as it passes through the shock.10
E. Impact of observational uncertainties ternal shocks can exist far outside the virial boundary of the
halo [43, 66, 67]. In this section we investigate how the shock
We now consider how three observational effects can im- features in the averaged Compton y profiles correlate with the
pact our results: (1) the instrumental beam, (2) noise in the splashback feature in the dark matter profiles of clusters.
Compton y maps, (3) uncertainty on the value of R200m used While the actual splashback surface is ideally measured
when rescaling the profiles. Fig. 7 shows the impact of these from the apocenter of particle orbits as in Diemer [23], we
observational effects. The red curve shows the stacked log- measure the splashback radius here as the location of the min-
arithmic derivative profile in the absence of beam or noise. imum of the slope in the logarithmic density profile. This ra-
The gold curve adds the impact of the instrumental beam. dius is known to capture the phase space transition between
The beam flattens the profile in the inner parts, leading to a the infall and virialized region and is moreover accessible ob-
more positive logarithmic derivative. Even with the beam, servationally [e.g. 44].
though, the narrow minimum in the logarithmic derivative of We compare the shock and splashback radii for clusters as
the Compton y profile is clearly visible. This is because for a function of the accretion history of the halo. We use fsub ,
our clusters at z = 0.193, the shock extends a sufficiently large the mass fraction of the cluster in substructure, as a proxy for
angle on the sky that it is not significantly degraded by the the accretion rate. This quantity is potentially observable and
beam. is related to the number of bright satellites in clusters. Young
The black band shown in Fig. 7 represents the uncertainty halos that are fast accreters have large satellite fractions. With
on the logarithmic derivative that results from using a sample time, as the halo stops growing and enters a slow accretion
of 1000 clusters when instrumental noise is included. We find phase, substructure gets destroyed due to tidal effects and dy-
that 1000 clusters are sufficient to obtain a reliable reconstruc- namical friction. fsub is therefore strongly correlated to the
tion of the Compton y profile, assuming noise levels character- accretion rate of the cluster as shown in the left panel of Fig.
istic of CMB-S4. Since current generation surveys like SPT- 8. The accretion rate of the cluster, Γ = d log M200m /d log a,
3G [14] and AdvACT [29] are already detecting thousands is obtained from the mass accretion history measured from
of clusters, and since these surveys have (in some cases) noise the simulation. We evaluate the slope of the mass history at
levels that are only factors of a few larger than CMB-S4, these z = 0.193 by fitting the function M = e−αz [65] to the mass
surveys may already be well positioned to detect a signature of between between the 0.193 < z < 0.350.
external shocks through stacking. Our analysis here focuses In order to explore the relation between shock and splash-
on CMB-S4 in order to bracket the possibilities of current and back radius, we divide the cluster sample into two subsets with
future surveys. different fsub . We first remove clusters with Γ > 4 (the grey
The blue band in Fig. 7 adds additional scatter due to un- region of the left panel of Fig. 8), as clusters with large Γ may
certainty in the measurement of cluster mass, as described be in the process of major mergers. We then split the remain-
in §II D. This additional scatter smears out the shock feature ing cluster sample in halves based on the median value of fsub .
somewhat, as it means that R200m cannot be determined as pre- The value of fsub used for this split is shown as the horizontal
cisely. However, the shock-induced feature is is still detected dashed line in the left panel of Fig. 8.
at high significance. In the right panel of Fig. 8 we show the relation between the
location of the shock and the location of the splashback radius
for the two cluster subsamples split on fsub . The shock radius
F. Splashback and shocks: correlation between the splashback is determined from the location of the minimum of the loga-
radius and shock location rithmic derivative of the averaged y profile, while the splash-
back radius is determined from the averaged subhalo density
Recently, the splashback radius has been established as the profiles. Both radii are normalized by R200m , so any correla-
boundary of the virialized, or multi-streaming region of the tion between the cluster mass and the two radii is effectively
dark matter component of a halo [4, 24]. This surface traces cancelled. We see that halos with high fsub , corresponding
the boundary of the first apocenter of the most recently ac- to high accretion rate, have both a smaller splashback radius
creted material, separating a region of dark matter infall from and a smaller shock radius. The dependence of the splashback
the regions within which dark matter particles or other col- radius on accretion rate is expected, as particle apocenters be-
lisionless objects like galaxies orbit. Arguably, the external come smaller due to the rapid growth of the halo potential
shock forms the boundary of the gaseous component of the [24]. We see a similar behavior in the location of the outer
halo. shock. The correlations between splashback and shock radius
It is known that both the locations of external shocks and has previously been seen in simulations [9, 63]. Our result
the locations of the outer caustic in the dark matter distribu- here shows that this correlation persists when the shock loca-
tion both depend on the evolution history of the halo [15, 54]. tion is estimated from the minimum of the logarithmic deriva-
In particular, both these features are a function of the mass tive of the stacked y profile.
accretion rate of the halo. We therefore expect the splashback Fig. 8 also makes it clear that the inferred shock location
radius and the shock location to be correlated. Although an- will vary depending on the fsub cuts. Our nominal cut of
alytical studies with self-similar models [15] showed that the fsub < 0.1 corresponds (very) roughly to the blue point in the
location of the accretion shock coincides with the location of right panel of Fig. 8. As we consider clusters with higher fsub ,
the outer caustic, studies in simulations have shown that ex- the shock location decreases, and the profiles exhibit more11
1.0
2.20
High fsub
2.15
0.8 Low fsub
r = 0.60 2.10
Rshock/R200m
fsub 0.6 2.05
2.00
0.4
1.95
0.2 1.90
1.85
0.0
0 5 10 15 20 0.9 1.0 1.1
Γ Rsp/R200m
FIG. 8. Left: the quantity fsub that we use to identify the relaxed population of clusters is correlated with the cluster accretion rate, Γ, with
correlation coefficient of r = 0.6. The grey band illustrates our cut on cluster accretion rate imposed when computing the measurements
shown in the right panel. The dashed horizontal line indicates the median fsub of the remaining clusters, which is used to split the full sample
into the high and low fsub subsamples shown at right. Right: the shock radius and splashback radius are correlated. The shock radius here is
identified using the minimum of the logarithimic derivative of the cluster-averaged y profile, while the splashback radius is identified from the
dark matter particles as described in the main text. The two data points shown correspond to the cluster samples defined in the left panel.
scatter, as seen in Fig. 2. As a result the errorbars on the shock strate that outer shocks result in a narrow minimum in the
position for the high fsub sample are larger than those for the logarithmic derivative of the stacked cluster y profile. This
low fsub sample. An analysis in data would need to consider shock-associated feature is robust to smoothing by instrumen-
the signal-to-noise trade off between increasing the number of tal beams and uncertainty in R200m . Furthermore, for realistic
clusters and increasing the scatter in individual cluster y pro- levels of noise (i.e. typical of CMB-S4), high significance de-
files as the fsub (or other accretion rate proxy) cut is relaxed. tections of the shock features can be obtained with samples of
roughly a thousand clusters. Such detections may already be
in reach of ongoing CMB surveys such as SPT-3G and Ad-
IV. DISCUSSION vACT.
A. Summary
B. Implications
The outskirts of galaxy clusters reflect their recent accre-
tion history and their local environments. The collisional gas We have shown that shock features are detectable in the av-
accreting onto clusters experiences shocks at several R200m eraged y profiles of galaxy clusters with near-term CMB data.
that significantly impact the thermodynamic properties of the Obtaining such a detection is an exciting prospect. The lo-
ICM. We have presented an exploration of the detectability of cations and properties of shocks are connected to the cluster
shock features in the stacked Compton y profiles of massive accretion rate and the cluster’s large-scale environment. Mea-
galaxy clusters. Because dark matter is collisionless, on the surement of the shock radius in the averaged y profile could
other hand, its accretion gives rise to the splashback boundary be used to test different proxies for the accretion rate, and to
of the cluster, and a corresponding feature in the cluster mass compare to simulations. Detection of shocks in conjunction
profile. We have explored the correlation between shock fea- with the cluster splashback radius will provide insight into the
tures in the cluster y profiles and the splashback features in the cluster outskirts, both in mass and in gas. Detection of clus-
cluster mass profiles. ter external shocks in large cluster samples may also enable
Gas shocks in cluster outskirts have proven difficult to con- improved constraints on models of cosmic ray acceleration in
strain observationally because of the low gas densities in the the shock fronts. Moreover, the statistical detection of shocks
cluster outskirts. One promising route to detection is via the explored here can open up a new window into studying how
SZ effect. However, current and future wide-field SZ sur- the properties of galaxies change as they cross the shock and
veys are unlikely to have the sensitivity to detect these fea- splashback boundaries of clusters [e.g. 5, 13, 55].
tures around individual clusters (except perhaps the most mas- However, the detection of shock features also poses some
sive ones), as we have shown. Motivated by these considera- challenges. In particular, if these features can be detected at
tions, we show that stacking cluster y profiles as a function of high significance, modelling these features may be necessary
R/R200m can provide a promising route to constraining shock for analyzing high-precision observables derived from the SZ
features around future samples of galaxy clusters. We demon- effect. In particular, current analyses of the SZ power spec-12
trum and cross-correlations with the SZ typically do not in- ACKNOWLEDGMENTS
clude shock features when modeling these observables. Work-
ing in physical coordinates (rather than coordinates rescaled We thank Dhayaa Anbajagane, Neal Dalal, Andrey
by R200m ) will smear out the shock features, but some impact Kravtsov, Shivam Pandey, Debora Sijacki and Congyao
from the shocks may remain. We postpone a more careful Zhang for useful discussions related to this paper. AK is
investigation of the effects of shocks on other observables to supported by the Ministerio de Ciencia, Innovación y Uni-
future work. versidades (MICIU/FEDER) under research grant PGC2018-
094975-C21 and further thanks Cocteau Twins for victoria-
land.
[1] K. Abazajian, G. Addison, P. Adshead, Z. Ahmed, S. W. Allen, arXiv:1907.04473, July 2019.
D. Alonso, M. Alvarez, A. Anderson, K. S. Arnold, C. Bac- [2] K. N. Abazajian, P. Adshead, Z. Ahmed, S. W. Allen,
cigalupi, K. Bailey, D. Barkats, D. Barron, P. S. Barry, J. G. D. Alonso, K. S. Arnold, C. Baccigalupi, J. G. Bartlett,
Bartlett, R. Basu Thakur, N. Battaglia, E. Baxter, R. Bean, N. Battaglia, B. A. Benson, C. A. Bischoff, J. Borrill, V. Buza,
C. Bebek, A. N. Bender, B. A. Benson, E. Berger, S. Bhimani, E. Calabrese, R. Caldwell, J. E. Carlstrom, C. L. Chang, T. M.
C. A. Bischoff, L. Bleem, S. Bocquet, K. Boddy, M. Bonato, Crawford, F.-Y. Cyr-Racine, F. D. Bernardis, T. de Haan,
J. R. Bond, J. Borrill, F. R. Bouchet, M. L. Brown, S. Bryan, S. di Serego Alighieri, J. Dunkley, C. Dvorkin, J. Errard,
B. Burkhart, V. Buza, K. Byrum, E. Calabrese, V. Calafut, G. Fabbian, S. Feeney, S. Ferraro, J. P. Filippini, R. Flauger,
R. Caldwell, J. E. Carlstrom, J. Carron, T. Cecil, A. Challi- G. M. Fuller, V. Gluscevic, D. Green, D. Grin, E. Grohs, J. W.
nor, C. L. Chang, Y. Chinone, H.-M. S. Cho, A. Cooray, T. M. Henning, J. C. Hill, R. Hlozek, G. Holder, W. Holzapfel, W. Hu,
Crawford, A. Crites, A. Cukierman, F.-Y. Cyr-Racine, T. de K. M. Huffenberger, R. Keskitalo, L. Knox, A. Kosowsky,
Haan, G. de Zotti, J. Delabrouille, M. Demarteau, M. De- J. Kovac, E. D. Kovetz, C.-L. Kuo, A. Kusaka, M. L. Je-
vlin, E. Di Valentino, M. Dobbs, S. Duff, A. Duivenvoorden, une, A. T. Lee, M. Lilley, M. Loverde, M. S. Madhavacheril,
C. Dvorkin, W. Edwards, J. Eimer, J. Errard, T. Essinger- A. Mantz, D. J. E. Marsh, J. McMahon, P. D. Meerburg, J. Mey-
Hileman, G. Fabbian, C. Feng, S. Ferraro, J. P. Filippini, ers, A. D. Miller, J. B. Munoz, H. N. Nguyen, M. D. Niemack,
R. Flauger, B. Flaugher, A. A. Fraisse, A. Frolov, N. Galitzki, M. Peloso, J. Peloton, L. Pogosian, C. Pryke, M. Raveri, C. L.
S. Galli, K. Ganga, M. Gerbino, M. Gilchriese, V. Glusce- Reichardt, G. Rocha, A. Rotti, E. Schaan, M. M. Schmittfull,
vic, D. Green, D. Grin, E. Grohs, R. Gualtieri, V. Guarino, D. Scott, N. Sehgal, S. Shandera, B. D. Sherwin, T. L. Smith,
J. E. Gudmundsson, S. Habib, G. Haller, M. Halpern, N. W. L. Sorbo, G. D. Starkman, K. T. Story, A. van Engelen, J. D.
Halverson, S. Hanany, K. Harrington, M. Hasegawa, M. Has- Vieira, S. Watson, N. Whitehorn, and W. L. K. Wu. Cmb-s4
selfield, M. Hazumi, K. Heitmann, S. Henderson, J. W. Hen- science book, first edition, 2016.
ning, J. C. Hill, R. Hlozek, G. Holder, W. Holzapfel, J. Hub- [3] P. Ade, J. Aguirre, Z. Ahmed, S. Aiola, A. Ali, D. Alonso,
mayr, K. M. Huffenberger, M. Huffer, H. Hui, K. Irwin, B. R. M. A. Alvarez, K. Arnold, P. Ashton, J. Austermann, and
Johnson, D. Johnstone, W. C. Jones, K. Karkare, N. Katayama, et al. The simons observatory: science goals and forecasts.
J. Kerby, S. Kernovsky, R. Keskitalo, T. Kisner, L. Knox, Journal of Cosmology and Astroparticle Physics, 2019(02):
A. Kosowsky, J. Kovac, E. D. Kovetz, S. Kuhlmann, C.-l. Kuo, 056–056, Feb 2019. ISSN 1475-7516. doi:10.1088/1475-
N. Kurita, A. Kusaka, A. Lahteenmaki, C. R. Lawrence, A. T. 7516/2019/02/056. URL http://dx.doi.org/10.1088/
Lee, A. Lewis, D. Li, E. Linder, M. Loverde, A. Lowitz, M. S. 1475-7516/2019/02/056.
Madhavacheril, A. Mantz, F. Matsuda, P. Mauskopf, J. McMa- [4] S. Adhikari, N. Dalal, and R. T. Chamberlain. Splashback in
hon, M. McQuinn, P. D. Meerburg, J.-B. Melin, J. Meyers, accreting dark matter halos. JCAP, 11:019, Nov. 2014. doi:
M. Millea, J. Mohr, L. Moncelsi, T. Mroczkowski, S. Mukher- 10.1088/1475-7516/2014/11/019.
jee, M. Münchmeyer, D. Nagai, J. Nagy, T. Namikawa, [5] S. Adhikari, T. hyeon Shin, B. Jain, M. Hilton, E. Baxter,
F. Nati, T. Natoli, M. Negrello, L. Newburgh, M. D. Niemack, C. Chang, R. H. Wechsler, N. Battaglia, J. R. Bond, S. Bocquet,
H. Nishino, M. Nordby, V. Novosad, P. O’Connor, G. Obied, J. DeRose, S. K. Choi, M. Devlin, J. Dunkley, A. E. Evrard,
S. Padin, S. Pandey, B. Partridge, E. Pierpaoli, L. Pogosian, S. Ferraro, J. C. Hill, J. P. Hughes, P. A. Gallardo, M. Lokken,
C. Pryke, G. Puglisi, B. Racine, S. Raghunathan, A. Rahlin, A. MacInnis, J. McMahon, M. S. Madhavacheril, F. Nati, L. B.
S. Rajagopalan, M. Raveri, M. Reichanadter, C. L. Reichardt, Newburgh, M. D. Niemack, L. A. Page, A. Palmese, B. Par-
M. Remazeilles, G. Rocha, N. A. Roe, A. Roy, J. Ruhl, tridge, E. Rozo, E. Rykoff, M. Salatino, A. Schillaci, N. Sehgal,
M. Salatino, B. Saliwanchik, E. Schaan, A. Schillaci, M. M. C. Sifón, C.-H. To, E. Wollack, H.-Y. Wu, Z. Xu, M. Aguena,
Schmittfull, D. Scott, N. Sehgal, S. Shandera, C. Sheehy, B. D. S. Allam, A. Amon, J. Annis, S. Avila, D. Bacon, E. Bertin,
Sherwin, E. Shirokoff, S. M. Simon, A. Slosar, R. Somerville, S. Bhargava, D. Brooks, D. L. Burke, A. C. Rosell, M. C.
D. Spergel, S. T. Staggs, A. Stark, R. Stompor, K. T. Story, Kind, J. Carretero, F. J. Castander, A. Choi, M. Costanzi, L. N.
C. Stoughton, A. Suzuki, O. Tajima, G. P. Teply, K. Thomp- da Costa, J. D. Vicente, S. Desai, T. H. Diehl, P. Doel, S. Ev-
son, P. Timbie, M. Tomasi, J. I. Treu, M. Tristram, G. Tucker, erett, I. Ferrero, A. Ferté, B. Flaugher, P. Fosalba, J. Frie-
C. Umiltà, A. van Engelen, J. D. Vieira, A. G. Vieregg, M. Vo- man, J. García-Bellido, E. Gaztanaga, D. Gruen, R. A. Gruendl,
gelsberger, G. Wang, S. Watson, M. White, N. Whitehorn, J. Gschwend, G. Gutierrez, W. G. Hartley, S. R. Hinton, D. L.
E. J. Wollack, W. L. Kimmy Wu, Z. Xu, S. Yasini, J. Yeck, Hollowood, K. Honscheid, D. J. James, T. Jeltema, K. Kuehn,
K. W. Yoon, E. Young, and A. Zonca. CMB-S4 Science N. Kuropatkin, O. Lahav, M. Lima, M. A. G. Maia, J. L.
Case, Reference Design, and Project Plan. arXiv e-prints, art. Marshall, P. Martini, P. Melchior, F. Menanteau, R. Miquel,You can also read


