GHANA CLIMATE RISK COUNTRY PROFILE - ReliefWeb
←
→
Page content transcription
If your browser does not render page correctly, please read the page content below
CLIMATE RISK COUNTRY PROFILE

         GHANA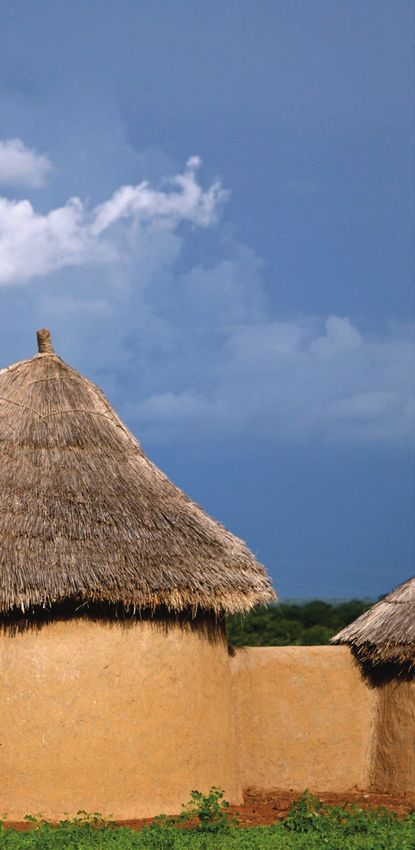
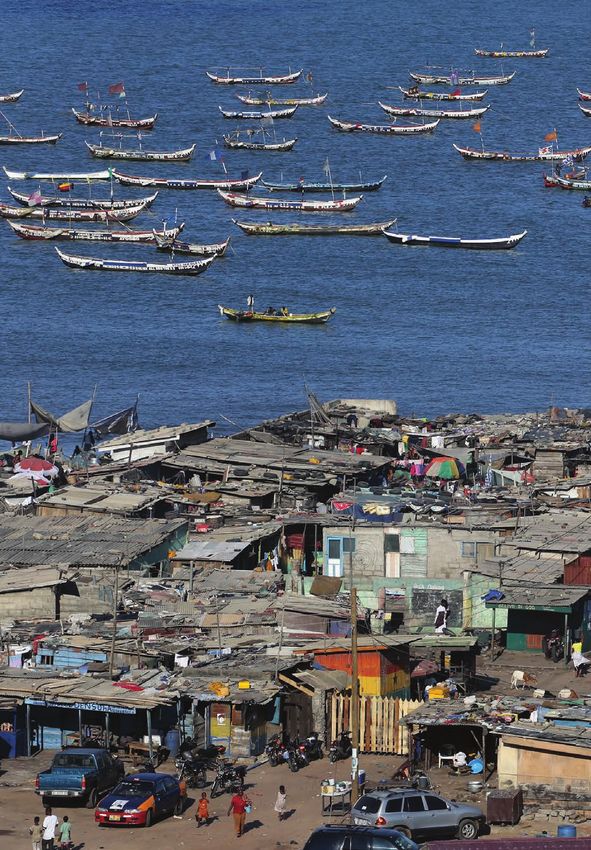
COPYRIGHT
© 2021 by the World Bank Group
1818 H Street NW, Washington, DC 20433
Telephone: 202-473-1000; Internet: www.worldbank.org

This work is a product of the staff of the World Bank Group (WBG) and with external contributions. The opinions, findings,
interpretations, and conclusions expressed in this work are those of the authors and do not necessarily reflect the views or the
official policy or position of the WBG, its Board of Executive Directors, or the governments it represents.

The WBG does not guarantee the accuracy of the data included in this work and do not make any warranty, express or implied,
nor assume any liability or responsibility for any consequence of their use. This publication follows the WBG’s practice in
references to member designations, borders, and maps. The boundaries, colors, denominations, and other information shown
on any map in this work, or the use of the term “country” do not imply any judgment on the part of the WBG, its Boards, or the
governments it represents, concerning the legal status of any territory or geographic area or the endorsement or acceptance
of such boundaries.

The mention of any specific companies or products of manufacturers does not imply that they are endorsed or recommended
by the WBG in preference to others of a similar nature that are not mentioned.

RIGHTS AND PERMISSIONS
The material in this work is subject to copyright. Because the WBG encourages dissemination of its knowledge, this work may
be reproduced, in whole or in part, for noncommercial purposes as long as full attribution to this work is given.

Please cite the work as follows: Climate Risk Profile: Ghana (2021): The World Bank Group.

Any queries on rights and licenses, including subsidiary rights, should be addressed to World Bank Publications, The World Bank
Group, 1818 H Street NW, Washington, DC 20433, USA; fax: 202-522-2625; e-mail: pubrights@worldbank.org.

Cover Photos: © Dominic Chavez/World Bank, “A view of Jamestown Fishing Village in Accra, Ghana” October 10, 2005 via
Flickr, Creative Commons CC BY-NC-ND 2.0. © Curt Carnemark/World Bank, “Women walking roadside. Ghana.” November 28,
2007 via Flickr, Creative Commons CC BY-NC-ND 2.0.

Graphic Design: Circle Graphics, Reisterstown, MD.

CLIMATE RISK COUNTRY PROFILE: GHANA                                                                                           ii
ACKNOWLEDGEMENTS
This profile is part of a series of Climate Risk Country Profiles developed by the World Bank Group (WBG). The country profile
synthesizes most relevant data and information on climate change, disaster risk reduction, and adaptation actions and policies
at the country level. The country profile series are designed as a quick reference source for development practitioners to better
integrate climate resilience in development planning and policy making. This effort is managed and led by Veronique Morin
(Senior Climate Change Specialist, WBG) and Ana E. Bucher (Senior Climate Change Specialist, WBG).

This profile was written by MacKenzie Dove (Senior Climate Change Consultant, WBG). Additional support was provided by
Yunziyi Lang (Climate Change Analyst, WBG), Fernanda Zermoglio (Senior Climate Change Consultant, WBG) and Jason
Johnston (Operations Analyst, WBG).

Climate and climate-related information is largely drawn from the Climate Change Knowledge Portal (CCKP), a WBG online
platform with available global climate data and analysis based on the latest Intergovernmental Panel on Climate Change (IPCC)
reports and datasets. The team is grateful for all comments and suggestions received from the sector, regional, and country
development specialists, as well as climate research scientists and institutions for their advice and guidance on use of climate
related datasets.

CLIMATE RISK COUNTRY PROFILE: GHANA                                                                                           iii
CONTENTS

FOREWORD  .  .  .  .  .  .  .  .  .  .  .  .  .  .  .  .  .  .  .  .  .  .  .  .  .  .  .  .  .  .  .  .  .  .  .  . 1

COUNTRY OVERVIEW .   .   .   .   .   .   .   .   .   .   .   .   .   .   .   .   .   .   .   .   .   .   .   .   .   .   .   .   .   .   .  2

CLIMATOLOGY  .   .   .   .   .   .   .   .   .   .   .   .   .   .   .   .   .   .   .   .   .   .   .   .   .   .   .   .   .   .   .   .   .   .   4
   Climate Baseline .  .  .  .  .  .  .  .  .  .  .  .  .  .  .  .  .  .  .  .  .  .  .  .  .  .  .  .  .  .  .  .  .  .  .  .  .  .  .  . 4
      Overview  .  .  .  .  .  .  .  .  .  .  .  .  .  .  .  .  .  .  .  .  .  .  .  .  .  .  .  .  .  .  .  .  .  .  .  .  .  .  .  .  .  . 4
      Key Trends .  .  .  .  .  .  .  .  .  .  .  .  .  .  .  .  .  .  .  .  .  .  .  .  .  .  .  .  .  .  .  .  .  .  .  .  .  .  .  .  . 7
   Climate Future .  .  .  .  .  .  .  .  .  .  .  .  .  .  .  .  .  .  .  .  .  .  .  .  .  .  .  .  .  .  .  .  .  .  .  .  .  .  .  .  . 8
      Overview  .  .  .  .  .  .  .  .  .  .  .  .  .  .  .  .  .  .  .  .  .  .  .  .  .  .  .  .  .  .  .  .  .  .  .  .  .  .  .  .  .  . 8
      Key Trends .  .  .  .  .  .  .  .  .  .  .  .  .  .  .  .  .  .  .  .  .  .  .  .  .  .  .  .  .  .  .  .  .  .  .  .  .  .  .  .  . 10

CLIMATE RELATED NATURAL HAZARDS .   .   .   .   .   .   .   .   .   .   .   .   .   .   .   .   .   .   .   .   .   . 11
   Overview .  .  .  .  .  .  .  .  .  .  .  .  .  .  .  .  .  .  .  .  .  .  .  .  .  .  .  .  .  .  .  .  .  .  .  .  .  .  .  .  .  .  . 11
   Key Trends .  .  .  .  .  .  .  .  .  .  .  .  .  .  .  .  .  .  .  .  .  .  .  .  .  .  .  .  .  .  .  .  .  .  .  .  .  .  .  .  .  . 12
   Implications for DRM .  .  .  .  .  .  .  .  .  .  .  .  .  .  .  .  .  .  .  .  .  .  .  .  .  .  .  .  .  .  .  .  .  .  .  .  .  . 14

CLIMATE CHANGE IMPACTS TO KEY SECTORS .   .   .   .   .   .   .   .   .   .   .   .   .   .   .   .   .   .   . 14
   Agriculture  .  .  .  .  .  .  .  .  .  .  .  .  .  .  .  .  .  .  .  .  .  .  .  .  .  .  .  .  .  .  .  .  .  .  .  .  .  .  .  .  .  . 15
   Water  .  .  .  .  .  .  .  .  .  .  .  .  .  .  .  .  .  .  .  .  .  .  .  .  .  .  .  .  .  .  .  .  .  .  .  .  .  .  .  .  .  .  .  . 18
   Energy  .  .  .  .  .  .  .  .  .  .  .  .  .  .  .  .  .  .  .  .  .  .  .  .  .  .  .  .  .  .  .  .  .  .  .  .  .  .  .  .  .  .  .  . 20
   Health .  .  .  .  .  .  .  .  .  .  .  .  .  .  .  .  .  .  .  .  .  .  .  .  .  .  .  .  .  .  .  .  .  .  .  .  .  .  .  .  .  .  .  . 22
   Forests and Natural Resources .  .  .  .  .  .  .  .  .  .  .  .  .  .  .  .  .  .  .  .  .  .  .  .  .  .  .  .  .  .  .  .  . 24

ADAPTATION .   .   .   .   .   .   .   .   .   .   .   .   .   .   .   .   .   .   .   .   .   .   .   .   .   .   .   .   .   .   .   .   .   .   . 25
   Institutional Framework for Adaptation .  .  .  .  .  .  .  .  .  .  .  .  .  .  .  .  .  .  .  .  .  .  .  .  .  .  .  .  . 25
   Policy Framework for Adaptation  .  .  .  .  .  .  .  .  .  .  .  .  .  .  .  .  .  .  .  .  .  .  .  .  .  .  .  .  .  .  .  . 26
   Recommendations .  .  .  .  .  .  .  .  .  .  .  .  .  .  .  .  .  .  .  .  .  .  .  .  .  .  .  .  .  .  .  .  .  .  .  .  .  . 26
      Research Gaps .  .  .  .  .  .  .  .  .  .  .  .  .  .  .  .  .  .  .  .  .  .  .  .  .  .  .  .  .  .  .  .  .  .  .  .  .  .  . 26
      Data and Information Gaps .  .  .  .  .  .  .  .  .  .  .  .  .  .  .  .  .  .  .  .  .  .  .  .  .  .  .  .  .  .  .  .  .  . 27
      Institutional Gaps  .  .  .  .  .  .  .  .  .  .  .  .  .  .  .  .  .  .  .  .  .  .  .  .  .  .  .  .  .  .  .  .  .  .  .  .  .  . 27

CLIMATE RISK COUNTRY PROFILE: GHANA                                                                                                                  iv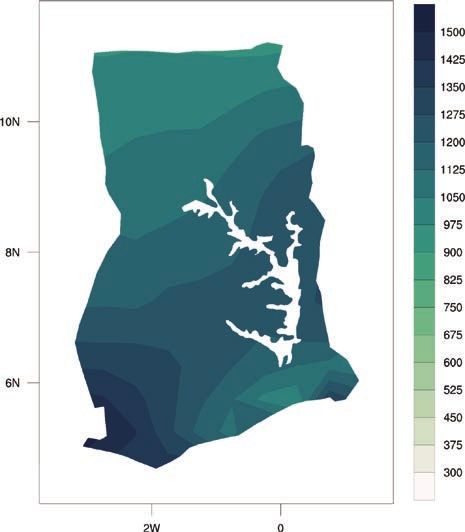
FOREWORD

Climate change is a major risk to good development outcomes, and the World Bank Group is committed to playing
an important role in helping countries integrate climate action into their core development agendas. The World
Bank Group is committed to supporting client countries to invest in and build a low-carbon, climate-resilient future,
helping them to be better prepared to adapt to current and future climate impacts.

The World Bank Group is investing in incorporating and systematically managing climate risks in development
operations through its individual corporate commitments.

A key aspect of the World Bank Group’s Action Plan on Adaptation and Resilience (2019) is to help countries
shift from addressing adaptation as an incremental cost and isolated investment to systematically incorporating
climate risks and opportunities at every phase of policy planning, investment design, implementation and evaluation
of development outcomes. For all IDA and IBRD operations, climate and disaster risk screening is one of the
mandatory corporate climate commitments. This is supported by the Bank Group’s Climate and Disaster Risk
Screening Tool which enables all Bank staff to assess short- and long-term climate and disaster risks in operations
and national or sectoral planning processes. This screening tool draws up-to-date and relevant information from
the World Bank’s Climate Change Knowledge Portal, a comprehensive online ‘one-stop shop’ for global, regional,
and country data related to climate change and development.

Recognizing the value of consistent, easy-to-use technical resources for client countries as well as to support
respective internal climate risk assessment and adaptation planning processes, the World Bank Group’s Climate
Change Group has developed this content. Standardizing and pooling expertise facilitates the World Bank Group in
conducting initial assessments of climate risks and opportunities across sectors within a country, within institutional
portfolios across regions, and acts as a global resource for development practitioners.

For developing countries, the climate risk profiles are intended to serve as public goods to facilitate upstream
country diagnostics, policy dialogue, and strategic planning by providing comprehensive overviews of trends
and projected changes in key climate parameters, sector-specific implications, relevant policies and programs,
adaptation priorities and opportunities for further actions.

It is my hope that these efforts will spur deepening of long-term risk management in developing countries and our
engagement in supporting climate change adaptation planning at operational levels.

Bernice Van Bronkhorst
Global Director
Climate Change Group (CCG)
The World Bank Group (WBG)

CLIMATE RISK COUNTRY PROFILE: GHANA                                                                                  1
COUNTRY OVERVIEW

G
        hana, located along the south-central coast of
        West Africa, shares borders with the Republic                 FIGURE 1.  Relief map of Ghana3
        of Togo to the east, Burkina Faso to the north
and Cote d’Ivoire to the west. Ghana has an area of
239,460 km2 and its territorial coastal waters extends
200 nautical miles off the coast. Ghana’s territory
has many water bodies, which include the Lakes
Volta and Bosomtwe, which occupy 3,275 km2, as
well as other seasonally flooded lakes that occupy
another 23,350 km2.1 The country has two broad
ecological zones: forest zone, which cover 30%
of the southern region and the Northern Savannah
Ecological Zone, which covers the remaining, drier,
70%. More than 70% of the country’s land area
is dedicated to agriculture.2 Figure 1 shows the
topography and elevation for Ghana.

Ghana is a lower middle-income, developing country
with a stable and democratic government. In 2019,
the country’s population was 30.4 million people with an annual population growth rate of 2.2%. Projections
suggest that the population will increase to 37.3 million people by 2030 and 51.2 million people by 2050. Over 55%
of Ghanaians reside in urban areas, which are expected to experience considerable growth, with 63% and 73% of
the population residing in urban areas by 2030 and 2050.4 The country has a Gross Domestic Product (GDP)
of US$66.9 billion (2019) and had an annual growth rate of 6.5%.5 The impacts of climate change on Ghana’s
overall economic growth are predominantly negative (Table 1). Since 2010, economic growth has been fueled
by high commodity prices and newly developed offshore oil resources. Despite a recent transition to an industry
and services-oriented economy, 45%of the workforce still relies on work dependent upon rainfed agriculture.
The fisheries sector contributes 4.5% to GDP and is another important source of income and nutrition, providing
livelihoods for as many as 2.2 million people. Ghana’s Northern Savannah Ecological Zone, where agricultural
production is centered and where poverty rates are most severe, will see increasing risks as the climate changes.6
The risks posed by climate change in Ghana include risks for the health and agriculture sectors, primarily due to
altered rainfall patterns and coastal area flooding.7

1
    UNDP (2019). Climate Change Adaptation Profile – Ghana. URL: https://www.adaptation-undp.org/explore/western-africa/ghana
2
    Republic of Ghana (2015). Ghana’s Third National Communication to the UNFCCC. URL: https://unfccc.int/resource/docs/natc/
    ghanc3.pdf
3
    World Bank (2019). Internal Climate Migration Profile – Ghana.
4
    World Bank Open Data, Data Retrieved March 2021. Data Bank: Population Estimates and Projections, Ghana. URL: https://databank.
    worldbank.org/data/reports.aspx?source=health-nutrition-and-population-statistics:-population-estimates-and-projections
5
    World Bank Open Data, Data Retrieved March 2021. Data Bank: World Development Indicators, Ghana. URL: https://databank.
    worldbank.org/data/reports.aspx?source=2&country
6
    USAID (2017). Climate Change Risk Profile – Ghana. URL: https://www.climatelinks.org/sites/default/files/asset/document/
    2017_USAID_Climate%20Change%20Risk%20Profile%20-%20Ghana.pdf
7
    UNDP (2019). Climate Change Adaptation Profile – Ghana. URL: https://www.adaptation-undp.org/explore/western-africa/ghana

CLIMATE RISK COUNTRY PROFILE: GHANA                                                                                              2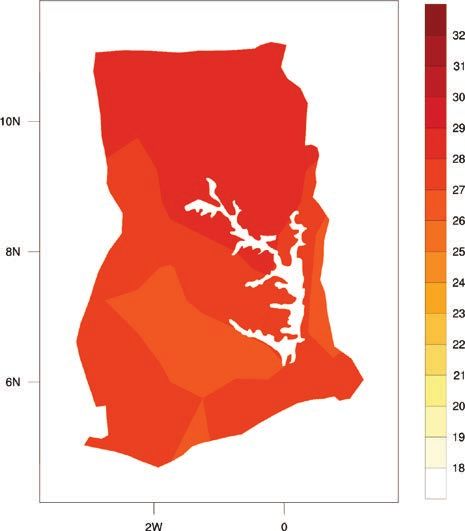
TABLE 1.  Data snapshot: Key development indicators8

    Indicator
    Life Expectancy at Birth, Total (Years) (2019)                                               64.1
    Population Density (People per sq. km Land Area) (2018)                                     130.8
    % of Population with Access to Electricity (2018)                                            82.4%
    GDP per Capita (Current US$) (2019)                                                       $2,202.10

The ND-GAIN Index9 ranks 181 countries using a
score which calculates a country’s vulnerability to                    FIGURE 2.  ND-GAIN Index for Ghana
climate change and other global challenges as well                             50

as their readiness to improve resilience. This Index
                                                                               48
aims to help businesses and the public sector better
identify vulnerability and readiness in order to better                        46

prioritize investment for more efficient responses to

                                                                       Score
                                                                               44
global challenges. Due to a combination of political,
                                                                               42
geographic, and social factors, Ghana is recognized
as vulnerable to climate change impacts, ranked 109                            40

out of 181 countries in the 2020 ND-GAIN Index.
                                                                               38
The more vulnerable a country is the lower their                                    1995 1997 1999 2001 2003 2005 2007 2009 2011 2013
                                                                                      Ghana
score, while the more ready a country is to improve its
resilience the higher it will be. Norway has the highest
score and is ranked 1st. Figure 2 is a time-series plot
of the ND-GAIN Index showing Ghana’s progress.

Ghana submitted its Nationally-Determined Contribution to the UNFCCC in 2016, in support of the country’s
efforts to realize its development goals and increase its resilience to climate change. Ghana also published its
Fourth National Communication to the UNCCC in 2020. Ghana is particularly focused on increasing its resilience
through the development of sustainable land use practices, including food security, climate-proof infrastructure,
energy security, sustainable forest management and urban waste management. Key sectoral focus is on energy,
industry, waste and forestry sectors to reduce the country’s carbon footprint.10

8
     World Bank (2021). DataBank – World Development Indicators. URL: https://databank.worldbank.org/source/world-development-
     indicators
9
     University of Notre Dame (2020). Notre Dame Global Adaptation Initiative. URL: https://gain.nd.edu/our-work/country-index/
10
     Republic of Ghana (2016). Nationally-Determined Contributions. URL: https://www4.unfccc.int/sites/ndcstaging/PublishedDocuments/
     Ghana%20First/GH_INDC_2392015.pdf

CLIMATE RISK COUNTRY PROFILE: GHANA                                                                                                     3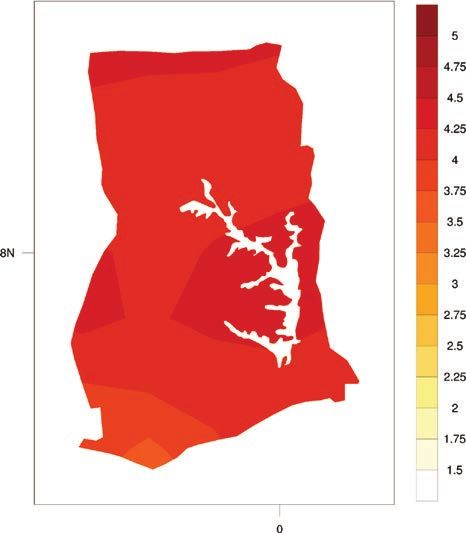
Green, Inclusive and Resilient Recovery
The coronavirus disease (COVID-19) pandemic has led to unprecedented adverse social and economic impacts.
Further, the pandemic has demonstrated the compounding impacts of adding yet another shock on top of the
multiple challenges that vulnerable populations already face in day-to-day life, with the potential to create devastating
health, social, economic and environmental crises that can leave a deep, long-lasting mark. However, as governments
take urgent action and lay the foundations for their financial, economic, and social recovery, they have a unique
opportunity to create economies that are more sustainable, inclusive and resilient. Short and long-term recovery
efforts should prioritize investments that boost jobs and economic activity; have positive impacts on human, social
and natural capital; protect biodiversity and ecosystems services; boost resilience; and advance the decarbonization
of economies.

CLIMATOLOGY

Climate Baseline
Overview
Ghana’s generally tropical climate is strongly influenced by the West African monsoon winds, which varies slightly
along with the country’s varied topography. Across Ghana, annual rainfall ranges from 1,100mm in the north to
approximately 2,100 mm in the southwest. The northern part of the country has one rainy season, which extends
from May to September; the south has two rainy seasons: the first from April to July and the second from September
to November. The dry season (December to March) brings the arid and dusty harmattan winds that blow from the
Sahara Desert, and is marked by low humidity, hot days (T >25°C) and cool nights (T
Ghana is highly vulnerable to climate variability and change, which continues to pose a threat to future growth and
development. Rising sea levels, drought, higher temperatures and erratic rainfall negatively impacts infrastructure,
hydropower production, food security and coastal and agricultural livelihoods. Approximately ¼ of the population
lives along the coast in rapidly expanding urban areas like Accra, and are especially vulnerable to flooding and
waterborne diseases. Drought and reduced rainfall threaten access to reliable power sources, already erratic and
insufficient. The climate and socio-economic environment in semi-arid, coastal and wetland areas across Ghana
make communities vulnerable to food insecurity and unstable livelihoods as well as leading to unsustainable
agroecological systems, crop failure and unproductive rangelands.12

Analysis of data from the World Bank Group’s Climate Change Knowledge Portal (CCKP) (Table 2) shows
historical information for 1901–2020. Mean annual mean temperature for Ghana is 27.3°C, with average monthly
temperatures ranging between 25°C–26°C (June to September) and 28°C–29°C (February to April). Mean annual
precipitation is 1,189.9 mm, with highest rainfall occurring May to September, with extremely low precipitation
falling between November to January, for the most recent climatology, 1991–2020 (Figure 3).13 Figure 4 shows
the spatial representation of the average annual precipitation and temperature across Ghana.

TABLE 2.  Data snapshot: Summary statistics

 Climate Variables                                                        1901–2020
 Mean Annual Temperature (°C)                                                27.3°C
 Mean Annual Precipitation (mm)                                           1,189.9 mm
 Mean Maximum Annual Temperature (°C)                                        32.5°C
 Mean Minimum Annual Temperature (°C)                                        22.1°C

12
     USAID (2017). Climate Change Risk Profile – Ghana. URL: https://www.climatelinks.org/sites/default/files/asset/document/
     2017_USAID_Climate%20Change%20Risk%20Profile%20-%20Ghana.pdf
13
     WBG Climate Change Knowledge Portal (CCKP, 2021). Ghana URL: https://climateknowledgeportal.worldbank.org/country/ghana/
     climate-data-historical

CLIMATE RISK COUNTRY PROFILE: GHANA                                                                                         5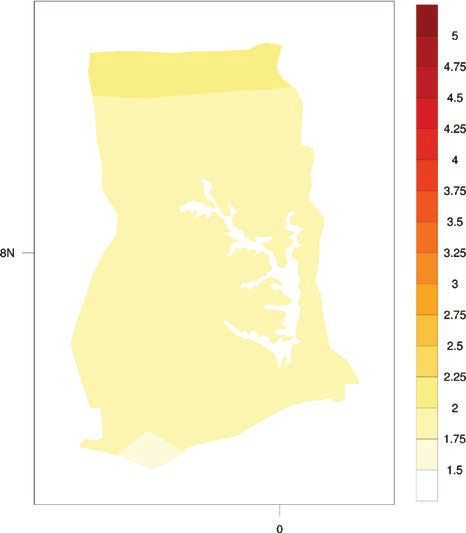
FIGURE 3.  Average monthly temperature and rainfall for Ghana, 1991–202014
                    36                                                                                     180
Temperature (°C)

                    32                                                                                     120

                                                                                                                 Rainfall (mm)
                    28                                                                                     60

                    24                                                                                     0
                         Jan    Feb    Mar    Apr    May    Jun    Jul   Aug      Sep   Oct   Nov    Dec

                                                     Rainfall       Temperature

 FIGURE 4.  Map of average annual temperature (°C) (left); annual precipitation (mm) (right) of
 Ghana, 1991–202015

 14
                   WBG Climate Change Knowledge Portal (CCKP, 2021). Ghana URL: https://climateknowledgeportal.worldbank.org/country/ghana/
                   climate-data-historical
 15
                   WBG Climate Change Knowledge Portal (CCKP, 2021). Ghana. URL: https://climateknowledgeportal.worldbank.org/country/ghana

 CLIMATE RISK COUNTRY PROFILE: GHANA                                                                                                      6
Key Trends
Temperature
Temperatures in Ghana have risen by approximately 1°C since the 1960s (an average increase of 0.21°C per decade)
(Figure 5). The number of very hot days (Tmax >35°C) have increased by over 13% per year, and hot nights
(Tmin >26°C) increasing by 20% per year; with the most pronounced increase occurring between September
and November.16 Overall, the rates of increase have been more rapid in the north of the country, and minimum
temperatures in the southern regions (rainforest and coastal, agro-ecological areas) have increased. However, the
rate of temperature rise for the middle and northern parts of Ghana (savannah zones) were +37%.17
FIGURE 5. Observed temperature for Ghana, 1901–202018
29
Temperature (°C)
28
27
26
1901 1911 1921 1931 1941 1951 1961 1971 1981 1991 2001 2011 2020
Annual Mean 5 Year Smoothing
16
USAID (2017). Climate Change Risk Profile – Ghana. URL: https://www.climatelinks.org/sites/default/files/asset/document/
2017_USAID_Climate%20Change%20Risk%20Profile%20-%20Ghana.pdf
17
Republic of Ghana (2015). Ghana’s Third National Communication to the UNFCCC. URL: https://unfccc.int/resource/docs/natc/
ghanc3.pdf
18
WB Climate Change Knowledge Portal (CCKP, 2021). Ghana URL: https://climateknowledgeportal.worldbank.org/country/ghana/
climate-data-historical
CLIMATE RISK COUNTRY PROFILE: GHANA 7Precipitation
Precipitation in Ghana, and the West Africa region, experience a high degree of interannual and interdecadal
variability. However, since the 1960s, an overall reduction in cumulative rainfall of 2.4% per decade was observed.19
Changes in decadal rainfall declined in the middle of the country, with more intense rainfall events occurring in
both the north and south of the country, indicating an increase in the intensity of rainfall events and possibility of
increased dry spell durations.20
Climate Future
Overview
The main data source for World Bank Group’s Climate Change Knowledge Portal (CCKP) is the CMIP5 (Coupled
Inter-comparison Project No.5) data ensemble, which is the resource database for the global climate change
projections presented in the Fifth Assessment Report (AR5) of the Intergovernmental Panel on Climate Change
(IPCC). Four Representative Concentration Pathways (i.e. RCP2.6, RCP4.5, RCP6.0, and RCP8.5) were modelled,
defined by their total radiative forcing (cumulative measure of GHG emissions from all sources) pathway and level
by 2100. The RCP2.6, for example, represents a very strong mitigation scenario, whereas the RCP8.5 assumes
business-as-usual scenario where emissions will follow historical trends. For more information, please refer to the
RCP Database. For simplification, these scenarios are referred to as a low (RCP2.6); a medium (RCP4.5) and a
high (RCP8.5) emission scenario in this profile. Table 3 provides CMIP5 projections for essential climate variables
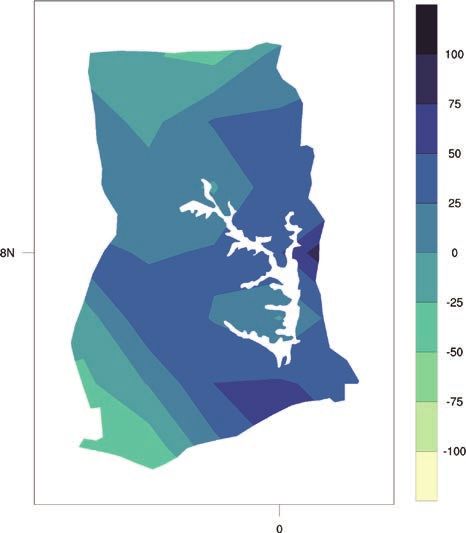
under high emission scenario (RCP8.5) over 4 different time horizons. Figure 6 presents the multi-model (CMIP5)
ensemble of 32 Global Circulation Models (GCMs) showing the projected changes in annual precipitation and
temperature for the periods 2040–2059 and 2080–2099.
TABLE 3. Data snapshot: CMIP5 ensemble projection
Cmip5 Ensemble Projection 2020–2039 2040–2059 2060–2079 2080–2099
Annual Temperature Anomaly (°C) +0.6 to +1.5 +1.2 to +2.7 +1.7 to +3.8 +2.3 to +5.3
(+0.9°C) (+1.7°C) (+2.7°C) (+3.6°C)
Annual Precipitation Anomaly (mm) -16.7 to +22.0 -22.2 to +30.4 -22.9 to +38.9 -29.7 to +45.2
(+0.9 mm) (+0.3 mm) (+2.9 mm) (+1.6 mm)
Note: The table shows CMIP5 ensemble projection under RCP8.5. Bold value is the range (10th–90th Percentile) and values in parentheses
show the median (or 50th Percentile).
19
USAID (2017). Climate Change Risk Profile – Ghana. URL: https://www.climatelinks.org/sites/default/files/asset/document/
2017_USAID_Climate%20Change%20Risk%20Profile%20-%20Ghana.pdf
20
Republic of Ghana (2015). Ghana’s Third National Communication to the UNFCCC. URL: https://unfccc.int/resource/docs/natc/
ghanc3.pdf
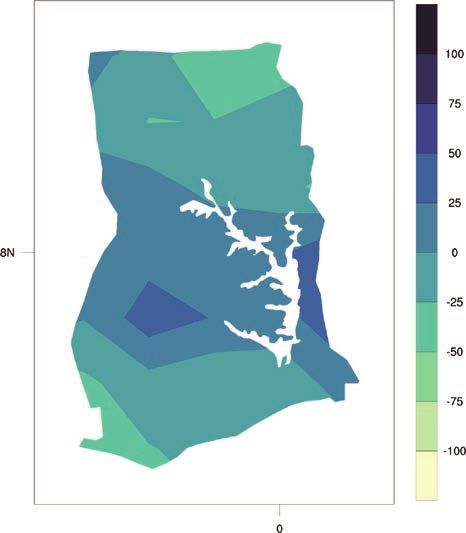
CLIMATE RISK COUNTRY PROFILE: GHANA 8FIGURE 6. CMIP5 ensemble projected change (32 GCMs) in annual temperature (top) and
precipitation (bottom) by 2040–2059 (left) and by 2080–2099 (right), relative to 1986–2005
baseline under RCP8.521
21
WBG Climate Change Knowledge Portal (CCKP, 2021). Ghana Projected Future Climate. URL: https://climateknowledgeportal.
worldbank.org/country/ghana/climate-data-projections
CLIMATE RISK COUNTRY PROFILE: GHANA 9Key Trends
Temperature
Ghana will continue to get warmer with mean temperatures projected to increase by 1.0°C to 3.0°C, by mid-century
and by 2.3°C to 5.3°C by end of the century. Projected warming will likely occur more rapidly in the norther and
inland areas that the coastal regions.22 In addition to rising temperatures, substantial increases are expected in the
frequency of days and nights that are considered ‘hot’, with an expected increase of 18–59% by mid-century. This
is coupled with a general decrease in the number of days considered ‘cold.23
Across all emission scenarios, temperatures will continue to rise within Ghana through the end of the century.
As seen in Figure 7, under a high-emission scenario, average temperatures will increase rapidly by mid-century. Across
the seasonal cycle (Figure 8), temperature rise will likely be most significantly in July and August, this will be
especially felt in the northern areas. Increased heat and extreme heat conditions will result in significant implications
for human and animal health, agriculture, water resources, and ecosystems.
FIGURE 7. Historical and projected average FIGURE 8. Projected change in Summer Days
temperature for Ghana from 1986 to 2099 (Tmax >25°C) (RCP8.5, Reference Period,
(Reference Period, 1986–2005)24 1986–2005)25
33 1.5
32
1.0
31
Temperature (°C)
30 0.5
Days
29
0
28
27 –0.5
26
1980 2000 2020 2040 2060 2080 2100 –1.0
Year Jan Feb Mar Apr May Jun Jul Aug Sep Oct Nov Dec
Historical RCP 2.6 RCP 4.5 RCP 6.0 RCP 8.5
22
IFPRI (2012). Ghana – Strategy Support Program, climate change, agriculture, and foodcrop production in Ghana. URL: http://
ebrary.ifpri.org/utils/getfile/collection/p15738coll2/id/127134/filename/127345.pdf
23
Republic of Ghana (2015). Ghana’s Third National Communication to the UNFCCC. URL: https://unfccc.int/resource/docs/natc/
ghanc3.pdf
24
WBG Climate Change Knowledge Portal (CCKP, 2021). Climate Indicator Dashboard – Agriculture. Ghana. URL https://climatedata.
worldbank.org/CRMePortal/web/agriculture/crops-and-land-management?country=GHA&period=2080-2099
25
WBG Climate Change Knowledge Portal (CCKP, 2021). Interactive Climate Indicator Dashboard – Agriculture. Ghana. URL https://
climatedata.worldbank.org/CRMePortal/web/agriculture/crops-and-land-management?country=GHA&period=2080-2099
CLIMATE RISK COUNTRY PROFILE: GHANA 10Precipitation
Rainfall in Ghana is highly variable and will continue
to be so throughout the century. However, heavy FIGURE 9. Annual average precipitation
rainfall events are expected to increase. Additionally, in Ghana for 1986 to 2099 (Reference Period,
changes in 1 to 5-day rainfall maxima trends will 1986–2005)29
2000
likely increase in some areas, but are expected to
1800
decrease in others.26 More erratic and intense rainfall
1600
during the wet season is expected, along with lower
Precipitation (mm)
1400
precipitation levels during the dry season; larger
1200
decreases in the southern regions. Intense rainfall
events are also likely to result in flooding and flash 1000
floods, as well as river bank erosion.27 Figure 9 below, 800
shows the change in the projected annual average 600
1980 2000 2020 2040 2060 2080 2100
precipitation for Ghana. 28
As seen below, at an Year
Historical RCP 2.6 RCP 4.5 RCP 6.0 RCP 8.5
aggregate national scale, overall, annual precipitation
in Ghana is expected to largely remain the same by
the of the century under a high emissions scenario of RCP8.5; however coastal zones are expected to receive
higher rainfall than central or northern areas.
CLIMATE RELATED NATURAL HAZARDS
Overview
Ghana is vulnerable to increasing aridity, droughts and extreme rainfall events and flooding,30 and faces significant
challenges from a changing climate change to its ecology, economy, and society. In addition, Ghana has a high
degree of risk to natural hazards and disasters. The country is exposed to risks from multiple weather-related
hazards, primary those due to floods and droughts in the Northern Savannah belt. There are also risks related to
coastal resources, including storm surges and coastal erosion as well as landslides, earthquakes, pest infestations,
and wildfires. Between 1991 and 2011 the country experienced seven major floods. In 2010, floods in the White
Volta River Basin affected hundreds of thousands of people and destroyed many of their livelihoods. Urban floods
also regularly impact major cities. Current development dynamics and demographic changes in Ghana further
compound the risk of disasters. These dynamics are related to rural poverty, rapid urbanization, and environmental
26
Republic of Ghana (2015). Ghana’s Third National Communication to the UNFCCC. URL: https://unfccc.int/resource/docs/natc/ghanc3.pdf
27
UNISDR (2018). Disaster Risk Profile – Ghana. URL: http://africa.cimafoundation.org/documents/869
28
WBG Climate Change Knowledge Portal (CCKP, 2021). Ghana Water Dashboard. Data Description. URL: https://climateknowledgeportal.
worldbank.org/country/ghana/climate-sector-water
29
WBG Climate Change Knowledge Portal (CCKP, 2021). Climate Data-Projections. Ghana. URL: https://climateknowledgeportal.
worldbank.org/country/ghana/climate-sector-water
30
Republic of Ghana (2015). Ghana’s Third National Communication to the UNFCCC. URL: https://unfccc.int/resource/docs/natc/ghanc3.pdf
CLIMATE RISK COUNTRY PROFILE: GHANA 11degradation. Agriculture and livestock, two sectors most impacted by weather-related hazards, constitute the
foundation of Ghana’s economy and employ 55% of the economically active population.31 Climate change and
variability are already affecting Ghana’s water resources damage and flood exposure is projected to result in
$160 million annually, due to flooding.32
Data from the Emergency Event Database: EM-Dat database, presented in Table 4, shows the country has endured
various natural hazards, including floods, landslides, epidemic diseases, and storms.
TABLE 4. Natural disasters in Ghana, 1900–202033
Natural Hazard Events Total Total Total Damage
1900–2020 Subtype Count Deaths Affected (’000 USD)
Drought Drought 3 0 12,512,000 100
Earthquake Ground Movement 1 17 0 0
Bacterial Disease 18 1,118 89,735 0
Epidemic
Viral Disease 3 150 1,031 0
Riverine Flood 16 409 3,859,990 33,500
Flood
Flash Flood 1 13 0 0
Wildfire Storm Land Fire (Brush, 1 4 1,500 0
Bush, Pasture)
Storm Convective Storm 1 20 12 0
Key Trends
Climate change is expected to increase the risk and intensity of water scarcity and drought across the country. The
primary sectors affected are water, agriculture and forestry, and human health. As extreme rainfall events become
more common, river bank over flow and flash flooding is likely. This may also result in soil erosion and water logging
of crops, thus decreasing yields with the potential to increase food insecurity; particularly for subsistence farmers.
The frequency and complexity of some of these disaster events are also increasing, especially flooding. The country
has been impacted by seven major floods in the last two decades. In 2007, floods caused damage to infrastructure
and livelihoods in excess of $130 million and affected more than 265,000 people in the three northern regions,
with nearly 100,000 requiring assistance in various forms to cope and restore their livelihoods. Additionally, these
floods were preceded by a period of drought that destroyed most food crops.34 Higher temperatures coupled with
increased aridity may also lead to livestock stress and reduced crop yields.35 This is likely to result in economic
31
GFDRR (2019). Ghana, Country Context. URL: https://www.gfdrr.org/en/ghana
32
UNISDR (2018). Disaster Risk Profile – Ghana. URL: http://africa.cimafoundation.org/documents/869
33
EM-DAT: The Emergency Events Database - Universite catholique de Louvain (UCL) - CRED, D. Guha–Sapir, Brussels, Belgium.
URL: http://emdat.be/emdat_db/
34
UNDP (2017). Advocacy and Capacity Building for Disaster Risk Reduction and Preparedness in Ghana Project. Final Project Report.
URL: https://www.undp.org/content/dam/ghana/docs/Doc/Susdev/Final%20Project%20Report.pdf
35
USAID (2017). Climate Change Risk Profile – Ghana. URL: https://www.climatelinks.org/sites/default/files/asset/document/
2017_USAID_Climate%20Change%20Risk%20Profile%20-%20Ghana.pdf
CLIMATE RISK COUNTRY PROFILE: GHANA 12losses, damage to agricultural lands as well as critical infrastructure and human casualties. Furthermore, land
degradation and soil erosion, exacerbated by recurrent flood and drought adversely impact agricultural production,
further affecting the livelihoods of the rural poor. Small rural farmers, are more sensitive to impacts of disasters
(floods, dry periods) because they have limited resources with which confront these risks.36
As temperatures rise and the impacts of climate change come into view, this will likely (i)exacerbate existing
tensions between agricultural and human population needs for water, especially during the dry seasons, (ii) alter
the quality of available water from surface water and groundwater, and (iii) increase pressure on urban zones.37
Changing rainfall patterns are expected to play a significant role in agricultural production and harvest seasons,
with later onsets expected to impact crop productivity as well as livestock health. Droughts have remained one
of the key drivers of food insecurity for the country, with increased aridity and drought resulting in crop damage,
loss of pasture and water sources, loss of animals, hunger, disease outbreaks, asset depletions, malnutrition and
migration.38 Increased temperatures and degraded agricultural conditions are expected to adversely affect ‘working
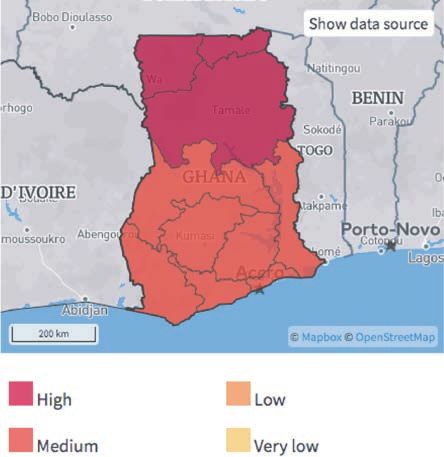
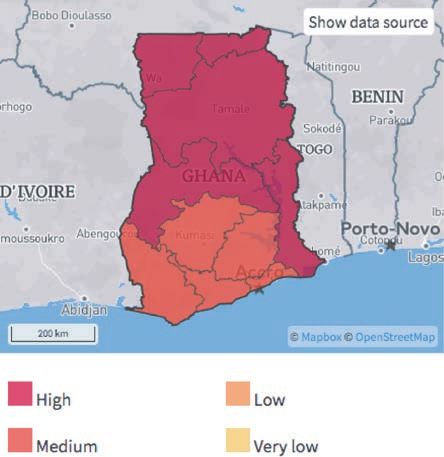
days’, impacting livelihoods and economic resilience of vulnerable groups. Figure 10 present the risk of extreme
heat and water scarcity for Ghana.
FIGURE 10. Risk of extreme heat (left)39; risks of water scarcity (right)40
36
Republic of Ghana (2015). Ghana’s Third National Communication to the UNFCCC. URL: https://unfccc.int/resource/docs/natc/
ghanc3.pdf
37
USAID (2018). Climate Risk Profile – West Africa. URL: https://www.climatelinks.org/sites/default/files/asset/document/
West_Africa_CRP_Final.pdf
38
IFPRI (2012). Ghana – Strategy Support Program, climate change, agriculture, and foodcrop production in Ghana. URL: http://
ebrary.ifpri.org/utils/getfile/collection/p15738coll2/id/127134/filename/127345.pdf
39
ThinkHazard! (2020). Ghana – Extreme Heat. URL: http://thinkhazard.org/en/report/94-ghana/EH
40
ThinkHazard! (2020). Ghana – Water Scarcity. URL: http://thinkhazard.org/en/report/94-ghana/DG
CLIMATE RISK COUNTRY PROFILE: GHANA 13Implications for DRM
Over the past decade, Ghana has taken significant steps toward a more proactive approach to reducing its disaster
risks and increase its resilience. The Ghana Plan of Action for Disaster Risk Reduction and Climate Change Adaptation
(2012) outlines support for disaster risk management (DRM) from the government and its development partners.41 The
country’s National Disaster Risk Reduction Policy (2011–2015) was adopted by disaster management stakeholders to
ensure that all public institutions and non-governmental organizations factor DRM into their organizational planning,
budgeting, and operations. In support of this implementation, the Ghanaian Government is integrating DRM planning
into its urban and land use planning. It is also in the process of establishing mechanisms and strategies to further
integrate DRM into national and local development policies. Key focus is to address flood risks in major urban areas
and to make more coastal communities more resilient to sea level rise, storm surges and flooding.42
CLIMATE CHANGE IMPACTS TO KEY SECTORS
G
hana is projected to become hotter and drier in the future, and the country will continue to experience
temperature increases, extreme events like droughts and floods and the increase in frequency and duration
of heat waves. Rainfall will remain variable, with increased rainfall in some areas and decreased rainfall
in others. The onset of the rainy season will occur later in the spring, and heavy rainfall events will increase in
frequency and intensity.43 This is likely to result in adverse environmental impacts such as soil erosion, deforestation,
recurrent droughts, desertification, land degradation, and the loss of biodiversity including wildlife. Key sectors such
as agriculture, forestry, health, water resources, and tourism are vulnerable.44 Water scarcity and drought conditions
are expected to increase risks of food insecurity and may exacerbate conflict situations over scarce resources and
population movements. Additionally, sea level rise may impact much of the country’s coastline.45
Ghana faces additional challenges due to the country’s high rate of urbanization and relatively large population
migrations from rural agricultural livelihoods to urban centers. These challenges are compounded by climate
stressors such as floods and droughts that are increasingly putting pressure on service delivery, adaptation needs
and financing.46 Environmental degradation, impacted water resources, and loss of biodiversity and ecosystem
services constitute serious obstacles to the country’s continued development and poverty reduction efforts, it
increases vulnerability to risks and hazards as well as increases the importance for sustainable adaptation and
resilience measures.47
41
UNDP (2019). Climate Change Adaptation Profile – Ghana. URL: https://www.adaptation-undp.org/explore/western-africa/ghana
42
GFDRR (2019). Ghana, Country Context. URL: https://www.gfdrr.org/en/ghana
43
USAID (2018). Climate Risk Profile – West Africa. URL: https://www.climatelinks.org/sites/default/files/asset/document/
West_Africa_CRP_Final.pdf
44
USAID (2017). Climate Change Risk Profile – Ghana. URL: https://www.climatelinks.org/sites/default/files/asset/document/
2017_USAID_Climate%20Change%20Risk%20Profile%20-%20Ghana.pdf
45
USAID (2017). Climate Change Risk Profile – Ghana. URL: https://www.climatelinks.org/sites/default/files/asset/document/
2017_USAID_Climate%20Change%20Risk%20Profile%20-%20Ghana.pdf
46
UNDP (2019). Climate Change Adaptation Profile – Ghana. URL: https://www.adaptation-undp.org/explore/western-africa/ghana
47
Republic of Ghana (2015). Ghana’s Third National Communication to the UNFCCC. URL: https://unfccc.int/resource/docs/natc/
ghanc3.pdf
CLIMATE RISK COUNTRY PROFILE: GHANA 14Gender
An increasing body of research has shown that climate-related disasters have impacted human populations in many
areas including agricultural production, food security, water management and public health. The level of impacts
and coping strategies of populations depends heavily on their socio-economic status, socio-cultural norms, access
to resources, poverty as well as gender. Research has also provided more evidence that the effects are not gender
neutral, as women and children are among the highest risk groups. Key factors that account for the differences
between women’s and men’s vulnerability to climate change risks include: gender-based differences in time use;
access to assets and credit, treatment by formal institutions, which can constrain women’s opportunities, limited
access to policy discussions and decision making, and a lack of sex-disaggregated data for policy change.48
Agriculture
Overview
Agriculture is a key sector for Ghana’s economy, household livelihoods and food security. The sector employs more
than half the population on a formal and informal basis, and accounts for almost 20% of GDP and almost half of
export earnings. The sector is the main source of livelihood for the majority of the country’s poorest households.
Two-thirds of non-oil manufacturing depends on agriculture for raw materials, and accounts for a major share of all
economic activities and livelihoods among smallholder farmers. Ghana produces variety of crops in various climatic
zones which range from dry savanna to wet forest and which run in east west bands across the country. Ghana’s
agriculture sector is made up of crops, livestock, fisheries and forestry. The crops sub-sector includes industrial
crops (e.g. cocoa, rubber, oil palm, coconut, cotton), starchy and cereal staples (e.g. cassava, yam, maize, rice,
plantain), and fruits and vegetables (e.g. pineapple, banana, cashew, citrus, mango).
The agriculture sector of Ghana is highly vulnerable to climate variability and change as the sector is primarily
dependent on rainfall. As a result, the sector is characterized by low productivity levels. Erratic precipitation patterns
have severe consequences for productivity as only 2% of the country’s irrigation potential is in use; the majority
of Ghana’s agriculture remains reliant on ran-fed production. Rising temperatures are projected to lower yields in
major staple crops (cassava, yams, plantains, maize and rice). Cassava yields, for example, are projected to fall by
29.6% by 2080 and maize yields by 7% by 2050. Cases of total crop failure are projected to occur approximately
once every five years in Ghana’s northern region due to delayed or diminished rainfall. Cocoa, a major cash crop
and the country’s second leading foreign exchange earner, is sensitive to rising temperatures as well as drought.
Suitable areas for cocoa production, mainly along the coast, are also decreasing due to temperature increase,
floods, soil salinization and continued coastal erosion.49
48
World Bank Group (2016). Gender Equality, Poverty Reduction, and Inclusive Growth. URL: http://documents1.worldbank.org/
curated/en/820851467992505410/pdf/102114-REVISED-PUBLIC-WBG-Gender-Strategy.pdf
49
USAID (2017). Climate Change Risk Profile – Ghana. URL: https://www.climatelinks.org/sites/default/files/asset/document/
2017_USAID_Climate%20Change%20Risk%20Profile%20-%20Ghana.pdf
CLIMATE RISK COUNTRY PROFILE: GHANA 15Climate Change Impacts
Yield losses may additionally become more severe as interannual rainfall variability increases and the length of
growing seasons shorten. Rising temperatures are likely to increase presence of pests and diseases leading
potentially to crop failure and reduced yields, especially for cassava, a key food staple. Reduced rainfall will shorten
growing seasons and the desertification of agricultural land brought about by unsustainable farming practices,
such as limited crop rotation and poor soil management, will further inhibit production.50 Ghana’s fisheries sector
is also a major part of local industries, the Ghanaian diet and economy. The fisheries sector includes marine
finishing and some inland and freshwater fisheries in Lake Volta, Botsumtwi and other reservoirs. Rising sea
surface temperatures will continue to alter the migratory patterns and reproductive cycles of key species such
as anchovies, sardines, tilapia and catfish, all staples in the Ghanaian diet and economy. A decline in the fisheries
sector productivity as a result of climate variability (along with overfishing) has forced Ghana to spend over
$200 million annually on seafood imports to satisfy local demand.51
Figure 11 shows the projected change in the number of consecutive Dry Days in Ghana through the end of
the century and the projected change in days with a heat index >35°C. A ‘Dry Day’ refers to a day without any
meaningful rainfall (less than 0.1mm/day), impacting soil moisture and thus crop growth. This is an important
indicator for agriculture and especially for Ghana as the majority of the country’s agriculture production is rain-
fed. The increased likelihood of droughts and prolonged dry periods are expected to further soil erosion and
exacerbate land degradation. Rising temperatures, particularly the increase in very hot days (TMax >35°C) is likely
to increase the presence of pests and increase risks of fires. As extreme rainfall events become more frequent
and more intense, critical ‘regulating services’ such as soil water maintenance, base flows and filtration will likely
suffer.52 Figure 12 shows the average daily max-temperature across seasonal cycles. These higher temperatures
have implications for impacts to soil moisture and crop growth and as seen below, temperature increases will be
experienced all year round.
50
IFPRI (2012). Ghana – Strategy Support Program, climate change, agriculture, and foodcrop production in Ghana. URL: http://
ebrary.ifpri.org/utils/getfile/collection/p15738coll2/id/127134/filename/127345.pdf
51
USAID (2017). Climate Change Risk Profile – Ghana. URL: https://www.climatelinks.org/sites/default/files/asset/document/
2017_USAID_Climate%20Change%20Risk%20Profile%20-%20Ghana.pdf
52
Republic of Ghana (2015). Ghana’s Third National Communication to the UNFCCC. URL: https://unfccc.int/resource/docs/natc/
ghanc3.pdf
CLIMATE RISK COUNTRY PROFILE: GHANA 16FIGURE 11. Projected change in the number FIGURE 12. Average daily max temperature
of consecutive dry days (Reference Period, for Ghana (RCP8.5, Reference Period,
1986–2005)53 1986–2005)54
140 8
120 7
6
100
Temperature (°C)
5
Days
80
4
60
3
40
2
20 1
Historical RCP 2.6 RCP 4.5 RCP 6.0 RCP 8.5 Jan Feb Mar Apr May Jun Jul Aug Sep Oct Nov Dec
Adaptation Options
Households in Ghana differ in terms of their adaptation responses to climate change and variability. These differences
may be attributed to the households’ livelihood group and asset holding level, and to some extent the ecological
zone in which the household is located. Adaptation strategies for the agriculture sector in Ghana include investing
in climate smart agriculture practices, improved water management, improved monitoring and early warning,
the development of knowledge and decision-support systems, and the development of new crop varieties and
technologies to support farming. Increased use of drought resistant varieties and improved integration of nutrient
management can help to improve yields for staple crops, such as maize, rice, cassava.55 The adaptation practices by
households in the northern savannah zone for instance include expansion of area cultivated, dry season gardening,
taking on more agricultural tasks by women, cultivation of early yielding and high value crops, diversification into
livestock rearing, increasing fertilizer use among others. Irrigation infrastructure and access to reliable water for
agriculture would make substantial difference for the country’s resilience as well as boost production opportunities
and thus livelihoods for smallholder farmers. To address increased demand and combat the reduction of Ghana’s
fisheries productivity, aquaculture development, more formal restocking of fingerlings, and improved extension
services can be implemented to build resilience in the sector.56 Ghana has developed the Climate Smart Agriculture
Investment Plan (CSAIP) which identifies interventions that will help the agriculture sector better able to deal with
climate change. The CSAIP produced evidence of climate-smart agriculture (CSA) technologies that can offer the
greatest potential to Ghana’s agriculture sector to increase productivity and enhance household incomes under
a changing climate. It also provides opportunity for building the agricultural system’s resilience, and in so doing
53
WBG Climate Change Knowledge Portal (CCKP, 2020). Ghana Agriculture. Dashboard URL: https://climatedata.worldbank.org/
CRMePortal/web/agriculture/crops-and-land-management?country=GHA&period=2080-2099
54
WBG Climate Change Knowledge Portal (CCKP, 2020). Ghana Agriculture. Dashboard URL: https://climatedata.worldbank.org/
CRMePortal/web/agriculture/crops-and-land-management?country=GHA&period=2080-2099
55
IFPRI (2012). Ghana – Strategy Support Program, climate change, agriculture, and food crop production in Ghana. URL: http://
ebrary.ifpri.org/utils/getfile/collection/p15738coll2/id/127134/filename/127345.pdf
56
Republic of Ghana (2015). Ghana’s Third National Communication to the UNFCCC. URL: https://unfccc.int/resource/docs/natc/
ghanc3.pdf
CLIMATE RISK COUNTRY PROFILE: GHANA 17ensures that future agriculture practices do not follow a path that could threaten environmental integrity through
green-house gas emissions, pollution of water systems or destruction of ecological systems. The CSAIPs is an
outcome of the stakeholder engagement process that identified and prioritized CSA technologies that have proved
to be most suitable and impactful in Ghana’s agriculture. These include:
1. Cereal-legume integration
2. Climate-smart cocoa production
3. Poultry feed improvement and genetic resource enhancement
4. Climate resilient ruminant production and genetic resource conservation
5. Sustainable fisheries and aquaculture
6. Diversified tree crop production
7. Roots-tubers-livestock integration
8. Knowledge system and advisory services
9. Water harvesting technologies and irrigation management
Water
Overview
The development and management of its water resources plays a key role for resilient and sustainable development
of Ghana. Freshwater covers nearly 5% of the total land areas in Ghana, these are primarily made of the Volta,
South Western and Coastal river systems. Neary half of the water used in Ghana originates from three international
rivers (Volta, Bia, Tano), which flow into the country from outside of Ghana’s borders, putting the country at risk of
water insecurity and political tensions should water availability decline. Currently, tensions already exist between
Ghana and Burkina Faso due to Burkina Faso’s decision to withdraw its water from the Volta Basin; reducing water
levels and impacting hydropower generation in Ghana.57
Climate Change Impacts
The Volta Basin flows could be reduced by as much as 24% by mid-century and by as much as 45% by end of the
century due to reduced rainfall and increased evaporation.58 Clean water and sanitation are a challenge for some
areas and communities in Ghana, where approximately 25% of the population lacks access to clean water. Declining
rainfall, increased levels of drought and rising temperatures in addition to increased pressures from a growing
population, urbanization, and industrialization are likely to further compound this issue. The reduced quantity and
quality of water will be a significant challenge for human consumption as well as use in the agriculture, industry and
hydropower sectors. Rising sea levels are already increasing salinization in coastal water sources and wells.59
57
Republic of Ghana (2015). Ghana’s Third National Communication to the UNFCCC. URL: https://unfccc.int/resource/docs/natc/
ghanc3.pdf
58
USAID (2017). Climate Change Risk Profile – Ghana. URL: https://www.climatelinks.org/sites/default/files/asset/document/
2017_USAID_Climate%20Change%20Risk%20Profile%20-%20Ghana.pdf
59
Republic of Ghana (2015). Ghana’s Third National Communication to the UNFCCC. URL: https://unfccc.int/resource/docs/natc/
ghanc3.pdf
CLIMATE RISK COUNTRY PROFILE: GHANA 18Poor areas in the country (especially the northern part) disproportionally suffer from droughts, floods and soil erosion
that are adversely affecting agricultural production; newer challenges in flood management due to urbanization; and
flooding exacerbated by poor land use and limited mitigation infrastructure.60,61 Rainfall and evaporation changes
also impact rates of surface water infiltration and recharge rates for groundwater, which, when coupled with low-
water storage capacity, increases the country’s vulnerability to unreliable rainfall patterns. This has the potential
for further decreased reliability of unimproved groundwater sources and surface water sources during droughts or
prolonged dry seasons. Additionally, increased strain on pump mechanisms may lead to breakdowns if maintenance
is neglected and the potential for falling water levels in the immediate vicinity of wells or boreholes and in areas of
high demand.62 Rising temperatures could further soil moisture deficits even under conditions of increasing rainfall.
The Standardized Precipitation Evapotranspiration Index (SPEI) represents the measure of the given water deficit
in a specific location, accounting for contributions of temperature-dependent evapotranspiration and providing insight
into increasing or decreasing pressure on water
resources. Negative values for SPEI represent dry
conditions, with negative values indicating increased FIGURE 13. Annual SPEI Drought Index
likelihood of increased aridity and drought conditions, in Ghana for the period, 1986 to 2099
likewise positive values indicate increased wet (Reference Period, 1986–2005)63
conditions. This is an important understanding for 1.0
the water sector in regards to quantity and quality of 0.5
supply for human consumption and agriculture use 0
as well as for the energy sector as reductions in water
–0.5
Index
availability impacts river flow and the hydropower
–1.0
generating capabilities. Ghana is projected to
–1.5
experience heightened dry conditions and increased
pressure on water resources by mid-century and by end –2.0
of the century is likely to be experience severe drought –2.5
Historical RCP 2.6 RCP 4.5 RCP 6.0 RCP 8.5
conditions and water scarcity (Figure 13).
Adaptation Options
The policy paper64 on Ghana’s Water Resources Development released in 2012 by the World Bank found that
available surface water resources were adequate to meet projected demand through to 2025 but significant
investments across the water-using sectors (e.g. irrigation, water supply, sanitation, and electricity) were required,
if Ghana’s mid-term and long term objectives in the water sector were to be met. The recent Ghana Systematic
Country Diagnostics report (2018)65 also re-emphasized the criticality of effective water resources management
60
Yeleliere, E. et al (2018). “Review of Ghana’s water resources: the quality and management with particular focus on freshwater
resources”. Applied Water Science. https://doi.org/10.1007/s13201-018-0736-4
61
Obuobie, E. et al (2012) “Assessment of vulnerability of river basins in Ghana to water stress conditions under climate change”.
Journal of Water and Climate Change, 03.4. DOI: https://doi.org/10.2166/wcc.2012.030
62
USAID (2018). Climate Risk Profile – West Africa. URL: https://www.climatelinks.org/sites/default/files/asset/document/
West_Africa_CRP_Final.pdf
63
WBG Climate Change Knowledge Portal (CCKP, 2021). Ghana Water Sector Dashboard. URL: https://climatedata.worldbank.org/
CRMePortal/web/water/land-use-/-watershed-management?country=GHA&period=2080-2099
64
World Bank (2012). Ghana: Water Resources Development – Policy Paper.
65
World Bank Group (2018). Ghana Priorities for Ending Poverty and Boosting Shared Prosperity : Systematic Country Diagnostic.
World Bank, Washington, DC. © World Bank. https://openknowledge.worldbank.org/handle/10986/30974 License: CC BY 3.0 IGO.
CLIMATE RISK COUNTRY PROFILE: GHANA 19for Ghana’s resilience and sustainability. One of the Government’s vision of the water sector as stipulated in the
Water Sector Strategic Development Plan (2012–2025) is to promote water security and resilience to climate
change. The National Irrigation Policy objectives also list, among others, increasing irrigated surfaces, improving
their management, and increasing climate change resilience as a result of sustainable irrigation service delivery.
Sustainable and reliable development, storage and proper use of the water resources in Ghana is a high priority and
should be led through a water resources management policy that promotes the efficient, equitable and optimum
utilization of available water resources. Water harvesting and improved rainwater collection and storage (at a household
or community level) is a critical intervention proposed by the Ghanaian Government.66 Flood retention development
is ongoing in areas of Upper East and Central regions. Additional dam construction and rehabilitation as well as
the de-silting of dams can make water access effective and efficient. Planning and adaptation strategies for water
resources should also be included within development strategies for agriculture, infrastructure, and energy sectors.67
Energy
Overview
Ghana’s energy is largely sourced from hydropower. The Akosombo, Kpong, and Bui dams provide approximately
54% of national generation capacity. The Volta River Authority is responsible for Ghana’s state-owned hydro-
thermal plants which also manages water levels in Lake Volta in response to increased evapotranspiration and
unpredictable rainfall. Despite Ghana’s hydropower capabilities, frequent power outages are common, with large
sections of rural communities having little access to electricity. Given expected reductions in national and regional
rainfall, hydropower capacities are expected to perform at 50% of current capacity by mid-century.68 As Ghana
continues to develop, greater demands are expected to be placed on its energy sector.
Climate Change Impacts
While rainfall is overall expected to decline in the future across Ghana, the high variability across the country pose a
significant challenge to hydro power generation. Additionally, a large proportion of the population relies on biomass
for cooking, which continues to cause large scale and widespread deforestation. Rising temperatures are also
likely to have an impact on cooling capacities of power generating stations, also likely to impact generation and
transmission. Rising temperatures resulting in seasonal changes are also likely to alter demand for electricity with
increased demand for peak loads during projected hotter summers leading to increased production costs, which are
likely to increase the costs for consumers. Climate projections are also expected to increase costs of maintenance
and repairing of power and energy infrastructure as well as disrupt power supply.69 Ghana has high potential for
renewable energy generation through solar power sources, but the sector needs to continue to develop.
66
IFPRI (2012). Ghana – Strategy Support Program, climate change, agriculture, and food crop production in Ghana. URL: http://
ebrary.ifpri.org/utils/getfile/collection/p15738coll2/id/127134/filename/127345.pdf
67
Republic of Ghana (2015). Ghana’s Third National Communication to the UNFCCC. URL: https://unfccc.int/resource/docs/natc/
ghanc3.pdf
68
USAID (2017). Climate Change Risk Profile – Ghana. URL: https://www.climatelinks.org/sites/default/files/asset/document/
2017_USAID_Climate%20Change%20Risk%20Profile%20-%20Ghana.pdf
69
USAID (2018). Climate Risk Profile – West Africa. URL: https://www.climatelinks.org/sites/default/files/asset/document/
West_Africa_CRP_Final.pdf
CLIMATE RISK COUNTRY PROFILE: GHANA 20You can also read