Tax Incentives for Research and Development and Their Use in Tax Planning - Dis cus si on Paper No. 17-046 Olena Pfeiffer and Christoph Spengel
←
→
Page content transcription
If your browser does not render page correctly, please read the page content below
Discussion Paper No. 17-046 Tax Incentives for Research and Development and Their Use in Tax Planning Olena Pfeiffer and Christoph Spengel
Discussion Paper No. 17-046 Tax Incentives for Research and Development and Their Use in Tax Planning Olena Pfeiffer and Christoph Spengel Download this ZEW Discussion Paper from our ftp server: http://ftp.zew.de/pub/zew-docs/dp/dp17046.pdf Die Discussion Papers dienen einer möglichst schnellen Verbreitung von neueren Forschungsarbeiten des ZEW. Die Beiträge liegen in alleiniger Verantwortung der Autoren und stellen nicht notwendigerweise die Meinung des ZEW dar. Discussion Papers are intended to make results of ZEW research promptly available to other economists in order to encourage discussion and suggestions for revisions. The authors are solely responsible for the contents which do not necessarily represent the opinion of the ZEW.
Tax Incentives for Research and Development

 and Their Use in Tax Planning

 Olena Pfeiffer*
 (ZEW Mannheim)
 and

 Christoph Spengel
 (University of Mannheim)

This study provides a comprehensive analysis of various aspects of R&D tax incentives. It
explains the economic justification behind the state support of research and development and
summarizes its main types. In addition, it gives an overview of the existing R&D tax incentives
in Europe and provides a thorough review of the empirical literature on the outcomes of fiscal
incentives. Furthermore, the Devereux and Griffith model is used to determine the effective tax
burden of multinational firms that reside in countries which implement R&D tax support and
countries which do not. The model is developed further following Spengel and Elschner (2010)
and Evers et al. (2015) to reflect a potential use of R&D tax incentives by multinational firms
for tax planning. The hypothesis developed in the model is tested in an empirical estimation,
where we employ the OECD data on international co-operation in patents. According to our
main findings, there are at least two reasons why input-oriented R&D tax incentives, such as
tax credits and tax super-deductions, constitute a more suitable instrument for fostering research
and development than the output-oriented incentives, such as IP Boxes. First, there is robust
evidence found in the empirical literature which shows the positive effect introducing input-
oriented tax incentives has on a firm’s innovative activity, whereas studies on output-oriented
tax incentives are not able to support this argument. Secondly, according to our theoretical and
empirical analyses, output-oriented R&D tax incentives may be used by multinationals for tax
planning as opposed to their intended use of fostering research and development.

Keywords: research and development; R&D; tax planning; corporate taxation
JEL-Classification: H25, F23, H26, H3

*
 .Corresponding author: Centre for European Economic Research (ZEW Mannheim); e-mail:
olena.pfeiffer@zew.de; phone: +49 (0) 621-1235-141; P.O. Box: ZEW Mannheim, L7, 1, 68161 Mannheim,
Germany.
This paper contributes to MaTax – The Mannheim ScienceCampus for Taxation
1 Introduction

State support of research and development (R&D) is not only economically justified in
numerous theoretical and empirical studies but is also enforced in many countries around the
world. Fiscal incentives constitute one of the key instruments of state support of R&D, as they
are easier to implement and are less complex to monitor than, for example, direct R&D grants
or subsidies. There are various types of fiscal incentives for research and development, some
of which focus on supporting the development or input phase of a research process, whereas
others concentrate on the income-generating output phase. The first group of R&D tax
incentives includes tax credits and tax super-deductions, which are more widely distributed on
an international level than the second category. However, in recent years output-oriented fiscal
incentives, which include intellectual property (IP) Boxes, seem to have been gaining
popularity, especially in Europe. Fourteen European countries currently have IP Box regimes
and several others are considering their introduction.

Even though R&D tax incentives have already been analyzed in the previous literature, the main
aim of this study is to carry out a comprehensive analysis of various aspects of R&D tax
incentives, including not only well-researched issues but also topics which have been studied
to a lesser extent. The focus of this study is on the potential use of R&D tax incentives for tax
planning by multinational enterprises (MNEs). We distinguish between input- und output-
oriented fostering of R&D and concentrate on those incentives that apply to large companies,
as opposed to the incentives which are available to small and medium enterprises. The study
also focuses on those incentives that are available in member states of the European Union (EU)
and the European Free Trade Area (EFTA) which includes Iceland, Liechtenstein, Norway, and
Switzerland.

The methodology of our analysis is diverse. First, we carry out a thorough review of the existing
R&D tax incentives and find that Germany, Estonia, and Sweden are currently the only
countries in Europe that do not offer any R&D tax incentives. Secondly, we examine the
empirical literature on the outcomes of an implementation of R&D tax incentives. According
to the literature review, numerous studies find that input-oriented tax incentives boost firms’
innovation and performance. However, there is no such strong evidence on the role of output-
oriented fiscal incentives in supporting real R&D activity. Thirdly, we use the Devereux and
Griffith (1999, 2003) approach to compute the effective average tax burden in the EU and EFTA
member states in 2012. Furthermore, we follow the conceptual framework of Spengel and

 1
Elschner (2010) and Evers et al. (2015) to incorporate various types of R&D tax incentives in
the Devereux and Griffith model. In addition to a domestic investment scenario, a cross-border
investment is introduced into the model in order to show that R&D tax incentives may be used
by multinationals for tax planning. Finally, we test this hypothesis in an empirical analysis by
employing data on international collaboration in patents provided by the Organization for
Economic Co-Operation and Development (OECD). This data contains information on patents
that have been developed in one country and relocated to another one afterwards. According to
our main findings, a negative correlation exists between taxation and the probability of
countries entering into a co-operation in patent development. In addition, the probability and
the intensity of collaboration in patents increases with a growing generosity of R&D tax
incentives, which further supports our hypothesis. Hence, we conclude that input-oriented R&D
tax incentives, such as tax credits and tax super-deductions, constitute a more suitable
instrument for fostering research and development than output-oriented fiscal incentives, such
as IP Boxes.

The study is organized as follows: section 2 presents the economic justification behind the state
support of R&D and introduces the main types of R&D tax incentives. In addition, an overview
of the existing incentives in the EU and EFTA member states in 2012 is given. Section 3
includes a review of empirical literature on the outcomes of an implementation of R&D tax
incentives. Section 4 explains the standard case of the Devereux and Griffith model and presents
its extension to include input- and output-oriented R&D tax incentives. Moreover, this section
further develops the model to demonstrate the role of fiscal incentives in tax planning strategies
of multinational firms. Section 5 presents our empirical analysis and discusses the key results,
with the final section summarizing the main findings of our study and drawing several
conclusions.

2 State Support of Research and Development

2.1 Economic Justification

According to the OECD (2002), research and development can be defined as “creative work
undertaken on a systematic basis in order to increase the stock of knowledge […] and the use
of this stock of knowledge to devise new applications.”1 There is an established view among
policy makers and in academia that R&D leads to technological development, which in turn

1
 See OECD (2002), p. 30.

 2
stimulates economic growth. Solow (1956) was among the first economists to develop a
theoretical model that illustrates this idea. According to the author, technological progress
increases a country’s productivity and proves to be more effective in fostering economic growth
than other factors of production, such as labor and capital. Since technological progress plays
an important role in the economic development of a country, it is natural that governments have
an interest in supporting research and development, as Arginelli (2015) notes.

The two major economic justifications for the state support of research and development are
positive spillovers from R&D and an existence of asymmetric information. According to
Mankiw and Taylor (2014), positive spillovers from R&D occur because companies may use
outcomes of research and development without there being rivalry or exclusion. As an example,
different firms may apply research findings in product development at the same time while
avoiding the possibility of limiting each other’s research. This results in a lack of rivalry
occurring between the firms. All companies can typically take advantage of the knowledge
acquired through R&D, which implies that there is no exclusion. Spengel and Wiegard (2011)
argue that positive spillovers from R&D may occur even in the case of a patent protecting the
research outcomes, because firms could imitate new products or production processes of their
competitors even if they are patented.

Furthermore, companies may also benefit from hiring experienced employees who have
previously worked for their competitors and have gained the required knowledge needed to
imitate these products. In addition, even if the outcomes of research and development are not
successful and no new inventions result from a research project, there is still a positive spillover
effect for the industry. Namely, other firms can learn from unsuccessful attempts made by their
competitors and either avoid repeating the same mistake in the future or plan their research
differently from the very beginning. Hence, the social benefits from research and development
might exceed the private returns. Hansson and Brokelind (2014) investigate the consequences
of introducing R&D incentives in the European Union, placing an emphasis on Sweden. The
authors argue that the EU should subsidize only R&D projects which have a potential to yield
higher social benefits than private returns. According to Hansson and Brokelind (2014), firms
are likely to undertake projects with high private return regardless of any support measures
which are available.

 3
The second justification for the state support of research and development is the existence of
asymmetric information. According to Spengel and Wiegard (2011), the problem of asymmetric
information is typical for credit markets where some economic agents have better access to
information than the others. This is particularly true in the case of financing R&D, because
investments in this area are often deemed to be high-risk and creditors do not have the sufficient
information to decide whether or not they should finance them. This results in adverse selection,
whereby it is only low-risk R&D projects that receive financing with the other projects being
overlooked, even if their potential returns are high. In addition, Arginelli (2015) argues that the
issue of asymmetric information in capital markets may be selective and only give a
disadvantage to certain types of firms. For example, small companies might have to pay higher
interest rates and may have narrower access to the capital market compared to large firms. State
support of research and development cannot prevent the problem of asymmetric information,
but it can reduce the need for external means in R&D financing.

2.2 Types of R&D Support

State support of research and development can take various forms and target different phases
of an R&D process. For example, governments may support R&D either directly or indirectly
and in the case of direct measures, these may be taken in the form of subsidies, allowances, and
grants. Even though this type of R&D support has a direct influence on the liquidity of an
investing firm, its application process is often bureaucratic, complex, and lengthy. In addition,
Cunningham et al. (2013) note that the provision of direct R&D funding might be quite
subjective and based on certain characteristics of a firm, such as its age or experience in a certain
field of research. Indirect measures include fiscal incentives for research and development and
it is this type of state support of R&D which this study will focus upon.

Furthermore, R&D support can be classified according to the phase of the research process to
which it applies. According to Arginelli (2015), a research project typically has two major
stages. During a so-called input phase, a firm plans and conducts the research and it is during
this stage where the majority of costs related to an R&D process arise. After an intangible asset
has been created, the output phase begins which includes managing the profits that an intangible
generates or dealing with the losses that have occurred in the case of an unsuccessful
investment. This study analyzes both input- and output-oriented R&D tax incentives.

 4
2.2.1 Input-Oriented R&D Tax Incentives

R&D tax incentives that apply to the first phase of the research process aim to alleviate the
financial burden of a company as R&D expenses occur but income is yet to be generated or is
completely uncertain. There are different approaches to support companies in this phase of
investment. Some of the support measures aim to reduce a firm’s tax liability, while others
target its tax base. The first category includes an R&D tax credit, which can be defined as a
direct offset against the amount of a company’s tax liability.2 The second group comprises a
tax super-deduction and an accelerated depreciation of assets used in research and development.
The OECD (2014) defines a tax super-deduction as a tax measure that reduces a firm’s tax base
by allowing for an inflation of the R&D expenditure base.3 An accelerated depreciation scheme
is defined as a tax incentive that permits fixed assets used in R&D to be depreciated at higher
rates than usual in the first years of their useful life.4 As the OECD (2014) notes, this type of
R&D support decreases the overall taxable income of a company and provides it with some
additional liquidity in certain periods of an R&D process. However, the payment of taxes in
this case is not completely repealed but rather postponed. According to Spengel and Wiegard
(2011), the attractiveness of R&D tax incentives that target a company’s tax base rises as a
country’s statutory corporate income tax (CIT) rate increases. This is due to a larger effect of
the fiscal incentives on the tax base when a tax rate is higher.

These R&D tax incentives can be further divided according to their attributes. Arginelli (2015)
gives a detailed overview of input-oriented R&D tax incentives with respect to their targeting
dimensions, such as the type of income which they support as well as intangible assets, business
sectors, and firm sizes they apply to. For example, some countries offer incremental tax credits
and tax deductions, which depend on the volumes of R&D expenses in previous periods and
therefore should intensify an increase in a firm’s spending on research and development.
Moreover, R&D tax incentives may differ according to the type of expenses they support. For
example, some of them target current expenses such as labor costs or maintenance expenditure,
while others support capital expenses such as costs associated with the construction of a
laboratory or a building. As a concluding point, it should be taken into account that the
incentives may vary based on their treatment of losses that result from an R&D process. Some

2
 See OECD (2016a).
3
 See OECD (2014), p. 51-52.
4
 See OECD (2014), p. 52.

 5
countries allow unused tax incentives to be carried forward, while other countries offer a refund
in the case of losses, which is equal to a cash grant.

2.2.2 Output-Oriented R&D Tax Incentives

In addition to the input-oriented R&D incentives, there are also tax incentives that target the
second stage of research and development. In particular, they aim to provide a favorable tax
treatment for the income generated from intangible assets. IP Boxes serve as a prominent
example of this type of R&D incentives. Atkinson and Andes (2011) define an IP Box as a tax
incentive that allows corporate income from the sale or licensing of intangible assets to be taxed
at a lower rate than other types of income.5

In their overview of the existing IP Boxes, Evers et al. (2015) demonstrate a great variety of
these regimes. For instance, IP Boxes differ according to the type of income, intangible assets,
and R&D expenses that they cover. Some regimes allow a deduction of current R&D
expenditure from the tax base of a reduced tax rate, which is known as a net approach. By
contrast, other IP Boxes permit the deduction from the tax base of a standard statutory tax rate,
defined as a gross approach. The latter method is to the benefit of the investing companies,
since here the profits generated by an intangible are taxed at the reduced tax rate, although the
expenses associated with its development are deducted at the higher statutory tax rate. In
addition, IP Boxes may differ in their treatment of the R&D expenditure that occurred in the
past. For example, the past expenses on research and development may be ignored (a no
recapture approach) or it may be necessary to reconsider them (a recapture approach). In the
case of a recapture approach, it may either be required to deduct the past expenses at the reduced
IP Box tax rate (a threshold method) or to capitalize them (a capitalization method).6

Furthermore, some IP Boxes only apply to intangible assets that have been developed within a
country’s borders, whereas others support IP acquired from abroad as well. In the case of the
latter, an IP Box does not have to foster domestic research and development but might rather
be used by multinational enterprises for tax planning. The OECD has attempted to fix this
problem by imposing the Nexus Approach in 2015.7 According to this regulation, all current
and new IP Boxes should facilitate the taxation of profits from the transfer or use of intangible

5
 Atkinson and Andes (2011), p. 3.
6
 See Evers et al. (2015) for more information.
7
 See OECD (2015).

 6
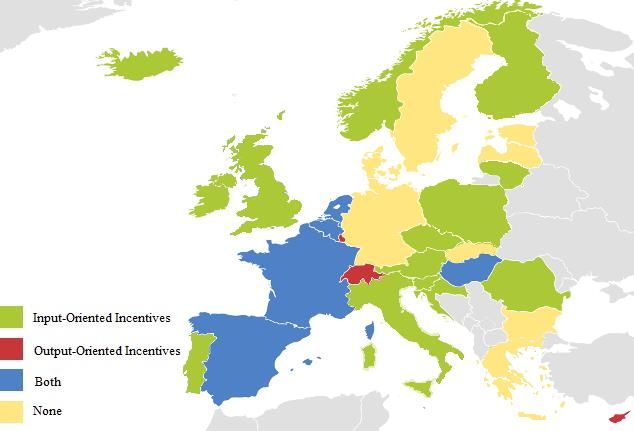
assets in the place of their creation. However, the enforcement of this requirement still depends
on the willingness of individual countries to co-operate.

Spengel (2016) identifies that another issue related to the lawfulness of IP Boxes is their
potentially selective treatment of certain companies or industries. The author argues that IP
Boxes give an advantage to multinational enterprises compared to the purely domestic firms. A
multinational might develop an intangible in a high-tax country and afterwards strategically
relocate it to a subsidiary in a country with an IP Box, whereas a domestic firm does not have
this opportunity. Moreover, IP Boxes distort competition by giving an unfair advantage to
companies that operate within certain industries. As an example, firms within some industries
may develop an intangible asset and then license it to other related and non-related companies,
whereby the resulting license fees will typically be eligible for beneficial tax treatment under
an IP Box regime. By contrast, companies within other industries may use their intangible assets
only themselves and are not able to license them to other parties. As a result, forms in the second
category are not able to benefit from using an IP Box in comparison to their counterparts in the
first category. Therefore, Spengel (2016) concludes that the selective treatment of IP Boxes
does not comply with the state aid principles of the European Union.

2.3 An Overview of R&D Tax Incentives in Europe

This section gives an overview of the current input- and output-oriented R&D tax incentives in
the 28 member states of the European Union and four countries that are non-EU members but
belong to the European Free Trade Area (Iceland, Liechtenstein, Norway, and Switzerland). 8
Figure 1 presents the distribution of the R&D tax incentives across these countries in 2012 and
what is evident from this figure is that the majority of European countries offer either input- or
output-oriented fiscal incentives. It is worth noting that some countries have even implemented
both types of R&D tax incentives. For example, France offers both a generous tax credit on
R&D expenditure and an IP Box. By contrast, Estonia, Germany, Greece, Latvia, Slovakia, and
Sweden were the only countries in Europe that did not offer any kinds of R&D tax incentives
in 2012. However, Greece, Latvia, and Slovakia have introduced super-deductions for R&D
expenses in the years that followed, which resulted in Estonia, Germany, and Sweden currently
remaining the only countries in Europe without fiscal incentives for research and development.

8
 In what follows, we refer to the EU and EFTA members as Europe.

 7
2.3.1 Input-Oriented R&D Tax Incentives

Table 1 gives an overview of the existing input-oriented R&D tax incentives in Europe. It
focuses on the incentives that are available for large corporations; however, many countries
have special R&D tax incentives for small and medium enterprises as well. In addition, it is
worth noting that Table 1 summarizes fiscal incentives available for internal R&D spending,
since in our further analysis we assume that a company conducts research itself and does not
outsource it to other parties (which would result in external R&D spending).

According to Table 1, only a few European countries such as Cyprus, Estonia, Germany,
Greece, Liechtenstein, Slovakia, and Sweden do not offer any input-oriented incentives for
R&D. In addition to input-oriented incentives, most countries do not require an immediate
capitalization of self-developed intangible assets for tax purposes. However, a few countries
such as Cyprus, Norway, and Slovakia enforce this requirement and thereby create a liquidity
disadvantage for firms that carry out research and development.

Figure 1. Existing Input- and Output-Oriented R&D Tax Incentives in Europe, 2012

 8
Table 1. An Overview of Input-Oriented R&D Tax Incentives in Europe, 2012

 Super-
 Tax Qualifying Expenses Accelerated Losses
 Deduction,
 Credit, % Depreciation Carry
 % Current Capital Refund
 Forward
Austria 101 - x x - - x
 2 2
Belgium 13.5 13.5 x - - - -
 16
Bulgaria - - - - x - -
Croatia - 10013 x x - - -
Cyprus - - - - - - -
Czech
 - 10014 x x - x -
Republic
Denmark -3 - - - x - x
Estonia - - - - - - -
Finland - - - - x - -
 4 17
France 30 - x x x x x22
Germany - - - - - - -
Greece - - - - - - -
 5
Hungary - 100 x x - - -
 6
Iceland 20 - x x - - -
Ireland 25 - x x x16 x -
 7 16
Italy - - - - x x -
Latvia - - - - - - -
Liechtenstein - - - - - - -
Lithuania - 200 x x x x -
 18
Luxembourg - - - - x - -
 8 8
Malta 15 50 x x - x -
Netherlands - 40 x x - x -
Norway 189 - x x - - x
 15 19
Poland - - - - x - -
 10
Portugal 32.5 - x x - x -
 20
Romania - 20 x x x x -
Slovakia - - - - - - -
Slovenia - 40 x x - x -
 11 16
Spain 25 - x x x x -
Sweden - - - - - - -
Switzerland - - - - x21 - -
 12 16
UK - 30 x x x x x

 9
Notes: 1Approval of the Austrian Research Promotion Agency is required. 2These R&D incentives are available
only for green investments and are mutually exclusive. 3Tax credit is capped and is available only for firms
encountering R&D-related losses. 430% up to 100 million EUR, 5% above. The rate is increased to 40% in the
first year and to 35% in the second year for companies that benefit from the tax credit for the first time or did not
benefit from it during the five years before they request the credit. 5A tax credit of up to 80% for investments in
underdeveloped regions and free entrepreneurial zones is available. 6An approval of the Icelandic Centre for
Research is required; minimum 1 million ISK, maximum 100 million ISK per project and firm. 7There is no
general tax credit, although there is a 10%-credit on R&D expenses that do not exceed 50 million EUR. 8Not
allowed if an IP box applies. 9The credit is generally given to small and medium companies but may also apply
to other firms upon an approval of the Research Council of Norway. 10An additional incremental credit of 50%
applies if expenses exceed the average R&D expenditure of the previous two fiscal years. 11If expenses exceed
an average amount of the previous two years, a rate of 25% applies to the average amount and a rate of 42%
applies to the exceeding amount. 12A taxable 11%-tax credit is available in certain cases but not for the expenses
on patents. 13This amount ranges between 100% and 150% depending on a type of research. 14The rate increases
to 110% for incremental R&D expenses. 15Application is possible if certain conditions are fulfilled. 16An
immediate write-off. 17Degressive instead of straight-line depreciation is possible if a resulting asset stays in the
enterprise for at least 3 years. 18Accelerated depreciation for machinery and equipment; buildings are excluded.
19
 Accelerated depreciation is not limited to assets used in research and development. 20A write-off of 50% in the
first year is available for machinery and equipment if the resulting IP stays in Romania. 21Varies on the cantonal
level, with most cantons offering an immediate or accelerated depreciation for machinery, buildings, and
intangible assets. These tax incentives are not limited to the assets used in R&D. 22A unutilized tax credit may be
carried forward for three years, afterwards a refund is available.

Table 1 shows that most European countries offer either a tax credit or a tax super-deduction
for R&D expenditure. In line with Spengel and Elschner (2010), we distinguish between current
and capital expenditure on research and development and observe that the majority of countries
in Table 1 offer tax incentives for both current and capital expenses. Furthermore, almost half
of the countries under analysis allow for an accelerated depreciation of machinery, buildings,
intangibles, and other types of assets used in research and development. As discussed in section
2.2.1, accelerated depreciation gives firms a liquidity advantage in the first years of research
and development. In the case of losses, most countries permit their tax incentives to be carried
forward and only a few of them offer a refund. A few countries offer both options for the
treatment of losses.

2.3.2 Output-Oriented R&D Tax Incentives

Table 2 provides an overview of the output-oriented R&D tax incentives represented by IP
Boxes. Similarly to the input-oriented instruments, the scope of Table 2 includes countries of
the European Union and the European Free Trade Area in 2012. The output-oriented R&D
incentives have become rather popular in recent years, as shown by the fact that ten European
countries offered them in the year 2012. Four more countries have introduced IP Boxes in the
years following on from 2012 (Ireland in 2016, Italy in 2015, Portugal in 2014, and the United
Kingdom in 2013) and several others are considering the possibility of doing so.

 10
Table 2. An Overview of Output-Oriented R&D Tax Incentives in Europe, 2012
 Date of IP Box Statutory Type of Eligible IP Treatment of Expenses
 Implem Tax Tax
 entation Rate, % Rate, % Acquired Existing Current Occurred in the Past
 Austria - - 25 - - - -
 Belgium 2007 6.8 33.9 N N Gross No recapture
 Bulgaria - - 10 - - - -
 Croatia - - 20 - - - -
 Recapture
 Cyprus 2012 2.5 10 Y Y Net
 (Capitalization)
 Czech
 - - 19 - - - -
 Republic
 Denmark - - 25 - - - -
 Estonia - - 21 - - - -
 Finland - - 24.5 - - - -
 France 2000 15.5 34.4 Y3 Y Net No recapture
 Germany - - 29.8 - - - -
 Greece - - 20 - - - -
 Hungary 2003 9.5 19 Y Y Gross No recapture
 Iceland - - 20 - - - -
 1
 Ireland - - 12.5 - - - -
 1
 Italy - - 31.4 - - - -
 Latvia - - 15 - - - -
 Liechtenstein 2011 2.5 12.5 Y N Net Recapture (Threshold)
 Lithuania - - 15 - - - -
 Recapture
 Luxembourg 2008 5.9 28.8 Y3 Y Net
 (Capitalization)
 Not Not if costs were
 Malta 2010 0 35 Y N
 deductible deducted
 Netherlands 2007 5 25 N N Net Recapture (Threshold)
 Norway - - 28 - - - -
 Poland - - 19 - - - -
 Portugal1 - - 25 - - - -
 Romania - - 16 - - - -
 Slovakia - - 19 - - - -
 Slovenia - - 18 - - - -
 Spain 2008 11.2 30 N Y Net No recapture
 Sweden - - 26.3 - - - -
 2
 Switzerland 2011 8.8 18 Y Y Net No recapture
 1
 UK - - 24 - - - -
 Notes: Ireland has introduced an IP Box in 2016, Italy in 2015, Portugal in 2014, and the UK in 2013. 2Only in
 1

 Nidwalden. 3In France and Luxembourg acquired IP is admitted to the IP Box only under certain circumstances. The
 statutory tax rates correspond to corporate income tax rates including any surcharges, local taxes, or other taxes.
 Abbreviations: Y: yes, N: no.

 11
According to Table 2, all IP Boxes significantly decrease taxation of profits generated by
intangible assets. For example, in Malta the standard corporate income tax rate reaches 35%,
while the reduced IP Box tax rate equals 0%. As shown in Table 2 and as discussed in section
2.2.2, before the implementation of the OECD Nexus Approach in 2015, the majority of IP
Boxes were open for acquired IP as well. Furthermore, according to Table 2, some IP Boxes
enable a preferential tax treatment of the existing intangibles in addition to the newly created
ones. Belgium and Hungary are the only two countries that permit a gross approach in the
treatment of current R&D expenses. As described in section 2.2.2, this method is beneficial
from a company’s point of view, since it allows firms to deduct R&D expenditure at a regular
tax rate.

As for the research expenses that occurred in the past, around half of the existing IP Boxes do
not require a recapture of previous R&D expenses, as Table 2 shows. By contrast, in
Liechtenstein and the Netherlands they have to be recaptured in accordance with the threshold
approach and in Cyprus and Luxembourg they have to be reconsidered following the
capitalization method. In Malta, R&D expenses are not allowed to be deducted if an IP Box
regime applies. In this case, a company has to decide whether to deduct its R&D expenditure
and benefit from the input-oriented R&D tax incentives or to apply for an IP Box and achieve
a full tax exemption of profits generated by intangible assets.

3 A Review of Empirical Literature on the Effectiveness of R&D Tax
 Incentives
3.1 The Impact of Input-Oriented R&D Tax Incentives

Numerous empirical papers have evaluated the effectiveness of input-oriented R&D tax
incentives. Table 3 presents an overview of studies conducted in this field of research between
2002 and 2016. These studies make use of different data samples and econometric techniques
and nevertheless all of them identify a positive correlation between input-oriented R&D tax
incentives and the private sector’s innovative activity. Panel A of Table 3 shows an overview
of papers that evaluate an influence of the user costs of R&D or the B-Index on research and
development, whereas Panel B focuses on literature that estimates the outcomes of reforms that
have introduced input-oriented tax incentives.

 12
3.1.1 The Impact of User Costs and B-Index

In studies shown in Panel A, the dependent variable – a private sector’s innovative activity – is
often proxied by firms’ R&D expenditure or a number of new patent registrations. The main
independent variable of interest in these papers is expressed either through the user costs of
R&D or the B-Index. Jorgenson (1963) introduced the first of the two measures and Hall and
Jorgenson (1967) further developed it. The user costs of R&D reflect the breakeven cost-
benefit ratio of a marginal R&D investment after tax. Hence, this measure incorporates the
reduction in a firm’s corporate tax liability associated with each euro invested in R&D. Warda
(2001) introduced the B-Index, which is an alternative measure of R&D costs.

 1 − ( )
 _ = (1)
 (1 − )

In equation 1, τ denotes statutory corporate income tax rate, whereas A represents a combined
net present value of allowances and tax credits applied to R&D expenses. If an R&D investment
is fully expensed in a fiscal year, both A and the _ are equal to one. Tax credits, tax
deductions or any other kind of input-oriented tax incentives increase A, which results in the
 _ being smaller than one. Consequently, the lower the B-Index, the more attractive the
tax system is for R&D investment and vice versa.

As shown in Panel A of Table 3, one of the first studies to estimate the effect of increasing user
costs on innovation was Bloom et al. (2002). The authors use data from nine OECD countries
over the years 1979-1997 and develop a measure for the user costs of R&D that contains
depreciation allowances on R&D investments, net present value of R&D tax credits, and
corporate income tax rates. In the empirical part of their analysis, Bloom et al. (2002) estimate
a model in which the dependent variable equals the aggregate R&D expenses, while the
independent variables include user costs of R&D, output, time- and country-specific fixed
effects. In the baseline specification, the authors apply an instrumental variable approach and
find a significant impact of fiscal incentives on R&D expenditure with a short-term elasticity
of -0.1 and a long-term elasticity of -1.0. This implies that on average a 1% reduction in R&D
user costs leads to a 0.1% increase in the R&D expenses in the short run and a 1% increase in
the long run. A positive impact of decreasing user costs on R&D expenditure has been
confirmed in numerous further studies using country- and firm-level data (see as examples:
Baghana and Mohnen (2009), Wilson (2009), Lokshin and Mohnen (2012), Mulkay and
Mairesse (2013), Thomson (2015)). Some authors have taken a step further by investigating the

 13
heterogeneity of this effect for different firm sizes and industry classes. For example, Baghana
and Mohnen (2009) argue that the positive impact of decreasing R&D user costs on R&D
spending is larger for small firms than for large companies.

Table 3. An Overview of Empirical Studies on the Effectiveness of Input-Oriented R&D Tax
 Incentives

Panel A. The Impact of User Costs and B-Index
 Paper Sample
 Empirical
 Authors Year Countries Time Period
 Model Results
Bloom et al. 2002 9 OECD 1979-1977 OLS, IV A positive effect of decreasing
 countries user costs on the level of R&D.
 The effect is larger in a long run
 than in a short run.
Falk 2006 21 OECD 1975-2002 GMM A positive effect of decreasing
 countries B-Index on business R&D
 spending.
Baghana and 2009 Canada, Quebec 1997-2003 OLS, GMM A positive effect of decreasing
Mohnen Manufacturing user costs on the level of R&D.
 Firms The effect is larger in a long run
 than in a short run. In addition,
 the effect is larger for small
 firms than large companies.
Wilson 2009 the United 1981-2004 OLS A positive effect of decreasing
 States user costs on the level of a
 state’s R&D.
Corchuelo and 2010 Spain 2002 PSM, IV A positive effect of decreasing
Martínez-Ros B-Index on the level of R&D.
 Large firms in tech sectors
 benefit most from tax incentives
 for innovation.
Ernst and 2011 20 EU countries 1998-2007 OLS, Logit, A positive effect of decreasing
Spengel Negative B-Index on the probability to
 Binominal invest in R&D.
Lokshin and 2012 Netherlands 1996-2004 IV A positive effect of decreasing
Mohnen user costs on a firm’s
 investment in R&D.
Mulkay and 2013 France 2000-2007 GMM A positive effect of decreasing
Mairesse user costs on a firm’s
 investment in R&D.
Westmore 2013 19 OECD 1983-2008 mean-group A positive effect of decreasing
 countries estimator B-Index on R&D expenditure
 and the number of new patent
 applications.

 14
Ernst et al. 2014 members of the 1995-2007 OLS, Diff- A positive effect of decreasing
 EPO in-Diff B-Index on the quality of
 patents.
Thomson 2015 26 OECD 1987-2006 OLS A positive effect of decreasing
 countries user costs on R&D financed by
 the business sector.

A Meta-Study
Gaillard- 2015 16 articles, 82 Studies A meta- A positive effect of decreasing
Ladinska et al. effect estimates published regression user costs on a firm’s stock of
 between 1990 analysis R&D capital and flow of R&D
 and 2014 expenditure.
Notes: OLS stands for ordinary least squares, IV stands for instrumental variable, GMM denotes generalized
method of moments, PSM stands for propensity score matching, Diff-in-Diff denotes a difference-in-difference
estimation, EPO stands for the European Patent Office.

Panel B. Evaluation of a Treatment Effect

 Paper Sample
 Empirical
 Authors Year Countries Time Period Model Results
Klassen et al. 2004 Canada, the 1991-1997 OLS A positive effect of a tax credit
 United States reform on R&D spending. The
 impact is stronger in the US than
 in Canada.
Haegeland and 2007 Norway 1993-2005 GLS, Diff- A positive effect of a tax credit
Moen in-Diff reform on the R&D investment.
Lee 2011 Canada, 1997 GMM, IV A positive effect of a tax credit
 Japan, Korea, reform on the R&D investment.
 Taiwan, The effect varies across firms,
 China, India industries, and country
 characteristics.
Yang et al. 2012 Taiwan 2001-2005 OLS, Logit, A positive effect of a tax credit
 IV, GMM reform on a firm’s R&D
 spending.
Bozio et al. 2014 France 2004-2010 Logit, Diff- A positive effect of a tax credit
 in-Diff, reform on the R&D investment
 PSM but a possible lower impact on
 its innovation than could have
 been expected.
Kasahara et al. 2014 Japan 2000-2003 GMM A positive effect of a tax credit
 reform on the level of R&D.
Kobayashi 2014 Japan 2009 Probit, A positive effect of a tax credit
 PSM reform on the R&D spending of
 SMEs.
Guceri 2017 UK 2003-2012 Logit, Diff- A positive effect of a tax credit
 in-Diff, reform on the R&D spending.
 PSM

 15
A Meta-Study
Castellacci and 2015 34 articles, Studies A meta- A positive effect of a tax credit
Lie 404 effect published regression reform on the R&D investment.
 estimates between 1991 analysis The effect is stronger for SMEs,
 and 2013 firms in service sectors, and
 firms in low-tech sectors in
 countries with an incremental
 scheme.
Notes: OLS stands for ordinary least squares, GLS stands for generalized least squares, IV denotes instrumental
variable, GMM means generalized method of moments, PSM stands for propensity score matching, Diff-in-Diff
denotes a difference-in-difference estimation, SME stands for a small or medium enterprise.

Falk (2006), Corchuelo and Martínez-Ros (2010), Ernst and Spengel (2011), Westmore (2013),
Ernst et al. (2014) find a positive impact of decreasing B-Index on a firm’s R&D expenses and
its probability to invest in research and development. Westmore (2013) argues that the declining
B-Index has a positive effect not only on R&D expenditure but also on its innovation, measured
as a number of new patent applications. Ernst et al. (2014) develop this idea further and state
that the B-Index is negatively correlated with both the number of patent applications and also
their quality. Finally, Gaillard-Ladinska et al. (2015) conduct a meta-study that analyzes 82
estimates from 16 empirical studies within this field of literature. The authors argue in favor of
a positive effect of decreasing user costs on a firm’s stock of R&D capital and its R&D
expenditure. In addition, the effects found in the earlier and more recent studies are of
approximately the same magnitude.

3.1.2 Evaluation of a Treatment Effect

Panel B of Table 3 presents an overview of empirical studies that evaluate effects of the reforms
that have introduced input-oriented R&D tax incentives. These papers differ from those
described in the previous section mainly through their identification strategy. Namely, they
focus on a particular reform that changed (or introduced) fiscal incentives and compare the
outcomes for treated and non-treated firms. However, many of the earlier studies in this area
disregard the problem of a selection bias, according to which the recipients of R&D tax credits
or super-deductions might systematically differ from the non-recipients. For this reason, recent
studies such as Yang et al. (2012), Bozio et al. (2014), Kobayashi (2014), Guceri (2017) have
estimated the effect of R&D tax incentives after meticulously correcting a possible selection
bias using the propensity score matching (PSM) technique. This strategy helps to identify
comparable companies and to classify and divide them into treatment and control groups.

 16
A recent study by Guceri (2017) estimates the effect of R&D tax incentives in a quasi-
experimental setting. The author exploits a recent reform in the UK, which increased a threshold
for small or medium enterprises (SMEs) from 250 to 500 employees. This reform changed the
composition of companies that were eligible for an R&D tax credit and therefore created a
suitable design for an empirical investigation of the treatment effect. Using firm-level data from
the UK over the period between 2003 and 2012, Guceri (2017) argues that tax incentives help
to increase R&D spending at a company level. The author finds a user costs elasticity of -1.2,
which implies that an introduction of an R&D tax incentive that decreases user costs by 1%
leads to a 1.2% increase in R&D spending. Comparable results were found by other authors
who conducted similar empirical analyses employing data on different countries and years of
observation, such as Klassen et al. (2004), Haegeland and Moen (2007), Lee (2011), Yang et
al. (2012), Kasahara et al. (2014), Bozio et al. (2014), and Kobayashi (2014). In addition, the
effects found in the earlier and more recent studies are of around the same magnitude.
Castellacci and Lie (2015) conduct a meta-study using 404 effect estimates from 34 empirical
papers in this field of research. The authors are able to identify a positive effect of tax credit
reforms on R&D investment. In addition, they argue that on average R&D tax credits have a
stronger impact on SMEs, firms in service sectors, and firms in low-tech industries in countries
with an incremental credit scheme.

3.2 The Impact of Output-Oriented R&D Tax Incentives

As discussed in section 2.3.2, several European countries have introduced IP Boxes to
encourage innovation. An IP Box significantly reduces the taxation of income generated by
qualifying intellectual property and in some cases it offers a beneficial treatment of R&D
expenditure. Evers et al. (2015) give a detailed overview of the current IP Boxes in Europe and
show the tax reductions they cause. Since in most cases IP Boxes are fairly new regulations,
the empirical research on their effectiveness or outcomes is rather scarce. A few papers that
attempt to evaluate the influence of IP Boxes on a firm’s innovative activity are presented in
Table 4.

Ernst et al. (2014) incorporate IP Boxes into their measurement of the taxation of royalty
payments and argue that they contribute towards attracting patent ownership. Similar results
are found by Griffith et al. (2014) who ex-ante estimate the impact of IP Boxes with data
running until 2005 (most current IP Boxes have been introduced afterwards). The authors
conclude that even though a greater number of patent applications are to be expected in
 17
countries with IP Boxes, these regimes likely lead to substantial revenue losses not only in
countries where they have been introduced but also in the neighboring jurisdictions.

Table 4. An Overview of Empirical Studies on the Effectiveness of Output-Oriented R&D Tax
 Incentives
 Paper Sample
 Time Empirical
 Authors Year Countries
 Period Model Results
 Ernst et al. 2014 members of 1995-2007 OLS, Diff- IP Boxes contribute to
 the EPO in-Diff attracting patent ownership.
 Griffith et al. 2014 14 EU 1985–2005 Ex-ante IP Boxes are likely to have a
 countries analysis, positive effect on the number
 and the Mixed of patent registrations. They
 United Logit could also lead to a substantial
 States reduction in tax revenues.
 Alstadsæter et 2015 33 2000-2011 Negative IP Boxes attract intangibles,
 al. countries Binomial especially high-quality patents.
 worldwide Logit The effect is stronger for IP
 Boxes that are applicable to
 acquired IP. However, the
 existence of an IP Box
 incentivizes multinationals to
 shift the location of their
 patents without a
 corresponding increase in the
 number of inventors or a shift
 of research activities.
 Dudar et al. 2015 61 1990-2012 Poisson IP Boxes that are applicable to
 countries acquired IP seem to attract
 worldwide royalty inflows. However, IP
 Boxes that are applicable only
 to self-developed IP do not
 appear to affect international
 royalty flows.
 Bradley et al. 2015 71 1990-2012 OLS IP Boxes lead to an increased
 countries patenting activity in a country
 worldwide of their implementation.
 Notes: OLS stands for ordinary least squares, Diff-in-Diff denotes a difference-in-difference estimation, and
 EPO stands for the European Patent Office.

Bradley et al. (2015) employ country-level data on patent applications filed at all major
international patent offices and investigate the impact of an IP Box implementation on a
country’s innovation. The authors find that on average a one percentage point decrease in the
tax rate on patent income leads to a 3% increase in the new patent applications. However,
Bradley et al. (2015) note that an increase in patent applications following an implementation

 18
of an IP Box does not necessarily imply an increase in innovation. They argue that an IP Box
may encourage the patenting of pre-existing unpatented intangibles in addition to incentivizing
new research activity.

Alstadsæter et al. (2015) and Dudar et al. (2015) segregate various attributes of IP Boxes and
investigate their potential effects. Dudar et al. (2015) conclude that IP Boxes that recognize
acquired intellectual property are indeed likely to attract royalty inflows into the countries of
their implementation. However, the authors do not find a similar result for the IP Boxes
applicable exclusively to self-developed intangibles and therefore they argue that
multinationals might use certain types of IP Boxes as a means of profit shifting rather than a
tool for boosting their innovation. Alstadsæter et al. (2015) conduct a detailed empirical
investigation of the effects that IP Boxes have on a firm’s patenting and its actual R&D activity.
In line with previous studies, they find that IP Boxes have a strong effect on attracting patents,
especially those of high quality. Consistent with Dudar et al. (2015), the authors find that the
effect is stronger for IP Boxes that are applicable to acquired intangible assets. Furthermore,
Alstadsæter et al. (2015) find that the existence of an IP Box encourages multinationals to
relocate their patents without a corresponding increase in the number of inventors or a shift in
research activities. Once again, this implies that IP Boxes do not provide enough incentives for
companies to conduct local research and multinationals might view them as a means of profit
shifting instead.

The empirical evidence on the effectiveness of IP Boxes shows that this type of R&D tax
incentives is likely to be used for profit shifting rather than to increase real R&D activity.
However, it is worth noting that one of the largest loopholes in the construction of IP Boxes is
about to change. This is because the misuse of IP Boxes for profit shifting is possible primarily
in the cases where not only self-developed but also acquired intangibles are eligible for a
preferential tax treatment. Hence, companies may develop an intangible in a high-tax country
and then register it in a country with an IP Box just to take advantage of the reduced taxation
of income generated by this asset. However, as mentioned in section 2.2.2, the OECD now
requires all existing and planned IP Boxes to follow the Nexus Approach, according to which
IP Boxes should favor only intangible assets that were locally developed.9

In summary, the empirical evidence on input-oriented R&D tax incentives, such as tax credits
or tax super-deductions, is extensive and has a long history. The authors in this field of research

9
 See OECD (2015).

 19
find a strong positive effect of introducing or changing input-oriented fiscal incentives on the
innovative activity of companies and this effect is of around the same magnitude in the earlier
and more recent studies. In contrast, the literature on output-oriented R&D tax incentives is
rather limited, because IP Boxes are fairly new regulations. Here, the authors usually find a
positive effect of IP Boxes on a number of patents held in a country. However, as yet there is
no robust evidence to show that an increase in the real R&D activity is caused by the
introduction of an IP Box. Therefore, multinationals might view output-oriented R&D tax
incentives not only as a way of fostering research and development but also as a means of tax
planning.

4 The Use of R&D Tax Incentives in Tax Planning: A Theoretical Analysis

The previous two sections have introduced the main types of R&D tax incentives and discussed
the outcomes of their implementation. The primary aim of this part of the paper is to analyze a
less researched aspect of R&D tax support; namely, its potential use by multinational
enterprises for tax planning. Thus, this section initially explains a standard set-up of the
Devereux and Griffith model10 and goes on to incorporate input- and output-oriented R&D tax
incentives into the model, following the framework developed by Spengel and Elschner (2010)
and Evers et al. (2015). Furthermore, two main settings are identified in our theoretical analysis:
to begin with, a domestic investment case is presented, in which an intangible asset is developed
and afterwards kept in the same country. Following on from this, a cross-border investment
scenario is introduced, where an intangible asset is developed in one country and then sold to
another one. The scope of our analysis covers the EU and EFTA member states in 2012.

4.1 Domestic Investment

4.1.1 Devereux and Griffith Model for Calculating Effective Tax Burden

Statutory corporate income tax rates are usually inadequate in capturing the true tax burden that
an investing company faces. Therefore, there are several theoretical approaches to measure
effective tax rates. For example, Devereux and Griffith (1999, 2003) expand on the earlier work
by Jorgensen (1963), Hall and Jorgensen (1967), as well as King and Fullerton (1984) and

10
 See Devereux and Griffith (1999, 2003).

 20
formulate a model that incorporates various aspects of a tax system and therefore reflects a country’s effective corporate tax burden. The key assumptions of the Devereux and Griffith model comprise perfect capital mobility under certainty and a successful outcome of real investment. Furthermore, the Devereux and Griffith approach is based on the assumption of a hypothetical investment that takes place in one period and generates returns in the next period. In a standard setting of the model, it is assumed that the investment flows into five different assets such as machinery, industrial buildings, financial assets, inventory, and intangible assets. However, in line with Evers and Spengel (2014) this study focuses only on the investment in an intangible asset, namely a self- developed patent. Furthermore, a standard case of the Devereux and Griffith approach incorporates three different sources of investment financing such as retained earnings, borrowed capital, and new equity. Referring to Evers and Spengel (2014) and for reasons of simplification, this study assumes that a patent is financed only by the means of equity. Moreover, it is assumed that R&D expenditure only consists of current R&D expenses, such as costs of R&D personnel. This assumption is plausible, since according to the OECD data on R&D spending, during the last few years current expenses constituted the majority of the total expenditure on research and development in most OECD countries.11 Table 5 summarizes the most important assumptions of the Devereux and Griffith model and gives an overview of economic parameters applied in our study.12 Table 5. Summary of the Assumptions Assumption on Value Legal form Corporation Industry Manufacturing industry Economic good A self-developed patent Source of financing Equity Economic depreciation Declining 15.35% Real market interest rate r 5% Inflation rate 2% Nominal interest rate 7.1%1 Real pre-tax return 20% Useful life of an asset 10 years Notes: i (1 r) (1 ) 1. The assumptions about economic parameters and depreciation rules are based on 1 the ZEW work on effective tax rates. 13 11 See OECD (2016a). 12 .The robustness of the economic parameters in the Devereux and Griffith model has been tested in several studies (see European Commission/ZEW (2016)). 13 See ZEW (2016). 21
The Devereux and Griffith approach allows us to calculate several measures of the effective tax
burden. For instance, the cost of capital and the effective marginal tax rate (EMTR) show an
effective taxation of a marginal investment. The net present value (NPV) of a marginal
investment is equal to zero, which implies that the returns from this investment are just
sufficient but do not exceed the returns of an alternative capital-market investment.14 However,
since this study concentrates on modelling tax planning opportunities of profitable
multinational firms, we assume that a company’s investment is lucrative. Therefore, we rely on
calculating and comparing the effective average tax rates (EATRs), which show an effective
tax burden on profitable investments and are relevant for a firm’s investment location decisions.
As shown in equation 2, EATR is calculated as a percentage difference between the net present
value of an investment in the absence and in the presence of taxation.

 = ( ∗ − )/ ( ) (2)
 (1 + )

In equation 2, ∗ represents the net present value of an investment in the absence of taxes and
 shows its NPV in the presence of taxation. The denominator represents the NPV of a total
pre-tax income stream net of the rate of return. The net present value in the presence of taxation
 is in turn calculated as follows:15

 ( + )(1 + ) (1 − )(1 + )
 R = −( 1 − A) + (1 − ) + (1 − )
 (1 + ) (1 + )
 (3)
 R&D expenses, tax Returns generated Reduction in capital stock
 depreciation by a patent

As noted above, the Devereux and Griffith model is based on the assumption of a hypothetical
investment that lasts two periods. The first term of equation 3 reflects the investment
implemented in the first period, with A denoting the tax allowances. The next two terms
represent the changes in the second period of a hypothetical investment. Hence, the second term
shows the returns from the investment, whereby represents a real return on investment,
stands for the cost of depreciation, denotes the rate of inflation, denotes the interest rate,
and represents the tax rate. Finally, the third term shows a reduction in the capital stock to its

14
 In this study, an alternative capital-market investment is a financial asset that yields a real market interest rate
(which is equal to 5%, as shown in Table 5).
15
 For more details regarding the model, see Devereux and Griffith (1999, 2003), Spengel and Lammersen (2001),
Schreiber et al. (2002), and Evers et al. (2015).

 22
initial level, so that the stock of capital remains unchanged between the two periods. After the
calculation of the after-tax net present value of an investment, we compute the effective average
tax rate using equation 2.

Furthermore, in Belgium and Liechtenstein a notional interest deduction (NID) for equity
capital is available. This tax instrument allows companies to deduct a certain percentage of the
qualifying equity capital from their taxable profits. The objective of NID is to even out the tax
treatment of two major sources of investment financing – equity and debt. From a tax point of
view, debt might be seen as a preferable financing way compared to equity, because interest
payments are tax deductible in most countries and therefore minimize a company’s overall tax
liability. NID gives a similar kind of advantage to equity financing. This tax measure is
incorporated into the Devereux and Griffith model by adding expressed in equation 4 to
equation 3. In equation 4, represents the notional interest rate, with other terms
corresponding to the ones in equation 3.

 (1 − )( )
 = (4)
 1+

Figure 2 summarizes effective average tax rates in Europe in 2012, which we have calculated
using the Devereux and Griffith model. These tax rates represent the effective tax burden that
a large company faces when developing and subsequently holding a patent. The results
presented in Figure 2 were calculated without the consideration of any available R&D tax
incentives. According to Figure 2, the EATRs of the EU and EFTA member states range from
7.2% in Liechtenstein to 25.8% in France and 26.3% in Malta. The Eastern European countries
along with Liechtenstein, Ireland, and Switzerland (Kanton Nidwalden) offer the lowest tax
burden for companies developing a patent in Europe. By contrast, the western and northern
European countries along with Malta appear to have comparatively high effective tax rates.

4.1.2 Incorporating R&D Tax Incentives into the Devereux and Griffith Model

This section covers the conceptual framework developed by Spengel and Elschner (2010) and
Evers et al. (2015) to incorporate input- and output-oriented R&D tax incentives from Tables 1
and 2 into the Devereux and Griffith model. It is assumed in the model that a large multinational
corporation carries out a hypothetical investment and for this reason only R&D tax incentives
for large firms are considered here. In addition, we assume that a hypothetical

 23
You can also read