Safely managed drinking water - UNICEF Data
←
→
Page content transcription
If your browser does not render page correctly, please read the page content below
Safely managed drinking water
WHO Library Cataloguing-in-Publication Data
Safely managed drinking water - thematic report on drinking water 2017
1.Water supply - standards. 2.Sanitation - trends. 3.Drinking water - supply and distribution.
4.Program evaluation. I.World Health Organization. II.UNICEF.
ISBN 978 92 4 156542 4 (NLM classification: WA 670)
© World Health Organization 2017
This joint report reflects the activities of the World Health Organization (WHO) and the United Nations Children’s Fund (UNICEF).
Some rights reserved. This work is available under the Creative Commons Attribution-NonCommercial-ShareAlike 3.0 IGO licence (CC BY-NC-SA
3.0 IGO; https://creativecommons.org/licenses/by-nc-sa/3.0/igo).
Under the terms of this licence, you may copy, redistribute and adapt the work for non-commercial purposes, provided the work is appropriately
cited, as indicated below. In any use of this work, there should be no suggestion that WHO or UNICEF endorses any specific organization,
products or services. The use of the WHO or UNICEF logos is not permitted. If you adapt the work, then you must license your work under the
same or equivalent Creative Commons licence. If you create a translation of this work, you should add the following disclaimer along with the
suggested citation: “This translation was not created by the World Health Organization (WHO). WHO is not responsible for the content or accuracy
of this translation. The original English edition shall be the binding and authentic edition”.
Any mediation relating to disputes arising under the licence shall be conducted in accordance with the mediation rules of the World Intellectual
Property Organization (http://www.wipo.int/amc/en/mediation/rules).
Suggested citation. Safely managed drinking water - thematic report on drinking water 2017. Geneva, Switzerland: World Health Organization;
2017. Licence: CC BY-NC-SA 3.0 IGO.
Cataloguing-in-Publication (CIP) data. CIP data are available at http://apps.who.int/iris.
Sales, rights and licensing. To purchase WHO publications, see http://apps.who.int/bookorders. To submit requests for commercial use and
queries on rights and licensing, see http://www.who.int/about/licensing.
Third-party materials. If you wish to reuse material from this work that is attributed to a third party, such as tables, figures or images, it is your
responsibility to determine whether permission is needed for that reuse and to obtain permission from the copyright holder. The risk of claims
resulting from infringement of any third-party-owned component in the work rests solely with the user.
General disclaimers. The designations employed and the presentation of the material in this publication do not imply the expression of any
opinion whatsoever on the part of WHO or UNICEF concerning the legal status of any country, territory, city or area or of its authorities, or
concerning the delimitation of its frontiers or boundaries. Dotted lines on maps represent approximate border lines for which there may not yet be
full agreement.
The mention of specific companies or of certain manufacturers’ products does not imply that they are endorsed or recommended by either WHO
or UNICEF in preference to others of a similar nature that are not mentioned. Errors and omissions excepted, the names of proprietary products
are distinguished by initial capital letters.
All reasonable precautions have been taken by WHO and UNICEF to verify the information contained in this publication. However, the published
material is being distributed without warranty of any kind, either expressed or implied. The responsibility for the interpretation and use of the
material lies with the reader. In no event shall either WHO or UNICEF be liable for damages arising from its use.
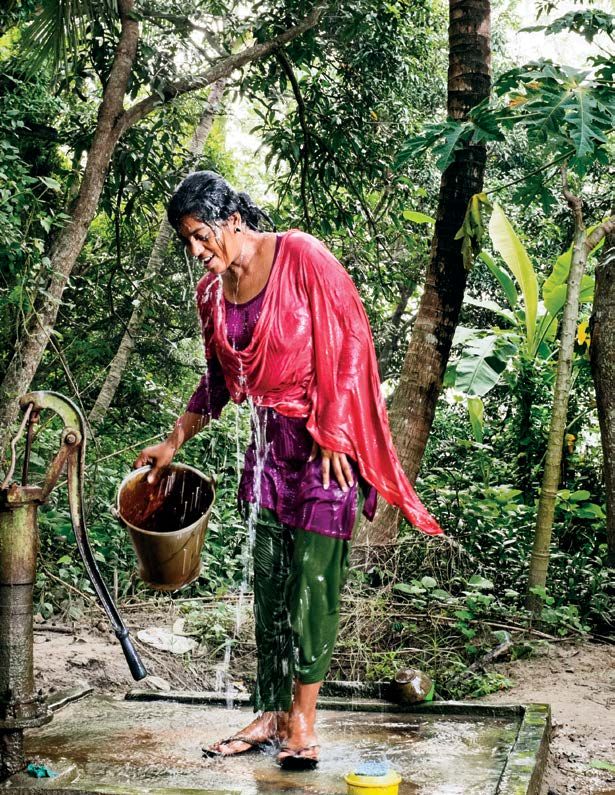
Photo credits: Cover: © WaterAid/Tom Greenwood; P1: © UNICEF/UNI180126/Matas; P2: © UNICEF/UNI198192/Adatsi; P4: © UNICEF/
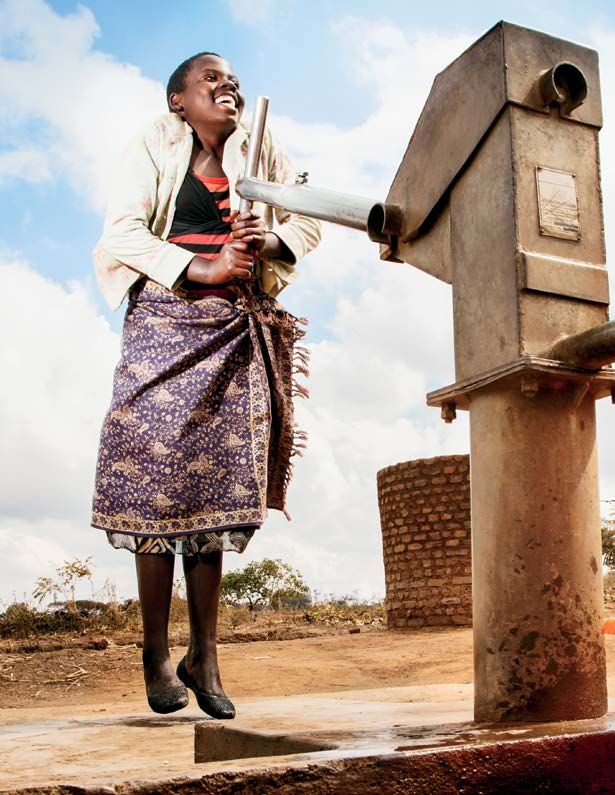
UN016387/Singh; P7: © UNICEF/UN011604/Holt; P8: © UNICEF/UNI189754/Gilbertson VII Photo; P16: © WaterAid/Abir Abdullah; P17: ©
UNICEF/UN022125/Ayene; P21: © UNICEF/UNI193997/Gilbertson VII Photo; P24: © UNICEF/UNI166362/Noorani; P32: © Osterwalder; P34: ©
WaterAid/Tom Greenwood;
P38: © UNICEF/UN016418/Singh; P41: © UNICEF/UN09390/Sewunet; P42: ©UNICEF HQ/2015/Coskun;
P44: © UNICEF/UNI193393/Gilbertson VII Photo; P46: © WaterAid/Habibul Haque; P49: © UNICEF/UNI183554/Khuzaie; P53: © UNICEF/
UNI162690/Phelps; P54: © UNICEF/UN016438/Singh
Design and Layout: Prographics, Inc.
Edited by Anna Grojec (Audaz)
Printed in the United States of America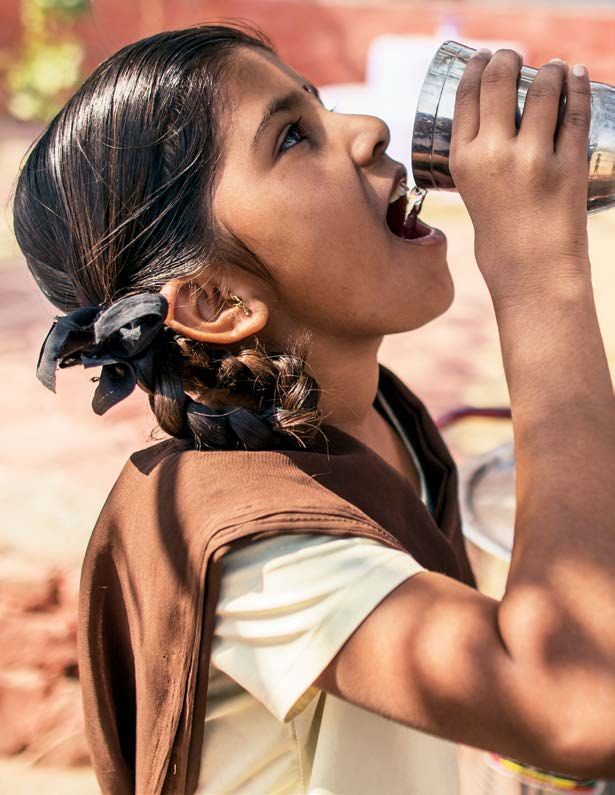
Safely managed
 drinking water
Contents
1 Introduction................................................ 5

2	The 2030 Agenda for
   drinking water............................................ 9
       2.1     A vision for 2030.............................................10
       2.2     A new ladder for household drinking water...12
       2.3     Going beyond the household........................14
       2.4     Tracking inequalities.......................................16
       2.5     Affordability of drinking water services..........22

3	Elements of safely managed
   drinking water services.......................... 25
       3.1     Accessibility...................................................26
       3.2     Availability......................................................33
       3.3     Quality............................................................38

4	Estimating safely managed
   drinking water.......................................... 45

Annex 1: Preliminary analysis of
data availability by region.................................................52

                                  SAFELY MANAGED DRINKING WATER                        3
SAFELY MANAGED DRINKING WATER

1   Introduction
          The WHO/UNICEF Joint Monitoring
          Programme for Water Supply and
          Sanitation (JMP) was established
          in 1990. Since then, the JMP has
          produced regular estimates of
          global, regional and national
          progress on drinking water,
          sanitation and hygiene (WASH).
          This thematic report examines
          safely managed drinking water
          services in the context of the
          2030 Agenda for Sustainable
          Development.

                   SAFELY MANAGED DRINKING WATER   55
INTRODUCTION

    Over the past 25 years, the JMP has been instrumental                                ‘Universal access’ means everyone. The report draws
    in developing global norms to benchmark progress                                     attention to those populations who remain unserved
    and facilitating critical reflection among WASH sector                               and outlines JMP plans for tracking inequalities
    stakeholders. The JMP was responsible for tracking                                   between and within countries. ‘Universal’ also implies
    progress towards the 2015 Millennium Development                                     expanding monitoring efforts beyond the household,
    Goal (MDG) target 7c and will be responsible for                                     to include institutions and other settings. The report
    monitoring the new 2030 Sustainable Development                                      identifies global indicators that the JMP will use to
    Goal (SDG) targets 6.1 and 6.2.                                                      monitor access to water in schools and health care
                                                                                         settings as a first priority.
    The SDG targets aim for universal access to drinking
    water, sanitation and hygiene and call for enhanced                                  The second section of the report examines the
    monitoring to ensure that no one is left behind. This                                availability of data on the different elements of safely
    report considers the implications of target 6.1, “by                                 managed drinking water services and discusses
    2030, achieve universal and equitable access to safe                                 data-related challenges. It illustrates how the JMP will
    and affordable drinking water for all,” and outlines JMP                             combine data from different sources in order to track
    plans for enhanced global monitoring of drinking water                               the progressive elimination of inequalities in access
    during the SDG era.1                                                                 and service levels, and global progress towards the
                                                                                         SDG target over the next 15 years.
    The first section examines the SDG vision for
    universal access and the specific language used in                                   The report concludes that monitoring progress
    the formulation of global targets. It acknowledges                                   towards safely managed drinking water will be more
    the limitations of indicators based on source type                                   challenging in some countries than others, but
    and introduces a more ambitious indicator for                                        estimates are expected to improve over time as
    SDG monitoring that takes account of accessibility,                                  more and better data become available.
    availability and quality of drinking water. ‘Safely
    managed drinking water services’ represents a
    higher level of service and a new rung at the top
    of the drinking water ‘ladder’ used by the JMP for
    global monitoring.

    1    The implications of SDG 6.2 and JMP plans for global monitoring of sanitation and hygiene in the SDG era will be explored in a separate thematic report.

6       JMP THEMATIC REPORT ON DRINKING WATER 2016
BOX 1
A global goal dedicated to water and sanitation

             GOAL 6. ENSURE AVAILABILITY AND SUSTAINABLE
             MANAGEMENT OF WATER AND SANITATION FOR ALL

  TARGETS
  6.1    By 2030, achieve universal and equitable access to safe and affordable
         drinking water for all

  6.2    By 2030, achieve access to adequate and equitable sanitation and
         hygiene for all and end open defecation, paying special attention to
         the needs of women and girls and those in vulnerable situations

  6.3    By 2030, improve water quality by reducing pollution, eliminating
         dumping and minimizing release of hazardous chemicals and
         materials, halving the proportion of untreated wastewater and
         substantially increasing recycling and safe reuse globally

  6.4    By 2030, substantially increase water-use efficiency across all sectors
         and ensure sustainable withdrawals and supply of freshwater to
         address water scarcity and substantially reduce the number of people
         suffering from water scarcity

  6.5    By 2030, implement integrated water resources management at all
         levels, including through transboundary cooperation as appropriate

  6.6    By 2020, protect and restore water-related ecosystems, including
         mountains, forests, wetlands, rivers, aquifers and lakes

  6.a    By 2030, expand international cooperation and capacity-building
         support to developing countries in water- and sanitation-related
         activities and programmes, including water harvesting, desalination,
         water efficiency, wastewater treatment, recycling and reuse
         technologies

  6.b    Support and strengthen the participation of local communities in
         improving water and sanitation management

                                                                             SAFELY MANAGED DRINKING WATER   7
SAFELY MANAGED DRINKING WATER

2     The 2030
    Agenda for
       drinking
         water
      The Sustainable Development Goals
      call for universal access by 2030. In
      this section, new ladders for monitoring
      drinking water services at home, at
      school and in health facilities are
      presented, together with proposals for
      enhanced monitoring on inequalities
      and affordability during the SDG era.

                                                 9
THE 2030 AGENDA FOR DRINKING WATER
2.1 A vision for 2030
The 2030 Agenda for Sustainable Development (2030 forms” and “leave no one behind.” Furthermore, it is
Agenda)2 sets out 17 Sustainable Development Goals recognized that the targets under Goal 6 are closely
and 169 targets designed to be universally relevant interdependent, and that progress towards water and
and applicable to all countries. The SDGs call for sanitation targets is critical for the achievement of
an integrated approach to social, economic and other SDG goals and targets (see Box 2).
environmental dimensions, and this is reflected in
Goal 6, which includes targets addressing all aspects Target 6.1 relates to drinking water. The target text
of the water and sanitation cycle (Box 1). has been carefully formulated and agreed upon by all
the United Nations Member States, and is far more
The Goal 6 targets for water and sanitation are highly ambitious than the previous MDG target. Firstly, it
ambitious, but consistent with the overarching aims to achieve universal access, rather than just
ambition of the 2030 Agenda to “end poverty in all its halving the proportion of the population without
BOX 2
Water, Sanitation and Hygiene in the SDGs
The 2030 Agenda emphasizes the indivisible nature of the 17 Sustainable Development Goals and 169 targets and the
need to address the links between the social, economic and environmental aspects of development. UN Water partners
have identified a wide range of links and interdependencies between the Goal 6 targets on water and sanitation and targets
under other goals.3
Goal 6 calls for an integrated approach to monitoring that takes account of the links between water supply, sanitation
and hygiene (6.1 and 6.2) and treatment, recycling and reuse of wastewater (6.3), increasing efficiency and ensuring
sustainable withdrawals (6.4) and protection of water-related ecosystems (6.6) as part of an integrated approach to
water resources management (6.5). It also focuses attention on the links between development outcomes and means of
implementation (6a and 6b). To this end, the JMP will work closely with UN Water partners involved in monitoring targets
6.3–6.6, 6a and 6b under the GEMI initiative for Integrated Monitoring of SDG targets for water and sanitation4 and the
Global Analysis and Assessment of Sanitation and Drinking Water (GLAAS).5
Progress on drinking water, sanitation and hygiene is also critical for the achievement of other targets, including reducing
poverty and achieving universal access to basic services (1.1 and 1.2); ending all forms of malnutrition (2.2); ending
preventable child deaths, combating neglected tropical diseases and waterborne diseases, and achieving universal health
coverage (3.2, 3.3, 3.8 and 3.9); providing safe and inclusive learning environments (4a); ending violence against women
and girls and reducing gender inequality (5.2 and 5.4); ensuring adequate, safe and affordable housing for all (11.1) and
reducing deaths caused by disasters (11.5). The JMP will therefore continue to collaborate with monitoring initiatives from
other sectors during the SDG era.
2 United Nations General Assembly, ‘Resolution adopted by the General Assembly on 25 September 2015: 70/1. Transforming our world: The 2030 Agenda for
Sustainable Development’, A/RES/70/1, 21 October 2015, .
3 See .
4 See .
5 See
10 JMP THEMATIC REPORT ON DRINKING WATER 2016access. Secondly, it calls for equitable access, In March 2016, the Inter-Agency and Expert Group
which implies reducing inequalities in service levels on SDG indicators published a list of 230 global
between population subgroups. Thirdly, it specifies SDG indicators.6 The indicator selected for global
that drinking water should be safe, affordable and monitoring of SDG target 6.1 is the ‘proportion
accessible to all. of population using safely managed drinking
water services’. Safely managed drinking water
The JMP has developed a normative interpretation represents an ambitious new global service norm
for each of the terms used in target 6.1 (Table 1). that forms part of the new JMP ladder for global
While it is not yet possible to measure all of these monitoring of household drinking water services.
elements on a routine basis in all countries, the JMP
approach to global monitoring aims to reflect this
normative interpretation as closely as possible.
TABLE 1
JMP normative interpretation of terms used in SDG target 6.1
Target language Normative interpretation
By 2030, achieve
universal Implies all exposures and settings, including households, schools, health facilities,
workplaces and public spaces
and equitable Implies progressive reduction and elimination of inequalities between population subgroups
access Implies sufficient water to meet domestic needs is reliably available close to home
to safe Safe drinking water is free from pathogens and elevated levels of toxic substances at all times
and affordable Payment for services does not present a barrier to access or prevent people from meeting other
basic human needs
drinking water Water used for drinking, cooking, food preparation and personal hygiene
for all Suitable for use by men, women, girls and boys of all ages, including people with disabilities
6 United Nations Economic and Social Council, Statistical Commission, ‘Report of the Inter-Agency and Expert Group on Sustainable Development Goal
Indicators’, E/CN.3/2016/2/Rev.1*, 19 February 2016, .
SAFELY MANAGED DRINKING WATER 11THE 2030 AGENDA FOR DRINKING WATER
2.2 A new ladder for household drinking water
Since 2000, the JMP has used a simple improved/ water services. The rungs on the ladder are designed to
unimproved source type classification to compare enable countries at different stages of development to
progress across countries.7 It has also developed benchmark and compare progress over time.
drinking water and sanitation ‘ladders’ that enable
further differentiation of service levels. International At the bottom of the ladder, the JMP will continue to
consultations with WASH sector stakeholders8 differentiate populations using surface water such as
recommended that future global WASH monitoring rivers, lakes and ponds (no service) and other unimproved
should build on established indicators and sources that do not protect against contamination
progressively address the normative criteria of the (unimproved) from populations using improved sources
human right to water.9 whose design protects against contamination. During
the SDG reporting period, the population using improved
The JMP has developed a new service ladder to facili- sources will be subdivided into three levels of service.
tate enhanced monitoring of drinking water during the
SDG era (Figure 1). It builds on the established source If a household uses an improved source that is not readily
type classification, thereby providing continuity with accessible (i.e., a round trip to collect water, including
MDG monitoring, and introduces additional criteria on queuing, exceeds 30 minutes), then it will be categorized
the accessibility, availability and quality of drinking as ‘limited’ service. But if the improved source is readily
The new JMP ladder for household drinking water services
Service level Definition
Safely managed Drinking water from an improved water source which is located on premises, available
when needed and free of faecal and priority contamination
Basic Drinking water from an improved source provided collection time is not more than
30 minutes for a roundtrip including queuing
Limited Drinking water from an improved source where collection time exceeds over 30 minutes for
a roundtrip to collect water, including queuing
Unimproved Drinking water from an unprotected dug well or unprotected spring
No service Drinking water collected directly from a river, dam, lake, pond, stream, canal or irrigation
channel
FIGURE 1 JMP service ladder for household drinking water
7 See WHO/UNICEF Joint Monitoring Programme for Water Supply and Sanitation, ‘Definitions & Methods’, .
8 See WHO/UNICEF Joint Monitoring Programme for Water Supply and Sanitation,
‘Post-2015 Monitoring’, .
9 United Nations 2010, A/HRC/15/31/Add.1 Report of the independent expert on the issue of human rights obligations related to access to safe drinking water
and sanitation, Catarina de Albuquerque Addendum Progress report on the compilation of good practices.
12 JMP THEMATIC REPORT ON DRINKING WATER 2016accessible close to home (i.e., a round trip to collect More than one third of countries are not
water, including queuing, takes 30 minutes or less), it will on track to achieve universal household
be categorized as a ‘basic’ service. In order to meet the access to ‘improved’ drinking water
threshold for a ‘safely managed’ service, the improved sources by 2030
source must meet three conditions:
35 On track for universal
access by 2030
30
• source should be located on premises (within the
25
dwelling, yard or plot),
Reduction in unimproved coverage
20
• water should be available when needed, and
15
• water supplied should be free from faecal
(%pt), 2000-2015
10
and priority chemical contamination. 5
0
0 10 20 30 40 50 60
If any of the three conditions are not met, but the -5
improved source is within 30 minutes of the home, it -10
Greater
will continue to be categorized as a ‘basic’ service. -15
progress
-20 required
-25
‘Improved’ sources are those that are potentially
-30
capable of delivering safe water by nature of their
-35
design and construction. These include piped water, Unimproved coverage
boreholes or tubewells, protected dug wells, protected (%), 2015
springs, and rainwater. Unimproved sources include
unprotected dug wells and unprotected springs. Unimproved coverage and percentage
FIGURE 2 rate of reduction (2000-2015)
The JMP recognizes that bottled water and tanker
truck water can potentially deliver safe water, but
has previously treated them as unimproved due to eliminate the use of surface water and unimproved
lack of data on accessibility, availability and quality. sources that present the greatest risk to public health.
From now on, the JMP will treat them as improved and At current rates of progress, more than one third of
classify them as ‘limited’, ‘basic’ or ‘safely managed’, countries will not achieve universal access to an
based on the criteria outlined above.10 ‘improved’ source of drinking water by 2030 (Figure 2).
The SDG targets are designed to be universally Achieving universal coverage of ‘safely managed’
applicable to low-, middle- and high-income countries, drinking water services will be an even greater chal-
and the new drinking water ladder enables countries lenge. Individual countries will therefore need to
at different stages of development to benchmark and establish customized national targets focused on
compare progress in service levels over time. increasing coverage of basic and safely managed
drinking water services in line with national strategies
A top priority for the SDG era will be to extend access for sustainable development. Development partners
to those populations that remain unserved. Many low- will also need to consider how to balance support for
and middle-income countries still have work to do to extending access and improving service levels.
10 For further discussion on delivered and packaged water see Box 4 on page 37.
SAFELY MANAGED DRINKING WATER 13THE 2030 AGENDA FOR DRINKING WATER
2.3 Going beyond the household
Monitoring target 6.1, which aims for “universal access” level and would not be tracked for global
to drinking water “for all”, requires going beyond the reporting purposes.
household and considering access in institutional
settings and public spaces. The JMP has developed SDG indicator: the proportion of schools with ‘basic’
new service ladders for global monitoring of WASH in drinking water.
schools and health care facilities, and other settings will
be included once data become available. Indicator definition: the proportion of pre-primary,
primary and secondary schools with water from an
Drinking water in schools improved source available at the school.
Advanced To be defined at national level (e.g. water The improved source of drinking water does not need
service is available when needed, accessible to to be located on the premises of the school, as long
all, free from contamination, etc) as water is available on the school premises e.g.
through storage tanks. However, if a water source is
Basic service Water from an improved source
is available at the school
located at the school, but water is not available due to
malfunction or service disruption, the school would be
Limited There is an improved source but water is classed as having a ‘limited service’.
service not available at the time of survey
No service No water source or an unimproved
source Drinking water coverage in schools is
often lower when availability is considered
JMP service ladder for drinking water 100
FIGURE 3 in schools
School drinking water coverage (%)
81
80
SDG target 4a includes an explicit reference to drinking
58
water in schools. Countries are expected to report, 60
among other things, on the proportion of schools with
access to ‘basic drinking water’ as a key element of 40
“safe, non-violent, inclusive and effective learning
environments.” 20
The JMP service ladder for drinking water in schools 0
(Figure 3) focuses on tracking progress towards the Improved water Water available from
source improved source
SDG target of ‘basic’ services for all schools, while
recognizing that some countries may wish to specify Schools with improved water sources
higher levels of service for the purpose of national FIGURE 4 and with water available from an
monitoring. Definitions of such ‘advanced’ services improved source
would be made at the national or sub-national Based on countries with both types of data available in 2013
14 JMP THEMATIC REPORT ON DRINKING WATER 2016Data on drinking water services in schools are SDG indicator: the proportion of health care facilities
available for 149 countries, primarily from national with ‘basic’ water supply.
Education Management Information Systems (EMIS).
However, many countries report coverage for primary Indicator definition: the proportion of health care
schools only. Some countries already report on the facilities with water from an improved source available
criteria for ‘basic’ drinking water (water available from on premises.
an improved source), but most do not take account
of availability (Figure 4). A review of 55 national EMIS A review in 2015 found only 20 low- and middle-income
questionnaires found that 13 included questions countries with nationally representative data on drinking
about source type and water availability, but minor water coverage in health care facilities.12 Facility surveys
changes would enable national reporting on the SDGs supported by international survey programs are the most
for drinking water in schools.11 common source of data and, to date, these have typically
reported the proportion of facilities with an improved
Water supply in health care facilities
source within 500 m. Available data suggest that less than
two thirds of facilities in low- and middle-income countries
Advanced To be defined at national level (e.g. water
service is available when needed, accessible to meet this criterion (Figure 6). Given that the global standard
all, free from contamination, etc) for ‘basic’ services in health care facilities is an improved
water source on premises, coverage will be even lower. For
Basic service Water from an improved source is example, 87 per cent of health care facilities in Haiti have
available on premises
a water source within 500 m, while only 62 per cent have a
water source on premises.
Limited There is an improved source, but it is not
service on premises or water is not available
Less than two thirds of health care
No service No water source or an unimproved source facilities have an improved water source
within 500 m; fewer have water on
JMP service ladder for water supply premises
FIGURE 5
in health care facilities
Access to water is also critically important in health
care settings for ensuring quality care for all, including 38
No improved
vulnerable populations such as immunocompromised source
persons, expectant mothers and infants. Because of within 500 m
the importance of water for many purposes in health 62
care facilities, the service ladder is for general water Improved source
within 500 m
supply, and not limited to drinking water.
The JMP service ladder for water supply in health care
facilities (Figure 5) focuses on tracking progress towards
the SDG target of ‘basic’ services for all, while recog- Proportion of health care facilities with
FIGURE 6
nizing that some countries may wish to specify higher an improved water source within 500 m
levels of service for the purpose of national monitoring.
11 United Nations Children’s Fund, Advancing WASH in Schools Monitoring, Working paper, UNICEF, New York, 2015.
12 World Health Organization, Water, Sanitation and Hygiene in Health Care Facilities: Status in low- and middle-income countries and way forward, WHO, Geneva, 2015.
SAFELY MANAGED DRINKING WATER 15THE 2030 AGENDA FOR DRINKING WATER
2.4 Tracking inequalities
The 2030 Agenda commits all Member States of the continue to focus on the progressive elimination of
United Nations to “leave no one behind.” It states that inequalities during the SDG era. The 2015 update
universal targets can only be considered achieved revealed that 2.6 billion people gained access to an
when met for all subgroups within the population, and improved source between 1990 and 2015.14 Nearly
specifies that “indicators should be disaggregated, three quarters of people in the world now use piped
where relevant, by income, sex, age, race, ethnicity, water supplies on premises, amounting to an increase
migratory status, disability and geographic location from 2.3 billion to 4.2 billion over the same period.
or other characteristics.”13 While the number of people without an improved
source has declined substantially, 663 million people
The JMP has been highlighting disparities in still used unimproved sources in 2015, and among
household drinking water for over 25 years and will these, 159 million relied on surface water (Figure 8).
13 See ‘Transforming our world’, A/RES/70/1.
14 United Nations Children’s Fund and World Health Organization, Progress on Sanitation and Drinking Water: 2015 update and MDG assessment,
UNICEF and WHO, New York, 2015.
16 JMP THEMATIC REPORT ON DRINKING WATER 2016Despite increases in global coverage, 663 million people still lacked improved drinking
water sources in 2015
8
Surface water Other improved
Other unimproved Piped on premises
Population by drinking water source in 2015 (billions)
6
4
2
0
1990
1991
1992
1993
1994
1995
1996
1997
1998
1999
2000
2001
2002
2003
2004
2005
2006
2007
2008
2009
2010
2011
2012
2013
2014
2015
FIGURE 7 Population by water source in 2015 (billions)
Most of the people still using unimproved sources live in rural areas
Surface water Other unimproved
Rural 522
Urban 141
FIGURE 8 Population using unimproved drinking water sources in 2015 (millions)
SAFELY MANAGED DRINKING WATER 17THE 2030 AGENDA FOR DRINKING WATER
Achieving universal access by 2030 will be Tajikistan), at least one in five people still rely on
especially challenging for the 41 countries where surface water for drinking.
over one fifth of the population continued to
use unimproved drinking water sources in 2015 Although 147 countries met the MDG target of halving
(Figure 9). These are mainly concentrated in the proportion of population without access to an
sub-Saharan Africa, but are also found in several improved drinking water source, in some countries
other regions. Those who rely directly on rivers, coverage actually decreased between 1990 and
lakes and irrigation canals for drinking face the 2015.15 For example, in the West Bank and Gaza
greatest risks to health and well-being. In seven Strip, the use of improved sources has declined
countries (Angola, Kenya, Madagascar, Papua by 32 percentage points since 2000. The JMP will
New Guinea, Sierra Leone, South Sudan and continue to report on overall rates of progress
In 41 countries, more than one in five people still used unimproved sources in 2015
Percentage of population using an unimproved drinking water source
20 Insufficient data or not applicable
FIGURE 9 Proportion of population using an unimproved drinking water source in 2015 (%)
15 UNICEF and WHO, Progress on Sanitation and Drinking Water: 2015 update and MDG assessment.
18 JMP THEMATIC REPORT ON DRINKING WATER 2016and highlight those countries where coverage is that the regions with the largest gaps are Oceania and
stagnating or regressing. Further disaggregation sub-Saharan Africa. Globally, 8 out of 10 people without
will depend on the availability of data for different improved drinking water live in rural areas.
population subgroups in a given country.
Many of the surveys in the JMP database can also
The majority of household surveys and censuses in the be used to generate estimates for major subnational
JMP database already disaggregate urban and rural regions, and this information will be more
populations. While rural coverage of improved drinking systematically extracted in future. As georeferenced
water sources has increased globally, from 62 per cent data become increasingly available, it will also be
in 1990 to 84 per cent in 2015, significant disparities possible to produce estimates for specific geographic
persist between rural and urban areas. Figure 10 shows areas, including informal settlements or slums.
Large gaps remain between urban and rural areas, especially in Oceania
and sub-Saharan Africa
Oceania 50
Sub-Saharan Africa 31
Caucasus and Central Asia 16
Latin America and the Caribbean 14
South-eastern Asia 10
Western Asia 6
Eastern Asia 5
Northern Asia 5
Southern Africa 5
Developed countries 2
0 10 20 30 40 50
Gap in improved coverage in 2015 between urban and rural areas (% pt. urban–rural)
FIGURE 10 Percentage point gap in improved coverage between urban and rural areas in 2015
SAFELY MANAGED DRINKING WATER 19THE 2030 AGENDA FOR DRINKING WATER
Significant disparities remain between the richest and poorest in rural and urban areas
RURAL URBAN
Egypt Uzbekistan
Thailand Egypt
KEY Jordan KEY Viet Nam
richest rural quintile Belize
richest urban quintile Tunisia
Dominican Republic Belize
poorest rural quintile Pakistan
poorest urban quintile Armenia
Armenia Jordan
Kazakhstan Kazakhstan
India Mexico
Uzbekistan Namibia
Nepal Pakistan
Bangladesh Gabon
Comoros India
Namibia Colombia
Tunisia Jamaica
Malawi Iraq
Mexico Thailand
Viet Nam Nepal
Uganda Paraguay
Kyrgyzstan Uganda
Philippines Philippines
Paraguay Burkina Faso
Peru Kyrgyzstan
Republic of Moldova Niger
Jamaica Republic of Moldova
Burundi Congo
Guatemala Ethiopia
Burkina Faso Ghana
Rwanda Comoros
Lao People's Democratic Republic Guatemala
Lesotho Bangladesh
Ghana Bolivia (Plurinational State of)
Mongolia Malawi
Bolivia (Plurinational State of) Lesotho
Cambodia Honduras
Guinea Nicaragua
Côte d'Ivoire Dominican Republic
Zimbabwe Zimbabwe
Iraq Guinea
Colombia Togo
Indonesia Swaziland
Honduras Peru
Gabon Cambodia
Senegal Côte d'Ivoire
Mali Burundi
Central African Republic Mali
Swaziland Senegal
Guinea Bissau Cameroon
Ethiopia Rwanda
Niger Chad
Cameroon Kenya
Kenya Yemen
Nicaragua Central African Republic
Nigeria Haiti
Chad United Republic of Tanzania
United Republic of Tanzania Zambia
Haiti Angola
Yemen Indonesia
Mozambique Lao People's Democratic Republic
Togo Nigeria
Zambia Sierra Leone
Sierra Leone Democratic Republic of the Congo
Democratic Republic of the Congo Guinea-Bissau
Madagascar Madagascar
Congo Mongolia
Angola Mozambique
0 20 40 60 80 100 0 20 40 60 80 100
FIGURE 11 Use of improved sources by richest and poorest wealth quintiles, in rural and urban areas (%)
20 JMP THEMATIC REPORT ON DRINKING WATER 2016The JMP has calculated rural and urban wealth countries have gaps of at least 10 percentage points
quintiles based on an analysis of household assets. between the poorest and richest urban quintiles.
Some surveys collect household-level information
on income and expenditure, but this is typically only The JMP task force on inequalities16 identified a
done in surveys focusing on economic indicators. In number of other priorities for future disaggregation
contrast, information on asset ownership is relatively of WASH data, including by individual characteristics
easy to collect and is included in nearly all Multiple such as sex, age and disability, and by groups
Indicator Cluster Surveys (MICS) and Demographic and disadvantaged on the basis of ethnicity, race, religion,
Health Surveys (DHS). Figure 11 shows the difference caste, migratory status or other characteristics. The
in coverage between the richest and poorest 20 per task force also recommended focusing on disparities
cent of the population in rural and urban areas. Of the in access to WASH in institutional settings and
66 countries with data available for 2012, 50 countries collaborating with other sectors to examine links
have gaps of at least 10 percentage points between to inequalities in nutrition, health and education
the poorest and richest rural quintiles, and 33 outcomes.
16 See WHO/UNICEF Joint Monitoring Programme for Water Supply and Sanitation, ‘Report: Task Force on Monitoring Inequalities for the 2030 Sustainable
Development Agenda’, .
SAFELY MANAGED DRINKING WATER 21THE 2030 AGENDA FOR DRINKING WATER
2.5 Affordability of drinking water services
SDG target 6.1 aims for universal access to affordable assessment of consumption across 100 countries.19 One
drinking water. Human rights to water and sanitation commonly used approach is to calculate the amount spent
place obligations to ensure affordable services and on water in relation to a household’s total consumption
access for all. Payments for WASH services should not (the sum of all expenditures). For example, Figure 12
prevent individuals from acquiring other services and shows the proportion of annual household expenditure
goods protected by human rights such as food, housing, spent on water services. It shows that in some countries,
health, clothing and education.17 Many countries have the majority of households recorded no payments, while
established independent regulators for the water sector, in others many households spent over 5 per cent of their
whose mandate includes oversight of water charges and annual expenditure on water services.
examination of their affordability.
A further advantage of using data from household income
Monitoring affordability presents many challenges, and expenditure surveys is the ability to link information
given the diversity of water services and payment about costs to household characteristics, including
structures – ranging from user contributions towards the household’s main source of drinking water. This
household connections or construction and maintenance is illustrated in Figure 13, which shows that in United
of communal water points, and from payments at water Republic of Tanzania, users of delivered water are most
kiosks to monthly service bills. While some countries likely to pay over 5 per cent of their annual expenditure.
benchmark tariffs against household incomes, there is
currently no internationally agreed-upon benchmark for A general challenge with survey data is the tendency to
affordability.18 underreport unaffordability when the survey does not
capture all costs to the user. Fluctuations in income and
Several sources of information can be used to assess costs can also mean that yearly or monthly averages
the costs of water services. Tariffs and connection fees do not adequately reflect financial barriers. While
can be collected from utilities, but these typically only information is usually available on regular payments,
cover populations that are connected to the piped surveys rarely include categories for construction
network. Studies have estimated the life-cycle costs or capital maintenance, and packaged water is not
of community supplies, but unit costs vary according always reported separately from other beverages.
to context. The JMP focuses on household income and The JMP plans to develop guidance on questions to
expenditure surveys, which have the advantages of include in income and expenditure surveys, with a
being representative at a national level and providing view to strengthening the collection of information
information on both payments for services and total on the costs associated with water, sanitation and
annual consumption. hygiene. As more and better data become available,
the JMP will benchmark expenditures between and
In collaboration with the World Bank, the JMP has been within countries and facilitate dialogue among WASH
exploring several approaches that could be used for global sector stakeholders on how to define and measure
monitoring of WASH expenditure, building on a detailed ‘affordability’.
17 United Nations General Assembly, ‘Report of the Special Rapporteur on the human right to safe drinking water and sanitation’, A/HRC/30/39, 5 August 2015,
.
18 See Hutton (2012)http://www.wssinfo.org/fileadmin/user_upload/resources/END-WASH-Affordability-Review.pdf
19 See IHSN food consumption project: .
22 JMP THEMATIC REPORT ON DRINKING WATER 2016Expenditure on water services varies widely between countries
Bhutan, 2012 75 25
Zimbabwe, 2010 73 18 4 212
Haiti, 2012 70 17 5 3 2 3
Cambodia, 2012 65 28 5 11
Ghana, 2012 65 25 4 3 12
Rwanda, 2010 60 29 5 3 12
United Republic of 58 19 6 4 3 10
Tanzania, 2011
Nepal, 2010 41 51 3 11 3
Colombia, 2010 26 38 15 9 5 7
Mexico, 2012 25 61 8 3 12
Peru, 2010 22 59 9 4 2 4
0 20 40 60 80 100
Proportion of population by level of expenditure on water services as a % of total expenditure, 2010-2012
No payment recorded Up to 2% 2-3% 3-4% 4-5% Over 5%
FIGURE 12 Proportion of household expenditure on water services, by country (%)
In Tanzania, households using tanker/vendor water are most likely to spend over
5 per cent of their annual budget
Surface water 86 7 2 11 3
Unprotected well 71 6 4 3 3 13
Protected wells 69 10 5 4 2 10
Public standpipe 50 24 8 5 3 10
Piped water on premises 18 45 12 8 6 11
Tanker/vendor water 16 22 12 8 10 32
National 58 19 6 4 3 10
Urban 35 26 10 7 6 16
Rural 73 12 3 3 2 7
0 20 40 60 80 100
Proportion of population by level of expenditure on water services as a % of total expenditure,
United Republic of Tanzania 2011
No payment recorded Up to 2% 2-3% 3-4% 4-5% Over 5%
FIGURE 13 Proportion of household expenditure on water services, by source type and residence (%)
Source: Tanzania HBS 2011-2012
SAFELY MANAGED DRINKING WATER 23SAFELY MANAGED DRINKING WATER
3 Elements of
safely managed
drinking water
services
In this section, examples are presented of
available data on the new elements that contribute
to the indicator of safely managed drinking water
services – namely, accessibility, availability and
quality. For each of these elements, data might be
available from household surveys and censuses
or from administrative sources such as drinking
water regulators. The examples provided illustrate
the types of data inputs the JMP will use to
calculate estimates of safely managed drinking
water services during the SDG era.
SAFELY MANAGED DRINKING WATER 25
25ELEMENTS OF SAFELY MANAGED DRINKING WATER SERVICES
3.1 Accessibility
Accessibility will be a criterion for both ‘basic’ and required to travel to the water source, queue
‘safely managed’ drinking water services. The JMP if necessary, fill containers, and return to the
will use a travel time indicator for accessibility household. While self-reported journey times are
that is routinely collected in national household not always precise, they nevertheless provide a
surveys and censuses. Typically, survey teams useful indicator of the relative time burden of
ask respondents to estimate the amount of time water collection.
Water collection is a major burden in many countries, especially in sub-Saharan Africa
On premises Less than 30 minutes 30 minutes to an hour Over an hour
Latin America Caucasus and Eastern Northern South-eastern
and the Caribbean Central Asia Developed countries Asia Africa Oceania Asia
100
80
60
40
20
0
Costa Rica
Saint Lucia
Belize
Colombia
Suriname
Guyana
Cuba
Bolivia (Plurinational State of)
Jamaica
Honduras
Dominican Republic
Peru
Haiti
Armenia
Kazakhstan
Georgia
Azerbaijan
Kyrgyzstan
Uzbekistan
Tajikistan
Serbia
The former Yugoslav
Republic of Macedonia
Montenegro
Ukraine
Belarus
Bosnia and Herzegovina
Albania
Mongolia
Egypt
Tunisia
Algeria
Vanuatu
Viet Nam
Philippines
Lao People's Democratic Republic
Indonesia
Timor-Leste
Myanmar
Maldives
Bhutan
Pakistan
FIGURE 14 Time taken per trip to collect drinking water, by country (minutes)
26 JMP THEMATIC REPORT ON DRINKING WATER 2016Household survey data show that in most countries, proportion of people report spending over 30 minutes,
the majority of the population report either having with the yellow and orange bars on the graph showing
water on premises or spending less than 30 minutes the proportion spending 30 minutes to one hour, or
collecting drinking water, thereby meeting the criteria over an hour, per trip to collect water. If the water
for ‘basic’ service (Figure 14). But in some countries, source is improved, people living in these households
especially in sub-Saharan Africa, a significant will be classified as having ‘limited’ service.
Western
Southern Asia Sub-Saharan Africa Asia
Timor-Leste
Myanmar
Maldives
Bhutan
Pakistan
Bangladesh
Nepal
India
Afghanistan
Djibouti
Comoros
Gabon
Senegal
Namibia
Mauritania
Cote d'Ivoire
Swaziland
Zimbabwe
Mali
Congo
Benin
Malawi
Kenya
Ghana
Sao Tome and Principe
Togo
Guinea
Zambia
Nigeria
Lesotho
Chad
Democratic Republic of the Congo
Cameroon
Mozambique
Madagascar
Somalia
Sierra Leone
Central African Republic
Niger
Burkina Faso
Uganda
Ethiopia
United Republic of Tanzania
Liberia
Burundi
Turkey
Syrian Arab Republic
Yemen
SAFELY MANAGED DRINKING WATER 27ELEMENTS OF SAFELY MANAGED DRINKING WATER SERVICES
In some countries, most of the sources people use are located on premises, including
piped water, boreholes, rainwater and protected wells and springs
All water sources 94
Surface water 27
Unprotected spring 34
Unprotected well 88
Protected spring 81
Protected well 94
Rainwater collection 97
Borehole 98
Piped water 100
0 20 40 60 80 100
Proportion of population using drinking water sources located on premises, by type (%)
FIGURE 15 Location of drinking water sources in Viet Nam in 2014, by type (%)
Source: Viet Nam MICS 2014
Drinking water sources located on premises are usually has a source located on premises, whereas
not limited to piped water but include a wide range protected dug wells and springs are equally likely to be
of improved and unimproved source types. In Viet found off premises. Unprotected sources and surface
Nam, for example, a large proportion of unprotected water sources are usually not on premises.
wells and springs are located on premises and could
potentially be upgraded to improved facilities at Overall, improved drinking water sources are more
relatively low cost (Figure 15). likely to be located on premises, while collection from
unimproved sources is more likely to take more than 30
Figure 16 shows the proportion of different water minutes (Figures 17 and 18). In Sudan, for example, 41
supply types that are located on premises, for selected per cent of households using improved sources access
countries. Piped water is almost exclusively on premises those sources on premises, compared with just 1 per
in many countries, but in Malawi, Nepal, and Sao Tome cent of those using unimproved sources. Of households
and Principe, people must often travel to collect water using improved sources, 17 per cent report spending
from public taps. In most of the countries shown, the over 30 minutes collecting water, compared with
population using rainwater and boreholes or tubewells 52 per cent of those using unimproved sources.
28 JMP THEMATIC REPORT ON DRINKING WATER 2016Malawi 40
Nepal 58
Kyrgyzstan 71
Mongolia 73
Zimbabwe 82
Sudan 88
Bangladesh 92
Cuba 98
Panama 98
Serbia 98
Viet Nam 100
West Bank and Gaza 100
Use of water sources located on premises varies widely by
Montenegro 100
0 20 40 60 80 100
source type and between countries
Piped water Boreholes
Sao Tome and Principe 33 Malawi 5
Malawi 40
Zimbabwe 5
Nepal 58
71 Mongolia 6
Kyrgyzstan
Mongolia 73 Kyrgyzstan 53
Zimbabwe 82
Serbia 68
Sudan 88
Bangladesh 92 Bangladesh 74
Cuba 98
Nepal 84
Panama 98
Serbia 98 Panama 87
Viet Nam 100 Montenegro 91
West Bank and Gaza 100
100 Viet Nam 98
Montenegro
0 20 40 60 80 100 0 20 40 60 80 100
Rainwater Unprotected wells and springs
Boreholes
Sudan Sudan 0
4
Malawi 5
Sao Tome and Principe 4
Zimbabwe
Mongolia 56 Kyrgyzstan 7
Mongolia 6 Nepal
Montenegro 9
88
Kyrgyzstan 53 Malawi 9
Bangladesh
Serbia 68 92 Mongolia 10
Bangladesh 74 Bangladesh 18
Viet Nam 97
Nepal Zimbabwe 18
84
Panama 100 Cuba 30
Panama 87
Panama 44
Montenegro
West Bank and Gaza 91
100 Viet Nam 69
Viet Nam 0 20 40 60 80 98
100 0 20 40 60 80 100
0 20 40 60 80 100
Protected dug wells and springs Surface water
Sao Tome and Principe 3 Mongolia 1
Sudan 3
Zimbabwe 1
Malawi 27
Nepal 34 Nepal 2
Mongolia 35 Malawi 5
Zimbabwe 42
Bangladesh 48 Sao Tome and Principe 5
Serbia 52 Cuba 11
Kyrgyzstan 58
Kyrgyzstan 12
Panama 65
Cuba 67 Panama 24
Montenegro 73 Bangladesh 26
Viet Nam 91
West Bank and Gaza Viet Nam 27
97
0 20 40 60 80 100 0 20 40 60 80 100
FIGURE 16 Proportion of population using a drinking water source on premises, by type of drinking water source (%)
Source: 15 MICS surveys, 2012–2014
SAFELY MANAGED DRINKING WATER 29ELEMENTS OF SAFELY MANAGED DRINKING WATER SERVICES
Improved drinking water sources are Collecting water from unimproved
more likely to be on premises than drinking water sources is more likely
unimproved sources to take over 30 minutes
100 100
80 80
Improved sources
more likely to be
on premises
Improved sources
Improved sources
60 60
Unimproved sources
40 40
more likely to be
over 30 minutes
roundtrip collection
20 20 time
0 0
0 20 40 60 80 100 0 20 40 60 80 100
Unimproved sources Unimproved sources
Population with improved and Population with improved and
FIGURE 17 unimproved sources on premises, FIGURE 18 unimproved sources over 30 minutes
by country roundtrip by country
Source: 41 MICS and DHS surveys, 2010–2015 Source: 41 MICS and DHS surveys, 2010–2015
Women and girls are responsible When drinking water sources are not located on
for water collection in 8 out of 10 premises, households must spend time and energy
households with water off premises collecting water. However, the burden of water collection
is far from evenly distributed among household
members. Figure 19 is based on the JMP’s analysis of
Men MICS and DHS data for the Women’s World Report in
Boys 16.6%
2.9% 2015, and clearly shows that the burden of hauling
Girls
water falls disproportionately on women. In 53 out
6.9%
Women of 73 countries, over half of households with water
73.5% off premises rely on women to collect water. In a few
countries (e.g., Mongolia), men are primarily responsible,
and in 14 countries, the burden also falls on children,
with a boy or girl under 15 primarily responsible in at
least 1 in 10 households.
Person primarily responsible for
FIGURE 19 water collection across 61 countries
Note: 61 DHS and MICS surveys, weighted by
the population with water off premises
30 JMP THEMATIC REPORT ON DRINKING WATER 2016In most countries, the burden of water collection falls mainly on women
5 South Sudan 90
7 Mozambique 84
8 Burkina Faso 81
6 Malawi 84
3 Guinea-Bissau 72
14 Central African Republic 76
8 Zambia 69
9 Democratic Republic of the Congo 75
7 Chad 71
12 Ethiopia 76
17 Burundi 78
15 Madagascar 69
20 Liberia 69
24 Somalia 61
12 Togo 61
26 Niger 65
17 Lesotho 61
20 Sierra Leone 66
3 Nepal 56
16 Sao Tome and Principe 59
9 Zimbabwe 54
5 Gambia 53
11 Kenya 53
9 Benin 56
17 Myanmar 48
8 Tajikistan 47
16 Ghana 49
4 Mali 60
7 India 42
3 Côte d'Ivoire 42
21 Mauritania 41
31 Cameroon 48
9 Timor-Leste 44
9 Yemen 42
31 Nigeria 42
5 Senegal 34
11 Swaziland 34
17 Vanuatu 34
13 Namibia 32
7 Lao People's Democratic Republic 27
50 Mongolia 26
16 Uzbekistan 25
29 Afghanistan 29
5 Azerbaijan 19
16 Republic of Moldova 16
2 Djibouti 15
7 Peru 14
8 Indonesia 14
8 Georgia 13
6 Albania 8
4 Honduras 8
12 Kazakhstan 5
7 Jamaica 4
Boys Men 10 Syrian Arab Republic 3 Women Girls
8 Cuba 2
100 80 60 40 20 0 0 20 40 60 80 100
FIGURE 20 Primary responsibility for water collection in rural areas, by gender and age (%)
Note: Restricted to countries where at least 1 in 10 households have water off premises
SAFELY MANAGED DRINKING WATER 31ELEMENTS OF SAFELY MANAGED DRINKING WATER SERVICES
BOX 3
Use of multiple sources at home
Most national surveys and censuses only collect information about the main source of drinking water used by household
members. However, it is well known that households often use multiple sources. This may be due to problems with the
main source at certain times of the year, or a matter of convenience, or preference for other sources. Secondary sources
may provide a higher or lower level of service, and can be an important way to ensure access to sufficient quantities of
water throughout the year.
Use of multiple water sources is common in many parts of the world, as illustrated by in-depth surveys that have examined
water use in several countries. For example, the 69th round of the Indian National Sample Survey in 2012 found that one
in four households (24 per cent) needed to use a supplementary source. The Performance Monitoring and Accountability
2020 surveys conducted in Ethiopia and Ghana in 2015 found that around half of households (56 per cent and 58 per cent,
respectively) regularly used only one source of drinking water. Comparatively few households in Ethiopia reported regularly
using more than two water sources (6 per cent), whereas this was over one in four in Ghana (28 per cent). Particularly in
urban Ghana, the widespread use of sachet water contributes to the high number of households reporting use of multiple
sources.
Given the scarcity of national data on secondary sources of water used by household members, with the exception of
those who primarily drink packaged water, the JMP will continue to focus on the main source for the purposes of global
monitoring.
While available data that focus solely on the person Time-use surveys that collect information on water
primarily responsible for water collection may not collection as part of a child labour or household
reflect the full extent of the time burden or its gender chores questionnaire can provide further insights on
dimension, they suggest that the accessibility criterion intra-household inequalities and the share of water
in the SDGs is particularly important for women. collection among household members.
32 JMP THEMATIC REPORT ON DRINKING WATER 20163.2 Availability
Availability is another important criterion for In this section, examples are given from data that
assessing drinking water service levels. The human have been collected to date by national statistical
right to water specifies that water should be agencies, regulators and utilities. In all cases, it is
“available continuously and in a sufficient quantity difficult to quantify the amount of water used by
to meet the requirements of drinking and personal individual households or to benchmark volumes used
hygiene, as well as of further personal and domestic given that these vary considerably between settings
uses, such as cooking and food preparation, dish and throughout the year. For the purpose of SDG
and laundry washing and cleaning. […] Supply needs monitoring, the JMP will therefore focus on the amount
to be continuous enough to allow for the collection of time when water is available, rather than quantity of
of sufficient amounts to satisfy all needs, without water delivered, using two main types of data.
compromising the quality of water.”20
Where possible, the JMP will use household responses to
While drinking water should be available in sufficient questions on availability of drinking water when needed in
quantities at all times, such levels of service are nationally representative surveys or censuses. Households
unlikely to be attained by all countries in the short reporting not having sufficient water available when need-
term. Where services are unreliable or intermittent, ed during the last week or month would be categorized as
households typically store water to ensure that it is ‘not available when needed’. This indicator would capture
available when needed. Households may also restrict problems caused by non-functioning water points.
their water consumption when water sources are far
away, available only for a few hours a day or at certain In the absence of such data from surveys or censuses,
times of the year, or out of service. the JMP will use data from regulators or utilities on
the number of hours of service per day, usually only
A number of very different concepts can be used to for piped networks. Regulators may specify different
measure availability. These include the quantity of thresholds for different types of utilities – for example,
water available or used in a given time period, the in Kenya, utilities serving over 100,000 people are
hours of service per day (typically for piped supplies), expected to provide water for at least 20 hours per
or the frequency of breakdowns and the time required day, while smaller utilities should provide at least 12
for repairs (typically for point sources such as hours per day.21 Where national or locally relevant
boreholes). standards for hours of service are not available, a
minimum of 12 hours per day will be used as the
Piped systems that are not continually pressurized global benchmark for ‘available when needed’.
are more vulnerable to microbiological contamination
in the distribution network, so a system meeting Further research is required to compare the different
the availability requirement might fail the quality measures of availability, but a key advantage of
requirement. However, for the purposes of monitoring household surveys and censuses is that information
target 6.1, quality will be addressed directly and is available at a household level, which facilitates
separately from availability. analysis of inequalities across the population.
20 United Nations General Assembly, Report of the independent expert on the issue of human rights obligations related to access to safe drinking water and
sanitation, Catarina de Albuquerque on 1 July 2010: A/HRC/15/31/Add.1’, .
21 WASREB, 2015. IMPACT: A performance review of Kenya’s water services sector 2013-2014. Water Services Regulatory Board, Nairobi, Kenya.
SAFELY MANAGED DRINKING WATER 33You can also read