Demand Analysis and Tactical Deployment of Ambulance Services in the HSE North-West Area
←
→
Page content transcription
If your browser does not render page correctly, please read the page content below
Demand Analysis and
                                                                                                                                                           Tactical Deployment of
                                                                                                                                                             Ambulance Services

                                                               Demand Analysis and Tactical Deployment of Ambulance Services in the HSE North-West Area.
                                                                                                                                                                    in the
                                                                                                                                                            HSE North-West Area

                                                               December 2006

Comhairle Chúram Éigeandála Reamhospidéil
Abbey Moat House,                            T: (045) 882042
Abbey Street,                                F: (045) 882089
Naas, Co. Kildare             www.phecc.ie   info@phecc.ie                                                                                                      December 2006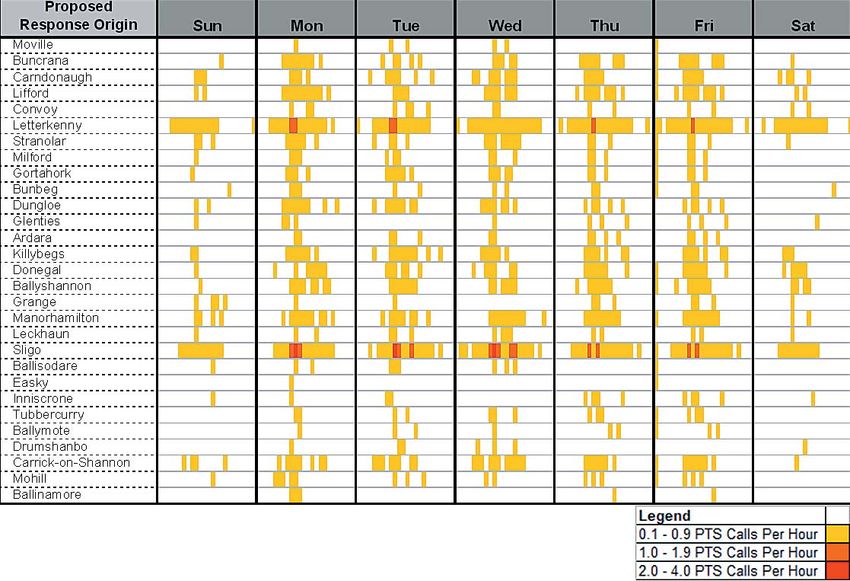
DEMAND ANALYSIS AND TACTICAL
      DEPLOYMENT OF AMBULANCE SERVICES
                 IN THE HSE
            NORTH-WESTERN AREA

                          A report for the
           Pre-Hospital Emergency Care Council
         & the Ambulance Service HSE NW Area

         Feidhmeannacht na Seirbhíse Sláinte
         Health Service Executive

                                                                        Produced by:
                                               Spatial Planning Solutions Ltd (Cork)
                                                          Active Solutions Ltd (U.K.)

December 2006
Published by:
                        Pre-Hospital Emergency Care Council
                                Abbey Moat House
                                    Abbey Street
                                        Naas
                                     Co. Kildare
                                       Ireland

                                      www.phecc.ie

                        © Pre-Hospital Emergency Care Council, 2006

All rights reserved. Any part of this publication may be reproduced for educational purposes
 and quality improvement programmes subject to the inclusion of an acknowledgement of
                   the source. It may not be used for commercial purposes.

                                   ISBN 0-9549645-3-5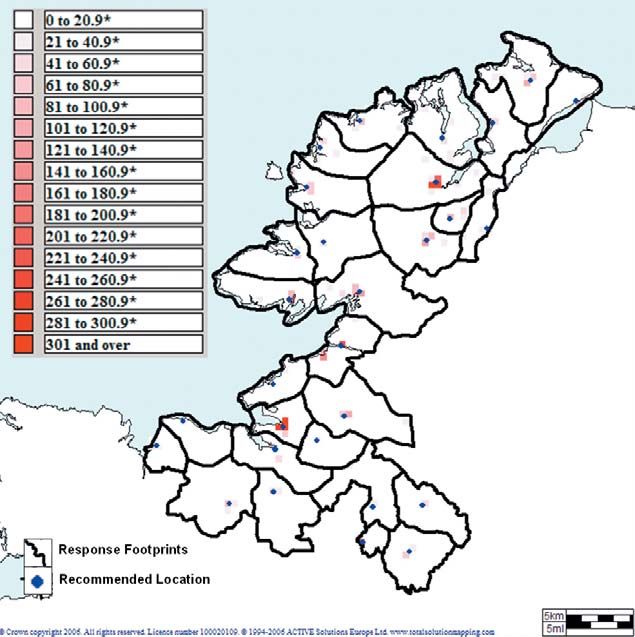
TABLE OF CONTENTS

1. Introduction and Background . . . . . . . . . . . . . . . . . . . . . . . . . . . 3
     Project Aims . . . . . . . . . . . . . . . . . . . . . . . . . . . . . . . . . . . . . . . . . . . . . . .3
     Team Approach . . . . . . . . . . . . . . . . . . . . . . . . . . . . . . . . . . . . . . . . . . . . .3
     Study Period and Data Collection . . . . . . . . . . . . . . . . . . . . . . . . . . . . . . .3
     Report Structure . . . . . . . . . . . . . . . . . . . . . . . . . . . . . . . . . . . . . . . . . . .4
     Acknowledgments . . . . . . . . . . . . . . . . . . . . . . . . . . . . . . . . . . . . . . . . . . .4

2. Emergency & Urgent Incident Demand Analysis . . . . . . . . . . . . . 5
     2.1       AS1 & AS2 Data Description . . . . . . . . . . . . . . . . . . . . . . . . . . . . .5
     2.2       Temporal Variability . . . . . . . . . . . . . . . . . . . . . . . . . . . . . . . . . . . .6
     2.2.1 Monthly Variation . . . . . . . . . . . . . . . . . . . . . . . . . . . . . . . . . . . . . . . . . . . . .6
     2.2.2 Weekly Variation . . . . . . . . . . . . . . . . . . . . . . . . . . . . . . . . . . . . . . . . . . . . . .7
     2.2.3 Daily Variation . . . . . . . . . . . . . . . . . . . . . . . . . . . . . . . . . . . . . . . . . . . . . . . .8
     2.2.4 Temporal Variation Findings . . . . . . . . . . . . . . . . . . . . . . . . . . . . . . . . . . . .9
     2.3       Call Source for AS1 & AS2 Incidents . . . . . . . . . . . . . . . . . . . . . . .9
     2.4       Incident Types . . . . . . . . . . . . . . . . . . . . . . . . . . . . . . . . . . . . . . . .12
     2.5       Spatial Analysis of AS1 & AS2 Incidents . . . . . . . . . . . . . . . . . . .12
     2.4.1 Analysis Framework . . . . . . . . . . . . . . . . . . . . . . . . . . . . . . . . . . . . . . . . . .12
     2.4.2 Spatial Distribution . . . . . . . . . . . . . . . . . . . . . . . . . . . . . . . . . . . . . . . . . .16

3. Patient Transport Services (PTS) Demand Analysis . . . . . . . . . . 19
     3.1       PTS Data Description . . . . . . . . . . . . . . . . . . . . . . . . . . . . . . . . . .19
     3.2       Temporal Analysis . . . . . . . . . . . . . . . . . . . . . . . . . . . . . . . . . . . . .20
     3.2.1 Weekly Variation . . . . . . . . . . . . . . . . . . . . . . . . . . . . . . . . . . . . . . . . . . . . .20
     3.2.2 Daily Variation . . . . . . . . . . . . . . . . . . . . . . . . . . . . . . . . . . . . . . . . . . . . . . .21
     3.3       Patient Type & Activity Description . . . . . . . . . . . . . . . . . . . . . . .21
     3.4       Spatial Patterns of PTS Activity . . . . . . . . . . . . . . . . . . . . . . . . . .23

4. Performance Analysis . . . . . . . . . . . . . . . . . . . . . . . . . . . . . . . . . . 27
     4.1       Performance Standards . . . . . . . . . . . . . . . . . . . . . . . . . . . . . . . .27
     4.2       Response Times in North West Area . . . . . . . . . . . . . . . . . . . . . .28
     4.2.1 Response Time - 8 Minutes . . . . . . . . . . . . . . . . . . . . . . . . . . . . . . . . . . . .28
     2.2.2 Response Time - 14 and 19 Minutes . . . . . . . . . . . . . . . . . . . . . . . . . . . .29
     2.2.3 Response Time – 25 Minutes . . . . . . . . . . . . . . . . . . . . . . . . . . . . . . . . . . .30

5. Tactical Deployment Planning (TDP) and Resource Assessment . .31
     5.1       Description of Goals of TDP . . . . . . . . . . . . . . . . . . . . . . . . . . . . .31
     5.1.1 Objectives . . . . . . . . . . . . . . . . . . . . . . . . . . . . . . . . . . . . . . . . . . . . . . . . . .31
     5.1.2 Outline of Software Systems . . . . . . . . . . . . . . . . . . . . . . . . . . . . . . . . . . .31
                                                             1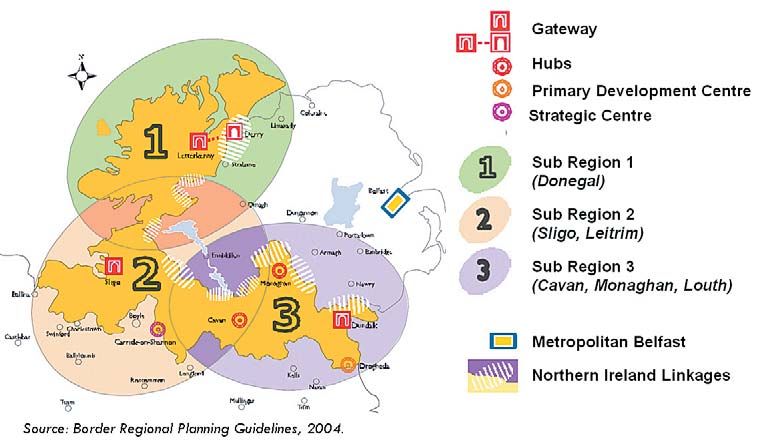
5.2       TDP - Steps in Creation . . . . . . . . . . . . . . . . . . . . . . . . . . . . . . . .32
    5.2.1 Identify Best Vehicle Positions and Compare with Existing Stations . .32
    5.2.3 Response Footprint Formation . . . . . . . . . . . . . . . . . . . . . . . . . . . . . . . . .33
    5.2.4 Tactical Deployment Plan . . . . . . . . . . . . . . . . . . . . . . . . . . . . . . . . . . . . .34
    5.3       Current Resource and Performance . . . . . . . . . . . . . . . . . . . . . . .35
    5.3.1 Resource Availability . . . . . . . . . . . . . . . . . . . . . . . . . . . . . . . . . . . . . . . . .35
    5.3.2 Work Load . . . . . . . . . . . . . . . . . . . . . . . . . . . . . . . . . . . . . . . . . . . . . . . . . .35
    5.4       Impact of PTS Work load . . . . . . . . . . . . . . . . . . . . . . . . . . . . . . .39
    5.5       Tactical Deployment Plan Impact Analysis . . . . . . . . . . . . . . . . . .41
    5.5.1 Scenario 1 . . . . . . . . . . . . . . . . . . . . . . . . . . . . . . . . . . . . . . . . . . . . . . . . . .41
    5.5.2 Scenario 2 . . . . . . . . . . . . . . . . . . . . . . . . . . . . . . . . . . . . . . . . . . . . . . . . . .41
    5.5.3 Scenario 3 . . . . . . . . . . . . . . . . . . . . . . . . . . . . . . . . . . . . . . . . . . . . . . . . . .41
    5.5.4 Performance Forecasts . . . . . . . . . . . . . . . . . . . . . . . . . . . . . . . . . . . . . . . .41
    5.5.5 Summary . . . . . . . . . . . . . . . . . . . . . . . . . . . . . . . . . . . . . . . . . . . . . . . . . . .41
    5.6       Impact of Additional Vehicles . . . . . . . . . . . . . . . . . . . . . . . . . . .42
    5.6.1 Summary . . . . . . . . . . . . . . . . . . . . . . . . . . . . . . . . . . . . . . . . . . . . . . . . . . .42
    5.7       Continuous Improvement . . . . . . . . . . . . . . . . . . . . . . . . . . . . . . .42
    5.7.1 Current Situation . . . . . . . . . . . . . . . . . . . . . . . . . . . . . . . . . . . . .42
    5.7.2 Next Steps . . . . . . . . . . . . . . . . . . . . . . . . . . . . . . . . . . . . . . . . . .43

6. Demographic Trends and Service Hierarchy Implications . . . . . .45
    6.1       Demographic Trends . . . . . . . . . . . . . . . . . . . . . . . . . . . . . . . . . . .45
    6.2       Infrastructure . . . . . . . . . . . . . . . . . . . . . . . . . . . . . . . . . . . . . . . .47
    6.3       Implications for Ambulance Services and Service Hierarchy . . . .47
    6.4       Service Hierarchy . . . . . . . . . . . . . . . . . . . . . . . . . . . . . . . . . . . . .48

7. Findings, Conclusions & Recommendations . . . . . . . . . . . . . . . . .51
    7.1       Demand Analysis Findings . . . . . . . . . . . . . . . . . . . . . . . . . . . . . .51
    7.2       Performance Findings . . . . . . . . . . . . . . . . . . . . . . . . . . . . . . . . . .53
    7.3       Tactical Deployment Plan Findings . . . . . . . . . . . . . . . . . . . . . . . .54
    7.4       Demographic Trends and Service Hierarchy . . . . . . . . . . . . . . . . .54
    7.5       Conclusions & Recommendations . . . . . . . . . . . . . . . . . . . . . . . . .55

Appendix 1.        Data Capture (Technical Report) . . . . . . . . . . . . . . . . . . . . . .59
Appendix 2         Response Origins . . . . . . . . . . . . . . . . . . . . . . . . . . . . . . . . . . .63
Appendix 3         Cross Tabulation
                   – Incident Types with Patient Type by Pick-up Location . . . .65

                                                            2
1. INTRODUCTION AND BACKGROUND
This project was initiated by the Chief Ambulance Officer of the HSE North West Area in December 2004, and was
funded by the Pre-Hospital Emergency Care Council. The study is the first of its kind in the Republic of Ireland
in that it utilises detailed Ambulance service records to firstly, assess both demand for and past performance of
Ambulance emergency care. And secondly; make recommendations on how the spatial configuration of services
may be improved to achieve enhanced Ambulance services in the area. Current and future trends are also
examined.

The project has two parallel functions; firstly to provide recommendations on the spatial configuration of
Ambulance resources in the HSE NW Area based on results from demand and performance analysis; and secondly,
to provide a research template for data issues and techniques that can be utilised throughout Ireland to assess
Ambulance service performance and deployment options.

Project Aims
To achieve the above, a set of project aims were developed, these are;
  i) To analyse the spatial and temporal patterns of Ambulance activity (Emergency, Urgent & Patient transport)
       and make an assessment of emergency care demand for the HSE North West Area.
  ii) To explore spatial options required to produce a Tactical Deployment Plan (TDP) that will improve response
       times for emergency patients.
  iii) To communicate the optimum deployment plan and enable query by day or hour in relation to current
       configuration of services.
  iv) To examine the sensitivity of the TDP in respect of current trends – taking into account population trends,
       development planning and road changes.
  v) Consider on the implications of service hierarchy that will make optimum deployment of possible Advanced
       Paramedic services, standard EMT/Paramedic services and Community Responder/Co-Responders in the
       context of dynamic deployment within the Tactical Deployment Plan (TDP)

Team Approach
The project has been undertaken by Spatial Planning Solutions (Cork) and Active Solutions (UK). Both companies
have extensive experience in the analysis of Ambulance resources and developing plans for enhanced utilisation
in Ireland, the United Kingdom and USA. A steering committee lead by Dr. Geoff King of the Pre-Hospital
Emergency Care Council guided the contractors through the project. Other members of the steering committee
were Frank McClintock, Assistant Director National Hospitals Office, HSE, Pauric Sheerin, Acting Chief Ambulance
Officer HSE North West Area and Anthony Cummins, Communications Officer HSE North West Area.

In addition to progress meetings with the steering committee an important aspect of this project was the
valuable input and feedback from the Ambulance staff of the region. Two meetings were held in Manorhamilton,
which were open to all Ambulance staff. The initial meeting provided an overview of the project aims and results
of some initial findings. The second meeting, attended by over 30 staff demonstrated how the Tactical
Deployment Plan for the region was developed and presented completed findings.

Study Period and Data Collection
Data for the study was supplied by the Ambulance Service of HSE North West Area and covers the period 1st July
2004 to 30th June 2005. This period was considered appropriate to allow a suitable overview of demand for
Ambulance services to generate the first generation of Tactical Deployment Plan for the region.

                                                       3
Data on Emergency (AS1) and Urgent (AS2) calls for the study period were generated automatically using the
Ambulance service’s Command & Control system, FORTEK. Patient Transport Service information was only
available in a paper format and this was converted into a digital format by the Ambulance service. A number of
data issues arose during the course of the project. A separate report on technical aspects of these is listed in
Appendix 1 of this report.

Report Structure
Detailed findings under various sections are set-out in sections 2 to 6. Section 7 provides an executive summary
of these findings, the study conclusions and a set of recommendations. A separate component of the analysis
concerns data quality issues that arose in the course of the project, these are examined in Appendix 1, which also
includes some recommendations on improving data quality.

Acknowledgments
We would like to acknowledge the support of Dr. Geoff King and the staff in the Pre-Hospital Emergency Care
Council for their support in undertaking this project. Mr Frank McClintock, Assistant Director of the National
Hospitals Office (formerly Chief Ambulance Officer, HSE NW Area) initiated the study and was instrumental in its
direction. We would also like to thank Pauric Sheerin, Acting Chief Ambulance Officer, HSE North West Area and
his staff for their co-operation, valuable advice and support. Finally we would like to acknowledge the input
from Mr. Tony Cummins, HSE NW Ambulance Communications Officer, whose diligence and skills in data
compilation are a pre-requisite for studies of this nature.

                                                        4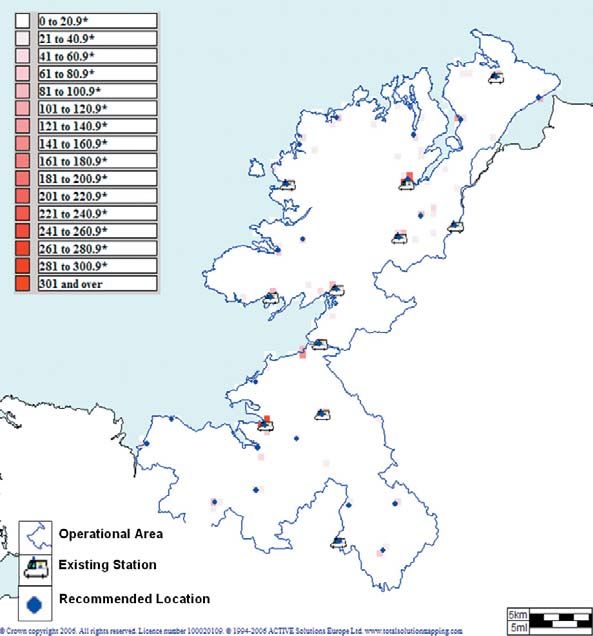
2. EMERGENCY & URGENT INCIDENT DEMAND ANALYSIS
In this section we examine the demand profile of the Emergency Calls (AS1) and Urgent calls (AS2) for the region
during the study period. The demand analysis examines the temporal and spatial variation of demand for
Ambulance services for these types of incidents and also examines the call sources for the incidents. The results
indicate where demand peaks are highest and how demand varies with location. The section provides a baseline
for current activity and helps inform how future service delivery may be enhanced.

2.1 AS1 & AS2 Data Description
The records of AS1 and AS2 incidents were captured digitally within the FORTEK computer aided despatch system
used by the North West Area Ambulance Service. The system operator creates a new record for an incident upon
receipt of a call from either one of a variety of sources including the general public on the 999 call system,
individual GP’s or Hospitals in the region. Basic details of the type of incident are recorded together with the
address, and time of the call. For each viable incident the Ambulance service’s resources are assigned. For some
large incidents more than one resource may be assigned. For some incidents a resource may be assigned from a
station at some distance from the incident, where resources are unavailable at a closer station. If resources
become available at the closer station a resource is assigned from that station and the first resource may be stood
down from the incident. Time stamps are made by the computer system that record the following:

Table 2.1

Computer system issues and operator practice had resulted in inconsistencies in data capture; these issues were
resolved for the study. The specific data quality issues are examined in Appendix 1.

The total number of AS1 and AS2 calls used in the analysis was 10,648, of these there were a number of ‘aborted’
incidents and incidents that took place outside the region. The ‘aborted’ incidents are where the incidents were
stood down; where it was a hoax call; or where it had been merged with another incident. In total there were
1,183 incidents classed as ‘aborted’. These incidents are examined in the temporal analysis, as the project steering
committee suggested that they represent an element of the demand for service. They were excluded from
subsequent analysis concerned with resource performance, as often a resource was not subsequently ‘assigned’
or the resource was ‘stood down’ before it reached the incident scene. In addition to the ‘aborted’ calls, there
were 29 incidents which took place outside the study region; these were handled separately in the resource
analysis but were included in the temporal analysis as they impact on demand variability (see table 2.2).

                                                         5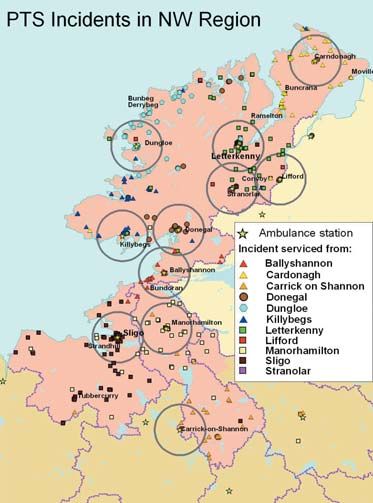
Table 2.2

2.2     Temporal Variability
The demand profile for AS1 and AS2 calls received in the North West Area is examined by month, day of the week
and by hour of the day.

2.2.1 Monthly Variation
The incident call rate for AS1 and AS2 calls for the study period are listed below in table 2.3, average monthly
rates and average daily rates per month are also calculated.

Table 2.3

From all incidents recorded there was an average monthly rate of 627 AS1 calls and 260 AS2 calls. In general
the summer months have higher numbers of incidents than winter months. The month of August had the
highest number of calls, although when this is broken down to a daily average by month it was only slightly
higher than June, the next highest. The high August figures are primarily driven by increased numbers of AS2
calls; given that only one year of data was used in the study it is difficult to attribute reasons for this, however
as indicated below in table 2.4. August also had a higher percentage of ‘aborted’ calls than other months. The
lowest number of calls is in February, and this low rate of calls is also reflected in the monthly daily average
indicating that this low number of calls is not merely a factor of the number of days in the month. Despite the
variability between winter and summer months overall the figures suggest minimal variation between months
and a relatively constant rate of incidents through the year for both AS1 and AS2 calls.
To establish a better idea of demand trends through the year it is necessary to include other years in the analysis;
this was not possible for this study.
                                                         6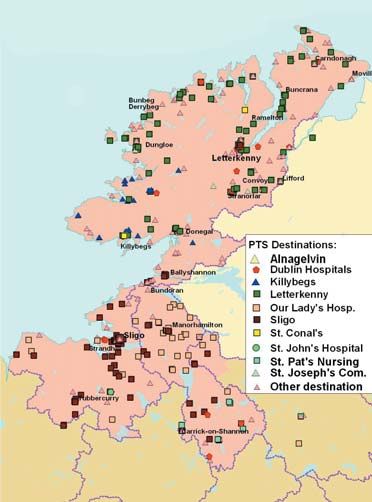
As stated above included in the figures in table 2.3 are the numbers of calls classed as ‘aborts’, table 2.4 below
lists these by month. The average number of calls classed as ‘aborted’ was 99 per month or around 11% of all
incidents. Variability was weighted toward summer time and August had the highest number at 15% of all
incidents in that month. The increased number of ‘aborted’ incidents partly explains the increased incident rates
noted for the summer months above.

Table 2.4

2.2.2 Weekly Variation
The daily rate of AS1 and AS2 incidents shows a distinct de-correlation of activity. The highest daily average AS1
incidents occurred during the weekend (Saturday & Sunday) with around 20 to 23 incidents. The lowest number
of AS2 calls occurred during the weekend, but numbers rose strongly on Mondays. There was a slight dip in the
number of AS2 calls on Wednesdays, and numbers rose again until Fridays (see figure 2.1).

Wednesdays therefore have the lowest total number of incidents with the combined total of AS1 and AS2 dipping
to just over 25 calls.

Figure 2.1
Daily Averages of AS1 and AS2 incidents

                                                        7
2.2.3 Daily Variation
The average number of incidents reaches a peak at around 13.00 hrs each day for both AS1 and AS2 incidents.
There is a steady increase in the number of incidents starting at around 7.00 hrs for AS1 and 8.00 hrs for AS2.
At around 3.00 hrs in the morning there are also relatively high numbers of AS1 incidents, which falls off until
7.00 hrs (see figure 2.2). Both AS1 and AS2 incident rates decrease during the afternoon and evening, with rates
of AS2 incidents falling more sharply.
As already noted there are different numbers of incidents at the weekend compared to weekdays, for this reason
figure 2.3 and figure 2.4 examine incident rates for hours during the Weekend and hours during weekdays
respectively.
Figure 2.2 Average number of incident per hour (all days of week)
Figure 2.3 Average number of incidents per hour (Weekend only)
8Figure 2.4 Average number of incidents per hour (Weekdays only)
A very different pattern of demand is apparent between weekdays and the weekend with firstly, higher rates of
AS1 calls between 0.00hrs and 04.00hrs on Saturday and Sunday mornings occur than during on weekdays;
secondly, higher rates of AS1 calls after 09.00hrs during weekdays than on weekends; and, thirdly, significantly
higher numbers of AS2 calls between 08.00hrs and 16.00hrs on weekdays than during the weekend.
2.2.4 Temporal Variation Findings
A number of salient features emerge from the tables and graphs of temporal demand, these are;
• There is only minor variation on the monthly rates of incidents during the study period and while there
were small increases apparent during the summer months these were relatively small when considered with
the rates of ‘aborted’ incidents during those months.
• Significant variation of demand activity occurred between weekends and weekdays. The weekly profile of
demand demonstrated that AS1 calls increased over weekends but reduced during the week. The AS2 calls
showed highest levels of demand on Mondays and Fridays respectively.
• During the day the highest period of activity in weekdays occurred between 12.00 hrs and 16.00 hrs and
this was principally dictated by the pattern of AS2 calls.
• At weekends highest levels of activity occurred between 00.00hrs and 04.00hrs with AS1 calls dominating
the demand profile.
2.3 Call Source for AS1 & AS2 Incidents
The nature of the demand activity for AS2 activity suggests that it may be a product of management practices
both in Hospitals and GP surgeries. Thus for example “decanting” of patients by hospitals on Fridays may
influence the levels of AS2 activity apparent for Fridays, equally the high levels of AS2 demand around 13.00 hrs
during weekdays may reflect how GP surgeries manage their patients as opposed to inherent need for urgent
transport activity amongst the population as a whole. If patient management practices are influencing the
demand profile there may be opportunities to re-arrange demand profile that can make better use of resources
rather than for example having both the AS1 demand (which management practices should have little influence
on) and AS2 demand peaks occurring at the same time.
To assist this facet of the temporal demand profile we can use the call source information collected by the
9Ambulance controllers when recording incidents. For both AS1 and AS2 the majority of calls (36%) are derived
from the 999 call system, followed by GPs (32%) and Hospitals (11%). These proportions however vary during
the week with higher percentages of 999 calls during the weekend and correspondingly lower numbers of calls
from GPs and Hospitals (see figure 2.5).
Figure 2.5 Call Source by Day
When weekend and weekday services for AS1 and AS2 calls are separated demand differences emerge that
indicate that the majority of AS1 calls are derived from 999 sources with a demand peak at weekends, and that
rates of GP calls diminish at weekends, in particular for AS2 calls. The demand peaks noted above for Mondays
and Fridays for AS2 calls is primarily driven by calls from GPs (see figure 2.6)
Figure 2.6 Call Source by Day, AS1 only and AS2 only
10Figure 2.7 Call source by Hour (Monday to Friday)
Figure 2.8 Call Source by Hour (Saturday & Sunday)
The daily variation in call sources is examined in figures 2.7 and 2.8, where the impact of both GP and Hospital
requests for AS2 services both at weekends and during the week is apparent. There is clear service demand peak
which occurs between 11.00 hrs and 15.00 hrs on weekdays and which is also coinciding with demand peaks
arising from either 999 calls and calls from public lines.
It is beyond the scope of this current study to make recommendations regarding possible opportunities to
influence demand for Ambulance services from hospitals or GP’s. However we do recommend that further
research be conducted to ascertain the nature of service requirements from those services with a view to
identifying what opportunities exist to ‘smooth’ the service demand and thereby ensure that these demand peaks
do not detract from resource availability on both weekly and daily basis.
112.4 Incident Types
The capture of incident types is made within the FORTEK system against a standard set of codes; in table 2.5 the
15 most commonly recorded incident types are listed.
Table 2.5 Record Incident Types
These ‘top 15’ recorded incident types account for 78% of all responded incidents, with Chest Pain (code A101)
being the highest at 12%. The incident types captured within the control system in the North West Area do not
correspond to the incident and patient record system proposed by the Pre-Hospital Emergency Care Council. In
the opinion of the steering committee the methods of capture and classifications of incidents listed for incident
types has little clinical value. In particular the coding system used does not indicate whether incidents were ‘life
threatening’. This has important implications for subsequent analysis concerning response times and the
proposed Tactical Deployment Plan (TDP). Thus results provided in table 2.5 can only be considered as a broad
indicator of the types of incidents that the Ambulance service in the North West Area responds to and additional
recording protocols are required to ensure that this information has clinical value to allow any conclusions to be
drawn from it.
2.5 Spatial Analysis of AS1 & AS2 Incidents
The spatial analysis set out to examine patterns of demand across the region. While the impact of demand on
resources is examined in later sections of the report, this section provides a framework for how different
demands occur between urban and rural locations in the region.
2.5.1 Analysis Framework
To assess the spatial distribution of demand for emergency care a spatial typology was developed. This was based
on the following criteria;
• Main Urban Centres (Sligo and Letterkenny)
• Towns with population in 2002 of over 1,000 persons (these towns have a full listing of census variables
in the CSO Small Area Population Statistics for the region)
• Rural Areas (population density greater then 10 persons per KM2)
12• Sparsely populated areas (population density of less than 10 Persons per KM2).
On the basis of these criteria we map the region as per figure 2.9.
Figure 2.9 Regional Spatial Typology
In population
terms the most current census in 2002 indicated that the entire region had a population of 222,762 persons.
From 1996 to 2002 the population of the region increased by 5% (see table 2.7). A population growth of 11%
from 1996 to 2002 was recorded for towns in the region where in addition to Sligo and Letterkenny there are 15
towns with a population greater than 1,000 persons (see table 2.6). Sligo with the largest population base of
19,735 persons had a population increase of 6.6% from 1996 and Letterkenny with a population of 15,231 in
2002, enjoyed the highest population in the region with a 27% increase in population. The strengthening of the
urban population base in the region corresponds to national trends and has important implications for future
emergency care provision.
13Table 2.6 Urban Population in HSE North West Area
Note: See table 2.7 for rural population
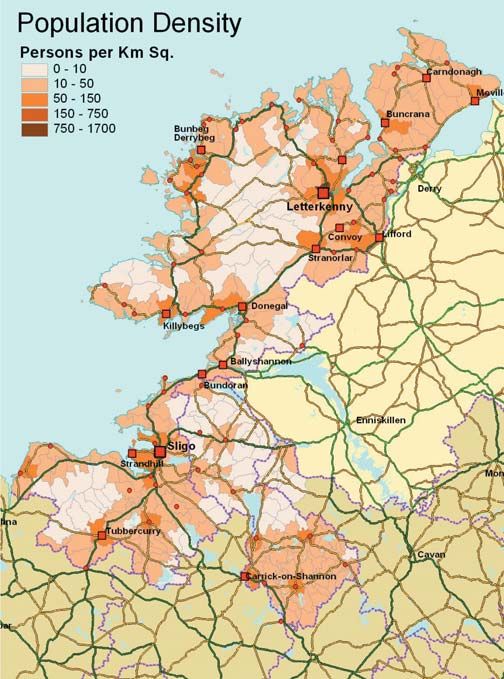
The population density map in figure 2.10 highlights the distribution of population in the region, with four
principal concentrations in the region; around Sligo and south to Tubbercurry; Letterkenny/Carndonagh; the
coastlands from Donegal to Gortahork, and around Carrick-on-Shannon in Leitrim. These areas make up the
main areas classified as rural, while the white areas in the map make up the sparsely populated, low population
areas in the regional typology.
14Figure 2.10 Population Density in the HSE North West Area
152.5.2 Spatial Distribution
Using the geo-codes of incident location the incidents in the study period were mapped against the rural
typology and linked to Census units, Electoral Divisions (EDs), in the region. The results of this exercise are
presented below in table 2.7 which provides aggregations of each category of the area typology by county.
Table 2.7 Incidents (AS1 & AS2) within spatial typology
The results indicate average rates of incidents per head of population, where for the region as a whole there were
4.6 incidents per 100 persons, this is made up of 3.2 AS1 incidents per 100 persons with the residual, 1.4 being
the number of AS2 incidents per 100 persons.
The key feature from this analysis is that rates of AS1 and AS2 per capita are significantly higher in urban areas
compared to rural areas. Thus for example, there were 6.2 AS1 incidents per 100 persons in Sligo town compared
with 2.5 per 100 persons in rural areas. An additional feature of the results is that in sparsely populated areas
rates of incidents are lower than other rural areas.
16It is difficult to be definitive about the causes of this difference in demand for emergency care services between
urban and rural populations, especially since information on incident type does not indicate levels of severity of
a particular incident. Possible reasons for the higher propensity of urban population to avail of Ambulance
services is likely to be related to a variety of factors such as the location of activities that generate higher demand
for emergency services, for example Nightclubs or Nursing homes, or the perception that emergency care are only
used as a last resort in rural areas whereas in urban areas people may be prepared to call the Ambulance service
earlier.
Although the absence of robust information on incident type limits deeper understanding of this aspect of
demand within the context of this study, the fundamental feature of the analysis is that demand for emergency
care services is not simply related to per-capita distribution of population in the region but also to its location
vis-à-vis urban and rural locations. Thus as urban population increases, demand for emergency care will increase
at higher rates than the per-capita increase in population.
1718
3. PATIENT TRANSPORT SERVICES (PTS) DEMAND ANALYSIS

3.1 PTS Data Description
Records of Patient Transport Services for the study period were not available in digital form and required
conversion from paper records (AS3 forms). This was undertaken by staff in the HSE North West Area Ambulance
service using the FORTEK system. The paper records were found to be of inconsistent quality with variation in
how different time stamps were recorded and in the address names used to locate particular incidents. An
exercise undertaken by Spatial Planning Solutions in association with the Ambulance service provided consistent
address points for incidents and modelled relevant time stamps for service activity.

The principal time and location data items available from this exercise were;

Table 3.1

In total 6,451 records were captured for the study period, the total number of PTS incidents where Ambulance
only calls were made and where the base station was identifiable was 6,403 (the remainder being a small number
of taxi records that were included in the data capture exercise). Of these all had Pickup points and Destination
points (provided as address and converted to National grid co-ordinates). Time stamps were also attributable to
these records, using destination time (time of appointment) where appropriate.

In addition to location and temporal data, information on patient type and incident were reported on the AS3
forms. These indicated using yes/no the following;

Table 3.2

Only PTS records that utilised Ambulance resources were converted into a digital format and analysed.
A considerable amount of patient transport services uses private taxi services, these were not included in the
analysis since our concern was primarily on how PTS services impact on resource availability and provision of
resources for AS1 and AS2 services.
                                                       19
3.2 Temporal Analysis
In total there were 6,403 separate PTS incidents during the year of the study period. The breakdown of these by
month is listed below in table 3.3. On average 534 PTS incidents per month or 17.5 per day. Monthly totals were
relatively constant through the year, with only a slight increase in November with 629 PTS incidents. The average
of 17.5 per day was found to have somewhat more variability, with April the lowest at 15.5 PTS incidents and
November the highest at 21 PTS incidents.
Table 3.3
To establish a better idea of demand trends through the year it is necessary to include other years in the analysis,
this was not possible for this study.
3.2.1 Weekly Variation
During the course of a week the number of PTS incidents dropped sharply at weekends and nearly all PTS services
take place on weekdays. Figure 3.1 graphs the weekly incident rates of PTS calls together with AS1 and AS2. The
day with the highest number of calls is
Wednesday with around 25 incidents, but as
can be seen numbers of PTS incidents for
Saturdays and Sundays fall to less than 5.
Figure 3.1
Daily Average of PTS calls per week.
203.2.2 Daily Variation
During weekdays the daily variation of PTS activity displays a very strong peak in mobilisation at 09.00 hrs with
another smaller peak around 13.00 hrs (see figure 3.2).
Figure 3.2
PTS Mobilisation
times for Weekday
& Weekends
The peak in activity reflects the requirements to get patients to hospitals for their appointment times which are
largely between 10.00hrs and 11.00hrs. Earlier at between 05.00hrs and 06.00hrs the increase in activity reflects
the early starting time for transport of patients to, or from Dublin.
During the weekend activity levels diminish considerably but the 09.00 hrs peak is clearly apparent.
3.3 Patient Type & Activity Description
There is only a limited amount of information on patient condition recorded on the AS3 forms associated with
PTS services. Information consistently reported on the AS3 forms primarily concerns the mobility status of PTS
patients. In table 3.4 these are broken down by base station for all incidents. It is clear that the majority of
patients are being classified as ‘requiring a stretcher’, with less than 6% being classed as ‘ambulatory’ and 1%
‘requiring a wheelchair’. The implication from these figures is that most ambulatory are being transported by taxi
services used in PTS activity. Reliance on these figures is difficult however as the data definition of how stretcher
based PTS incidents are determined is unclear from the patients transport records (AS3 forms). As in the case of
AS1 and AS2 incidents information on patient type requires better definition to draw definitive conclusions.
Table 3.4
21Also recorded on the AS3 form is information on the nature of the appointment or the type of PTS trip (see table
3.5). Data is again broken down by base station of the particular resource that undertook the PTS incident. The
majority of PTS incidents undertaken by Ambulances were either Transfers from one hospital to another or they
concerned patient transport for a Day Clinic. While on some AS3 forms the particular hospital department where
patients were being transported to was recorded, the records were incomplete and it was not possible to utilise
this limited information.
Table 3.5
From the amount of Day Clinic transport involved it is possible to suggest that much of this activity will be
known for some time in advance of the requirement to transport patients. This information may be used to plan
in advance when patients are due for clinics and better co-ordinate the use of Ambulance resource to undertake
this and perhaps spread the use of Ambulance resources throughout the day / week and avoid some of the peaks
in emergency resource demand.
Table 3.6 lists the relationship between Incident types and Patient types (mobility status). Of note in this table
are the numbers of Ambulatory patients that were transported on Ambulances for Day Clinics. While this
suggests that not all patients require the use of Ambulances for transport, the absence of better information on
patient condition concerning their movement status and their particular hospital requirements renders it
difficult to make any firm recommendations other than highlight the need for more robust data definitions and
consistent recording of that information.
Table 3.6
For a cross-tabulation of Incident type and patient types by pick-up location see appendix 3.
223.4 Spatial Patterns of PTS Activity
The broad patterns of PTS activity is analysed firstly in relation to the Area Typology utilised above. Table 3.7
identifies the sources or collection points of PTS incidents. Clearly apparent from this table is the strong bias
toward Sligo and Letterkenny. This bias is primarily a function of the majority of pick-ups being from the
Hospitals in Letterkenny and Sligo.
Table 3.7
In addition to pickup locations in the North West Area, 350 PTS incidents had pick-up points outside the region
in Dublin, Galway and parts of Northern Ireland (mostly Altnagelvin Hospital).
The distribution of pick-up locations for PTS incidents is mapped in Figure 3.2, where the base station of each
pick-up point has also been indicated (A) and Destination points (B). The distribution of pick-up points broadly
clusters around respective ambulance Stations, although there are some notable outliers, which may be a
consequence of limited resource availability at a particular time resulting in Ambulances from more distant
stations being assigned to a particular PTS incident. It is important to note however that not all Ambulances
started their journey at their base station as some PTS journeys would be assigned to an Ambulance while in the
course of either returning to a base station or as a multiple PTS activity trip. Information on the location of an
Ambulance when it is assigned is not recorded in the current system configuration. This aspect of the data
collection system is one of the recommendations of this report. Despite this the nesting of most PTS incidents
around respective stations does suggest that most incidents are assigned to Ambulances while located in their
stations.
For some stations, e.g. Killybegs, travel distances to pick-up points are considerably longer than for other stations,
reflecting different geographic catchments.
23Figure 3.2 PTS Incidents in NW Area (Pick-up and Destination)
(a) Pick-up locations by Base (b) Pick-up by Destinations (top 10)
Table 3.8
24Table 3.8 captures the variation of travel distances from base stations to pick-up points and onwards to
destinations. Although the figures in table 3.8 are indicative only, in that distances are based on the straight line
distance from each station to pick-up point and destination point, nonetheless, they provide a useful indicator
of activity levels that takes into account the spatial distribution of demand for PTS services.
Sligo has the lowest total travel distance reflecting the amount of travel between Sligo General Hospital and the
nursing homes and care institutions within or close to Sligo town. A similar pattern can be attributed to
Letterkenny. The higher average ‘destination’ distance or trips from Ambulances stationed in Letterkenny are
partly attributable to the number of trips to Sligo General Hospital. The significantly higher travel distances for
Killybegs, Donegal, Carrick-on-Shannon and Dungloe reflecting the dispersed nature of the population in their
catchment and the extra distances to get to the principal destinations of Sligo and Letterkenny. In total there
were 142 different pick-up points for PTS that used Ambulances, of these 51 locations had only one or two pick-
up incidents.
Letterkenny had the highest number of travel kilometres with 28.4 thousand kilometres followed by Killybegs.
The high level of activity is a function of the greater geographic dispersion of population serviced from
Letterkenny Hospital, as is illustrated by the significantly longer average destination distance compared with the
pick-up distances in Letterkenny.
Trips to Dublin are excluded from the figures in table 3.8, however these trips make up a significant amount of
PTS activity. In total 1000 trips either as pick-up or as destination were made. The stations where Ambulances
were based for these trips is listed below in table 3.9.
Table 3.9
1
In total there were 699 trips from the NW area to Dublin and 301 pick-ups made from Dublin. .
Galway 40 PTS trips from the NW Area and there were 15 Pick-ups made from there.
Ambulances based in Sligo, Lifford, Letterkenny and Stranolar stations make up the majority of the resources
used for Dublin trips (87.4% of all trips). The average Trip distances include the travel distance from station to
pick-up point and onwards to destination. Again these are intended to act as indicators of activity levels and
not as totals for individual mileage of any particular resource or station.
25In total trips to 151 different destinations were made during the study period, the top 15 most frequent
destinations are listed in table 3.10. The most frequent trips are to the general hospitals in Sligo and Letterkenny,
they account for 40.6% of all trip destinations. Following these are trips to Dublin, with 699 trips, or 10.9% of
all trip destinations.
Table 3.10
A number of key features emerge from the spatial distribution of PTS activity levels across the respective base
stations, these are;
• That the Ambulances based in Killybegs, Donegal, Dungloe, Carrick-on-Shannon and Carndonagh have high
activity levels due to their peripheral location and large catchments.
• High levels of activity for Ambulances based in Manorhamilton appear to be related to relief activities for
services from Sligo as opposed to serving local population.
• The majority of PTS activity concerns moving patients either to or from Letterkenny and Sligo.
• Trips to and from Dublin represent a high proportion of PTS activity in the region
264. PERFORMANCE ANALYSIS
4.1 Performance Standards
The Pre-Hospital Emergency Care Council is actively reviewing appropriate performance measurement standards
for the Republic of Ireland. Response time has been the traditional performance indicator of Ambulance service
performance in many jurisdictions. In the past the use of response targets were criticised due to lack on clinical
context. Priority dispatch procedures and closer linking of response targets to clinical outcomes have ensured
that examination of response time continues to be the most frequently used indicator of performance. In this
section we provide an overview of response time results of the Ambulance service in the North West Area, in later
sections we make recommendations on improving these.
Response Time is recognised as the time it takes for an Ambulance to reach the scene of an emergency incident
from receipt of a call. The definition when to start and stop the clock has varied in different jurisdictions. There
is a consensus developing that the start time for assessing response time should be based on the time that an
emergency call is received (call receipt). In the UK the KA34 data standard for Ambulance services defines this
start time as the time whereby details of the callers telephone number, the exact location of the incident and
nature of chief complaint is ascertained. In this section of the study we assess performance of response time as
the elapsed time from this start time to arrival of the first resource to a scene.
A second consideration of the use of Response Time is what are appropriate response times for particular
incidents and to particular locations. In the United Kingdom the Health and Social Care Standards and Planning
Framework (2005/06–2007/08), published by the Department of Health redefines the original 1974 ORCON
standards by targets based on Category ‘A’ incidents and Category ‘B’ incidents. Category ‘A’ incidents clinically
defined as "immediately life threatening" and Category ‘B’ encompasses incidents that are clinically defined as
"not life threatening but still serious". Based on this division the following response targets have been put
forward for all Ambulance Trusts.
• Respond to 75% of ‘Cat A’ calls within 8 minutes
• Respond to 95% of ‘Cat A’ calls within 14 minutes (urban) and 19 minutes (rural)
• Respond to 95% of ‘Cat B’ calls within 14 minutes (urban) and 19 minutes (rural)
(from Health and Social Care Standards and Planning Framework (2005/06–2007/08, Appendix 1, page 35)
Urban areas are defined as areas where population is greater than 100 persons per Km2 (2.5 persons per acre) in
1991, and rural areas where population density is less than 100 persons per Km2. In Scotland three spatial
definitions are used, High Density (more than 120 persons per Km2), Medium Density (less than 120 per Km2 but
more than 20 persons per Km2) and Sparse Density (less than 20 per Km2).
Ireland’s settlement structure and urban hierarchy is significantly different to the UK and direct translation of
these definitions of urban and rural locations may not be appropriate. In the case of the North West Area 59%
of the area has a population density of less than 20 persons per Km2 and 22% of the total population resided in
those areas. Furthermore the distinction between Category ‘A’ and Category ‘B’ calls are not equivalent to the
distinction between ‘AS1’ and ‘AS2’ incidents in the Irish context. Direct comparison of the results of the
performance analysis presented here with other jurisdiction is therefore not possible.
In section 2.4 of this report we put forward a spatial typology based on census definitions of towns, and
population density from the 2002 census. This typology usefully captures the fundamental settlement patterns
of the North West Area and provides a finer grain of analysis than the UK and one more relevant to an Irish
context. The use of response time targets as reflected in the spatial typology is intended therefore to provide an
27initial overview of performance. It is hoped that this will establish a baseline for interventions aiming to enhance
the Ambulance service performance and that will move toward achieving a response target of 8 minute response
time for greater than 50% of ‘Life Threatening’ AS1 incidents.
4.2 Response Times in North West Area
The average response time for the study period for the entire NW Area was 18.1 minutes for all AS1 & AS2
incidents. For AS1 the average response time for all incidents was 15.5 minutes and 26.0 minutes for AS2
incidents. The percentage incidents responded to within certain time bands provides a better means of
examining response targets and these are presented below.
4.2.1 Response Time - 8 Minutes
For the entire region 27% of all AS1 incidents are responded to in under 8-minutes. In the principal urban centre
of Sligo this rises to 60% of all AS1 incidents whereas in rural locations 11% of AS1 calls were responded to in
8 minutes. Percentages for AS2 calls are substantially smaller (see table 4.1).
Table 4.1
It is not clear from the current system of capture of Ambulance records whether all AS1 calls are ‘life threatening’
and therefore while these figures appear low compared to UK targets the responsiveness to such incidents may
in fact be higher than presented here, indeed without being able to isolate Life Threatening incidents the
emergency work load is likely to be overstated for the region.
Across the region there is significant variation in responsiveness reflecting settlement patterns and incident
demand criteria as described earlier (see table 4.2). There is a higher percentage of incidents responded to in the
towns and villages in Donegal compared to Sligo which has a less nucleated settlement pattern compared to
Donegal. This feature of service distribution strengthens the case for reconfiguration of the Ambulance service
toward one that is more closely located to potential demand. This is discussed in the following section of the
report.
1
The rural areas are all areas outside towns and villages, the sparsely populated areas have been
amalgamated into the rural areas in this instance.
28Table 4.2
4.2.2 Response Time - 14 and 19 Minutes
Substantially more incidents are responded to in the region within 14 minutes with 46% of all AS1 calls in the
region being within the response time. Letterkenny town had the highest gain of incidents achieving this target
compared with the 8 minutes target.
Table 4.3
At nineteen minutes 88% of all AS1 incidents and 81% of all incidents were responded to in Sligo town;
Letterkenny had a similarly high level of responsiveness for AS1 calls but had just 46% of AS2 calls met within
this timeframe, resulting in 75% of all calls being responded to in 19-minutes. For the region as a whole 59% of
AS1 calls were responded to in 19-minutes (see table 4.4).
29Table 4.4
4.2.3 Response Time – 25 Minutes
The final time-frame to be examined in this section are figures for 25 minutes response time. This response time
has been included as it corresponds to other work undertaken by PHECC concerning theoretical response times
based on drive-time models of Ireland2. In total 73% of all AS1 incidents were responded to within the 25-
minute timeframe and 65% of all emergency incidents. Whereas over 90% of all AS1 incidents in Sligo and
Letterkenny were responded to within 25-minutes, longer drive-times for rural locations resulted in 61% of AS1
incidents being responded to in less than 25-minutes.
Table 4.5
The theoretical analysis using drive-time, concluded that 8.4% of the population (some 19,372) people resided
outside the 25-minute response time target used in that study. Although results between the drive-time model
and those using real incident records cannot be compared directly, it is apparent that the drive-time model has
overestimated the current capacity of the North West Area to achieve high levels of responsiveness in less than
25-minutes. This result was anticipated in the study on drive-time as the assumptions used in the model, where;
(a) the nearest ambulance station served the relevant population; and, (b) an Ambulance resource was always
available; are not always valid.
2
Moore, D. National Spatial Analysis – Ambulance Service: compilation as related to road traffic . .
accidents and population. Naas: Pre-Hospital Emergency Care Council, 2005. (Publication pending).
305. TACTICAL DEPLOYMENT PLANNING (TDP) AND RESOURCE ASSESSMENT
5.1 Description of Goals of TDP
5.1.1 Objectives
It is accepted that performance in terms of responsiveness, utilisation and patient outcomes can all be improved
by a more dynamic approach to the deployment of available resources relevant to the spatial and temporal
patterns of demand. To these ends, Tactical Deployment Planning (TDP) was selected as the process by which
recommendations are to be made as to where sufficient resources should be placed in the busiest locations from
time to time as demand dictates.
5.1.2 Outline of Software Systems
ACTIVE’s Total Solution Mapping™ (TSM) system has been used to ‘bring to life’ all incident data provided by
Spatial Planning Solutions (SPS). ACTIVE has not undertaken any independent verification of the data provided,
the qualitative aspects of which are discussed elsewhere in this report.
TSM is predicated on connecting data sets using geographic reference, especially where data are otherwise
impossible to inter-relate. It provides a fast, accurate and flexible spatial and temporal analysis environment in
which to explore the patterns of demand, design the optimum locations from which to respond and determine
the work load for each response origin at different times of the day and days of the week. TSM has been
configured using Ordnance Survey Ireland data provided by the Ambulance service of the HSE NW Area. The road
network is derived from the OS 1:50k ‘Discovery Series’, and was slightly out of date, but these are intrinsic
weaknesses in the OSI data products. On balance, the road network data was considered to be fit for the purpose
in hand.
TSM contains a module called JourneyMan™, a sophisticated travel time boundary generator. This module allows
the creation of a boundary to describe the potential travel time from any given point, using road speeds and
congestion rules. These boundaries are used to further analyse incident data, and report on coverage of demand
within, for example, an eight minute response time of a proposed or existing response origin (station or standby
point). TSM can export data, and create prioritised lists of stations and response origins based on demand.
Most importantly, alternative deployment options can be safely modelled and remodelled in TSM, and potential
improvements in performance can be forecast (subject to the constraints inherent in the data being analysed)
before any risks are taken in the operational implementation of change.
Deployment plans are displayed in the ACTIVE TDP Viewer™, and run in time with the clock on the computer. As
the user moves through the day, the plan changes to reflect the priorities in the particular hour. Dispatchers also
have the ability to scroll through the hours to plan for meal breaks, vehicle movements and shift changes.
TDP Viewer™ allows the dispatcher to allocate vehicles to each response origin and visualise the current coverage
on a map. The map works with a simple traffic light system to show whether a post is manned, a vehicle is on
route to post, or an area is not covered at all.
The dispatcher uses the prioritised lists and visualisation of geographic cover as a guide, along with their
professional judgement, to place vehicles in the places most likely to have a call at any particular time of the day.
This means that vehicles will be closer to the location of the next call, so that a vehicle can get to the incident
quicker and be clear of that incident ready for another in a shorter overall time period.
Provision of the TDP of the NW Area to the Ambulance service is one of the key deliverables of the project.
31The fundamental configuration patterns recommended within the TDP for the NW Area is contained within this
package which provides the best means of examining its components. In the following sections we describe
some of the key features of the TDP, its creation, the assumptions within the plan, and distribution of
recommended ‘response origins’, Readers are pointed to the package itself to gain a complete view of the TDP
for the NW Area.
5.2 TDP - Steps in Creation
5.2.1 Identify Best Vehicle Positions and Compare with Existing Stations
Using ACTIVE TSM loaded with the data provided by SPS, hotspot maps of demand have been created. AS1, AS2
and PTS calls between 01/07/2004 and 29/06/2005 are separately analysed, and counted firstly into 3km grid
squares, from where the 500m concentration of demand within each “hot” 3km grid square can be found. Once
the 500m hotspots are identified, a suitable point on the road network on which to stand by can be selected
within the immediate vicinity, usually a fast road or crossroads to maximise response potential. This
methodology identifies Response Origins across the operational area. This method and the Response Origins
were agreed by the steering group during the course of the project and before proceeding to the next steps.
Figure 5.1 Shows the locations of existing stations and recommended demand based Response
Origins. 3km grid squares are coloured from white to red to show the density of incidents
325.2.3 Response Footprint Formation
Response Footprints are geographic areas that describe a part of the operational area that a Response Origin
is likely to respond to. These are edge-matched boundaries to ensure complete coverage of the operational area
and are drawn based on travel time boundaries but also take into account geographic features such as major
roads, railroads, rivers and lakes. It is usual for these footprints to be verified by operational staff as to their
veracity. The Response Footprints should be subjected to such a verification process before they are finally relied
upon as a logical division of the operational area. As stated above, these were reviewed by the steering
committee in the NW Area.
Once verified, the Response Footprints will ensure that every call gets counted once only in the prioritisation
calculation. These boundaries allow each Response Origin to be prioritised by counting incidents into its Response
Footprint.
Figure 5.2 Shows the locations of recommended demand based Response Origins and Response
Footprints around each. 3km grid squares are coloured from white to red to show the
density of incidents.
33A listing of the 29 recommended Response Origins is provided in Appendix 2 and are mapped above in figure 5.2.
All current Ambulance stations are considered as a response origin (11 stations) together with the locations
currently deploying Rapid Response Vehicles (RRV) (2 locations). In addition to these there are 16 additional
response origins recommended. It is recommended that the precise position of these origins within the footprint
area be identified in conjunction with staff and correspond to suitable locations where facilities (such as toilet
and rest areas) are available, for example at GP co-op centres or other HSE NW sites.
5.2.4 Tactical Deployment Plan
The TDP Viewer™ contains prioritised lists of Response Origins based on the amount of demand for each hour of
the week. Each vehicle is allocated to a Response Origin based on the demand in its Response Footprint. This
means some Response Origins may have two or three resources, if warranted, in some hours, and many Response
Origins will not be allocated vehicles hour after hour until the predicted pattern of demand warrants it. This
provides a prioritised list of Response Origins for dispatchers to use as a guide, to position Ambulances where
the next call is likely to happen.
100% compliance with the plan is not to be expected. This would mean that all resources are in the right place
at the right time, all waiting for the next incident. In practice, as the resources are better allocated to the areas
of greatest demand, their utilisation rises and they rarely are waiting for a call. The plan needs to be used by
dispatchers with good working knowledge of the geography of the operational area to ensure that post to post
movements are prudently instructed.
The sample plan at Figure 5.3 is for Friday 09:00 hrs – 09:59 hrs. Each location is listed in priority order based
on the demand in this hour, and the letters in brackets represent the vehicle sequence at a location, for example
(A) equals first vehicle, (B) equals second and so on. There are nine resources available to the dispatcher for this
period. If the dispatcher can cover the highest priority posts, responsiveness is likely to improve because the
vehicles will be close to where the next incident will take place. Yellow cells show how many vehicles should be
available in this hour and groups of blue or red location names signify posts of equal priority.
Within the TDP viewer the priorities for each station for each hour of each day is indicated (168 hours in total).
The viewer will thus indicate the ideal configuration of resources for the region that most closely reflects demand
patterns. Decisions on deployment are left to the individual dispatcher with guidance for optimum deployment
provided by the TDP.
Figure 5.3 TDP on Friday 09:00 hrs to 09:59 hrs
34You can also read