Housing Needs - Providing Homes, Improving Lives, Strengthening Communities - Northern Rivers Housing Study 2018 - North Coast Community Housing
←
→
Page content transcription
If your browser does not render page correctly, please read the page content below
Providing Homes, Improving Lives, Strengthening Communities

            Housing Needs
     Northern Rivers Housing Study 2018
                              Dr Tony Gilmour
            Report commissioned by North Coast Community Housing
8 October 2018
Published by North Coast Community Housing Company Limited
Level 1, 107 Molesworth Street, Lismore NSW 2480
ISBN: 978-0-9874308-5-4

Enquiries to John McKenna, CEO. john.mckenna@ncch.org.au

Report prepared by Dr Tony Gilmour and John Stott, with GIS Mapping from Shaun Walsh
Housing Action Network
410 Elizabeth Street, Surry Hills NSW 2010

Enquiries to Tony Gilmour, President tony@housingaction.net.au

Front cover: Rainforest Creek development in Goonellabah NSW at the launch of the NCCH/Enova/NSW Office of
Environment & Heritage Solar Home Project. April 2018

2
Introduction to Revised Northern Rivers Housing Study, October 2018

In the Introduction to the research report, by the Centre for Enterprise Development and Research at Southern
Cross University, titled ‘Housing Affordability on the NSW North Coast’, Ray Battle the Chief Executive Officer of
Banana Coast Credit Union, at the time, led off with this comment:

         ‘Affordable Housing - a growing need in Northern NSW

        As a result of changes to housing policy in Australia over the last two decades the supply of affordable
        public rental housing has declined and its role has increasingly focused on meeting the housing needs of
        the most disadvantaged in the community. When combined with the dramatic increase in property prices
        over the past decade, which has far outstripped wages growth, the need for affordable housing for low to
        moderate income households has become ever more urgent.
        Affordable housing, particularly for first time buyers and low income families, is essential to ensure
        sustainable and balanced growth of regional communities along the coastal strip of Northern NSW’

The really concerning issue about the comments, which appear especially relevant in the present climate of
housing need and lack of affordability in our region, is that the report was written in 2005 (Kelly et al., 2005)

I have been in my role as General Manager/CEO of North Coast Community Housing (NCCH) since July 2009 and
the fact that the housing affordability issue has been seen as a major problem on the North Coast since the turn
of the 20th century, and that the ‘Housing Affordability on the NSW North Coast’ report was written 13 years ago,
highlights the fact that the housing affordability issue is a wicked social problem and, sadly, little to nothing has
been done to alleviate the problem, which continues to worsen.

North Coast Community Housing has again engaged Dr Tony Gilmour of the Housing Action Network to prepare
this revised Housing Study with the updated information from the 2016 Australian Census.
While this study mostly follows the same format as our 2013 study, we have attempted to do more than just
report on the census and housing need. We have included sections on what NCCH has done, and is doing, to meet
the affordable housing need in the region and also what may be required to significantly reduce the social
housing waiting list in the Northern Rivers.

This revised study has been updated in an effort to continue the discussion around how we might deal with the
continuing unaffordability of housing for those buying or renting and hopefully come up with workable solutions
to the issues.
The compounding issues impacting the housing needs in the Northern Rivers region are relatively low average
incomes, ranging from 56% to 78% of the NSW average, lack of reasonable transport infrastructure, lack of
affordable rental housing options, a lower than state average amount of social housing and the relative price of
property to incomes, particularly on the coastal strip.

3
The findings in our Regional Housing align with those in the February 2018 AHURI report ‘Paying for affordable
housing in different market contexts’, the authors highlight six key lessons about financing affordable housing in
their research:

    1. Government facilitated access to land is central to generating development opportunities and a key
       means of improving long-term project viability.
    2. Government equity investment offers considerable potential for delivering feasible projects and net
       benefit to government.
    3. Reducing up front debt loads and lowering finance costs are critical to long-term project viability.
    4. Delivery across the housing needs continuum helps to meet overall social and tenure mix objectives as
       well as providing opportunities to improve project viability through cross subsidy.
    5. Planning policies can deliver additional sources of cash or land, however, the financial benefit of planning
       bonuses are limited.
    6. Increasing the scale of not-for-profit housing provision will offer financial benefits for the long-term
       delivery of affordable housing (Randolph et al., 2018).
Another key point raised in the report is the need for a fit-for-purpose subsidy (‘gap funding’) to cover operational
losses under private financing to enable the ongoing development of social and affordable housing.

We need to investigate the opportunities to work with all levels of government, private developers and the
finance sector to come up with solutions to the identified shortage of accommodation across the housing
continuum in the Northern Rivers.

North Coast Community Housing have positioned themselves to be a central part of the solution and not part of
the issue, in solving this wicked social problem in the Northern Rivers.
In the words of Piers Williamson, the CEO of the UK’s Housing Finance Corporation, at the recent Powerhousing
Exchange in Canberra, ‘You can’t have subsidised housing, without subsidy!’

John McKenna
Chief Executive Officer NCCH

4
Contents
Tables and Figures .......................................... 6
Executive Summary ........................................ 7
1 Background............................................... 11
    1.1 Regional Characteristics ............................... 12
    1.2 Regional planning ......................................... 13
    1.3 Planning for affordable housing ................... 14
2 Social and Economic Factors ...................... 16
    2.1 Migration ...................................................... 17
    2.2 Population growth ........................................ 18
    2.3 Household composition................................ 18
    2.4 Regional incomes and employment ............. 19
    2.5 Social disadvantage ...................................... 22
    2.6 Regional social issues ................................... 25
    2.7 Specific housing needs ................................. 26
    2.8 Aboriginal residents...................................... 28
3 Housing Markets ....................................... 30
    3.1 Housing types and tenure ............................ 31
    3.2 Private housing costs .................................... 32
    3.3 Housing supply and demand ........................ 34
4 Housing Affordability ................................ 35
    4.1 Key terms ...................................................... 36
    4.2 Regional affordability ................................... 36
    4.3 Social housing ............................................... 40
    4.4 Housing policies ............................................ 42
    4.5 Cost of clearing the social housing backlog .. 44
    4.6 Meeting the funding gap .............................. 46
References ................................................... 47
Glossary & Abbreviations ............................. 47

5
Tables and Figures
Tables                                                                  Figures
Table 1: Council affordable housing strategies ....... 15               Figure 1: Northern Rivers region ............................ 12
Table 2: Household composition, 2016 ................... 19             Figure 2: The North Coast region ............................ 13
Table 3: Population by age, 2016 ............................ 19        Figure 3: Population growth forecast to 2036 ........ 18
Table 4: Household weekly income, 2011-16.......... 19                  Figure 4: Weekly household income 2016 ............. 20
Table 5: Occupation sample, 2016 .......................... 22          Figure 5: Low income households, 2016 ................ 21
Table 6: Selected employment, 2016 ...................... 22            Figure 6: Northern Rivers SEIFA scores, 2016 ......... 23
Table 7: Homelessness 2016 ................................... 26       Figure 7: Lismore SEIFA scores, 2016...................... 24
Table 8: Housing suitability...................................... 28   Figure 8: Casino SEIFA scores, 2016 ........................ 24
Table 9: Housing type, 2016 .................................... 31     Figure 9: Grafton SEIFA scores, 2016 ...................... 25
Table 10: Housing tenure, 2016 .............................. 31        Figure 10: Homelessness, 2016 .............................. 27
Table 11: Purchasers in housing stress, 2016 .......... 34              Figure 11: Aboriginal residents, 2016 ..................... 29
Table 12: Housing demand, 2016-36 ....................... 34            Figure 12: Property rental costs, 2015-18 .............. 32
Table 13: Housing supply and demand.................... 34              Figure 13: Property sales prices, 2015-17............... 33
Table 14: Domographia unaffordability, 2018 ........ 37                 Figure 14: Rental housing stress, 2016 ................... 38
Table 15: Renters in housing stress, 2016 ............... 37            Figure 15: Rental Affordability Index ...................... 40
Table 16: Affordable Housing Income Gap .............. 39               Figure 16: Social housing % of dwellings, 2016 ...... 41
Table 17: Social housing waiting list, Jun 2018........ 42              Figure 17: AHURI housing assessment tool ............ 47
Table 18: Clearing waiting list by purchase ............. 45
Table 19: Clearing waiting list by development ...... 45

6
Executive Summary

                        South Road, Moorabbin. 97 homes
                                     Housing First (2011)

7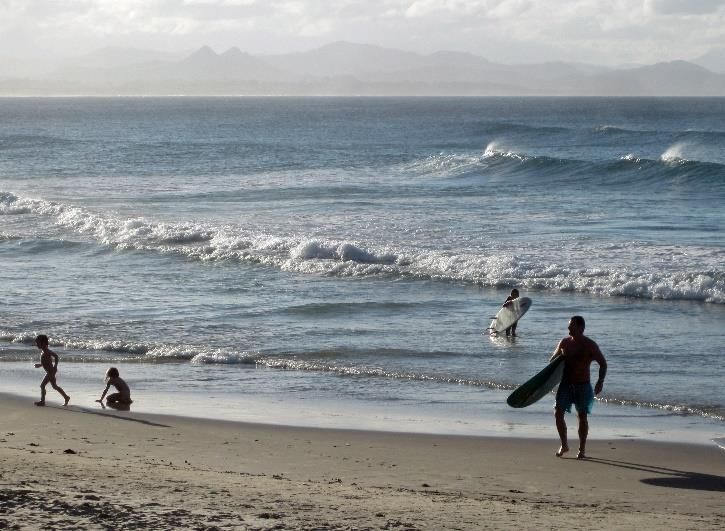
The Northern Rivers region, in the north-east corner areas, though they are still generally 35% lower
of NSW, has a justified reputation as a lifestyle than the NSW average
destination for both residents and visitors. Yet,
beneath the brochure images of Byron Bay surfers Household income across in the more inland
and the alternative lifestyle of Nimbin lies some of areas of Clarence Valley, Kyogle and Lismore
the most challenging housing conditions - not just in council areas have risen between 2011 and 2016
Australia, but in the world. at a slower rate than the NSW average
Nearly all areas in the Northern Rivers have a
Local factors very low household income, defined as under
The growing gap between rising housing costs and $650 per week. The most challenged areas of
incomes is not unique to the Northern Rivers. inland Kyogle and Clarence Valley council areas
However, special local characteristics have have up to 40% of households on very low
accentuated the problem: incomes, compared to an average of below 20%
across NSW
Sea-change and tree-change migration has
increased demand for well-located housing, All Northern Rivers council areas have below the
often in the form of holiday homes that are only NSW average of higher earners, those with
occupied for part of the year household incomes over $3,000 per week. Even
in relatively prosperous Byron Shire fewer than
Economic prosperity and population growth
10% of households are classed as higher earners,
over the border in South East Queensland have
less than half the average in NSW
made the Northern Rivers more attractive,
accessible and affordable to more people. Low incomes, coupled with poor intra-region
transport, isolation and limited supply of social and
These trends are accentuated by the long- support services has led to many in the Northern
overdue upgrade of the Pacific Highway. Rivers facing many challenges. Some areas in the
Unfortunately significant investment in road region are likely to decline - Kyogle Shire will see a
infrastructure has far exceeded investment in reduction in population between 2016 and 2036.
community and social services
Coastal resorts are a continuing mecca for Many Northern Rivers locations are in
backpackers, families and grey nomads. This has the 20% most disadvantaged in NSW
led to a loss of caravan parks offering affordable -----
longer term accommodation, and the rise of the Homelessness rates increased by 23%
AirBnB and Stayz holiday-lets from 2011 to 2016
-----
Low incomes and disadvantage The region’s Aboriginal population is
Fast-rising property costs have not been met by a up to three times higher per capita
commensurate rise in incomes:
than NSW. Many face discrimination
The highest household incomes are found in and disadvantage
Ballina, Byron Shire, Lismore and Tweed council South Road, Moorabbin. 97 homes
Housing First (2011)
8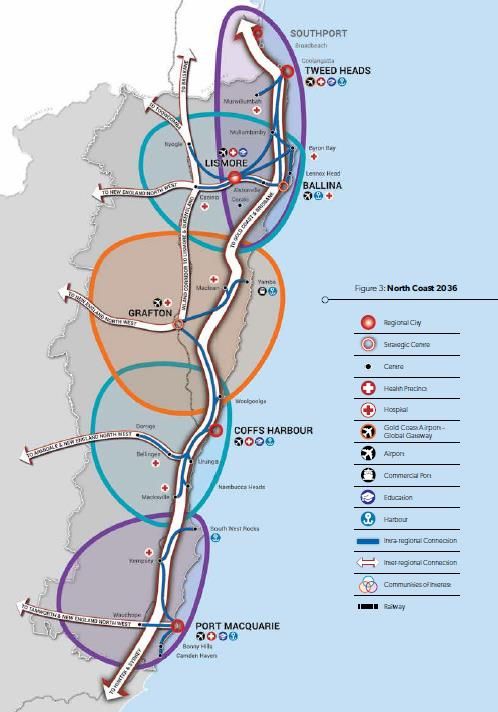
Housing markets                                       on a Newstart Allowance and only three to a single
In terms of housing affordability, parts of the       person on the Age Pension.
Northern Rivers are as expensive for property         Social housing is in short supply. All Northern Rivers
purchasers and private renters as well located        council areas have less than the NSW average of
Sydney suburbs in the eastern suburbs and north       4.9% of all dwellings as social housing. The figure is
shore. Weekly rents in Byron Shire are over $600      only 1.8% in Kyogle Shire. Rates of social housing are
and rising, and median sales prices over $800,000.    falling due to little new supply being built. If the rate
Unlike in Sydney, few residents are able to access    of decline continues at this rate the proportion of
the high-paying professional jobs that would make     social housing will be less than 0.5% of housing stock
these properties affordable.                          within 50 years.
House prices are rising in part due to there being
insufficient new homes built. Between 2011 and          Northern Rivers social housing waiting
2018 the average supply of new properties was 356       list rose from 2,257 in 2012 to 3,026 in
in the Northern Rivers against a Government-             2018. Most people wait over 10 years
predicted housing demand of 1,293 per year in the                              -----
period from 2016 to 2036.                              It would cost nearly $1.8 billion to buy
                                                       properties to clear the Northern Rivers
        Tweed Heads was the 8th least
                                                             social housing waiting list
       affordable housing market in the                                        -----
          world (Demographia, 2017)                       The regional shortage of social and
                       -----
                                                              affordable homes is 6,200
    Up to 59% of Northern Rivers renters
           are in ‘housing stress’
                       -----
                                                      The housing shortfall
     Byron Shire had the least affordable             The ‘Everybody’s Home’ 2018 campaign estimates a
                                                      backlog of half a million social and affordable rental
     rents of any council area in NSW in              homes in Australia. The shortfall in the Northern
                    2017                              Rivers is over 6,000 with around 60% of these social
                       -----                          housing targeted at very low income households.
     Only 1 rental property in Ballina and 1
                                                      This report pioneers an approach that estimates the
      in Byron Bay were affordable to low             cost of clearing the current Northern Rivers social
    income renters and people on benefits             housing waiting list of just over 3,000 properties. No
                                                      calculation is made of the cost of meeting shortfall
Private rental vacancy rates in the Northern Rivers   of private rental dwellings as these could probably
are the lowest in NSW, at 1.1%. Between 2011 and      best be addressed through using the planning
2016 the proportion of private rental households      system.
fell, bucking the trend in NSW. In March 2018
Anglicare noted that of 660 private rentals           To procure enough social housing to accommodate
advertised, none were affordable to a single person   everyone on the waiting list in the Northern Rivers
                                                      would cost $1,775,910, 150. This is a large amount

9
of money, though not out of line by NSW                 To date the main focus of Government has been
Government spending on infrastructure: the 155          addressing the undoubted problems with Sydney’s
kilometre Pacific Highway upgrade from Woolgoolga       housing market. Both SAHF and the Communities
to Ballina will cost $4.36 billion alone.               Plus redevelopment of social housing estates have
                                                        largely been directed at metropolitan locations
An alternative approach to clearing the regional
                                                        where land values are high and where it is more
waiting list would be for a community housing
                                                        acceptable to deliver medium density housing.
provider such as North Coast Community Housing
(NCCH) to develop new homes. These would be             The top 6 recommendations are shown below.
smaller, to meet demand - over 80% of current           These steps are agreed by housing academics, are
demand for social housing is for one and two            tried-and-tested, and do not require an upfront
bedroom properties. Also, a community housing           investment of many billions of dollars. Without a
provider can take advantage of tax benefits, and        change, Northern Rivers economic growth and
access in time to cheaper debt finance from a           quality of life will be significantly compromised.
Commonwealth backed bond aggregator.
                                                            Make more public land (state and
If NCCH develop the properties, the cost falls to
$0.85 billion, and further to $0.78 billion if the         council) available at low/no cost for
organisation raises debt based on small surpluses           social/affordable housing projects
from tenant rental income. This is a more realistic                            -----
figure that State Government could afford, and            Devise a coordinated Northern Rivers
would be as important a form of ‘infrastructure’ as        housing strategy, with extra State
highways and bridges.
                                                                  Government funding
                                                                               -----
Ways forward                                                Introduce a mandatory 5% to 10%
Challenges in the Northern Rivers housing market
are largely ‘off the radar’ for State Government.
                                                          affordable housing inclusion in all new
Investment in a single region would lead to calls for          larger housing developments
investment across the state. The NSW housing                                   -----
market has been poorly coordinated over several              Make current Government social
decades by Governments across the political                 housing initiatives better suited to
spectrum, and potentially solutions will also take           regional areas, and match need
decades to implement. However, now is a good time                              -----
to start before conditions worsen.                           Leverage the role of community
Governments, led by NSW, have become                            housing providers, including
increasingly sophisticated in delivering good housing        transferring more public housing
outcomes while minimising up-front capital outlay.                             -----
The Social and Affordable Housing Fund (SAHF) is an       Government to provide ‘gap funding’
example of how the capital funding ‘gap’ required to
                                                          to make viable the delivery of more
deliver new below-market housing can be met, while
maximising all other options such as favourably                social/affordable housing
priced land supply and debt finance.

10
1 Background
South Road, Moorabbin. 97 homes
Housing First (2011)North Coast Community Housing (NCCH) encourage visitors to other parts of the region, away
commissioned the Housing Action Network to from the increasingly congested coastal strip.
prepare an independent report on the housing
Figure 1: Northern Rivers region
markets in the areas where the organisation
operates. Launched in October 2018, the report
was presented at the Northern Rivers Housing
Forum in Lennox Head on 11 October
This report uses a study area region of the seven
Local Government Areas (LGAs) where NCCH
manage properties: Ballina, Byron Shire, Clarence
Valley, Kyogle, Lismore, Richmond Valley and Tweed
LGAs. This area is often known as the ‘Northern
Rivers’, a term used in this report (Figure 1).
1.1 Regional Characteristics
Due to their differing housing and population
characteristics, the seven council areas in this study
act as distinct housing sub-markets. While impacted
by wider trends in NSW, they have distinct
characteristics based on existing housing stock, new
dwelling supply and buyer/renter preferences.
Population in the region is relatively dispersed, with
around half of residents living in coastal or non-
coastal villages or smaller communities. The area has
over 20 national parks and a bush character that has
been popular with sea-changers and people looking The region’s coastal areas, east of the Pacific
for an alternative lifestyle. Highway and including Tweed Heads, have the most
biodiversity and natural hazards and also have the
The region’s economy has been transformed over greatest growth pressures. Key environmental issues
the last three decades from largely agricultural to include coastal inundation and erosion and
one driven by tourism, which has increased instability, bushfires, flooding, acid sulphate soils
development pressure and disparity between and contested coal seam gas resources.
popular coastal destinations like Byron Bay and less
visited inland areas. Coastal growth has been in part driven by ‘sea
changers’ moving from Sydney, Melbourne and
Service industries now account for over 80% of all other regions, and people relocating from SEQ as
employment, followed by manufacturing and their costs of living, housing and industrial land rise.
construction, education and teaching. Some In the Tweed Shire, the majority of the growth is
agriculture, forestry and fishing jobs have been predicted to occur in the northern and coastal areas
maintained. Government strategies aim to closest to the border with Queensland.
12Pacific Highway construction and other building Government, 2017). This is based on a newly defined
projects such as the new Grafton Jail have led to ‘North Coast’ region from Tweed Heads south
something of an infrastructure ‘boom’. Existing through Grafton, Coffs Harbour to Port Macquarie.
housing is increasingly targeting temporary workers The previous 2012 approach used two planning
at premium rates, and the average cost of rental has regions, the ‘Far North Coast’ and the ‘Mid North
increased by up to 36% over two years. Coast’ (south from Yamba).
The availability of permanent housing in the tourist The 2017 plan builds on the State Government’s
centres in the region is also affected by unregulated investment in upgrading the Pacific Highway to a
holiday letting through platforms such as Airbnb. dual carriageway. It therefore develops the idea of a
This leads to permanent residents often no longer linear corridor connecting the main coastal cities,
able to afford to live there, stripping communities of with ‘regional connections’ to Grafton and Lismore.
social and community capital.
Figure 2: The North Coast region
An ageing population is expected to increase
demand for senior’s living housing and local services
and amenities such as transport, health care and
recreational facilities. The proportion aged over 65 is
expected to double by 2036. By contrast the
proportion of young people is expected to decline.
This will drive greater demand for diversity in
housing, particularly smaller properties for one and
two person households.
The planning region of South East Queensland (SEQ),
bordering the Northern Rivers region to the north,
has for some years been one of the fastest growing
regions in Australia. The main impacts of the growth
of SEQ on the region, and its greater connectedness
through Pacific Highway upgrades, are:
Increased demand through tourism on the
facilities of Northern Rivers towns, especially
along the coast
Higher levels of sea-change migration, and more
holiday homes only occupied for part of the year
More households living in the Northern Rivers Source: NSW Government (2017) p.10
region but commuting north to jobs in SEQ
In the Northern Rivers region, Government defines
an urban hierarchy with Tweed Heads and Lismore
1.2 Regional planning ‘regional cities’, Ballina and Grafton ‘strategic
In 2017 State Government issued a new regional centres’ and Casino, Kyogle, Byron Bay,
planning strategy covering the period to 2036 (NSW Mullumbimby and Murwillumbah ‘important
13centres’. Three quarters of anticipated population Promotion of new caravan parks and
growth over the next two decades will be in manufactured home estates on unconstrained
‘regional cities’. land in existing settlements and new land
release areas in the urban growth areas
1.3 Planning for affordable The preparation of local affordability analyses
housing and precinct plans to support local growth
management strategies and planning proposals
The seven local councils in the Northern Rivers that identify responsive lot size and planning
region play an important role in preparing and controls (NSW Government, 2017: p.57)
implementing planning policies that affect housing
supply. However, the NSW Government also has a Most of these actions need to be undertaken by
key role, being responsible for regional planning local councils, not State Government. There is no
strategies. It also controls drivers such as investment mention of additional funding being provided.
in transport, social infrastructure, land release and Councils will be encouraged to ‘deliver more
incentives to locate major new employment opportunities for affordable housing by
opportunities. incorporating policies and tools into local growth
management strategies and local planning controls
State Government that will enable a greater variety of housing types
There have been few new affordable housing and incentivise private investment in affordable
planning initiatives since the election of the current housing’ (ibid, p.57).
State Government in 2011. The State Environmental
Planning Policy (SEPP) Affordable Rental Housing State Government has recently prepared guidelines
2009 remains in place. However, the terms have and templates for local housing strategies that
been changed making it harder to deliver certain include planning for and addressing local affordable
types of affordable housing. housing needs (NSW Government, 2018).
The NSW Government North Coast Plan for Local Government
affordable housing is high level and does not specify Some Australian councils have been proactive in
targets. There are a range of tools that need to be addressing housing affordability issues. Actions
delivered through local planning: include establishing and supporting community
Planning bonus development provisions, where housing providers, inclusionary zoning schemes to
a percentage of affordable housing is included raise developer contributions, direct property
ownership and innovative planning policies
Reduced contributions or other development promoting smaller lots and cheaper buildings.
incentives that may boost construction of
secondary dwellings (granny flats) as alternative In April 2013 the Independent Local Government
affordable housing Review Panel published proposals for local
government amalgamation and reform (ILGRP,
Planning incentives or negotiated planning 2013). The initial proposal was that Tweed, Byron
agreements to encourage private investment in Shire, Ballina, Lismore, Richmond Valley and Kyogle
social and affordable housing merge to form a ‘Northern Rivers County Council’.
Clarence Valley would be part of the ‘North Coast
14County Council’. Due to strong local protests, the Positions Kyogle as a council recognised for its
amalgamations did not proceed. implementation of social equity principles for its
community, including older people and people
The housing affordability policies of the councils in
with disability service needs
the Northern Rivers region are shown in Table 1 and
discussed below. Policies vary from council to Continues to use and implement the NSW
council, with the main approach to partner with Affordable Housing Guidelines as a basis for a
local activist groups, community housing providers, local affordable housing strategy including for
State Government and developers. transitional housing arrangements for older
people and people with disability service needs
Table 1: Council affordable housing strategies
Area Strategies Lismore LGA Housing Strategy was adopted in 2012
Ballina Shire Housing Strategy 2010
with no updated plan. In March 2018, Lismore City
Council called for expressions of interest from
Byron Shire Residential Strategy 2018 under
discussion housing providers, community organisations and/or
Kyogle Community Strategic Plan 2016 to 2026.
private developers for partnerships to access up
to$3.5 million in subsidies to deliver key worker
Lismore Housing Strategy 2012
housing in Lismore.
Richmond Valley None
Tweed Shire Draft affordable, attainable and Lismore’s funding is from the Commonwealth’s
appropriate housing policy statement Building Better Regional Cities program, which
Clarence Valley Affordable Housing Policy 2009 provided $5 million to Council in 2016 to achieve
Source: Ballina Shire Council (2010), Kyogle Council (2018), more affordable housing options across the city.
Clarence Valley Council (2007), Lismore City Council (2012), Lismore Council offered 200 grants of $20,000 for
Tweed Shire Council (2017)
residents to purchase and build homes on new land
The Ballina council strategy adopted 2010 has not releases, however, less than a quarter of the
been updated. The governance framework includes available fund was used.
demographic trends, and a policy toolkit. Tweed Shire Council’s draft housing policy statement
Byron Shire local council has a webpage dedicated to is part of their strategic plan 2017-2027. The policy
proactive initiatives including: highlights the council’s commitment to affordable,
attainable and appropriate housing. The principle is
Draft residential strategy to be approved late 2018 to leave a legacy for future generations and
managing community growth. The main strategy is
NCCH project at Station Street, Mullumbimby.
to encourage housing diversity and choice that
Affordable housing mix 24%
meets the needs of the community.
Lot 22, Stuart Street, Mullumbimby to Clarence Valley Council’s Affordable Housing Policy
encourage diverse and affordable housing. Draft was adopted in 2009. However, council has recently
planning approval has been granted
reduced their focus on their affordable housing
The Community Strategic Plan 2016 to 2026. approach due to a change in priorities but still have a
Housing Strategy for Kyogle council: 10% inclusionary zoning option on all new large
developments.
152 Social and Economic Factors
South Road, Moorabbin. 97 homes
Housing First (2011)The region is impacted by inward migration, Coastal lifestyle destinations are more than three
including lifestyle migration, resulting in a fast- hours’ drive from large cities, and attract visitors and
rising population. While there are pockets of new residents for lifestyle, tourism and leisure
wealth in the North Coast, especially in coastal opportunities. Ballina and Byron Shire LGAs fall into
this definition.
areas, the biggest challenges are faced by the
relatively large number of low income
households. Social issues and disadvantage are
a feature of many communities, with services
and transport often lacking
2.1 Migration
Migration is a key component of population change
in the Northern Rivers region. Its level changes over
time, being strongly affected by external factors, for
instance a lack of new housing (which particularly
affected Byron Shire in the early 2000s) or a lack of
employment options which still affects Kyole. Byron Bay. An attractive coastal location for ‘sea change’
migration, and investment in holiday rentals
The Global Financial Crisis moderated the previously
high levels of retiree migration to coastal locations, In the north of the region, Tweed Heads may fall
though this is now returning to trend. The Northern within the ‘coastal getaway’ category. These are
Rivers region is also heavily impacted by the ‘sea small and medium sized towns within three hours’
change’ phenomenon. Dating from the late 1960s, drive of a capital city. At this distance from the
this is the migration of households from metropolitan capital city, locations can be attractive for holiday
areas and inland communities to coastal locations. homes used initially for weekend trips. Coastal
Due to factors such as these, population change has getaway locations are likely to attract a younger
varied by geography and time. demographic than coastal lifestyle destinations.
Although retirees form a large part of the sea change In addition to the sea change phenomenon, ‘tree
movement, they are not the only type. Many new change’ is the move of people to inland rural
residents moving to coastal areas are younger than communities to escape the pressures of city life.
for Australia as a whole, and considerably younger Though the term is more loosely defined than sea
than the local population of these areas. Typically, change, it tends to be used for locations within three
they move for reasons of lifestyle and living costs. hours’ drive of a capital city. The inland areas of the
Researchers have developed a typology of five North Coast fall within this definition, although the
different types of movers, based largely on distance numbers moving into many of these areas are
from metropolitan centres (Gurran et al., 2005). thought to be very small.
Due to distance from capital cities in NSW and With the baby boomer generation approaching
Queensland, coastal locations in the Northern Rivers retirement, the rate of lifestyle migration is likely to
region are best characterised as ‘coastal lifestyle rise further. This will place further pressure on the
destinations’ using the Gurran typology.
17availability and affordability of properties in Figure 3: Population growth forecast to 2036
the area. Lifestyle migrants typically have 120,000
sufficient capital to buy in their sea/tree
change locations, pushing up local house
prices. Future generations of existing 100,000
residents on lower incomes may be unable to
afford to buy in the same area. 80,000
Short term holiday rentals also impact the
Northern Rivers, with propertied advertised 60,000
through real estate agents, Stayz and AirBnB.
A recent University of Study found 2,740 40,000
AirBnB listings in Byrom Shire in December
2017, equivalent to 17.6% of all housing. This
was the highest percentage of the 12 coastal 20,000
locations studied (Gurran et al., 2018).
0
The authors characterised the impact of the 2011 2016 2021 2026 2031 2036
online holiday rental sector in Byron Bay as
Ballina Byron Clarence Valley
‘tourism displacement’, where:
Kyogle Lismore Richmond Valley
‘Local workers and aspiring home owners Tweed
can no longer afford to rent or buy in the Source: NSW Government (2016)
locality, but there are abundant short
term rentals. New housing supply is at high risk of 2036. Government also include a ‘low’ prediction of
conversion to the short term rental market. 30,350 and a ‘high’ prediction of 56,400.
Byron exhibits the characteristics of a housing The increase of 42,450 in the Northern Rivers region
market which has been distorted by holiday represents a 14.1% increase between 2016 and
rental accommodation’ (ibid. p.37) 2036. This is around half the rate of increase
predicted for NSW (28.1%). LGAs with the largest
2.2 Population growth increases in the Northern Rivers region are Tweed
(+22.1%) and Byron Shire (+17.1%). Growth is lowest
The NSW Government uses assumptions on fertility,
in Ballina, Clarence Valley and Richmond Valley LGAs
mortality and migration to predict future population
(+8.9%). In Kyogle LGA the population is expected to
growth to 2036. These are informed estimates, not
fall by 50 people from 2016 to 2036 (-0.5%)
targets, and do not claim to be precise, as
demographic trends can change.
2.3 Household composition
Figure 3 shows State Government figures for
population growth. These were last revised in 2016, In Table 2, families with children represent between
and the 2016 figures are projections as the Census 32% and 39% of households, while in 2011 the range
numbers were not available (2011 figures are was 37% and 41%. The table also shows couples
actuals). The Northern Rivers region’s population in comprise between 26% to 33% and singles
anticipated to increase by 42,450 between 2016 and households represent 28% to 32%. Couples without
18children and singles compositions have increased by The proportion of children aged 14 or less dropped
around 2% percentage points since 2011. by between 1% and 2% points from the 2011 census.
The NSW percentage also drops in 2016 from 2011
Table 2: Household composition, 2016 by 0.6% points. Only Richmond Valley has a higher
Families with
Couple Single Group
proportion of children than NSW.
children
Ballina 36.6 % 31.8 % 28.2 % 3.4 % Table 3: Population by age, 2016
Byron Shire 38.7 % 26.2 % 27.4 % 7.8 % aged 0-14 aged 65 +
Clarence Valley 34.5 % 33.3 % 29.1 % 3.1 % Ballina 16.7% 25.0%
Kyogle 32.2 % 32.4 % 32.4 % 3.1 % Byron Shire 16.8% 16.9%
Lismore 39.4 % 26.7 % 29.2 % 4.7 % Clarence Valley 16.4% 25.7%
Richmond Valley 38.7 % 29.0 % 29.2 % 3.0 % Kyogle 16.3% 26.5%
Tweed 37.3 % 30.4 % 28.5 % 3.8 % Lismore 17.8% 18.2%
Total 37.1 % 30.1 % 28.7 % 4.1 % Richmond Valley 19.1% 22.6%
Tweed 16.8% 25.4%
Source: ABS (2016). The higher numbers of group households in
Lismore and Byron Shire may be linked to the relatively high NSW 18.5% 16.2%
number of students (Lismore) and young people (Byron Shire)
Source: ABS (2016)
This trend of increased couples and singles with no
children is set to continue and can be mostly 2.4 Regional incomes and
explained by an ageing population and people
having less children. The North Coast region is
employment
expected by 2036 to have over 30% of the Table 4 shows household incomes in the Northern
population aged over 65 compared to 22% in 2016 Rivers region compared to NSW. The LGAs of
(NSW Government, 2017). Clarence Valley, Kyogle and Richmond Valley are
considerably lower than the NSW average, having
Age distribution more rural industries.
Table 3 shows that the proportion of people over 65
varies across the LGAs from 17% in Byron Shire to Table 4: Household weekly income, 2011-16
over 25% in Ballina, Clarence Valley, Kyogle and 2011 2016 Change
Tweed LGAs. In all LGAs in the Northern Rivers Ballina $930 $1,156 24.3%
region the proportion is above the NSW average of Byron Shire $885 $1,149 29.8%
16%. There were also large increases from the 2011 Clarence Valley $768 $910 18.5%
census results: Clarence Valley’s proportion
Kyogle $714 $832 16.5%
increased by 8% percentage points and Richmond
Lismore $907 $1,067 17.6%
Valley and Tweed by 3% percentage points.
Richmond Valley $789 $953 20.8%
The percentage of people over 65 is also expected to Tweed $845 $1,064 25.9%
increase by 36%, from 2016 to 2036. This represents NSW $1,237 $1,486 20.1%
an increase of 4 percentage points as a proportion of Source: ABS (2011, 2016)
total population, reflecting the increase in the aged
demographic of retirees.
19The highest incomes are found in Ballina, Byron Figure 5 shows the distribution of low income
Shire, Lismore and Tweed LGAs, though they are still households across the Northern Rivers region (see
generally 35% lower than the NSW average. Rates of next page). These are defined as having a household
increase in household income across the Northern income below $650 per week. Around 20% of NSW
Rivers region since 2011 are much higher than for households have weekly income below this figure,
NSW, except in Clarence Valley, Kyogle and Lismore but only a few selected locations coloured green on
LGAs. the map have this lower proportion.
Figure 4 highlights households with a low income Nearly all locations in the Northern Rivers region
below $650 per week and more than $3,000. As in have more than the state average of low income
2011, the higher incomes are the coastal LGAs and in households (shared pink). Some areas have nearly
the regional centre of Lismore, than inland. Income 40% of the population as low income households,
differentials are the lowest in Kyogle LGA and more than twice the state average.
greatest in Ballina and Byron Shire
LGAs. Figure 4: Weekly household income 2016
40%
On average across NSW in 2016, 19%
35%
of households had an income above
$3,000. No LGA in the region has more 30%
than 10% with higher incomes in this 25%
band. Furthermore, while on average 20%
20% of NSW households had incomes 15%
less than $650 per week, all Northern
10%
Rivers region LGAs were above this
5%
figure. In Clarence Valley and Kyogle
around one third of all households had 0%
Ballina Byron Clarence Kyogle Lismore Richmond Tweed
very low incomes. This is a probably a Valley Valley
combination of low paid jobs,
less than $650 more than $3000
retirement, and relying on welfare
payments. Source: ABS (2016)
Income is the key factor in the unaffordability of
Occupations
housing in the Northern Rivers region. While the
Table 5 on p.22 shows variations in occupational mix
median figures are often reasonable (Table 1), the
in the Study Region LGAs. The largest numbers of
income distribution is skewed towards a large
higher paid professional and managers are Byron
number of low earners and a few very wealthy
Shire, Ballina and Kyogle LGAs. The Kyogle farm
households (Figure 4).
managers, however, may not earn as much as
The low income households in the Northern Rivers managers in Ballina and Byron Shire. The rates are
region face the greatest issues in securing housing, comparable to NSW, except for Clarence Valley,
and there are a large number of households in this Richmond Valley and surprisingly Tweed LGA.
category chasing few available properties.
20Figure 5: Low income households, 2016 21
Richmond Valley, Kyogle and Clarence Valley have a of 5.9% in Ballina and 6.5% in Byron Shire up to 8.7%
larger proportion of tradespeople, drivers and in Kyogle and 7.8% in Lismore LGA.
technical operatives than the other LGAs due to the
more rural nature of trades. Table 6: Selected employment, 2016
Sector %
Table 5: Occupation sample, 2016
Ballina Hospitals 4.0
Managers and Trades, Technical
Professionals Labourers operatives, Drivers Aged Care 3.7
Ballina 35.4% 10.5% 18.2% Secondary education 3.1
Byron Shire 39.4% 9.7% 17.7% Byron Shire Cafes and restaurants 4.0
Clarence Valley 27.1% 12.8% 21.6% Accommodation 4.0
Kyogle 34.7% 15.8% 19.7% Hospitals 2.8
Lismore 31.7% 12.4% 18.5% Clarence Valley Aged Care 4.1
Richmond Valley 23.5% 20.2% 21.6% Hospitals 3.5
Tweed 28.4% 11.7% 21.4% Local government 2.8
NSW 37.1% 8.8% 18.8% Kyogle Beef cattle farming 10.2
Source: ABS (2016). Selected occupations only Hospitals 4.3
Supermarkets 2.8
There were significant changes from the 2011 Lismore Hospitals 6.1
census. Ballina labourers fell from 18.9% to 10.5% Other social assistance 3.5
and trades, technical and drivers up 8% to 18.2%.
Aged Care 2.9
The proportion of Byron Shire labourers halved
Richmond Valley Meat processing 7.1
between 2011 and 2016 and trades, technical and
Aged Care 4.0
drivers were up by 7% points. Lismore and Tweed
trades, technical and drivers were up 6% from 2011, Hospitals 3.0
while labourers fell by 5% points. This may be due to Tweed Hospitals 4.4
the increasing urbanisation of these areas resulting Aged Care 4.0
in more professional roles. Supermarkets 3.0
Source: ABS (2016). Selected industries only top 3 responses in each
Table 6 shows the top three employment sectors in region. Percentage of employed adults
each LGA. Agriculture and manufacturing continue
to be an important employer in Kyogle and
Richmond Valley. In Byron Shire the tourist industry
2.5 Social disadvantage
dominates. Hospitals are the only industry significant A widely-used measure of social disadvantage is the
larger employer type in each of the LGAs, though Australian Bureau of Statistics’ SEIFA (Socio
aged care is a strong employer in all areas except Economic Index for Areas) data. The most recent
Byron Shire and Kyogle LGAs. analysis is based on the 2016 census and was
published in March 2018. It is shown for the
NSW had an unemployment rate of 6.3% at the time Northern Rivers region in Figure 6.
of the 2016 census, with the average being
noticeably higher at 7.5% in the Northern Rivers
region. Rates in 2016 varied considerably from a low
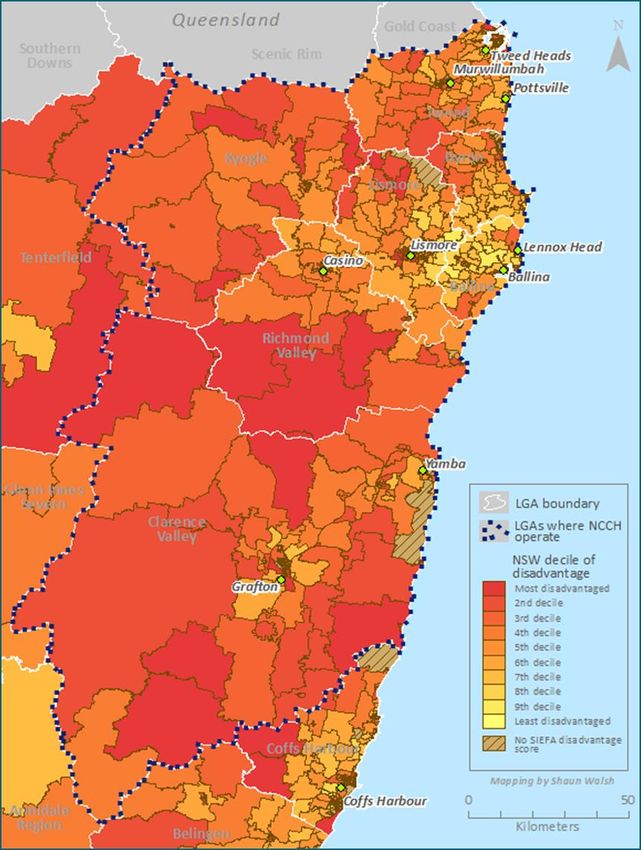
22Figure 6: Northern Rivers SEIFA scores, 2016 23
The ‘Index of relative disadvantage’ is the measure      Figure 7: Lismore SEIFA scores, 2016
shown based on a range of information about the
economic and social conditions of people and
households within an area. A low score indicates
relatively greater disadvantage such as many
households with low income, many people with no
qualifications, or many people in low skill
occupations.

Scores are grouped in 10 categories (deciles) in this
case across NSW. Hence a score in the first decile
(red) indicates the area is within the top 10% of
disadvantaged areas in NSW. Figure 6 shows the
least disadvantaged areas clustered around Ballina
and Lennox Head, as well as close to Coffs Harbour       From Figure 8, Casino can be seen to be a town with
and Tweed Heads. There are large areas of the most       highly disadvantaged neighbourhoods throughout
disadvantaged areas in Richmond Valley and               the township and surrounded by areas with medium
Clarence Valley LGAs.                                    disadvantage.
                                                         Figure 8: Casino SEIFA scores, 2016
Many of the most disadvantaged areas are in
regional and rural areas. These are locations where
skills are often low, and good jobs hard to find.
Neighbourhoods along the Pacific Highway spine are
better connected. Coastal areas are also attractive to
higher income, often higher educated sea-change
migrants and local retirees.
The Northern Rivers region shows a varied pattern
of advantage and disadvantage, with such areas
often in close proximity. This can be seen in more
detail on maps of the main urban settlements.

In Lismore, many of the neighbourhoods to the west
of the town centre are amongst the most
disadvantaged in the State (see Figure 7). More
advantaged areas are to the east of Lismore, and in
the areas surrounding the town.

                                                         By contrast Grafton has a more mixed pattern, with
                                                         a divide along the Clarence River and more
                                                         disadvantaged areas to the south.

24
Figure 9: Grafton SEIFA scores, 2016 Population and economic changes in the area have
also helped create a two-tier community. Some
older, wealthier residents have a longstanding
connection to place - though there is a growing
underclass who lack access to lower paid unskilled
work. Recent population growth has not always
been accompanied by a similar rise in the number of
jobs. Many of the newer jobs in the service sector
are relatively low paid. Unemployment and under-
employment may lead to social issues emerging.
The issue of social disadvantage is particularly
important to community housing providers such as
NCCH. Most new tenants taken from the social
housing waiting list have complex needs rather than
simply being in a low income group. This provides
challenges to both FACS Housing and community
housing providers.
NCCH has procedures to help tenants with complex
needs, through their own staff, often working in
partnership with local and regional not-for-profit
social service providers. This has led to strong
networks of support being built in the region,
helping build community cohesion.
The SEIFA maps show the complex socio-economic Support services
patterns in the Northern Rivers region, both in rural Steady population increases in the area are
and urban locations. Many of the towns are challenging existing social support both in terms of
relatively disadvantaged and would benefit from demand for service, as well as the variety and
urban regeneration, which could include new complexity of services needed. A barrier for
supplies of affordable housing to buy or rent. delivering outreach health support services in the
area, especially for older people, is the geographic
2.6 Regional social issues spread of clients requiring care, and the time and
cost of travelling to reach them.
There are many districts in the Northern Rivers
region where social disadvantage is in the top 40% Other identified regional barriers included a long-
of all districts across NSW. The area is characterised standing shortage of occupational therapists and
by a number of smaller towns and villages with poor physiotherapists within the public health sector in
public transport links. Lower income groups living in the Far North Coast especially. These difficulties are
areas of high social disadvantage may not be able to expected to be exacerbated as the population in the
easily and affordably travel to areas with jobs. region ages rapidly
25In the 7 LGAs in the Northern Rivers region, the
2.7 Specific housing needs highest absolute numbers of homeless people are in
Many housing and community needs are best Tweed followed by Byron Shire. Byron Shire LGA also
assessed by examining the housing needs of has the highest rate of homelessness at 104 people
particular groups, not the whole population. per 10,000, which is twice as high as the NSW rate of
50. Lismore LGA is also higher than the NSW
Older people average, and Clarence Valley and Tweed LGA close.
The composition of the population is changing.
Table 7: Homelessness 2016
Nationally, the proportion of older people in the
population is growing each year, and this trend is persons Increase 2016 Rate
per 10,000
particularly notable in parts of the Northern Rivers
2011 2016 %.
region which are favoured by retirees or older sea-
changers. Ballina 142 77 - 46 % 18.4
Byron Shire 279 327 17 % 103.6
The whole of the Northern Rivers region already has Clarence Valley 198 230 16 % 45.4
a larger proportion of older residents than the
Kyogle 21 34 62 % 38.0
average for NSW, and the proportion is particularly
Lismore 283 309 9% 71.6
high in Ballina, Clarence Valley, Kyogle and Tweed
Richmond Valley 69 73 6% 32.0
LGAs. For older residents in rural areas of Clarence
Valley and Kyogle, provision of services is Tweed 308 444 44 % 48.6
challenging. Northern Rivers 1,300 1,494 15 %
NSW 27,479 37,715 37 % 50.4
Older people in private rental accommodation are
Source: ABS (2016)
particularly vulnerable. Many have fixed or limited
incomes and are unable to afford regularly rising The pattern of homelessness across the Northern
rents. Others experience housing crises when a Rivers region is shown in Figure 10. Areas coloured
partner die. green are above the NSW rate of homelessness.
People classified as homeless increased from 1,300
Homeless people in 2011 to 1,494 in the Northern Rivers region. This
Census data for 2016 is included in Table 7. The most is a significant increase, with the biggest increases in
recent census saw a sharp increase in the national Kyogle and Tweed LGAs, while in Ballina LGA the
homelessness totals from 102,439 in 2011 to number of homeless people fell.
116,427 in 2016. NSW saw one of the fastest rates of
increase, from 27,479 to 37,715. Homelessness figures in Table 7 includes all people
classed as such by ABS. Reviewing figures for just
Homelessness figures include people living in rough sleepers - i.e. people living in improvised
different forms of shelter. In NSW in 2016 the largest dwellings, tents, or sleeping out - there were 483 in
categories were living in severely overcrowded the Northern Rivers region in 2016. This represents
dwellings (44.6%), living in boarding house (18.2%), 18.7% out of the total 2,584 rough sleepers across
accommodated in specialist homelessness NSW. By contrast the region has only 3.9% of the
accommodation (15.5%) and ‘couch surfing (14.2%). population of NSW. Hence there is a clear over-
One of the smallest categories was rough sleeping or representation of rough sleepers in the Northern
living in tents (6.7%). Rivers region.
26Figure 10: Homelessness, 2016 27
Overcrowding                                                dwellings. Some 34,000 dwellings have 2 spare
Overcrowding represents a serious problem in NSW            bedrooms, 11,298 have 3 spare bedrooms and 1,684
and Australia and the ABS defines residents of              have 4 spare bedrooms.
severely crowded dwellings as being homeless.
These are dwellings which require 4 or more extra           People living in alternative dwellings
bedrooms. The largest increase in NSW                       Traditionally residential parks, caravan parks and
homelessness figures in the 2016 census was of              holiday villages have been significant sources of
people living in severely overcrowded dwellings.            lower cost housing, particularly in coastal areas.
                                                            These alternative housing options have been
Table 8: Housing suitability                                threatened by increasing competition for land from
                         Over-   Appropriately     Under-   sea-change migrants and use for tourism purposes.
                      occupied       occupied    occupied   Consequently, many residents are vulnerable.
Ballina                    2%            15%         83%
                                                            Some people live in caravans as homes of ‘last
Byron Shire                4%            22%         74%
                                                            resort’ because they cannot secure rental housing
Clarence Valley            3%            16%         81%
                                                            due to poverty or a poor rental history. Many
Kyogle                     4%            18%         79%
                                                            residents of residential parks own their own mobile
Lismore                    3%            19%         78%    home, but under existing arrangements its site is
Richmond Valley            3%            18%         79%    rented. Homelessness can occur if the park is closed
Tweed                      3%            19%         79%    for redevelopment, and FACS Housing has arranged
Source: ABS (2016).                                         to provide emergency assistance to people in this
                                                            situation.
ABS use the Canadian National Occupancy Standard
based on the Census question 'number of bedrooms'
and the reported relationships between residents of
                                                            2.8 Aboriginal residents
the dwelling. Table 8 uses this definition to               Figure 11 shows the proportion of Aboriginal and
determine whether properties are overcrowded,               Torres Strait Islander people compared to the total
appropriately occupied or under-occupied. Under             population. The NSW average is 3.2%, with areas on
3% of dwellings in the Northern Rivers region are           the map coloured orange/brown which are at a
over-occupied, with 2,416 needing one extra                 higher rate. Most areas have more Aboriginal people
bedroom, 425 needing two extra bedrooms and 115             than the state average, with the townships of
needing three or more.                                      Grafton and Casino having between 9% and 10%.

Byron Shire has the largest proportion of over-             Aboriginal people face a number of social and
occupied and appropriately occupied compared to             economic challenges in the North Coast region, as in
the other LGAs. Of interest is that over three              the rest of Australia. These include worse health and
quarters of homes in the Northern Rivers region are         education outcomes, and discrimination in the jobs
under-occupied, amounting to over 82,000                    and private rental housing market.

28
Figure 11: Aboriginal residents, 2016 29
3 Housing Markets

                    South Road, Moorabbin. 97 homes
                                 Housing First (2011)
Housing supply in the region has failed to keep than the NSW average. This a more pronounced
pace with demand, both in terms of numbers of feature of the more rural areas such as Kyogle and
new properties and particularly the availability Clarence Valley LGAs. Levels of outright ownership
of smaller, more affordable homes have marginally increased since 2011, which is
against the trend in metropolitan Sydney where
there is an increasing share of mortgage payers.
3.1 Housing types and tenure
The proportion of home owners with a mortgage has
The region has a relatively traditional housing stock, remained steady or increased slightly since 2011.
dominated by detached houses. This type of housing Interestingly, the rise in both categories of owner
is most common in the inner highlands and some occupation has been at the expense of private
coastal areas away from the larger centres. It rentals. In Tweed LGA, for example, the proportion
represents up to 96% in Kyogle LGA, 87% in Clarence of private renters fell from 26.1% in 2011 to 24.9% in
Valley and 84% and Richmond Valley. 2016. This indicates a squeeze on the availability of
Table 9 shows that attached homes and apartments all types of rental, not just social rentals - which are
comprise a much higher proportion of housing in the at a lower level in the Northern Rivers region than
more urban areas of Ballina (27%) and Tweed (31%) across NSW.
compared to 11% in rural Clarence Valley. The proportion of social housing compared to total
dwellings continues to decline, as nearly all new
Table 9: Housing type, 2016
properties built are in the private sector. The biggest
Separate Attached Apart-
house house ment
Other falls in the proportion of social housing were in
Ballina (4.8% in 2011, 4.4% in 2016) and in Richmond
Ballina 69.6 % 22.4 % 5.0 % 3.0 %
Valley (4.6% down to 4.2%). This trend is seen across
Byron Shire 82.7 % 7.3 % 6.5 % 3.5 %
NSW. If the rate of decline continues at this rate the
Clarence Valley 86.5 % 5.6 % 4.9 % 3.1 %
proportion of social housing will be less than 0.5% of
Kyogle 95.7 % 0.6 % 1.8 % 1.9 % housing stock within 50 years.
Lismore 83.3 % 9.6 % 4.7 % 2.4 %
Richmond Valley 84.4 % 5.7 % 7.4 % 2.5 % Table 10: Housing tenure, 2016
Tweed 65.9 % 18.7 % 12.0 % 3.5 % Owned
Private Social
Owned with
NSW 66.4 % 12.2 % 19.9 % 0.9 % rental rental
outright mortgage
Source: ABS (2016). ‘Other’ includes mobile home, caravan, houseboat,
tent and sleeping-out Ballina 42.9 % 27.7 % 24.9 % 4.4 %
Byron Shire 38.1 % 29.7 % 30.2 % 2.0 %
‘Other’ dwellings are a mix of holiday homes and Clarence Valley 45.7 % 27.9 % 23.2 % 3.1 %
affordable accommodation such as residential parks. Kyogle 48.1 % 28.8 % 21.3 % 1.8 %
They have noticeable higher proportions than the Lismore 37.4 % 32.6 % 25.9 % 4.2 %
NSW average in all areas, but especially Tweed and
Richmond Valley 40.2 % 29.3 % 26.2 % 4.2 %
Byron LGAs. Loss of this type of accommodation to
Tweed 42.2 % 29.7 % 24.9 % 3.2 %
residential development can have a negative impact
NSW 33.5 % 33.5 % 28.1 % 4.9 %
on the stock of affordable housing.
Source: ABS (2016). ‘Social rental’ includes rented from a State Housing
Table 10 shows housing tenure in 2016. More Authority, cooperative or community housing group. All other sundry
rental types are included in the ‘private rental’ category. Table excludes
households own their properties outright in all areas ‘other’ tenure type, and ‘tenure not stated’
31You can also read