The Potential Rate Effects of Wind Energy and Transmission in the Midwest ISO Region - May 22, 2012 - Americans for a Clean Energy Grid
←
→
Page content transcription
If your browser does not render page correctly, please read the page content below
The Potential Rate Effects of
Wind Energy and Transmission
in the Midwest ISO Region

May 22, 2012

AUTHORS
Bob Fagan, Max Chang, Patrick Knight, Melissa
Schultz, Tyler Comings, Ezra Hausman, and Rachel
Wilson

Table of Contents

EXECUTIVE SUMMARY .............................................................................................................. 1

        ADDITIONAL INVESTMENTS MAY BENEFIT RATEPAYERS ...................................................... 1

        KEY FINDINGS ........................................................................................................................ 3

              Transmission-Enabled Wind Energy Leads to Reduced Electric Market Prices 3

              Transmission Expansion Has a Small Effect on Retail Rates                                                                      4
              Incremental Transmission Costs to Enable New Wind Will Be More than Offset by
              Energy Market Price Reductions                                            5

1.      BACKGROUND................................................................................................................... 7
        A. ELECTRIC POWER MARKET STRUCTURE IN THE MIDWEST / MISO MARKET AREA ..... 7

        B. ELECTRIC POWER COST COMPONENTS ........................................................................ 9

              Supply Resources: Capacity, Energy, and Ancillary Services                                                                     9

              Delivery: Transmission and Distribution                                                                                        9

2.      COST OF TRANSMISSION IN MIDWEST ELECTRIC POWER MARKETS .......... 10

        A. EXISTING TRANSMISSION COSTS ................................................................................. 10

              Midwest ISO Region                                                                                                           10

              Michigan                                                                                                                     13

        B. GENERIC COSTS AND CHARACTERISTICS OF NEW TRANSMISSION ............................ 14
              Generic Transmission Costs: EIPC                                                                                             15

              Testing the Accuracy of Generic Cost Projections in MISO                                                                     16

        C. INCREMENTAL TRANSMISSION COSTS: RETAIL RATE I MPACTS OF NEW MIDWEST
        TRANSMISSION ..................................................................................................................... 17

              MVP Costs, Revenue Requirements, and Retail Rate Impact                                                                      17

              New Transmission Above and Beyond MVP                                                                                        20

        D. CONGESTION COSTS: TRANSMISSION.......................................................................... 24

3.      RENEWABLE ENERGY ECONOMICS IN THE MIDWEST ENERGY MARKET ... 28

        A. OVERVIEW OF RENEWABLE ENERGY ECONOMICS ...................................................... 28

        B. SUPPLY-INDUCED PRICE EFFECT................................................................................. 32

        C. SPREADSHEET MODEL AND KEY INPUT ASSUMPTIONS ............................................... 35

              Description                                                                                                                  35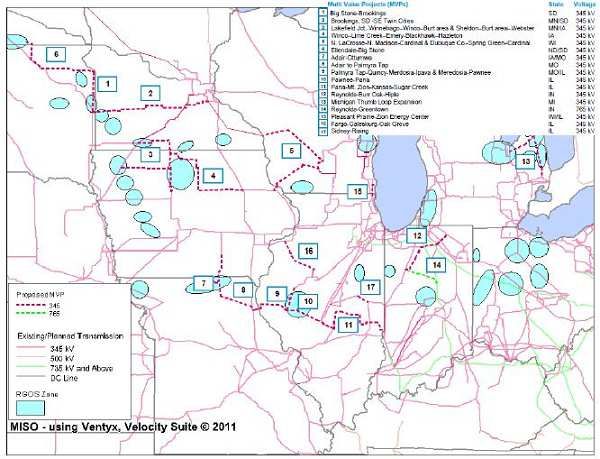
Data Sources                                                                                         38

     D. RESULTS OF SUPPLY-INDUCED PRICE EFFECT ANALYSIS .......................................... 39

     E. DISCUSSION AND INTERPRETATION OF RESULTS ........................................................ 42

4.   CONCLUSIONS & NEXT STEPS................................................................................... 45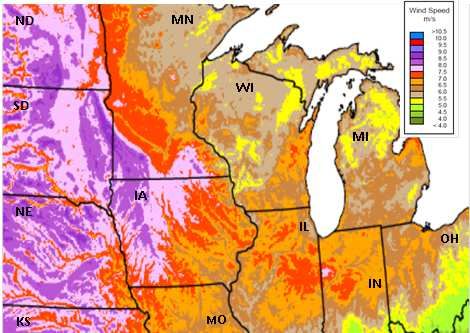
Executive Summary
Wind as an electricity supply resource has been getting steadily cheaper, and its technical
performance characteristics continue to improve as larger turbine sizes and higher hub heights
                                                                 1
capture both economies of scale and more of the passing wind. Simultaneously, the projected
cost of coal-fired power has begun to climb; the increasingly global coal market has given rise to
higher coal prices, and many existing coal plants will need to be retired or retrofitted with new
environmental controls to comply with stricter regulations being enacted by the Environmental
Protection Agency (EPA).

These trends in electricity supply costs are particularly relevant in the Midwest ISO (MISO) market
area. Today, more than half of the MISO generating capacity consists of coal-fired units. MISO
also contains effectively inexhaustible supplies of the most economic wind power available to the
nation. Over the past five to ten years, this low-cost energy resource has begun to be tapped in
ever-increasing quantities. As of December 2011, wind installed in the MISO region had risen to
10 gigawatts (GW). However, the inadequate capacity of many segments of MISO’s transmission
                                    2
grid, coupled with the inflexibility of much of the baseload incumbent generation has given rise to
operational complexities and system constraints. This leads to costly congestion and uneconomic
curtailment, or spilling, of available wind. To relieve the bottlenecks and capture the economic and
environmental benefits of more electricity from wind, investments need to be made in the region’s
                       3
transmission system.
The MISO region recently developed a new type of transmission project, labeled Multi-Value
Projects (MVPs), to address reliability, economic, and policy needs. Among other things, these
projects address congestion on the transmission system, reliability constraints, and clean energy
mandates. According to MISO, the 17 approved Multi-Value Projects (collectively, the MVP
portfolio) will provide economic benefits exceeding their costs, and will enable the delivery of at
least an additional 41 million megawatt-hours (MWh) of wind energy per year—enough to satisfy
Renewable Portfolio Standard mandates in MISO states.

Additional Investments May Benefit Ratepayers
While the MVP portfolio serves as a starting point for bolstering the MISO transmission grid,
additional wind-enabling transmission investments may also provide significant benefits to
consumers in the region. In this study, Synapse examines two related questions: 1) How would
electric market prices in MISO be affected by the addition of new wind supply—above and beyond

1
 Bolinger, Mark and Ryan Wiser, Lawrence Berkeley National Laboratory, “Understanding Trends in Wind Turbine
Prices Over the Past Decade,” October 2011. Report LBNL-5119E. See Section 3.4, page 12-15. Also see Wiser,
Ryan, Eric Lantz, Mark Bolinger and Maureen Hand, "Recent Developments in the Levelized Cost of Energy from
U.S. Wind Power Projects," February 2012. Available at http://eetd.lbl.gov/ea/ems/reports/wind-energy-costs-2-
2012.pdf.
2
  Inflexibility refers to a relatively limited ability of some generation resources to ramp up and down quickly, or to
start and stop quickly, as may be needed to balance load and supply on a system with more variable output
generation (e.g., wind).
3
  In addition to expanding the transmission system, prerequisites for capturing additional wind benefits include: 1)
flexible generation (and demand) resources to balance load with supply; and 2) highly coordinated operation across
regions and use of the best possible forecasting tools by power system controllers.

                                                     Rate Effects of Wind and Transmission in MISO            ▪1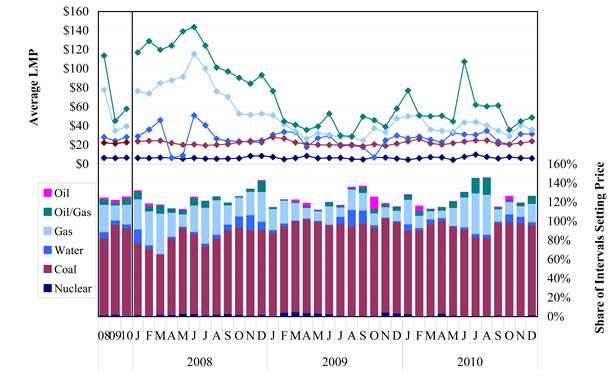
what would be enabled by the MVP portfolio? And 2) How would retail electric rates in MISO be
affected by additional transmission investments—above and beyond the MVP portfolio? Looking
at these two effects, together, provides a sense of how beneficial it might be to invest in additional
wind-enabling transmission in MISO.

Synapse’s study consists of two major components. First, we examine the downward pressure on
                                                                                     4
energy market prices associated with adding more wind power to the MISO grid. Using a
spreadsheet model developed by Synapse, we calculate the supply-induced price effect (SIPE)
that would serve to depress MISO energy market prices through the addition of wind supply to the
grid. Sensitivity analyses for this model were run across different coal plant retirement scenarios,
and different levels of wind installation.

Second, we examine the retail rate impacts associated with existing and future transmission in
MISO. The study evaluates the rate impact of existing transmission in MISO as a whole and for
one specific utility, evaluates the expected rate impact of the MVP portfolio, and estimates the rate
impact associated with three scenarios for transmission expansion above-and-beyond the MVP
projects. These scenarios—which are rough benchmarks for the cost of needed transmission –
are based in part on the “indicative transmission” portfolios reported on in MISO’s Regional
Generation Outlet Study, and represent low, medium, and high transmission expansion scenarios
for the MISO region. They are also based in part on more aggregate assessments of required
transmission resource cost for the MISO area conducted through the stakeholder-guided Eastern
Interconnection Planning Collaborative (EIPC). These scenarios represent a proxy for the cost of
transmission needed to increase the scale of wind generation connected to the grid.

It is important to note that this study does not directly address the question of “how much”
transmission will be necessary to deliver given quantities of additional wind power by a given year.
This is a planning exercise that we did not undertake, which would depend in large part on the
load and supply resource mix and locations assumed.

We note that, with good system planning, it is likely that large quantities of wind could be
integrated with low or moderate transmission investments – though still larger increases than have
been seen in the recent past. For example, to the extent that load growth can be kept to a
minimum through demand response and energy efficiency, incremental transmission need to
integrate wind is lowered (relative to a baseline with greater load growth) because a key
determinant of transmission need is peak load level. Transmission projects would still be required
to connect remote wind resources to the grid, and “backbone” investments will still be needed
across key areas of the Midwest. But unending investment cycles of extra-high voltage lines
should not be necessary, and the cumulative rate impacts should remain small. Transformation of
the supply fleet to much more flexible operation (e.g., by adding gas plants that can ramp up and
down quickly), and the presence of extensive coordination, control, and forecasting improvements
in the electric power sector could also mitigate the need for dramatically expansive levels of
transmission. Lastly, it will be important that both existing and newly-freed-up “headroom” on the
transmission grid is fully exploited.

4
 The Midwest ISO Market Monitor (Potomac Economics) recognizes and acknowledges these downward price
pressures. See the 2010 State of Market Report, page 7.

                                             Rate Effects of Wind and Transmission in MISO    ▪2
While this study does not perform the planning exercise described above, it does allow for an
evaluation of the overall rate impacts of adding new increments of transmission and new
increments of wind to the MISO system.
Key Findings
Transmission-Enabled Wind Energy Leads to Reduced Electric Market Prices
Synapse’s analysis indicates that the effect of introducing greater levels of wind resources into
MISO is to generally depress the average annual market price, relative to a baseline case of no
additional wind generation beyond the existing 10 GW in place in MISO today. Since wind energy
“fuel” is free, once built, wind power plants displace fossil-fueled generation and lower the price of
marginal supply—thus lowering the energy market clearing price.
Figure ES-1, below, illustrates the energy market price trends that arise out of Synapse’s modeling
exercise. This graph illustrates our modeled level of energy price declines in the Midwest over the
coming decades, if wind (and new transmission, as estimated in Table ES-2, below) comes online
in the quantities estimated. For each of the coal retirement sensitivity cases shown in Figure ES-1
(i.e., 3 GW, 12 GW, and 23 GW), market prices are reduced significantly as more wind is added to
the system.
For example, as seen in the 3 GW coal retirement sensitivity case (the dotted line in Figure ES-1,
below), the market price reduction in 2020 associated with a 20 GW addition to the wind resource
base (i.e., total wind increases from 10 GW to 30 GW) is roughly $14/MWh, and a 40 GW wind
5
addition leads to an average energy price decline of more than $21/MWh.
These market price declines will lead to reduced overall energy costs. For this coal retirement
sensitivity, power supply costs for MISO-region customers could range from $3.9 billion to $7.9
billion per year lower than baseline costs for the 20 GW wind addition, and from $6.1 to $12.2
6
billion per year lower than baseline costs for the 40 GW addition. These cost savings will exceed
the annual costs of transmission improvements needed to integrate this level of wind addition.
When including the effects of transmission, the net savings ranges from $3.0 billion to $6.9 billion
per year for the 20 GW wind addition scenario, and $3.3 to $9.4 billion per year for the 40 GW
wind addition scenario.
For an average MISO region residential customer using 1,000 kWh per month, this translates to a
net savings that would range from $63 to $147 per year in 2020 (for the 20 GW wind addition
scenario), and from $71 to $200 per year for the 40 GW wind addition scenario.
5
Electric energy price movements in a market such as MISO’s are composed of many complex factors, and our
model is a simplified representation of the system. While it captures the broad trends that can be expected, there is
additional analytical work required to more carefully optimize the resource expansion that would be expected if or
as the Midwest region moves towards the installation of tens of thousands of MW of additional wind resources.
6
The lower value reflects a future year assumption that MISO market price is a proxy for supply costs for 50% of
regional power supply, and the upper value assumes that the market price is a full (100%) proxy for the costs to
load.
Rate Effects of Wind and Transmission in MISO ▪3Figure ES-1. MISO Market Energy Price Decreases from Increased Wind – Supply Curve Effect
$0
Energy Market Price Reductions with Increasing Wind in MISO Region
-$5
-$10
Average Annual Price Change from Baseline, $/MWh
Modeled
Coal
-$15
Retirement
Levels
-$20
3 GW
-$25 12 GW
23 GW
-$30
-$35
-$40
-$45
-$50
-$55
0 10 20 30 40 50 60 70 80 90 100
Installed Wind Additions, GW
Synapse’s analysis suggests that ongoing wind installations across the MISO grid will continually
and inexorably exert downward price pressure on market energy prices. Energy market price
reductions will be material and pervasive, ranging initially (2012 – 2018) from $3 to $10/MWh, and
continuing to reduce energy market prices by $10 to $49/MWh by 2031, when on the order of 100
GW of wind energy could be online in the Midwest region.
Rough temporal patterns emerging from Synapse’s analysis suggest that the supply-induced price
effect from wind additions would be greatest in spring, fall, and winter, when aggregate wind plant
output is expected to be highest.
Transmission Expansion Has a Small Effect on Retail Rates
Synapse’s analysis shows that adding wind-enabling increments of transmission above-and-
beyond the MVP portfolio would have a small effect on the average electricity bill in MISO. Table
ES-1, below, shows the transmission rate impact associated with each of the studied scenarios for
the years 2015, 2021, and 2031. These transmission expansion scenarios could allow for up to
7
100 GW of additional wind energy in MISO. As shown below:
7
As we have noted elsewhere, our analysis did not attempt any form of bottom-up estimate of total transmission
need for any given amount of wind. The actual total amount of transmission needed to interconnect 100 GW of
additional wind in MISO by 2030 or thereabouts is unknown. We do note that the current Phase II portion of the
Rate Effects of Wind and Transmission in MISO ▪4• At the low end of the range, the rate impact of the MVP portfolio in 2015 is $1.0/MWh
(0.10 cents/kWh).
• At the high end of the range, the rate impact of the MVP portfolio plus Synapse’s High T
Expansion scenario in 2031 is $11.2/MWh (1.12 cents/kWh).
Table ES-1. Incremental Rate Impacts of Different Transmission Build-Out Scenarios in the Midwest
Transmission Scenario Total Cost of Transmission Rate Impact
- Cost Basis New MISO of Scenario Listed, for
Transmission Year Listed, $/MWh
“for Wind”, 2015 2021 2031
$ Billions
Current MVP Only $5.2 B $1.02 $1.64 $1.28
Current MVP + Synapse $24.2 B $1.02 $4.85 $6.52
Low T Expansion
Current MVP + Synapse $31.2 B $1.69 $5.93 $8.46
Medium T Expansion
Current MVP + Synapse $40.2 B $1.76 $6.40 $11.20
High T Expansion
Table ES-1 shows that transmission rate impacts in the near-term are modest, adding a few
8
dollars per megawatt-hour (MWh) to retail electricity bills. For perspective, total retail power rates
currently average $87/MWh in the MISO region. The largest component of that rate is energy
supply costs.
Incremental Transmission Costs to Enable New Wind Will Be More than Offset by
Energy Market Price Reductions
The energy market price effects shown in Figure ES-1 significantly offset—and often exceed—the
rate effect associated with expanding the transmission system. Table ES-2, below, lists the total
average transmission rate associated with each scenario for the years 2015, 2021, and 2031. This
total rate includes all transmission rate cost components, including costs for existing transmission
and expected MISO reliability projects. The table also shows the approximate range of wind
capacity (in gigawatts) enabled by each transmission scenario, and the approximate range of
market price reduction resulting from the wind enabled by each transmission scenario.
Table ES-2 below indicates that the price savings associated with the wind additions modeled by
Synapse exceed not only the incremental rate effect of the transmission expansion scenarios
(shown in Table ES-1), but also, in many cases, the total transmission rate associated with each
scenario.
Eastern Interconnection Planning Collaborative process will estimate this level for EIPC “Scenario 1”, which
includes MISO wind increments on the order of 100 GW by 2030, and high levels of coal plant retirement.
8
We have relied upon the MISO methodology for determining transmission revenue requirements and associated
retail rate impact for transmission addition.
Rate Effects of Wind and Transmission in MISO ▪5Table ES-2. Total Average Transmission Rates Including Build-Out Scenarios in the Midwest
Transmission Approximate Total Average Range of
Scenario - Cost Range of MISO Transmission Rate, Energy Price
Basis Region Wind $/MWh Reduction from
Enabled by 2015 2021 2031 SIPE Model,
Scenario, GW $/MWh
Current MVP Only 20-30 7.8 8.1 5.8 3-10
Current MVP + 30-50 7.8 11.4 11.1 10-33
Synapse Low T
Expansion
Current MVP + >50 8.5 12.4 13.0 >21
Synapse Medium T
Expansion
Current MVP + >70 8.6 12.9 15.8 > 29
Synapse High T
Expansion
In sum, this study suggests that adding more wind power to the grid in MISO, above and beyond
what will be enabled by the MVP portfolio, would result in the
continual decline of energy market prices and lead to lower In sum, this study suggests
electric rates for ratepayers (relative to rates in a less windy that adding more wind
electrical landscape)—even when you factor in the costs of power to the grid in MISO,
9
additional transmission. above and beyond what will
be enabled by the MVP
Moreover, the price suppression effect seen in our analysis
portfolio, would result in the
would be even greater if gas prices rise above the Energy
continual decline of energy
Information Administration’s current Annual Energy Outlook
market prices and lead to
real price projections for 2020 and 2030. Similarly, the effect
lower electric rates for
would be magnified under scenarios with large coal retirement,
ratepayers (relative to rates
since gas-fired generation would likely be on the margin for a
in a less windy electrical
greater share of market-price-setting intervals.
landscape)—even when
The results of this study cannot precisely discern the extent to you factor in the costs of
which MISO market-wide price depression arising from additional transmission.
increased use of wind resources will directly “flow through” to
load-serving entities in the region in 2020 or 2030—especially given the significant changes in
resource base expected to be in place in those out years. However, it is reasonable to assume
that much of the price effect patterns seen here would be reflected in energy costs borne by
ratepayers in the MISO region.
While this study does not address the question of “how much” transmission will be needed to
deliver additional wind in MISO, we can assume the following: To the extent load growth is
reduced by demand-side resource delivery, supply-side resource flexibility increases —and
improvements are seen in electric power sector coordination, control, and forecasting—relatively
less transmission investment is likely to be required to achieve the wind additions and associated
benefits seen in this study, compared to a “business as usual” case that does not see these gains.
9
While much attention is given to new transmission required for wind, transmission companies and planning
entities have always planned for, analyzed, proposed, and built new transmission across the region. Like all
transmission, it is part of a complex electrical network and supports delivery of energy independent of its source,
providing both reliability and economic benefits.
Rate Effects of Wind and Transmission in MISO ▪61. Background
This chapter describes broadly the Midwest ISO (MISO) region and market structure, and the
electric power cost components analyzed in this study.
A. Electric Power Market Structure in the Midwest / MISO Market Area
The electric power market structure in the upper Midwest region of the US is composed of a
combination of traditional vertically-integrated utility transactions, bilateral supply arrangements
between parties, and use of the structured energy markets of the Midwest ISO (MISO).
MISO is an independent and non-profit Regional Transmission Organization (RTO) with a scope
10
of operations that includes generation and transmission system facilities in 11 states and one
Canadian province (Manitoba). It has two sets of boundaries: one, referred to as its “market area,”
which encompasses the utility service territories of entities who are full participants in MISO’s
energy and ancillary service markets and adhere to its resource adequacy construct; and the
other, broader region (referred to as its “reliability area”) that also encompasses adjacent entities
who use MISO as their North American Electric Reliability Corporation (NERC) reliability
coordinator.
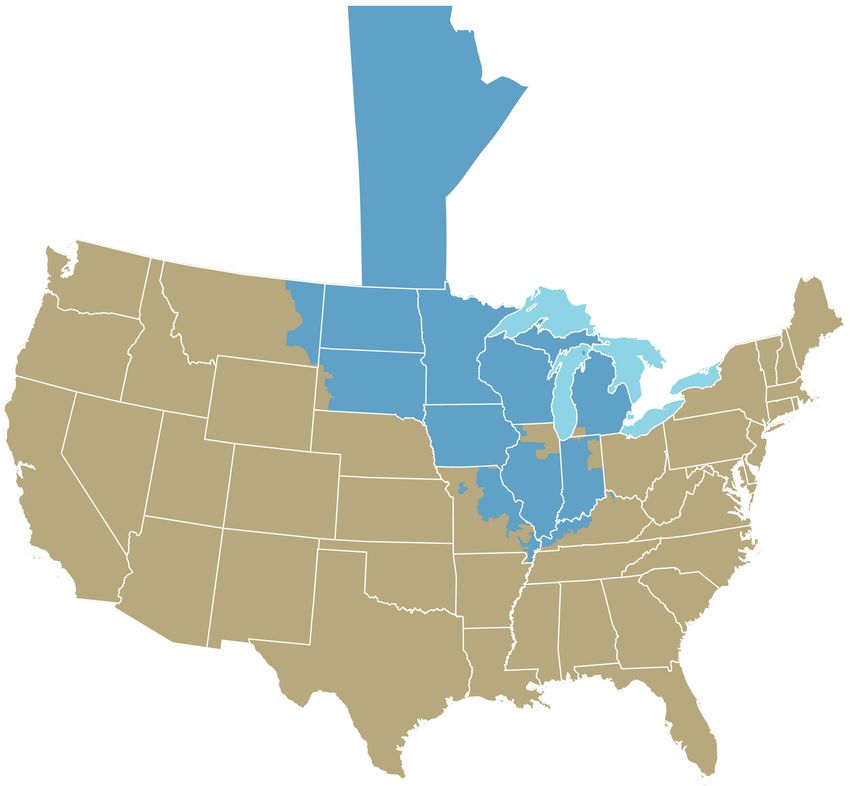
Figure 1 below shows MISO’s “market area.” As of January 2012, the MISO market characteristics
include roughly 131,000 MW (or 131 gigawatts) of generation capacity, serving a peak load of
11
roughly 100 gigawatts (GW). All power that flows on the MISO-controlled grid is subject to
MISO’s transmission tariff protocols, including its locational pricing construct for energy.
Figure 1. Midwest ISO “Market Area”
Source: Midwest ISO Fact Sheet, available at
https://www.midwestiso.org/_layouts/MISO/ECM/Redirect.aspx?ID=21100.
10
Minnesota, Wisconsin, Michigan, Iowa, Illinois, Indiana, North and South Dakota, Montana, Missouri, and
Kentucky.
11
MISO has recently seen additional entities join, and the loss of major eastern region entities First Energy and
Duke Energy Ohio and Duke Energy Kentucky. MISO’s projected peak load for 2012 for its market area is roughly
93,000 MW.
Rate Effects of Wind and Transmission in MISO ▪7Figure 2 depicts the expanded “reliability area” boundary of MISO, representing the full scope of
reach of MISO’s reliability coordination responsibilities.12 Primarily, this reliability area includes the
rest of the legacy Mid-Continent Area Power Pool (MAPP) area, including both its US regions
(primarily North and South Dakota utilities whose service territories don’t already participate in the
MISO market region) and Manitoba.
Figure 2. Midwest ISO “Reliability Area”
Source: Midwest ISO Fact Sheet, available at
https://www.midwestiso.org/_layouts/MISO/ECM/Redirect.aspx?ID=21100.
The MISO region is interconnected with wind-rich regions to its south, in Nebraska and the
13
Southwest Power Pool area , and in the PJM region to its east. The PJM region’s significant wind
resources are concentrated in its western portions, in Illinois, Indiana, Ohio, West Virginia, and
western Pennsylvania. For the purposes of the analyses contained in this report, we focus on
activities within the MISO region, but recognize the important synergies associated with its
interconnected neighboring regions.
12
Reliability coordination responsibilities include administration of the transmission tariff and responsibility for
adherence to NERC reliability standards.
13
The Southwest Power Pool region includes utility service territories in Kansas, Missouri, Oklahoma, Arkansas,
Texas, and Louisiana. Nebraska public power utilities are also participants in the Southwest Power Pool, which has
multiple levels of participation (see “SPP Footprints” for a comprehensive description of these levels, available at
http://www.spp.org/publications/SPP_Footprints.pdf).
Rate Effects of Wind and Transmission in MISO ▪8B. Electric Power Cost Components
14
The major elements of electric power costs to serve net load can be categorized into three areas:
supply, transmission, and distribution. This report is focused on the two former components,
supply and transmission.
Supply Resources: Capacity, Energy, and Ancillary Services
Supply costs reflect generation capacity (i.e., the capability to generate energy) and associated
energy production. Supply costs also include the majority of ancillary services required to maintain
electric delivery reliability. These services are broadly inclusive of “operating reserves,” or
generation capacity utilized: 1) to balance the system, 2) to provide “headroom” to account for
contingencies in the supply or delivery systems, such as forced outages of transmission or
generation equipment, and, 3) to be available during maintenance outages for generation or
transmission systems.
In the MISO region, each of these three components of supply (energy, capacity, and ancillary
services) is provided by utilities, operating within the structure of the MISO region tariff. MISO’s
spot energy market complements any bilateral procurements or self-supply of energy, and serves
as the vehicle through which all energy is dispatched in the MISO region. MISO has functioning
ancillary service markets, and has a capacity obligation requirement for all MISO load. MISO also
runs a voluntary capacity market auction, which serves primarily to balance the capacity needs of
utilities, as most capacity is secured on a bilateral basis.
Delivery: Transmission and Distribution
Transmission and distribution costs in aggregate are sometimes described as “wires charges,”
reflecting the means by which electricity is delivered from generation to load. Transmission and
distribution costs are made up of more than just wires, as a myriad of equipment and support
services are required to successfully, reliably, and economically deliver electricity to homes,
institutions, and businesses.
We address MISO region transmission costs in the next section.
Traditionally, distribution charges include all “downstream” retail activities and are regulated by
state utility commissions. Transmission charges are regulated by the Federal Energy Regulatory
Commission (FERC).
Utilities often collect additional revenues at the retail level to cover costs associated with different
regulatory policies or practices in each state. Often these costs are collected as part of the overall
revenue requirements for the distribution system. For example, recovery of utility energy efficiency
program costs, transitional costs for capacity in “deregulated” states, and state taxes are included
on utility bills, sometimes as part of distribution components of a bill, and sometimes as a separate
line item.
14
Net load refers to load served by power supplies over the transmission and distribution system. Gross load would
include load that is served by “behind the meter” generation, including photovoltaic and combined heat and power
resources.
Rate Effects of Wind and Transmission in MISO ▪92. Cost of Transmission in Midwest Electric Power
Markets
In this chapter, we examine the retail rate impacts associated with existing and future transmission
in MISO. We begin this analysis by examining the structure for transmission cost recovery within
MISO, and investigating how large of an impact transmission costs have on retail electric rates
and average electricity bills. In addition to exploring the MISO-level impacts of transmission costs,
we examine one Michigan utility, Consumers Energy, and the detailed state-level tariff in place to
recover required transmission costs.
Next, we examine “generic transmission costs,” such as those used in the recent Eastern
Interconnection Planning Collaborative (EIPC) process, and gauge the extent to which these costs
can serve to represent the cost of transmission needed in MISO to help deliver more wind to the
grid. We do so by comparing the generic EIPC costs to detailed cost information about new
transmission facilities under consideration by MISO.
We then examine MISO’s analysis of the retail rate impacts associated with the Multi-Value
Projects (MVP) portfolio, and determine the retail rate impacts for three transmission expansion
scenarios above-and-beyond the MVP projects. This is followed by a discussion of transmission
congestion costs.
A. Existing Transmission Costs
Existing transmission costs in the Midwest region are recovered by utilities through regulated tariff
structures under the oversight of different state utility regulatory commissions. Generally, the cost
of transmission is allocated to retail customer sectors in proportion to the peak load of each sector.
The peak load value used could be determined in a number of ways; for example, it could be
based on a prior year’s peak value, or on the average of peak values seen in each of the prior 12
15
months of the year. Detailed rate design mechanisms are then used, at the state level, to further
allocate each sector’s share of transmission costs to the individual customers. For example, if the
peak load of a utility is 3,000 MW and the residential sector peak load is 1,000 MW, then
residential customers are allocated one-third of the total transmission costs, usually through a
relatively simple formulation that spreads the costs over all energy consumption (kWh) of that
sector.
Midwest ISO Region
The Midwest ISO (MISO) coordinates the provision of transmission service through its Open
Access Transmission Tariff (OATT). The OATT structure is in place to ensure non-discriminatory
provision and pricing of transmission service. A utility cannot charge different amounts for
16
transmission to different customers for the same level and quantity of service. The pricing
structure of the OATT thus serves as one means to determine the cost of transmission that will
15
Since many customers, especially smaller customers in the residential and small C&I sectors, do not have
demand meters, and thus peak consumption cannot be directly measured, various means are used to estimate the
peak load allocated to those sectors.
16
This is pursuant to the original aims of Open Access Transmission Tariff formulation under FERC Orders 888
and 889 (circa 1996).
Rate Effects of Wind and Transmission in MISO ▪ 10eventually apply to all MISO customers, though those costs will be “translated” through state-level
ratemaking processes to eventually be applied to individual customers.
Another means to determine transmission costs involves a review of all state-level tariff structures
and compilation of their rates to end-use customers. (See, for example, our summary analysis of
the retail costs of electricity supply for a residential customer of Consumers Energy. This is
provided in the next section).
The bulk of transmission costs in the MISO region vary across utilities. Table 1 (below) lists the
current network transmission rates from Schedule 9 of the OATT. Schedule 9 is the “network
integration” schedule of the tariff. It serves as a useful point of comparison of transmission rates
across utilities, and as a means to estimate the average per MWh or per kWh cost of transmission
for customers within each utility.
17
As seen in Table 1, average per unit costs in 2011 range from a few dollars per MWh to as much
18
as $16/MWh, based on MISO postings and an estimate of utility load factors. These costs cover
the base transmission assets currently in place at the utilities across MISO. They do not include
the costs associated with future transmission expansion, such as the MVP portfolio, nor do they
include the costs of other services provided through MISO and required for delivery of energy,
such as ancillary services and the costs for MISO to schedule and dispatch the transmission
19
system. Those costs also flow through to retail customers and are often allocated in similar ways
as the cost of transmission itself.
17
$10/MWh is equal to 1 cent/kWh.
18
We estimate utility load factors for the purpose of determining average per MWh transmission rates. We use
MISO data on energy consumption (from Schedule 26a of its tariff posting) and peak load by utility (from the MTEP
2011 report).
19
The MISO website lists the entire set of services for which its OATT recovers costs from applicable customers.
For example, Schedule 1 (dispatch and scheduling), Schedule 2 (reactive support), Schedule 3 (regulating reserve)
and schedules 5 and 6 (operating reserves, spinning and supplemental) recover the costs for the core technical
operating requirements of the power grid. See https://www.midwestiso.org/Library/Tariff/Pages/Tariff.aspxt.
Rate Effects of Wind and Transmission in MISO ▪ 11Table 1. 2011 Midwest ISO Network Transmission Rate
MISO Transmission Owner Name 2011 Network 2011 Network Estimated Equivalent
ZONE Transmission Transmission Annual $/MWh
Rate, Rate, Load Rate at
$/MW-year $/MW-month Factor Est. Load
Factor
1 ITC Midwest $83,010 $6,918 0.60 $15.79
2A ATCLLC Madison G&E $50,620 $4,218 0.60 $9.63
2B ATCLLC Wisconsin Public Service $50,620 $4,218 0.60 $9.63
2C ATCLLC Wisconsin P&L $50,620 $4,218 0.60 $9.63
2D ATCLLC Wisconsin Energy $50,620 $4,218 0.60 $9.63
2E ATCLLC UPPC $50,620 $4,218 0.60 $9.63
3A Ameren Illinois $13,765 $1,147 0.55 $2.86
3B Ameren Missouri $11,123 $927 0.55 $2.31
5 Cinergy Services (including IMPA & $20,788 $1,732 0.58 $4.09
WVPA)
6 City of Columbia, Missouri $10,192 $849 0.55 $2.12
7 City Water, Light & Power (Springfield, $22,397 $1,866 0.55 $4.65
IL)
8 Great River Energy $56,230 $4,686 0.55 $11.67
9 Hoosier Energy $55,453 $4,621 0.55 $11.51
10 International Transmission Company $30,345 $2,529 0.57 $6.08
11 Indianapolis Power & Light $7,982 $665 0.55 $1.66
13 Michigan Joint Zone (METC, MPPA, $31,096 $2,591 0.58 $6.12
Wolverine)
14 Minnesota Power $30,476 $2,540 0.60 $5.80
15 Montana-Dakota Utilities Co. $34,321 $2,860 0.60 $6.53
16 NSP Companies $37,774 $3,148 0.55 $7.84
17 Northern Indiana Public Service $36,630 $3,052 0.60 $6.97
Company
18 Otter Tail Power $43,039 $3,587 0.55 $8.93
19 Southern Illinois Power Cooperative $24,212 $2,018 0.55 $5.03
20 Southern Minnesota Municipal Power $35,662 $2,972 0.55 $7.40
Agency
23 Vectren Energy $28,022 $2,335 0.60 $5.33
24 MidAmerican Energy Company $15,203 $1,267 0.60 $2.89
25 Muscatine Power and Water $14,811 $1,234 0.65 $2.60
26 Dairyland Power Cooperative $45,596 $3,800 0.60 $8.68
27 Big Rivers Electric Corporation $11,985 $999 0.60 $2.28
MISO Drive Through Rate $29,715.8 $2,476.3 0.6 $5.65
Source and notes: 2011 Midwest ISO Open Access Transmission Tariff, Schedule 9, Network Integration
rate. Estimated load factor based on peak load by utility, and energy withdrawal amounts from Schedule 26a.
Some utilities’ load factors estimated due to difficulty in mapping between available peak load data and
available energy withdrawal data. Computation of per MWh rate by Synapse based on the listed annual
transmission rate and the estimated load factor.
The data reflect differences that arise due to the pattern of transmission additions across the
individual service territories. When a transmission project is completed and is added to a utility’s
rate base, the short-term effect is to see a relative jump in transmission rates, reflecting the
20
economic (and physical) “lumpiness” of transmission. Utilities in the MISO region have added
20
Lumpiness refers to the fact that transmission additions are generally not made in small, discrete pieces, but
rather in a large lump. This lump of investment captures economies of scale of transmission construction and
reflects the realities of transmission planning, which requires choosing a long-lived asset to serve a potentially
increasing amount of load over its 40+ years of physical life.
Rate Effects of Wind and Transmission in MISO ▪ 12differing amounts of transmission in the recent past, and the current rate base (and ensuing rates)
will reflect these different paces of transmission addition; the different rates seen across utilities in
Table 1 illustrates just that. As we will address in the next section of this report, certain increments
of transmission (i.e., the Multi-Value Projects) will see their costs spread across all MISO utilities,
21
resulting in a more even effect on rates across all utilities compared to the “license plate” rate
effect seen with individual service territory transmission additions.
In addition to providing the network transmission rates (shown in Table 1), MISO also estimates
current average retail transmission costs, at an aggregate level. In Appendix E.3 of the 2011
MISO Transmission Expansion Plan (MTEP 2011), MISO computes an average transmission rate
of $6.20/MWh, or 0.62 cents/kWh. It uses data from the EIA’s Annual Energy Outlook (April 2011)
and its own local balancing authority load shares to determine this value. It is not clear from the
report if these costs include only pure transmission, such as is reflected in the OATT values in
Table 1 above, or if the data also include ancillary service and related MISO costs to operate the
grid. We do note that the MISO “drive through” rate of $5.65/MWH (0.56 cents/kWh), which
reflects average costs to use the existing MISO transmission grid, is lower than MISO’s Appendix
E.3 retail rate estimate, which suggests either that the retail rate estimate includes more than just
pure transmission, or is reflective of differences between EIA and MISO data collection methods
or parameter use.
Based on MISO’s data analysis, transmission costs represent 7.1% of the average electricity bill in
22
the MISO region. Individual state transmission rates vary, and MISO reports, in aggregate, a
range of costs between 5.5% and 10.3% of average electricity bills.
Michigan
Most electrical load in Michigan is served by a group of nine separate investor-owned utilities.
23
Together, these utilities sold roughly 96 million MWh in 2010. The remaining Michigan load was
served by a number of relatively smaller cooperatives, in total selling 3.3 million MWh in 2010.
Consumers Energy made about 35% of electric energy sales in Michigan in 2010, or roughly 35
24
million MWh. Its peak load was 8,190 MW in 2010.
While load in Michigan is served by several different utilities (as noted above), the bulk of
transmission service is provided by one transmission company, ITC Holdings, which operates two
subsidiary transmission companies, Michigan Electric Transmission Company (METC) and
21
“License plate” rate is the term given to a transmission cost allocation structure that is analogous to motor vehicle
license plate differences across states. Each utility’s customers are responsible for the costs of transmission within
the rate base of their own utility, but they can access the transmission grid across all of MISO without incurring
other costs (just as one can generally use the interstate and intra-state highway system across state lines without
incurring an additional motor vehicle registration fee from those other states). This is in comparison to “postage
stamp” allocation processes that would spread the costs of transmission across all users in MISO – as will be done
with the Multi-Value Project portfolio.
22
See Table E.3-2: Current MISO Retail Rate Component Share, pages 2-3 of Appendix E.3 to the 2011 MISO
Transmission Expansion Plan.
23
Statistical Data of Total Sales, Electric Utilities in Michigan, Year Ended December 31, 2010. Available at
http://www.dleg.state.mi.us/mpsc/electric/download/electricdata.pdf, page 1.
24
Schedule E-4, page 1 of 2, “Maximum Demand MW”, Exhibit A-10 (LDW-4) in the rate case, Case No. U-16794
before the Michigan Public Service Commission.
Rate Effects of Wind and Transmission in MISO ▪ 13International Transmission Company (ITC). MECT operates in the Consumers Energy service
territory, and ITC operates in the Detroit Edison service territory.
To demonstrate the role that transmission costs play in overall electricity bills, we provide a
summary analysis of the retail costs of electricity supply for a residential customer of Consumers
Energy, including the costs of transmission provided to Consumers Energy’s customers from
Michigan Electric Transmission Company. The results of this analysis are presented in Table 2.
Table 2. Consumers’ Energy Supply, Transmission, and Distribution Costs
Rates, cents/kWh Customer Monthly kWh Consumption
250 500 1000
Fixed Charge 2.4 1.2 0.6
Power Supply 7.3 7.3 7.3
Transmission 0.6 0.6 0.6
Anc Svc / Disp 0.2 0.2 0.2
Total Transmission/AncSvc/Disp 0.8 0.8 0.8
Distribution 3.4 3.4 3.4
Total Rate 13.9 12.7 12.1
Bills, $/Month
250 500 1000
Fixed Charge 6.00 6.00 6.00
Power Supply 18.14 36.28 72.57
Transmission 1.53 3.06 6.12
Anc Svc / Disp 0.55 1.09 2.19
Total Transmission/AncSvc/Disp 2.08 4.15 8.31
Distribution 8.62 17.24 34.48
Total 34.84 63.68 121.36
Transmission - Share of Bill 4.4% 4.8% 5.0%
Sources/Notes: Comparison of Monthly Residential Bills for MPSC-Regulated Michigan Electric Utilities,
December 1, 2011. Consumers Energy Tariff for Residential service, MISO Schedule 9 transmission tariff.
The table reconciles the information available from the MPSC, Consumers Energy, and the Midwest ISO to
arrive at a final estimate of the rough breakdown between supply, transmission, and distribution costs for a
Consumers Energy residential ratepayer.
As seen in the table above, transmission represents a relatively small share of the total costs for a
Consumers Energy customer—ranging from 4.4 to 5.0%. The above table also corresponds
roughly with the retail “share of transmission” costs determined by MISO and presented in their
25
MTEP 2011 report appendix. That appendix showed a 4.5% share for transmission as a
percentage of retail bills for the RFC-MI EIA Study Region.
B. Generic Costs and Characteristics of New Transmission
Increasing the delivery of renewable energy often, but not always, requires at least some new
26
transmission. Sometimes that new transmission is only what is needed to connect a new
25
Appendix E.3 of the 2011 MISO Transmission Expansion Plan, Table E.3-2, page 2.
26
While the term “new transmission” often connotes new right of way (ROW) and towers and lines, and extensive
regulatory delay and disagreement over cost allocation, it is important to remember that there are times when
Rate Effects of Wind and Transmission in MISO ▪ 14resource (e.g., wind farm) to the nearest point of interconnection with the regional transmission
grid. Other times, such as has been seen in certain areas of the Midwest (e.g., the Buffalo Ridge
27
region of southwestern Minnesota / eastern South Dakota / northwestern Iowa) new “outlet”
transmission is needed to increase the bulk capability of the backbone transmission grid. Lastly,
increases in larger region-to-region capacity could be required to deliver large amounts of wind
28
from the Midwest to points east.
The cost of new transmission lines and ancillary equipment depends on a number of factors,
including the length of the line, the voltage level, whether it is in an existing or new right of way,
and the nature of the ancillary equipment required to interconnect a new line. Such ancillary
equipment includes the substations that serve as the termination or through point for any given
transmission line, and the equipment contained in those substations (e.g., circuit breakers,
transformers, reactive support equipment, metering, etc.). New transmission capacity can also be
obtained through thermal upgrade (i.e., new conductors) of existing transmission circuits, at lower
cost than a new circuit in a new or existing right of way. Other types of incremental improvements
to existing transmission circuits can lead to increased capacity, for example through improvements
to reactive power attributes of transmission lines, such as installation of series compensation or
shunt capacitance. Lastly, changes to network configurations (e.g., substation bus reconfiguration)
or operational changes such as selective use of Special Protection Systems (SPS) can increase
the rated capacity of a transmission circuit and enable greater power transfers even without
adding new transmission conductors.
Generic Transmission Costs: EIPC
One example of “generic” transmission costs, which are developed for the purpose of estimating
certain project costs or scenarios, comes from the Eastern Interconnection Planning Collaborative
(EIPC). EIPC has developed many scenarios of transmission build-out plans for the eastern US.
These scenarios are based on future potential policies including a “Business as Usual” scenario
and others with varying degrees of environmental regulation, including federal carbon regulations
and a federal renewable portfolio standard (RPS). EIPC subjects these scenarios to sensitivities
on reliability, production costs, and load growth (among others).
Table 3 below shows EIPC’s assumptions for transmission costs stated as dollars per mile by
amount of voltage as a national average.29 It also shows the multipliers EIPC develops to generate
relatively smaller increments of transmission capacity increase can be achieved quickly, at low cost, and with fewer
headaches than is seen with new ROW transmission.
27
See for example the Regional Generation Outlet Study, and related materials, on the Midwest ISO website.
28
The existing grid delivers supply to load. In the Midwest, as in many regions of the country, much of the supply is
coal – which under a number of near-term future scenarios will garner smaller shares of the total electrical energy
supply. This departure leaves room on the grid for substitute sources of energy – especially wind and natural gas.
The transmission grid does not have to be rebuilt in order to serve increasing amounts of wind energy in the
Midwest – it needs to be expanded in some locations, but from a technical perspective, the transmission itself is
indifferent to the source of the power it carries. Especially if peak transmission load requirements can be minimized
(through energy efficiency, demand response, and local peaking resources) the amount of new transmission
needed can also be reduced, in some instances quite dramatically.
29
We use EIPC transmission costs because they are recent, transparent, public, and broadly representative of the
types of transmission equipment that will be needed to integrate more Midwest region wind. Other sources exist,
such as that used for the Eastern Wind Interconnection and Transmission Study (EWITS) and the Joint Coordinated
System Plan (JCSP) study of increased transmission needs for wind delivery.
Rate Effects of Wind and Transmission in MISO ▪ 1530
costs by NEEM region, of which there are six in MISO. Applying the low and high ranges of these
multipliers to the average cost per mile produces a low and high range of region-specific costs for
transmission projects in MISO.
Table 3. EIPC Transmission Cost Assumptions by NEEM Region
MW Base Cost
Voltag # of Capability MISO_ MISO_ MISO_ MISO_ MISO_
e (kV) Circuits IN MI MO_IL W WUMS
Cost per Mile Regional MultipliersWe observe the following with respect to new transmission costs in the Midwest region:
• Generally, the generic costs (such as those used in the EIPC process) are reasonable
indicators of transmission costs, given the costs of MISO MTEP 2011 transmission
projects.
• Usually, higher voltage transmission is more cost-effective, because it can deliver more
megawatts of transfer capacity per dollar of transmission expenditure than lower
transmission voltages. This is a result of basic economies of scale. However, if the
presence of higher voltages is not already in place in a given region, introducing the high-
voltage lines will require building out a basic infrastructure to support such large lines, and
may require significant reinforcement of lower-voltage facilities in nearby regions. This
effect can offset the technical economies of scale seen with the higher voltage facilities,
and is an artifact of the networked nature of the electrical transmission grid.
C. Incremental Transmission Costs: Retail Rate Impacts of New
Midwest Transmission
MVP Costs, Revenue Requirements, and Retail Rate Impact
In this section we examine the retail rate impacts associated with MISO’s approved Multi-Value
31
Projects portfolio. The MVP portfolio consists of a collection of 17 high-voltage projects, one at
32
765 kV, and sixteen at the 345 kV voltage level. These projects will better knit together the
existing transmission grid in the MISO region and allow for delivery of greater levels of wind
energy to the MISO grid. MISO states that the completion of all of the projects in the portfolio
(estimated for 2018) will allow for the delivery of an additional 41 million MWh/year of renewable
energy.33 Depending on loading conditions in the region, and supply resources in place in 2018,
the MVP portfolio completion could allow for delivery of more than this base amount. The MVP
portfolio serves as a starting point for a bolstered MISO grid by strengthening the weakest links in
the region, and allowing for concentrations of wind energy to be delivered to the broader grid, for
ultimate delivery (along with other supply resources) to MISO region customers. According to
34
MISO, the MVP portfolio will enable access to low-cost energy.
Our analysis of retail rate impacts starts with the findings presented in Appendix E.3 of the MTEP
2011 draft report. The MISO retail rate impacts inform our analysis of retail rate impacts
associated with this report’s transmission scenarios, which include transmission expansion
beyond the MVP portfolio and MISO’s projected baseline reliability upgrades.
31
Detailed information on the MVP portfolio is available at
https://www.midwestiso.org/Planning/Pages/MVPAnalysis.aspx.
32
MTEP 2011, page 45-46.
33
MTEP 2011, page 3. 41 million MWh of wind energy at an average of 35% capacity factor equates to roughly
13.4 GW of installed wind capacity.
34
See, for example, Midwest ISO, MVP portfolio summary posting concerning defined renewable energy zones.
“When connected to the overall grid by the MVP projects, the zones will enable access to low cost energy for the
entire MISO footprint”. October 25, 2011.
https://www.misoenergy.org/Library/Repository/Communication%20Material/Power%20Up/Transmission%20Planni
ng%20MVP.pdf.
Rate Effects of Wind and Transmission in MISO ▪ 17MISO analyzed the total retail rate impacts of four energy policy scenarios. MISO’s total rate
analysis included examination of transmission costs and the other major components of electricity
bills: supply resources (generation) and distribution costs. In this way, MISO was able to estimate
the fraction of customer bills that will go towards transmission support once the MVP portfolio
installation is complete. These policy scenarios are as follows:
• Business as Usual: Mid-low demand and energy growth (BAU Mid-Low). Under this
scenario, MISO assumes that energy growth follows a growth rate of 0.7 percent. This
scenario assumes that MISO will experience a slow recovery from the economic
downturn. It also assumes little to no change in resource adequacy, renewable mandates,
and environmental legislation.
• Business as Usual: Historical demand and energy growth (BAU Historical). Under this
scenario, MISO assumes that energy growth follows a growth rate of 1.33 percent. This
scenario assumes that MISO will experience a more rapid recovery from the economic
downturn. This scenario also assumes little to no change in resource adequacy,
renewable mandates, and environmental legislation.
• Carbon Constraint: Under this scenario, MISO assumes that energy growth follows a
growth rate of -0.06 percent. However, in this scenario, MISO further assumes a declining
cap on future CO2 emissions based on the Waxman-Markey bill. MISO assumes for its
2026 rate impact analysis that there is a 25 percent target reduction.
• Combined Energy Policy: Under this scenario, MISO modeled the combined impacts
associated with smart grid penetration that would lower demand growth, coupled with
higher electric vehicle penetration that would increase energy growth and off-peak energy
usage. Under this scenario, MISO assumes an energy growth rate of 0.56 percent
(consistent with the BAU Historical scenario).
The four policy scenarios result in different projections of “energy served values” in 2026, which
are the denominator for calculating rate impacts, since the MVP portfolio will be paid for using a
“postage stamp” allocation process that would spread the costs of transmission across all users in
MISO. For our additional transmission alternatives analysis, we assumed the same energy served
projections used by MISO in their BAU Mid-Low policy scenario.
Under each of the four policy scenarios, MISO assumed the same 2026 revenue requirements for
the following rate components:
• MISO Existing Transmission: 2026 revenue requirement of $1.670 billion in 2011$35
• Proposed MVP Portfolio: 2026 revenue requirement of $1.045 billion in 2026$.
• MISO Existing Resources Capital Recovery: 2026 revenue requirement of $6.384 billion in
36
2011$
• Distribution: MISO assumes a distribution adder of 2.6 cents/kWh in its analysis.
35
Based on email exchange with MISO, the values presented in TablesE.3-8 and E.3-11 are in 2011$, although
labeled in the draft report as 2026$.
36
Ibid.
Rate Effects of Wind and Transmission in MISO ▪ 18The other components of MISO analysis vary based on its policy scenario assumptions as noted
above.
The following table summarizes the MISO-estimated retail rate impacts of the MVP transmission
alternative, for each of their four policy scenarios.
Table 5. MISO Rate Impacts for the MVP Portfolio
MTEP 2011 Scenarios
Year/ Category BAU Mid-Low BAU Historical Carbon Combined Energy
Demand & Demand & Constraint Policy
Energy Growth Energy Growth
MISO Energy Served (MWh)
2011 533,879,900 533,799,100 533,646,300 533,532,600
2026 592,765,700 650,439,800 528,947,100 580,162,000
Revenue Requirements (2026$ unless noted)
Proposed MVP Portfolio $1,045,330,421 $1,240,912,795 $1,045,330,421 $1,240,912,795
Future Reliability Requirements $1,758,130,148 $1,758,130,148 $1,758,130,148 $1,758,130,148
MISO Existing Transmission $1,670,449,654 $1,670,449,654 $1,670,449,654 $1,670,449,654
(2011$)
Production Costs $12,768,400,000 $20,674,200,000 $16,339,400,000 $20,522,400,000
New Resource Investment $5,470,200,000 $7,284,700,000 $5,109,400,000 $7,220,700,000
Fixed O&M $14,136,000,000 $18,656,900,000 $15,416,200,000 $24,894,600,000
MISO Existing Resources Cap. $6,384,800,464 $6,384,800,464 $6,384,800,464 $6,384,800,464
Rec. (2011$)
Retail Rate (Cents/kWh 2011$)
Proposed MVP Portfolio 0.14 0.12 0.15 0.14
Future Reliability Requirements 0.30 0.27 0.33 0.30
MISO Existing Transmission 0.28 0.26 0.32 0.29
(2011$)
Total Transmission 0.71 0.65 0.80 0.73
Production Costs 1.66 2.07 2.38 2.30
New Resource Investment 0.71 0.73 0.75 0.81
Fixed O&M 1.84 1.87 2.25 2.79
MISO Existing Resources Cap. 1.08 0.98 1.21 1.10
Rec. (2011$)
Total Generation 5.29 5.64 6.59 7.00
Distribution 2.61 2.61 2.61 2.61
Total Retail Rate 8.62 8.90 10.00 10.34
Inflation Rate 1.74% 2.91% 1.74% 2.91%
2026$ to 2011$ Factor 0.772 0.650 0.772 0.650
Notes: Information based on Appendix E3. Values in 2011$ based on email from Jeremiah Doner dated
October 25, 2011
Overall, the retail rate impact from MISO’s MVP portfolio and associated supply assumptions over
the four policy scenarios range from 8.62 to 10.34 cents/kWh, with the transmission component
ranging from 0.65 to 0.80 cents/kWh or seven to eight percent of the overall retail rate impact.
These results suggest that MISO’s proposed transmission build–out, including the approved MVP
Rate Effects of Wind and Transmission in MISO ▪ 19You can also read