HOUSING COST REPORT 2020 - FOR GERMANY IW Survey - ACCENTRO Real Estate AG
←
→
Page content transcription
If your browser does not render page correctly, please read the page content below

HOUSING COST REPORT 2020
FOR GERMANY

                                                          IW Survey
 An Analysis of Rents and Owner-Occupied-Housing Costs in 401 Districts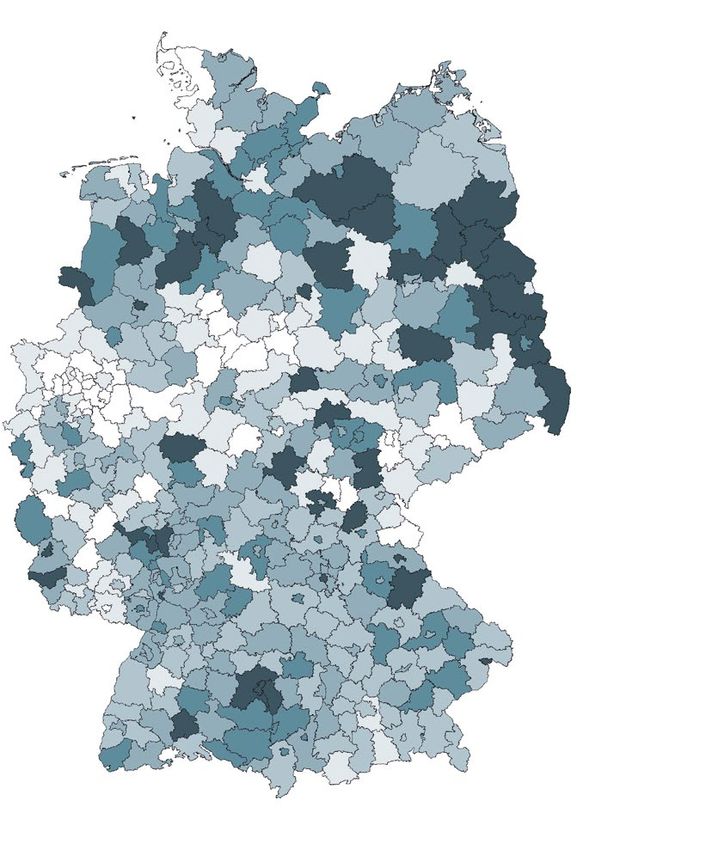
ACCENTRO Housing Cost Report 2020

                                                                         CONTENT

                                                                         Summary . . . . . . . . . . . . . . . . . . . . . . . . . . . . . . . . . . . . . . . . . . . . . . . . . . . . . . . . . . . . . . . . . . . . . . . . . . . . 5

                                                                         1 Introduction . . . . . . . . . . . . . . . . . . . . . . . . . . . . . . . . . . . . . . . . . . . . . . . . . . . . . . . . . . . . . . . . . . . . . . 6

                                                                         2 Implications of the Coronavirus Pandemic . . . . . . . . . . . . . . . . . . . . . . . . . . . . . . . . . . . . . . . . . . 7

                                                                         3 Owner-Occupied-Housing Costs . . . . . . . . . . . . . . . . . . . . . . . . . . . . . . . . . . . . . . . . . . . . . . . . . . 10
ACCENTRO HOUSING COST REPORT 2020
An Analysis of Rents and Owner-Occupied-Housing Costs in 401 Districts         3.1        Notes on the Methods Used . . . . . . . . . . . . . . . . . . . . . . . . . . . . . . . . . . . . . . . . . . . . . . . . 10

IW Survey compiled for ACCENTRO Real Estate AG                                 3.2        Findings for Germany . . . . . . . . . . . . . . . . . . . . . . . . . . . . . . . . . . . . . . . . . . . . . . . . . . . . . 13
by Prof. Dr. Michael Voigtländer & Pekka Sagner
                                                                               3.3        Findings for the “Big Seven” Cities . . . . . . . . . . . . . . . . . . . . . . . . . . . . . . . . . . . . . . . . . . 14

                                                                               3.4        Digression: Berlin’s Rent Cap . . . . . . . . . . . . . . . . . . . . . . . . . . . . . . . . . . . . . . . . . . . . . . . 17
ACCENTRO Real Estate AG
Kantstrasse 44/45                                                              3.5        Findings for Germany’s Counties and Independent Cities . . . . . . . . . . . . . . . . . . . . 18
D-10625 Berlin
Phone: +49 30 887 181 0                                                        3.6        Interest Rate Sensitivity . . . . . . . . . . . . . . . . . . . . . . . . . . . . . . . . . . . . . . . . . . . . . . . . . . . . 20
mail@accentro.ag
www.accentro.ag                                                                3.7        Annuity Trend and Level . . . . . . . . . . . . . . . . . . . . . . . . . . . . . . . . . . . . . . . . . . . . . . . . . . . 21

                                                                         4 Private Landlords . . . . . . . . . . . . . . . . . . . . . . . . . . . . . . . . . . . . . . . . . . . . . . . . . . . . . . . . . . . . . . . 24

Institute for Economic Research (IW)                                           4.1        Relevance of Private Landlords for the German Rental Housing Market . . . . . . . . 24
PO Box 10 19 42
D-50459 Cologne                                                                4.2        Percentage and Number of Private Landlords . . . . . . . . . . . . . . . . . . . . . . . . . . . . . . . . 26

Prof. Dr. Michael Voigtländer                                                  4.3        Financial Situation of the Private Landlords . . . . . . . . . . . . . . . . . . . . . . . . . . . . . . . . . 27
Phone: +49 221 / 4981 - 741
voigtlaender@iwkoeln.de                                                  5 Conclusion . . . . . . . . . . . . . . . . . . . . . . . . . . . . . . . . . . . . . . . . . . . . . . . . . . . . . . . . . . . . . . . . . . . . . 31

Pekka Sagner                                                             6 Bibliography . . . . . . . . . . . . . . . . . . . . . . . . . . . . . . . . . . . . . . . . . . . . . . . . . . . . . . . . . . . . . . . . . . . . 32
Phone: +49 221 / 4981 - 881
sagner@iwkoeln.de                                                        List of Tables . . . . . . . . . . . . . . . . . . . . . . . . . . . . . . . . . . . . . . . . . . . . . . . . . . . . . . . . . . . . . . . . . . . . . . . 33

                                                                         List of Figures . . . . . . . . . . . . . . . . . . . . . . . . . . . . . . . . . . . . . . . . . . . . . . . . . . . . . . . . . . . . . . . . . . . . . . 33

Cologne, 26 May 2020                                                     Annex . . . . . . . . . . . . . . . . . . . . . . . . . . . . . . . . . . . . . . . . . . . . . . . . . . . . . . . . . . . . . . . . . . . . . . . . . . . . . 34

                                                                                                                                                                                                                                       3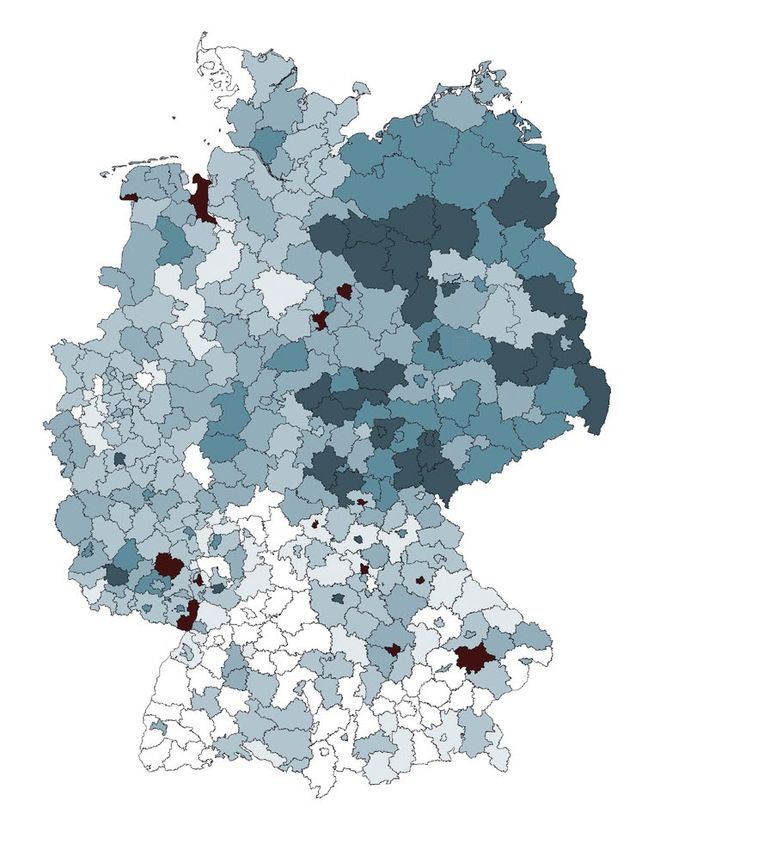
ACCENTRO Housing Cost Report 2020

                                                  SUMMARY

                                                  The user cost approach makes it possible to compare rental costs with the recurrent costs borne by home-
                                                  owners. The approach is used to determine the relative economic benefit of owning your home outright
                                                  versus renting your home.

                                                  The drop in interest rates on mortgage loans caused the running costs for homeowners to decline between
                                                  2018 and 2019. In nearly all German districts, the cost burden is lower for owner-occupiers than it is for
                                                  tenants. The declining interest rates lowered not just the running costs of owners relative to those of ten-
                                                  ants, but in many cases also reduced the annuities to be paid on real estate financing arrangements. Al-
                                                  though selling prices for residential property have continued to go up, their upward growth was slower
                                                  than the downtrend in interest, so that the financing volume associated with the acquisition of real proper-
                                                  ty has been reduced, and often substantially so.

                                                  The economic implications of the coronavirus crisis and the associated threats to the housing market do not
                                                  have the same relevance in every region. Especially in southern Germany, the risks that residential proper-
                                                  ty prices will have to be adjusted seem very high, making it the first region where expectations may have to
                                                  be revised. The exact opposite is true for eastern Germany, where rent hikes—and therefore price hikes—
                                                  are likely.

                                                  Due to financial worries associated with the threat of collection losses for landlords, this year’s survey will
                                                  also take a look at private landlords in Germany. The percentage and number of private landlords has gone
                                                  up significantly in recent years, making it safe to conclude that many German households took advantage
                                                  of the favourable terms of financing in recent years. The analysis also shows that a large percentage of the
                                                  private landlords generate only negligible rental income from letting their properties. Collection losses
                                                  due to the coronavirus pandemic could expose this group, which is an important one for Germany’s rental
                                                  housing market, to severe financial hardships.

4   Survey compiled for ACCENTRO Real Estate AG                                                                                                             5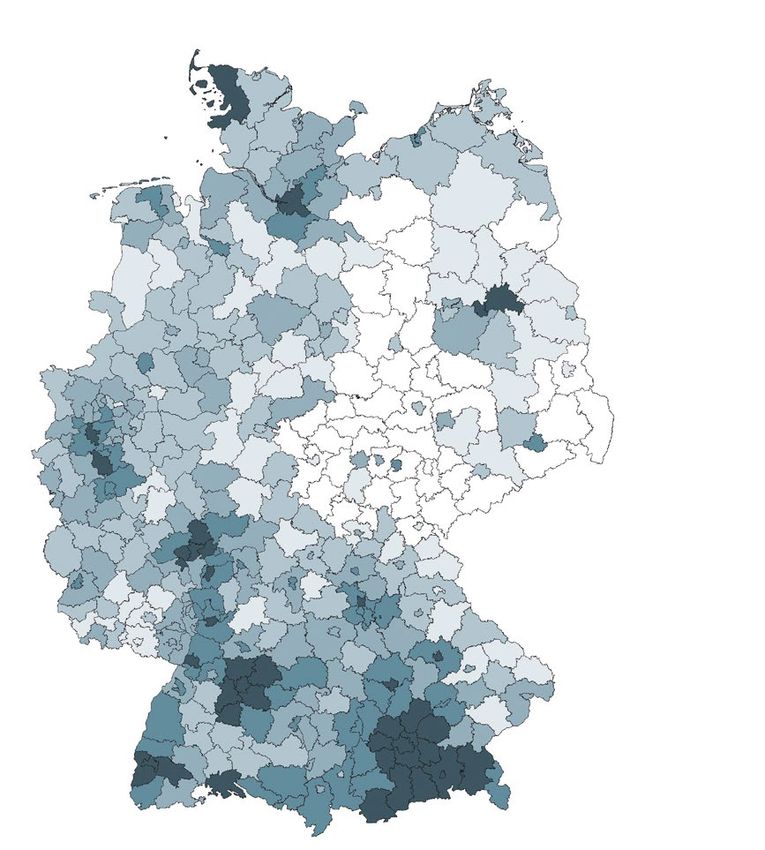
ACCENTRO Housing Cost Report 2020
1 INTRODUCTION 2 IMPLICATIONS OF THE CORONAVIRUS PANDEMIC
The ACCENTRO Housing Cost Report is now out in its fifth edition. As in previous years, it seeks to answer So far, the media have considered the user cost approach applied here as a good way to check whether
the question what is more affordable in Germany: renting your home or owner-occupying it? The question buying is cheaper than renting. There is principally nothing wrong with that, but as we have always point-
is important not just from the perspective of the individual, but also permits conclusions concerning the ed out, the user cost approach also enables you to identify over- and under-valuations. It is safe to say, a
fter
future trend on the housing market. all, that the difference between owner-occupied housing costs and rental costs will eventually level out,
because people relocating tend to choose whatever type of accommodation is more affordable. But due to
The coronavirus pandemic and the economic crisis it has triggered make this question all the more pressing. the high transaction costs and the relatively low number of removals, these processes can take a relatively
Generally speaking, the user cost approach chosen for the survey illustrates that the market is anything but long period of time. So, whenever owner-occupied-housing costs exceed rental costs, it is reasonable to
overvalued. Accordingly, the housing market’s potential for setbacks is limited, and a crash along with a assume that prices will generally soften—as Himmelberg et al. (2005) predicted in the run-up to the finan-
price drop by more than 20 percent, as predicted by some experts (Braun/Simons, 2020), appears unlikely. cial crisis in the United States. If, by contrast, owner-occupied-housing costs undercut rental costs, prices
However, it is just as unlikely that the pre-crisis price boom on the housing market will simply resume. can be expected to rise.
Rather, there is reason to believe that this year will more or less be characterised by stagnation. Just when
business will pick up again depends essentially on the gravity of the economic crisis and the time it will This is precisely the situation that has prevailed in Germany for a number of years now. The underlying
take companies to recover. This year’s survey includes a brief chapter dedicated to this subject. cause is that interest rates fell quicker than prices increased. As the subsequent calculations show, the gap
between rental costs and owner-occupied-housing costs actually kept widening in 2019 because interest
Yet for private households, the question whether they are better off renting or buying has not lost in rele- rates continued to go down, and considerably so. This in itself is already an important message, as it makes
vance in face of the ongoing crisis, and it remains as relevant as ever for investors, too. One again, this an abrupt deterioration of prices unlikely since it would further widen the gap between rental costs and
underscores the particularly crisis-proof nature of the housing market: Residential accommodation is some- owner-occupied-housing costs. To expect prices to keep rising instead also seems to be oversimplifying
thing you cannot do without. Office workplaces may become redundant, and the demand for retail units and things, given the severe economic crisis that is beginning to unfold at the moment.
hotel rooms may contract in future, but every person needs a place to live. The dwelling size is admittedly
subject to change as you move through life’s stages—with children moving out, for instance—but the need So, what is the best way to interpret the user cost approach in times of an economic crisis? In order to
for housing in some form is ultimately non-negotiable. With this in mind, the Housing Cost Report provides answer this question, we need to remember that adjustments to rental costs / owner-occupied-housing
extensive decision guidance to help determine which form of use is more advantageous when everything costs can also be triggered by factors other than prices. For one thing, we need to look at the development
is said and done. As a result, these observations are relevant to investors, too. of rents. Re-letting rents have been going up in recent years, in some places more so than in others, as a
result of the housing shortage, but have also driven up wage increases (Sagner/Voigtländer, 2018). In the
The report therefore includes a chapter dedicated to this type of investor or, by analogy, to private small- wake of the economic crisis, wage growth will slow its pace, while unemployment and insolvencies will
scale landlords. Private small-scale landlords are decidedly relevant for the German housing market, as actually imply lower income levels for many people. Of course, it would be atypical for residential rents to
they account for two out of three rental flats. Yet relatively little is known about this group, and especially soften, as landlords would seem more likely to accept temporary vacancies. If nothing else, however, it is
in politics and the media you will often come across the naive notion that landlords in general are fabulous- reasonable to expect the rental growth to slow down or indeed flatline in many places. The longer rents
ly well to do. In truth, this group of landlords is highly heterogeneous, and includes a wide variety of social stagnate, the more likely it would be for the gap between owner-occupied-housing costs and rental costs
groups. to close. Further adjustments could be tied to expectations regarding the future price trend. A key compo-
nent of the owner-occupied-housing costs are the price expectations because owners participate in the
All things considered, these are challenging times, for households, for business and for society at large. price trend on the housing market. As an indicator for the price growth to be expected, we studied the
However, the present analysis reveals that the housing market can act as a stabilising factor, the way it has average price increase between 2005 and 2019. The period covers both a stagnant cycle and a boom cycle.
done on occasion in the past, and in this role may actually steer clear of a drastic economic slump. More Moreover, price expectations above an upper limit of three percent are ignored to keep the fast price growth
over, it continues to offer opportunities, even and especially for private households. Homeownership seen lately from weighing in too heavily.
investments can not only be used to build wealth of a sort that is particularly resilient in times of crisis, but
homeownership will also potentially lower your recurrent housing costs. All the more reason for the body Depending on how grave the ongoing economic crisis will turn out to be, it may become necessary to adjust
politic to help people take the step into homeownership even in times of crisis. these expectations. If, for instance, Germany were to descent into a structural crisis extending over years,
this would call for a re-appraisal of long-term price expectations. But for the time being, the chances for a
swift recovery remain very high (SVR German Council of Economic Experts, 2020) while historic pandemics
such as the Spanish Flue of 1918 were matched by a remarkable resilience of market economies and a
speedy return to pre-crisis growth dynamics (Garett, 2007). This suggests that the prospects of overcoming
the crisis quickly are quite good, which in turn would make it seem premature to revise the long-term ex-
pectations just yet. It is also reasonable to assume that the interest rate development will help to stabilise
the market, because interest rates are more likely to fall than to rise. This observation is based mainly on
three arguments:
6 Survey compiled for ACCENTRO Real Estate AG 7ACCENTRO Housing Cost Report 2020
1. For demographic reasons, real interest rates have been falling in recent decades. Life expectancy has Figure 2.1: Scoring rent growth and wage growth1) as well as the economic resilience of the
consistently gone up whereas Germany’s state pension age has remained more or less the same. This employees2) in Germany’s districts in the wake of the coronavirus pandemic
results in a growing accumulation of savings. As the working population is shrinking at the same time
(due to the low birth rate), investments are not growing at the same rate or, in some respects, actual-
ly declining. The growing imbalance between savings and investments keeps pushing down interest
rates, so that negative real returns should be expected in many national economies in the long run
(Demary/Voigtländer, 2018).
2. The ECB has announced extensive measures designed to stabilise markets. Bond purchases will
increase by 750 billion euros before the end of 2020, bringing the total volume of such purchases up
to 1.1 trillion euros. The experiences made during the financial crisis and the sovereign debt crisis
show that interventions of this kind will put pressure on interest rates with both short and long
fixed-interest periods. Again, though, their actual effect will depend on the expectations among
market players.
3. Jordà et al. (2020) examined the long-term macroeconomic effects of pandemics. One of the key
findings was this: Real interest falls in the wake of pandemics. Unlike in the case of war, where the
postwar period sees a surge in investments, the capital stock remains intact in the case of pandem-
ics, whereas demand for goods and services is down as a consequence of income losses. The situa-
tion is compounded by the fact that more people start saving their money, causing an increase in
liquidity holdings as a precautionary measure.
Regardless of the overall effect of the crisis on the economic growth, a crisis of this magnitude may also
cause shifts among the various regions and cities. Especially regions with strong dependence on a select-
Scoring outcome
ed few industries, which have have been harder hit by the crisis than others, could collectively fall behind,
and this could in turn be reflected in the long-term development of condominium prices. Inversely, other 2-5
regions could benefit from the situation, thereby improving their outlook. It is still too early to venture
definitive assessments of such regional repercussions, because the degree of uncertainty is still too high. 6–7
Nonetheless, the angles discussed below provide first clues indicative of the further developments. On the 8–11
one hand, it is quite revealing to take a close look at the connection between wage growth and rental trend.
Wherever rents outpaced wages in recent years, there is a chance that rental growth could pause for an 12–15
extended period of time. By contrast, wherever rents have been rising at a markedly slower pace the wag- 16–17
es, rents could actually keep pushing up despite the crisis. Another angle is provided when you study the
industry structure of the various regions. Using the business surveys of the ifo Institute for Economic 18–20
Research, Oberst/Voigtländer (2020) derived the number of social security-covered jobs in those industries No data
that are particularly hard hit by the economic crisis (Sauer/Wohlrabe, 2020). In addition to tourism, the
accommodation and food service sector, and the physical non-food retail sector, these are particularly the
sectors of the manufacturing industry, which are suffering from supply chain disruptions. The two effects
can easily be brought together in a scoring model. Applying both criteria, all of Germany’s 401 districts 1) Difference of wage growth and rent growth on new tenancies between 2014 and 2018 (cf. Sagner/Voigtländer, 2020).
were subjected to a ranking that returned point scores for each. A district, for instance, that counts among 2) Impact as percentage of social security-covered jobs in exposed economic sectors.
the 10 percent with the greatest difference between wage growth and rental growth between 2014 and Source: IW Economic Institute
2018, scores 10 points, while districts included in the next 10-percent cohort still score 9 points. An analo-
gous approach was taken to study the industry sectors, the top-scoring 10 percent of the districts being
those that showed the lowest percentage of social security-covered jobs in exposed industries. The point
scores were added up in the next step. For the outcome, see Figure 2.1. For 13 of the districts, no scores
were posted because some of the employment data by industrial sectors on the level of the 410 districts
and independent cities is only available in censored form. The evaluation therefore included only those
districts where at least 75 percent of all social security-covered jobs in the respective district could be
allocated to a specific industrial sector.
8 Survey compiled for ACCENTRO Real Estate AG 9ACCENTRO Housing Cost Report 2020
As Figure 2.1 illustrates, the risks were very unevenly spread. Especially in southern Germany, the risks ap- Data Sources
pear to be very high, making it the first region where expectations may have to be revised. Things look quite Representing the owner-occupied-housing costs subsequently on the level of Germany’s 401 districts and
different in eastern Germany. Here, rent hikes—and therefore price hikes—seem quite likely. The situation independent cities presupposes regionally differentiated data for the property prices. The real estate
in western and northern Germany is generally more complex. While the map provides a first take on the prices are obtained from two data sources. For a direct comparison of rents with purchase prices, you need
risks of the economic crisis, that is ultimately all it does. Especially southern Germany with its many inno- to make sure that the properties resemble each other in terms of fit-out level and residential location. But
vative and creative small and medium-sized enterprises could successfully master a possibly looming even if you find such matches, the actually bought or rented residential properties will differ over time and
structural shift. In eastern Germany, by contrast, the short supply in skilled workers would compromise from one region to the next. In order to make the prices comparable across different regions and time
potential opportunities for growth. Accordingly it is too early to derive any conclusions concerning the periods nonetheless, we use hedonic prices. The data source we relied on to determine owner-occu-
housing market. But especially opportunistic investors should consider the regions in eastern Germany. pied-housing costs and their economic benefit over rents is vdpResearch, a real estate market research firm
The IW Economic Institute will carefully study the development and, if needed, adjust its projected long- that provided first-sale prices or resale prices and rents from thoroughly refurbished period buildings in
term price expectations. good locations and with good specifications. For the expected long-term appreciation of the properties, we
used the property price performance data available from the F+B research institute, which make it possible
for us to derive an average annual price performance since 2005, up to and including 2019. The price per-
3 OWNER-OCCUPIED-HOUSING COSTS formance includes the very modest price trends of the Zero Years and the accelerated growth rates during
the decade just concluded. To avoid undue weighting of the price growth of the recent past, we limited
annual price expectations to a maximum of +3 percent per year.
3.1 Notes on the Methods Used
The average equity interest share in financing arrangements were sourced from publications by Dr. Klein
Operationalization (2020). To calculate the owner-occupied-housing costs, we imputed the average value across the observa-
The user-cost-of-housing approach lets you compare the running costs of owning your home versus the tion period. On the whole, the equity stake, while having only a negligible effect on the amount of the run-
running costings of renting it. The approach is based on the works of Poterba (1984) and Himmelberg et al. ning owner-occupied-housing costs, does influence the costs over the entire loan term because the repay-
(2005) and permits a juxtaposition of running rental costs on the one hand, and the expenses associable ment of the mortgage loan will take longer the smaller the down-payment is that a buyer made. On top of
with owner-occupying a property, on the other hand. In several important ways, the user cost approach dif- that, low equity stakes can prompt an interest mark-up.
fers from a simple comparison of the annual debt service—meaning the total amounts paid toward interest
and redemption—with rent payments. One of the differences is that repayments of loan principals are not The interest rates our calculations imputed for mortgage loans and alternative investments were obtained
taken into account because they help to build personal wealth in a manner that is without analogy among from the Bundesbank. The mortgage interest rate we imputed represents the mean effective interest rate
tenants. Owner-occupied-housing costs can be broken down into five components. The approach can be that German banks charge for housing loans to private households with an initial fixed interest period of
represented in the following mathematical formula: more than ten years (Deutsche Bundesbank, 2020a). The interests rate we applied to alternative invest-
ments represent the mean current yield rates on domestic bearer bonds (Deutsche Bundesbank, 2020b).
SNKk,t = Pk,t ∙ (b ∙ iF,t) + Pk,t ∙ (s + a) - Pk,t ∙ ∆Pk + Pk,t ∙ (1 - τt ) ∙ (1 - b) ∙ iA,t Bearing in mind that income from alternative investments are taxable, we imputed the average tax rate as
+ Pk,t ∙ (mk,t + gk,t + n + e) ∙ (1 - τt ) ∙ iA,t delineated in the fiscal statistics (BMF Federal Ministry of Finance, 2019).
The formula above shows the calculation of the owner-occupied-housing costs per year (“t ") and district or The actual amount of the incidental acquisition costs depends on the notarial charges, the real estate trans-
independent city (“k”). The first term designates the interest costs accrued at the time (“t”) to be paid fer tax rate and the estate agent fees. The real estate transfer tax, a state level tax, can range from 3.5 to 6.5
toward the debt share (“b”) of the purchase price (“Pk,t”). The higher the mortgage interest rate and the percent of the selling price. The estate agent fees are normally split between buyer and seller, but on some
higher the equity stake, the higher this cost component will be. The next term itemises the refurbishments markets are fully borne by the buyer. They normally range from 3.57 to 7.14 percent of the selling price.
costs (“s”) and amortisation (“a”). This cost item represents a percentage relative to the purchase price of
the property, and is associable with an opportunity basis. Naturally, modernisation costs are not incurred
every year, and they could, in principle, be avoided altogether throughout the occupancy period. However,
skipping these capital expenditures exposes the property to depreciation. Moreover, the next term of the
calculation takes the long-term performance (“ΔPk”) of the property into account. A positive performance
of the property will bring down the owner-occupied-housing costs. A property acquisition is usually
financed to some extent with equity capital. The equity stake “(1 – b)” could alternatively have been invest-
ed on the capital market. Such an investment would yield returns (“iA,t”) and would be taxed at a certain rate
(“τt”). Not least, buying property incurs incidental acquisition costs. These break down into estate agent
fees (“mk,t,”), real estate transfer tax (“gk,t”), notarial charges (“n”) and the entry into the land register (“e”).
The incidental acquisition costs, just like the equity paid down, could have been invested into something
else. The taxed earnings from this assumed alternative investment increase the owner-occupied-housing
costs accordingly.
10 Survey compiled for ACCENTRO Real Estate AG 11ACCENTRO Housing Cost Report 2020
Table 3.1: Variables and data sources The idea behind the user cost approach is another, as it is based on the premise that the costs of owner-
occupancy will match the costs of renting your home in the long run. The approach therefore focuses on the
Variable Explanation Source costs to be paid on a recurring basis by an owner-occupier. In annuity accounting, only the interest pay-
Purchase price, in euros per sqm of ments to be paid on the borrowed capital portion are taken into account as costs, whereas the residential
Pkt vdpResearch (2020)
dwelling floor area user cost approach also takes the opportunity costs into account. Opportunity costs are defined as those
b Debt capital share Dr. Klein (2020) revenues that could hypothetically be generated if the capital used for the acquisition of real property
iF,t Mortgage interest rate Deutsche Bundesbank (2020a) were invested in an alternative (risk-free) investment product instead. No opportunity costs of this type are
considered in classic annuity accounting. The latter also ignores costs such as deprecation or refurbishment
iA,t Current yield on bearer bonds Deutsche Bundesbank (2020b)
losses as well as the appreciation of the property through long-term price growth. That being said, annuity
τt Tax rate BMF (2019) accounting is by all means informative and shows the absolute cost trend over time. Findings obtained from
ΔPk Purchase price change F+B (2020) this approach are therefore included in the survey as well.
Source: IW Economic Institute
3.2 Findings for Germany
Model Calculation
This section will illustrate the calculation of the owner-occupied-housing costs by determining them for a The average owner-occupied-housing costs in Germany undercut rental costs nationwide. The popula-
model city as follows. Let us say that the purchase price per square metre of dwelling floor area is tion-weighted average costs for owner-occupiers have lately stood at 4.94 euros per month. Compared to
4,000 euros The incidental acquisition costs break down into the real estate transfer tax (in this case 6 per- the rental costs for a comparable condominium, which are 9.61 euros a month, owner-occupiers have a cost
cent), the agent’s fee (in this case 3.57 percent), the costs of the land register entry and the notarial charg- advantage of 48.5 percent. As Figure 3.1 shows, owner-occupied-housing costs declined year on year.
es (in this case 1.525 percent), adding up to a sum total of 444 euros per square metre or about 11 percent
of the purchase price. Let us assume the leverage is 78 percent and subject to an interest rate of 1.5 per- A key aspect underlying this outcome is the interest rate development. The interest rate charged by G
erman
cent. To determine the opportunity interest that the investment of the amount paid down could earn on the banks for housing loans to private households with an initial fixed-interest period of more than ten
capital market, an equity stake of 22 percent is assumed. Here, an interest rate of 2.5 percent is imputed, years averaged 1.96 percent in 2018 and 1.54 percent in 2019 after another significant drop. This drastic
which represents the average current yield that German bearer bonds generated in 2019. Investment reduction in interest rates, combined with virtually stable level of interest rates for alternative invest-
income of this sort is taxable, the imputed tax rate being 22.9 percent (average tax rate as delineated in ments—in this case the current yields of domestic bearer bonds—has caused a decline in owner-occu-
the financial statistics for 2018 and adopted for 2019 as well). The expected annual price growth rate is pied-housing costs. The lower mortgage interest rates reduce the interest payments for debt financing,
imputed as 2.5 percent. while the opportunity costs of an alternative investment of the equity share and ancillary acquisition costs
on the capital market have failed to increase due to the virtually unchanged current yields.
SNK (noname city, 2019) = 4000 ∙ (0.78 ∙ 0.015) + 4000 ∙ (0.01 + 0.02) – 4000 ∙ 0.025 + 4000 ∙ (1 – 0.229)
∙ (1 – 0.78) ∙ 0.025 + 4000 ∙ (0.0357 + 0.06 + 0.01525) ∙ (1 – 0.229) ∙ 0.025 Overall, the convergence process of owner-occupier and rental costs, which seemed to be imminent be-
tween 2016 and 2018, is stalled for the time being. During this phase, mortgage interest rates remained
The above assumptions return owner-occupied-housing costs in an amount of c. 92 euros per square metre largely stable, while the increase in purchase prices, especially in metropolitan regions and conurbations,
of dwelling floor area and year, or 7.69 euros per square metre and month. Assuming a hypothetical rent gained considerable momentum during the same phase. But even in Germany’s metropolises, the interest
level of 9 euros per square metre would put the owner-occupied-housing cost advantage at around 15 per- rate drop has checked this trend lately.
cent.
Delineation from Annuity Accounting
A conceivable alternative to the user cost approach would be to compare annuities—meaning the annual
payments of interest and principal on a mortgage loan—with rental costs. For the purposes of interpreting
the owner-occupied-housing costs, it makes sense to identify the differences in calculation methods and
the assumptions underlying the user cost approach.
In the financing context, we need to distinguish between interest payments and repayments of the princi-
pal. Interest payments are the costs paid to the bank for lending the debt capital that was borrowed to buy
a given property. Principal payments, on the other hand, describe that part of the loan that corresponds to
the proportional value of the property acquired. Accordingly, these payments do not qualify as costs,
because this share of a loan is fully reflected in the value of the property. The annuity is calculated to
determine the recurring amount that a household must keep on hand during the phase of repaying interest
and principal. So, this variable is relevant when you decide—based on your household budget—whether or
not you can afford the financing arrangement for a given property.
12 Survey compiled for ACCENTRO Real Estate AG 13ACCENTRO Housing Cost Report 2020
Figure 3.1: Trend in owner-occupied-housing costs and rents1) Figure 3.2: Owner-occupied-housing costs and rents in Germany’s metropolises
Population-weighted German2) average, in euros per square metre of dwelling floor area and month in euros per square metre of dwelling floor area and month
Owner-occupied-housing cost New tenancy rents Passing rents
Berlin Düsseldorf
12 Owner-occupied-housing cost New tenancy rents Passing rents Owner-occupied-housing cost New tenancy rents Passing rents
25 25
20 20
10
15 15
10 10
8
5 5
0 0
2010 2011 2012 2013 2014 2015 2016 2017 2018 2019 2010 2011 2012 2013 2014 2015 2016 2017 2018 2019
6
Frankfurt a M Hamburg
Owner-occupied-housing cost New tenancy rents Passing rents Owner-occupied-housing cost New tenancy rents Passing rents
4 25 25
20 20
2 15 15
10 10
0 5 5
2010 2011 2012 2013 2014 2015 2016 2017 2018 2019
0 0
2010 2011 2012 2013 2014 2015 2016 2017 2018 2019 2010 2011 2012 2013 2014 2015 2016 2017 2018 2019
1) Passing rents (F+B, 2020) refer to a dwelling of standard fit-out specifications and state of repair. Rents on new leases
(vdpResearch, 2020) and selling price are based on transaction data and refer either to first-sale prices or to resale prices
of fully refurbished flats in good locations and with good specification. Cologne Munich
2) With no population data for 2019 available yet, the population weightings of 2018 were adopted for 2018, too. To do Owner-occupied-housing cost New tenancy rents Passing rents Owner-occupied-housing cost New tenancy rents Passing rents
25
the census reset of 2011 justice, retrograde calculation was used for 2010 as defined by the BBSR Federal Institute for
Research on Building, Urban Affairs and Spatial Development (2018).
20 20
Source: IW Economic Institute, vdpResearch (2020); F+B (2020)
15 15
10 10
3.3 Findings for the “Big Seven” Cities 5 5
0
The economic benefit of owner-occupied-housing costs varies strongly among the districts and independ- 0
2010 2011 2012 2013 2014 2015 2016 2017 2018 2019 2010 2011 2012 2013 2014 2015 2016 2017 2018 2019
ent cities – the same being true for Germany’s seven largest cities, which we will dwell on here because of
their population size and their relatively high share of tenants. Stuttgart
Owner-occupied-housing cost New tenancy rents Passing rents
25
Figure 3.2 shows the trends of owner-occupied housing costs and rental costs in euros per square metre of
dwelling floor area and month for the seven largest German cities. These major German cities show stark 20
differences in housing costs. According to transaction data provided by vdpResearch (2020), new tenancy 15
rents or rents for thoroughly refurbished period flats with good specification on new leases in Munich
averaged 21.50 euros in 2019, whereas the selling price was 7,784 euros for a comparable flat, making 10
Munich the most expensive among the seven metropolises or “Big Seven.” 5
0
Still most affordable within this group is the German capital. In Berlin, a rental flat with the same character- 2010 2011 2012 2013 2014 2015 2016 2017 2018 2019
istics as described above was renting out for an average of 12.70 euros in a new tenancy in 2019, compared
Source: IW Economic Institute, vdpResearch (2020); F+B (2020)
to a price tag of 5,180 euros per square metre of dwelling floor area. In addition to the trend in new tenancy
rents, Figure 3.2 shows the level and developments of the average passing rents for flats in multi-dwelling
units with average specifications in normal locations (F+B, 2020).
14 Survey compiled for ACCENTRO Real Estate AG 15ACCENTRO Housing Cost Report 2020
Figure 3.2 shows a trend in owner-occupied-housing costs in the metropolises that is very similar to that 3.4 Digression: Berlin’s Rent Cap
of the population-weighted average for Germany as a whole (Figure 3.1). Due to their high population
weightings, the trends in rents and prices in the major cities definitively influence the findings on the na- The calculations for the Berlin market shown here apply principally to flats built in 2014 or thereafter only.
tional level. Since the imputed interest rate is the same for every district within a given period, the relation The reason for this is the rent cap (“Berliner Mietendeckel”) introduced in early 2020. The rent cap legis
of owner-occupied-housing costs to rents at a given point in time will also reflect on the relation of selling lation stipulates not only that the rents of all flats built prior to 2014 be frozen for a five year period but
prices and rents. A divergent trend in owner-occupied-housing costs from one region to the next over time moreover that rents be lowered. In case the lease is renewed, the rent rate must not exceed the level of the
should therefore be attributed to a shifting relation of rents to selling prices. 2013 rent rolls, allowing for the real wage performance since but ignoring differences in location. In about
70 percent of the flats listed in 2019, the rents would have to be reduced by 25 percent (cf. Sagner/
In 2019, the interest rate drop caused owner-occupied-housing costs to decline in all of Germany’s metrop- Voigtländer, 2019a). Rent reductions are expected to be particularly drastic in central districts such as
olises year on year. However, the pace of the one-year drop in owner-occupied-housing costs differed from Friedrichshain, Mitte or Prenzlauer Berg. Moreover, rents on unexpired leases must be lowered if they are
one metropolis to the next, being fastest in Munich at minus 10.6 percent and slowest in Berlin at minus more than 20 percent above the local reference rent of 2013. This, too, applies to roughly half of all flats,
7.8 percent. The figures reflect the differences in the year-on-year changes in selling prices and rents: In and thus to a significant share of the market. The rent cuts will make renting more attractive and therefore
Munich, rents went up by 3 percent compared to their 2018 levels and selling prices by 5.6 percent, where- stimulate demand for rental flats. But the problem is that the demand for rental accommodation cannot be
as in Berlin, rents rose by 3.4 percent and selling prices by 7.8 percent, so that the interest rate drop was met. Landlords will probably respond to the changed situation by selling flats to owner-occupiers because
less effective in cushioning the rise in the price-rent ratio than it was in Munich. the sales proceeds can be expected to exceed the cash value of the regulated rent revenues. Maennig
(20/03/2020) shows that the percentage of flats that are earmarked for sale has visibly increased in rela-
Table 3.2 captures the interconnectedness of the cost advantage of owner-occupancy, gross initial yield tion to the percentage of rental flats. So, although rental flats are principally more affordable, they are
and gross rent multiplier for the seven largest German cities. A high cost advantage of owner occupancy simply unavailable, rendering the user cost approach inapplicable for an analysis of this market.
correlates with relatively high gross initial yields and low gross rent multipliers. Berlin showed the lowest
cost advantage of owner occupancy relative to that of the other metropolises in 2019 at 35.1 percent, A highly relevant question in this context is how prices for condominiums completed before 2014 will
which coincided with the lowest gross initial yield at 2.9 percent and a gross rent multiplier of 34. I nversely, develop. Based on a cash-flow analysis, Sagner/Voigtländer (2019b) argued that prices could drop by
the greatest cost advantage of owner occupancy over renting among the “Big Seven” cities was reported around 40 percent. Such massive price reductions could primarily affect those landlords who do not have
from Cologne with 59.5 percent, the gross initial yield here being 4.6 percent and the gross rent multiplier the option to sell to owner-occupiers, for instance because their flats are located in areas subject to pres-
21.9. ervation statutes. In other cases, the price discounts are likely to be more moderate as long as demand
among prospective owner-occupiers remains high. It is still too early to venture a conclusive assessment as
to which way the market will actually be trending. Another definitive factor will be how market players
Table 3.2: Relation of cost advantage of owner occupancy, gross initial yield and gross rent interpret the political situation. If the majority of market players were to assume that the rent cap will be
multiplier in German metropolises in 2019 scrapped before long, for instance because it is unconstitutional, the discounts will be much more modest
than they would be if market players had reason to believe that the rent cap will be extended by another
Cost advantage of five years.
City Gross initial yield Gross rent multiplier
owner occupancy
Berlin 35.1 % 2.9 % 34.0 That being said, the current regulatory situation could offer opportunities for investors with very long-term
Düsseldorf 58.7 % 4.5 % 22.3 horizons to enter the market. In its role as the national capital, Berlin remains principally attractive, and
such a far-reaching price regulation is highly unlikely to remain in place permanently in a market economy.
Frankfurt am Main 55.6 % 4.2 % 23.6
After all, the rent cap constitutes a massive infringement on the right of ownership. So, for those investors
Hamburg 43.1 % 3.3 % 30.6 who are playing the long game, a market entry at this point could be worthwhile despite all the red tape.
Cologne 59.5 % 4.6 % 21.9
Munich 45.9 % 3.3 % 30.2
Stuttgart 51.0 % 3.7 % 26.9
Source: IW Economic Institute, data source: vdpResearch
The findings illustrate that nothing suggests a serious potential for setbacks in major German cities; and
this although the most recent interest rate cut has not even been priced in. Even though the economic c risis
could cause the price growth to stall this year, the values clearly suggest that prices could start rallying
again, at least in the medium term.
16 Survey compiled for ACCENTRO Real Estate AG 17ACCENTRO Housing Cost Report 2020
3.5 Findings for Germany’s Counties and Independent Cities Figure 3.3: Comparative view of owner-occupied-housing costs and rents1)
2019, in percent
In virtually all of Germany’s districts and independent cities, owner-occupied-housing costs are lower than
rental costs for a comparable dwelling. In 393 of 401 districts, the owner-occupied-housing costs undercut
the rental costs of a comparable flat. The cost advantages range from plus 75 percent in the district of
Sömmerda all the way to minus 17 percent in the independent city of Hagen. This means that in eight
districts renting your home is more advantageous than owning it. The fact is explained by the sluggish price
growth for condominiums in existing properties in these districts in the years 2005 through 2019. The price
growth, which is based on data provided by F+B (2020), shows a more or less stable price level in these
districts and cities since 2005. If the anticipated price increases, which are based on the long-term price
expectations of recent years, remain on such a low level, you can arguably impute high owner-occupied-
housing costs, since owner-occupiers do not benefit from increases in value, whereas the costs for interest
payments, depreciation and maintenance as well as the opportunity costs of missed alternative investments
accrue nonetheless. This finding illustrates the relevance of future price trends for the level of owner-occu-
pied-housing costs. If price developments in those regions where owner-occupied-housing costs exceed
rents turn out to be higher than they were expected to be (based on past trends), then the picture would be
more favourable, including for said regions. That is why the long-term price increase was set at an annual
maximum of 3 percent (in nominal terms), as discussed above, in order not to give excessive weight to the
price rally of recent years.
Figure 3.3 represents a regional drilldown of economic benefit levels of owner-occupied-housing costs ver-
sus rental costs. It shows a particularly favourable relation of owner-occupied-housing costs to rental costs
in some regions of Brandenburg: 8 of the 20 districts and independent cities with the greatest cost advan-
tage are located in Brandenburg. In the unweighted median of the 401 districts and independent cities, the
economic benefit equals 54 percent. The tenth percentile, which divides the districts into the 10 percent
Economic benefit of
with the lowest economic benefit and the remaining 90 percent, shows 25 percent. The other figures are
homeownership versus
45 percent for the 25th percentile, 59 percent for the 75th percentile and 63 percent for the 90th percen- rents
tile, which delimits the 10 percent among the districts with the greatest economic benefit. This breakdown
corresponds with the group shadings in Figure 3.3. < 25.9 %
25.9 – 45.4 %
45.6 – 54.1 %
54.2 – 58.7%
58.8 – 62.8 %
> 62.8 %
1) New-tenancy rents
Source: IW Economic Institute, vdpResearch (2020); F+B (2020)
18 Survey compiled for ACCENTRO Real Estate AG 19ACCENTRO Housing Cost Report 2020
3.6 Interest Rate Sensitivity Figure 3.4: Neutral interest rate1) on the district level
2019, in percent
Number per group
The development over time and the level of owner-occupied-housing costs is definitively influenced by the
level of interest on mortgage loans. But the development of opportunity interest rates for an alternative 120
investment of equity capital and incidental acquisition costs must also be taken into account.
Summarised once more in Table 3.3 is the development of effective interest rates that German banks charge 100
households for new lendings, depending on the initial fixed-interest period. The table also shows the trend
in current yields for domestic corporate bonds issued by non-bank lenders. Since 2010, the average inter-
est rate with an initial fixed-interest period of more than ten years dropped by 2.44 percentage points, from 80
3.98 to 1.54 percent in 2019. Interest rates on loans with a shorter initial fixed-interest period declined at
a similar pace. Returns on domestic corporate bonds have also been in long-term decline. Although yields
developed briskly between mid-year 2017 and early 2019, they slumped again in the course of 2019, keep- 60
ing the annual average between 2018 and 2019 to a modest increase of 5 basis points for current yields. At
the same time, mortgage interest rates dropped by 42 basis points, more than eight times as fast, which had
40
a positive effect on owner-occupied-housing costs (by reducing them).
20
Table 3.3: Interest rate trend for mortgage loans by length of initial fixed-interest period,
and current yields on domestic bearer bonds (corporate bonds)
0
2010 2013 2016 2018 2019
70
Over ten years 3.98 2.95 1.80 1.96 1.54
Five to ten years 3.90 2.75 1.60 1.72 1.37 1) Mortgage rate at which the owner-occupied-housing costs match the rental costs (new tenancy)
One to five years 3.42 2.44 1.78 1.72 1.46 Source: IW Economic Institute based on data by vdpResearch
Variable or less
3.11 2.71 2.10 2.08 1.96
than one year
Domestic bearer bonds 4.03 3.38 2.08 2.48 2.53 3.7 Annuity Trend and Level
Source: Deutsche Bundesbank; IW Economic Institute
Mortgage interest rates also play a decisive role for the annuity level in real estate financing. Assuming
therwise unchanged conditions, a lower interest rate means that the total costs of real estate financing
o
Owner-occupied-housing costs are lower than rents in virtually every German district. This implies that— will fall. Reduced total costs could, for example, permit a larger capital repayment component and thereby
assuming all other parameters remain in place—even a rise in interest rates on mortgage loans would not shorten the loan term. If the loan term is left unchanged, the reduced total costs would bring down the
reverse the economic benefit relation. Each district has an identifiable neutral interest rate level at which annuity, meaning the sum of interest and redemption payments, and thus reduce the current financial
interest on mortgage loans would create an equilibrium between owner-occupier housing costs and rental burden.
costs on new tenancies in 2019. A look at these figures shows that a moderate rise in interest rates would
not reverse the economic benefit of owner-occupied-housing costs versus rental costs, except in very few For the first time since 2016, the average annuity to be paid for the acquisition of a condominium registered
districts. Figure 3.4 shows the bandwidths of neutral interest rates in corresponding groups among Germa- a year-on-year decline in 2019. Nationwide, annuities softened slightly even when adjusted for inflation.
ny’s 401 districts and independent cities. For more than 280 of these 401 districts, the neutral interest rate For the purpose of calculating the annuity, the acquisition of a 100-square-metre condominium was
for mortgage loans exceeded 4 percent, while for another 100 districts it was between 2 and 4 percent. The assumed, to be paid off within 25 years on a full repayment loan, the assumed equity stake being 20 percent.
level of the neutral interest rate increases apace with the level of the cost advantage of owner occupancy, The figures were price-adjusted using the harmonised index of consumer prices, and are quoted in 2019
so that the regional distribution of the neutral interest rate is proportionate to the cost advantage of owner prices.
occupancy listed in Figure 3.3.
20 Survey compiled for ACCENTRO Real Estate AG 21ACCENTRO Housing Cost Report 2020
As Figure 3.5 shows, the growth in annuities has lately slowed down compared to prior years, even in Figure 3.6: Differences in annuity level in real estate financing
Germany’s “Big Seven” cities, and noticeably so. Between 2018 and 2019, selling prices in the major cities 2019
continued to rise swiftly, but the sharp fall in interest rates largely offset this development, so that pay-
ments of interest and principal more or less flatlined. In Stuttgart, Munich and Hamburg, annuities have
slowly gone down, whereas they have been rising slowly in Berlin, Düsseldorf and Cologne. By far the
priciest major city is Munich with an annuity of 30,181 euros, whereas the annuity level in Düsseldorf is
roughly half as high at 14,653 euros. Figure 3.6 shows a regional drilldown of annuity levels for 2019. The
price differences among the regional real estate markets are clearly evident, with the relatively expensive
south of the country and the high-priced cluster in the Munich metro area standing out. In addition, the
situation in major cities differs from that in their surrounding districts.
Figure 3.5: Trend1) and level2) of the annuity3)
Berlin Düsseldorf Frankfurt a M Hamburg Cologne Munich Stuttgart Germany
35,000 155
30,000 145
25,000 135
20,000 125
15,000 115 Annuity
< € 5,331
10,000 105
€5,331 – 7,014
5,000 95 €7,022 – 8,662
€8,666 – 10,686
0 85
€10,744 – 13,575
2010 2011 2012 2013 2014 2015 2016 2017 2018 2019
> € 13,575
1) Index 2010 = 100, right axis showing scale; lines in chart
2) Euros in real money terms (2018), inflation-adjusted using the harmonised consumer price index
(Federal Statistical Office, 2019)
3) Annual costs of interest and repayment for a condominium of 100 square metres and assuming a 25-year loan maturity,
full repayment loan, 20 percent equity capital
1) Annual costs of interest and repayment for a condominium of 100 square metres and assuming a 25-year loan maturity,
Source: IW Economic Institute, based on data by vdpResearch (2020) full repayment loan, 20 percent equity capital
Source: IW Economic Institute
22 Survey compiled for ACCENTRO Real Estate AG 23ACCENTRO Housing Cost Report 2020
The fall in interest rates between 2018 and 2019 even succeeded in stalling the rise in annuities in the By far the largest group of private households in Germany rent their flats from private landlords, their
largest German cities. It should come as no surprise therefore that this finding applies to most German verage share being slightly over 60 percent nationwide, which translates into around 14 million house-
a
districts and independent cities, because the price dynamics in most German regions is far slower than in holds. Four out of five tenant households in small towns with populations of 20,000 or less, or five million
the country’s metropolises. In 364 out of 401 districts, the annuity in 2019 went down in real money terms, households, rent their flats from private owners, while the share in mid-size cities with populations of
making the acquisition of property actually more affordable even in absolute values. 20,000 to 100,000 residents is 64 percent of the households (4 million). Private landlords also account for
the majority of rental flats in major cities of 100,000 residents or more. Here, 50 percent of the tenant
If you consider in addition that real rents on new tenancies did not soften in any of Germany’s districts households (or 5 million in absolute terms) inhabit flats of this type.
etween 2018 and 2019, according to data by vdpResearch, annuities present an even more favourable
b
picture. The distribution of changes in annuities and rents is summarised in Table 3.4. As far as the median The next-largest category of landlords is composed of cooperative housing associations. Roughly 18 per-
among all German districts goes, the annuity fell by 2.3 percent year on year, while the median rent change cent (4 million) of the tenant households in Germany live in rental flats managed by housing cooperatives.
over the same period equalled 2.5 percent. Only ten percent of the districts registered a change in annuity Their share equals 23 percent in major cities, 19 percent in mid-size cities and 10 percent in small towns.
by more than -0.4 percent. In short, the positive development of financing conditions in sync with further The third-largest type of landlords are privately owned businesses – which let about 11 percent of the flats
growth in new tenancy rents between 2018 and 2019 have further enhanced the appeal of homeownership occupied by tenant households (2.5 million). At 17 percent of all private households, their share is larger in
anywhere in Germany. major cities than in mid-size cities (9 percent) and small towns (5 percent). Municipal and pro-bono land-
lords complete the rental housing supply.
Table 3.4: Real change in annuities and rents in Germany’s districts and independent cities
between 2018 and 2019 Figure 4.1: Landlord drilldown for 2018, by municipal size1)
in percent
Change 2018 - 2019 P10 P25 Median P75 P90
Change in annuity -5.7 % -3.4 % -2.3 % -1.1 % -0.4 % Major cities Mid-sized cities Small towns Germany
Change in rent 0.9 % 1.6 % 2.5 % 3.1 % 3.6 % 90
Legend: 80
P10 refers to the tenth percentile of Germany’s 401 districts and independent cities.
In ten percent of the districts (i.e. in 40 of them), the annuity declined by more than 5.7 percent between 2018 and 2019. In
50 percent of the districts (median), the change in annuity was more than -2.3 percent, and less in the other 50 percent. 70
Source: IW Economic Institute
60
50
4 PRIVATE LANDLORDS
40
4.1 Relevance of Private Landlords for the German Rental Housing Market 30
The section below will discuss a group of people that are highly relevant for the German housing market, 20
meaning private buyers who acquired condominiums with the intention of letting them. Private landlords
of this type account for the bulk of the residential accommodation available on the German rental housing 10
market. After discussing the composition of the German rental housing market, we will take a closer look at
the financial resources of private landlords. 0
Municipal Cooperative Private landlords Privately owned businesses Pro-bono
As suggested above, private landlords play an important role on the German housing market. Figure 4.1
shows a breakdown of the German rental housing market by types of landlords or by owners of the rented 1) Small towns: 20.000 or fewer residents, mid-size cities: 20,000 to 100,000 residents,
flats; the chart represents the percentages of private households that inhabit flats owned by a member of major cities: 100,000 residents or more
the respective group. As far as owners go, it differentiates between municipal housing companies, housing Source: SOEP v35; IW Economic Institute
cooperatives, private owners, privately-owned businesses, and charities (churches, foundations, etc.). In
addition, the different types of landlord are represented in relation to municipal size.
24 Survey compiled for ACCENTRO Real Estate AG 25ACCENTRO Housing Cost Report 2020
4.2 Percentage and Number of Private Landlords
Figure 4.2: Percentage and number of households with income from letting and leasing,
Given the favourable financing conditions and running costs mentioned in conjunction with the survey by municipal size (place of residence)1)
findings for owner-occupied-housing costs, and considering the appreciation of the properties, it seems
reasonable to assume that buy-to-let investments have also gained in appeal. After all, the owner-occu- Percentage Number
pied-housing cost approach can also be applied to the landlord side: If the owner-occupied-housing costs Major cities Mid-sized cities Small towns Germany Major cities Mid-sized cities Small towns Germany
16
undercut rental costs, then rental income exceeds the costs incurred by the payments of interest and prin- 6,000,000
cipal of a mortgage loan until maturity. Assuming sufficient financial liquidity to meet the capital adequacy 15
requirements, the incentives for a buy-to-let property investment certainly made it look like a rewarding 5,000,000
14
proposition over the past years.
13
4,000,000
Indeed, many private investors appear to have take advantage of the favourable conditions to move ahead 12
with a property acquisition. The number and percentage of households deriving income from letting and
11 3,000,000
leasing has, in any case, increased since 2010. Covering the years 2000 through 2018, Figure 4.2 shows the
10
development of the percentage and number of households who stated in the respective year that they had
2,000,000
derived income from letting or leasing land or houses the year before; the figures shown representing 9
Germany as a whole. It also distinguishes between landlord households residing in small towns, mid-sized
8
cities and major cities. 1,000,000
7
The percentage of private landlords among all households is highest in small towns – according to the most 6 0
recent figures, around 15 percent of households in municipalities with 20,000 residents or less (about 2.3
20 0
20 1
20 3
20 4
20 5
20 6
20 7
20 8
20 9
20 0
20 1
20 2
20 3
20 4
20 5
20 6
20 7
18
20 0
20 1
20 2
20 3
20 4
20 5
20 6
20 7
20 8
20 9
20 0
20 1
20 2
20 3
20 4
20 5
20 6
20 7
18
02
0
0
0
0
0
0
0
0
0
1
1
1
1
1
1
1
1
0
0
0
0
0
0
0
0
0
0
1
1
1
1
1
1
1
1
20
20
20
million) had income from letting and leasing, ahead of 12 percent in mid-sized cities (about 1.3 million) and
10 percent in major cities (1.4 million). This means the percentages therefore correspond with the propor- 1) Small towns: 20.000 or fewer residents, mid-size cities: 20,000 to 100,000 residents,
tions in the landlord structure represented in Figure 4.1, above. This connection suggests that private land- major cities: 100,000 residents or more Lorem ipsum
lords may increasingly let property in the same regions where they have their own place of residence. This Source: SOEP v35; IW Economic Institute
would make sense because proximity to the let property and familiarity with the local housing market are
important criteria when opting for an investment property, especially when managing the let property on
your own. However, the data are not qualified to derive a definitive connection because the SOEP 4.3 Financial Situation of the Private Landlords
(Socio-Economic Panel) does not query the region where the rent and leasehold income are generated. The
latest statistics for Germany show that 12 percent of all households derive income from letting and leasing, The earnings of private landlords depend on the number of rented properties and the respective rent level.
which translates into about 5 million households. Costs incurred for renovation or maintenance works should be deducted from the cash flow. The difference
represents the net cash flow, albeit before taxes.
The number and percentage of German household who generate income by letting and leasing has gone up
in recent years, specifically by 2 percentage points since 2010 or by roughly another 750,000 households The distribution of income from letting and leasing for 2017 is captured in Figure 4.3. The results date back
as of 2018. This would break down into around 100,000 new households per year. The number of private to the survey of 2018, which polled the revenues and expenses for maintenance and modernisation during
landlords living in major cities has been fastest to rise since 2010, growing by around 32 percent or 350,000 the previous year. The results are represented once again for Germany as a whole and by municipal size of
households. But the number of landlord households also showed significant growth in mid-sized cities (up the landlord’s home town.
16 percent or 175,000 households) and small towns (up 11 percent or 230,000 households).
In 2017, a negative income from letting and leasing was reported by 7 percent of landlord households, as
Against the background of an increased proportion of private landlords in the overall population, we will the expenditures toward maintenance and modernisation exceeded their gross rental income. Most of
subsequently consider the extent to which their financial situation is affected by income from letting and these cases involved extensive refurbishment works, and the additional costs had to be financed from pro-
leasing, and by the financial burden of maintaining the property. visions or current income generated in some other way. At the last count, nearly 20 percent of landlord
households had a positive annual income of less than 2,500 euros from letting and leasing, while another
20 percent had an income between 2,500 and 5,000 euros. Only 10 percent of the private landlords had
annual incomes of more than 20,000 euros. The distribution of income only differs slightly among the
places of residence, the starkest differences being registered in the lowest and highest income brackets. In
smaller municipalities, the proportion of landlords with lower income levels is slightly higher than in large
cities, while in large cities the proportion of private landlords with higher income levels is higher.
26 Survey compiled for ACCENTRO Real Estate AG 27You can also read