Eskom submission to the Standing Committee on Appropriations (SCOA) - Date: 2 September 2020
←
→
Page content transcription
If your browser does not render page correctly, please read the page content below
Eskom submission to the
 Standing Committee on
 Appropriations (SCOA)

Date: 2 September 2020
Contents

• How allocated funds were used

• Progress on recommendations from oversight visit

• Review of all contracts

• Clarity on overpaid contracts

• Kusile and Medupi cost overruns

• Contracts that have increased in value

• Update on illegal contracts

• Clarity on loadshedding

• Eskom contribution to B-BBEE
Government Support Summary from 2008/9 to 2020/21
 (1/3)
 Timeline of Government Support to Eskom

 Year Support Type R’ bn Notes
 2008/09 Loan 60
 2009/10
 2010/11
 2011/12
 2012/13
 2013/14
 2014/15 Sept 2014 Government Support Agreement with Eskom signed. External
 audit report alludes to Going Concern for first time.
 2015/16 Equity 23 R60bn loan converted to equity
 2016/17
 2017/18
 2018/19
 2019/20 Equity 49 Nersa tariff decision deducts R23bn from allowable revenue.
 (R23+23+3=49)
 2020/21 Equity 56 Nersa tariff decision deducts R23bn from allowable revenue. Government
 announces R23bn p.a for 3 years, later possibly for 10 years.
 (R23b+23+10=56)
 Total to Date 188

 3
Report on how allocated funds through Special Appropriations Bill [B10-2019 (Reprint)] have been used (2/3) • As at the end of March 2019. Eskom had net debt of R424 billion. • For the financial year ending 31 March 2020, Government made R49 billion available to Eskom to ensure that its contractual interest and capital payments were timeously made. • The conditions imposed on Eskom under the Special Appropriation Act require the recapitalisation be used to settle debt and interest payments and nothing else. • The disbursement is to be made according to Eskom’s operational cash requirements, but the total recapitalisation may not exceed Eskom’s total redemptions and interest for the financial year. The timing of the recapitalisation disbursements is agreed upon in weekly meetings between Eskom, National Treasury and the Department of Public Enterprises. 4
Cash-flow statement showing payment by Eskom
 as at 31 March 2020 (3/3)

 Cash-flow statement Eskom’s Payment
 Draft & pre-audit: Summarised cash flow for Movement in cash • In the year ending 31 March 2020, Eskom
 FY 2019/20 (R'bn) Inflows Outflows paid R31.5 billion towards principal and
 R39.1 billion towards servicing interest.
 Opening balance 2.0 The bulk of these payments were made using
 Operational cash surplus 36.2 36.2 the R49 billion received from Government.
 Government equity support 49.0 49.0 It should be noted that Eskom generated a
 Debt servicing, made up of -70.6 -70.6 positive operating cash flow of R36.2
 billion for the year. As at 31 March 2020,
 - Principle -31.5 -31.5 gross debt was R488 billion an increase from
 - Interest -39.1 -39.1 the R440 billion from March 2019.
 Balance pre-investing 16.6
 Cash used in investing (capital) -27.0 -27.0 • As per the cash flow statement, it is evident
 that without Government’s recapitalisation,
 Balance pre-funding -10.4 Eskom would not have been in position to
 Debt raised 32.0 32.0 meet its obligations as they fell due. The
 Other financing activities 1.3 1.3 R56 billion appropriated for the 2020/21
 financial year will be used to assist in
 Closing cash balance 23.0
 servicing the estimated R95 billion interest
 118.6 -97.6 and capital repayments falling due in the
 Movement totals
 21.0 2020/21 financial year.

SOURCE: 5
Contents

• How allocated funds were used

• Progress on recommendations from oversight visit

• Review of all contracts

• Clarity on overpaid contracts

• Kusile and Medupi cost overruns

• Contracts that have increased in value

• Update on illegal contracts

• Clarity on loadshedding

• Eskom contribution to B-BBEE

Provide progress made regarding the Committee’s findings
 and recommendations contained the oversight report
 Recommendation 9.1.1

 Eskom ensures that there are adequate socio-economic benefits derived from the
 contracts entered into with Independent Power Producers.

 • The procurement for the Renewable IPP Programme (REIPPP) resides with government
 through the IPP Office, an implementation agent for the Department of Mineral Resources
 and Energy (DMRE).

 • Eskom is designated as the buyer for the energy produced under the REIPPP but does
 not have jurisdiction in oversight over the socio-economic benefits.

 • The DMRE and IPP Office are responsible for monitoring these benefits and are the
 counter-party for the Implementation Agreement, in which the IPP commits to these
 investments and reports directly to the DMRE and the IPP Office on execution of these
 commitments.

SOURCE: 7
In order to resolve Eskom’s financial sustainability, an
understanding of the sources of funding is critical
Recommendation 9.1.2 (1/22)

 Eskom sources of Funding

 Debt and Equity Revenue

 • Equity is received from the • Revenue is regulated
 Shareholder and National • Revenue is applied for by Eskom
 Treasury and determined by NERSA
 • Equity should also include • NERSA’s mandate is to work
 returns that are made on the within the framework of the ERA
 revenue and EPP to develop a
 • Debt is sourced from local and methodology for regulating
 international banks, bonds, Eskom in a manner that is
 ECAs and DFIs financially sustainable

 In longer term there is only one source namely revenue
 Revenue is the only source to meet the cost of the capital (i.e. to provide a return on the unredeemed
 portion of the capital), and revenue is the only source to enable redemption of the principal of the capital
 (i.e. the cost of depreciation is recovered through revenue, which is the mechanism than enables
 redemption of the principal of the capital)
 8
Policy and legislation guides sustainability – however has not been properly implemented (2/22) Presently will not meet that Electricity Pricing Policy (EPP): Tariffs should be cost reflective requirement even by 2023 (15 within 5 years of December 2008 years) Last indicative 5 year price path EPP: NERSA to annually provide a 10 year electricity price path published was around 2009 Electricity Regulation Act: NERSA must: Enable an efficient Have shown that this is not been licensee to recover the full cost of its licensed activities, including a done for many years reasonable margin or return Multi-Year Price Determination (MYPD) Methodology seeks to : Recent decisions have not Ensure Eskom’s sustainability as a business is balanced with the considered Eskom’s sustainability impact on the economy where objectives include:- to ensure Eskom’s sustainability as a business and limit the risk of excess or inadequate returns, while providing incentives for new investment; to appropriately allocate risk between Eskom and its customers; to provide efficiency incentives without leading to unintended consequences of regulation on performance; to provide a systematic basis for revenue/tariff setting; and To ensure consistency between price control periods Integrated Resource plan (IRP) 2019: Rapid increase in tariffs to Latest NERSA decision does not support further investment in industry needed facilitate such a transition 9
The MYPD methodology through the allowable
 revenue (AR) formula forms the basis for revenue
 applications (3/22)

 = ( × )+ + + + & + ± + & ±

 Primary Operating Integrated
 Energy Return on Tax &
 IPPs expenditure Demand Depreciation Revenue
(incl imports and Assets Levies
 DMP)
 (incl R &D) Management

 + + + + + + =

 Return on assets = % cost of capital allowed X depreciated replacement asset value

 NB: Regulatory Clearing Account (RCA) and Service Quality Incentive (SQI) are
 not generally included in a revenue applications

 Robust methodology, if implemented (even in a phased manner) would allow for
 recovery of efficient costs and a fair return
 10
Eskom does not recover revenue as anticipated in
Government Support Package of 2015 - R60bn conversion to
equity (as shared in Parliament’s SCOA) and R23bn equity (4/22)

 Unit FY2014 FY2015 FY2016 FY2017 FY2018
 MYPD 3 decision allowed revenue R'mill 143 101 156 057 171 769 186 794 205 213
 Actual recovered revenue R'mill 136 926 147 270 156 132 166 777
 RCA Decision R'mill - - 7 818 11 242 -
 MYPD 3 decision price increase % 8% 8% 8% 8% 8%

 MYPD 3 decision average standard tariff price c/kWh 65.51 70.75 76.41 82.53 89.13

 Actual average standard tariff price increase % 8% 8% 12.69% 9.4% 2.2%

 Actual average standard tariff price c/kWh 65.51 70.75 79.73 87.23 89.13
 Expected % price increase in accordance with
 % 8% 8% 13% 13% 13%
 Government Support Package (GSP)
 Expected price in accordance with
 c/kWh 65.51 70.75 79.94 90.34 102.08
 Government Support Package (GSP)

 GSP anticipated price of 102c/kWh by FY 2018 however, MYPD 3 NERSA decision
 reached only 89c/kWh by FY2018 and 94c/kWh by FY 2019
NERSA’s decisions from MYPD 3 to MYPD 4 have
 resulted in a revenue shortfall of ~R350 billion
 (5/22)

300,000
 Eskom application
 NERSA decision
 R350 bn shortfall
250,000

 The shortfall between
200,000 Eskom’s application
 and NERSA’s decision
 is R350 billion. This
150,000 difference can be
 equated to the debt
100,000
 value on the balance
 sheet

 50,000 The tariff did not allow
 Eskom to build cash
 reserves for the New
 0 Build programme
 2020
 2014

 2015

 2016

 2017

 2018

 2019

 2021

 2022

 MYPD 3 FY18/19 MYPD 4
 12
Debt continues to increase even though price
 levels are increased – indicating too low prices
 (6/22)

 Price levels and Debt increasing

 500 000 100
 450 000 The average price has 90
 400 000 increased 5 fold whereas 80
 debt has grown by nearly

 Price c/kWh
 350 000 70
Rand millions

 10 fold over the same
 300 000 60
 window
 250 000 50
 200 000 40
 150 000 30
 100 000 20
 50 000 10
 0 0
 2009/10

 2013/14

 2017/18
 2007/08

 2008/09

 2010/11

 2011/12

 2012/13

 2014/15

 2015/16

 2016/17

 2018/19
 Total debt (LHS) c/kWh (RHS)

 13
Even the phased ROA would have contributed
 significantly to migration to efficient cost reflectivity
 (7/22)
 NERSA determined return on assets
% 8
 7 NERSA official, %
 6 NERSA allowed, %
 5 NERSA after R23bn, %
 4
 Actual, %
 3
 2
 1
 0
 -12014 2015 2016 2017 2018 2019 2020 2021 2022

 -2

• To have an apple to apple comparison to NERSA decisions, the actual ROA is calculated by the actual
 profit after depreciation and before interest and tax being divided the restated actual depreciated
 replacement cost (DRC) of the Eskom asset base
• The graph above indicates that Eskom has in essence not being recovering any ROA (number hovers
 around zero)
• The situation worsens in the MYPD 4 period where the decision is already below zero – with an
 approximate negative 1% ROA
• Thus the assumptions that NERSA makes on Eskom being in a position to cover its interest and debt
 commitments does not materialise as actuals
• The result is further burdening Eskom’s balance sheet to continue to provide electricity in this unsustainable
 situation – if not arrested
 14
Attempts by Eskom to reach NERSA efficient price
 level were not supported by reasonable price
 increase decisions (8/22)
 Price comparison – c/kWh (constant 2019)
 140
 BUSA – 108c/kWh
 120 EIUG – 118 c/kWh
 IRP – 116c/kWh
 100

 80

 60
 NERSA price path to cost-reflectivity - upper boundary
 40 NERSA price path to cost-reflectivity - lower boundary
 Actual ave prices
 20 Price at %ROA equal to %WACC

 0
 2007 2008 2009 2010 2011 2012 2013 2014 2015 2016 2017 2018 2019

• Various studies confirm Eskom’s price is below efficient & prudent cost reflectiveness
• Up to this point Eskom’s balance sheet has subsidised consumers – worsens in MYPD 4
• Eskom’s MYPD3 to MYPD 4 applications attempted to get towards NERSA’s lower boundary – but NERSA decisions
 reversed trend
• Any estimation of recovery of corruption losses, Municipal debt recovery, Soweto debt recovery – will not provide a sustainable
 path for Eskom to be self sufficient
• Continual Government support is not economically viable – require an adjustment to the base price to reflect efficient cost
• Price path to be provided by NERSA to cost reflectivity – EPP (2008) – assumed cost reflectivity by 2013. But will not occur even
 by 2023
• Namibia made the tough decision between Nampower and Regulator to reach cost reflectivity – took 10 years.
• Acceleration to efficient & prudent cost reflectiveness indicates self sufficiency 15
The IRP 2019 indicates increasing electricity prices
even with renewables in the mix
 (9/22)

 16
A recent electricity tariff benchmark indicated that
Eskom’s price of electricity is one of the lowest in the
world (10/22)

Source: Statista (October 2018) 17
High-level cost and price benchmarking
 (World Bank’s 2016 report)
 (11/22)

• The World Bank undertook
 an analysis of electricity
 utilities in 39 countries in
 Sub-Saharan Africa, which Breakdown of the
 included an assessment of cost per unit of
 their opex and capex. providing electricity
 in comparison to
• The analysis concluded cash inflows
 that Eskom’s unit costs amongst 39
 are very low relative to countries in Sub-
 other SSA utilities (3rd Saharan Africa
 lowest).
• Similarly, Eskom’s average
 price is very low relative
 to other SSA utilities – but
 they are all pricing their
 electricity at unsustainably
 low levels thus are in (or
 heading to) significant
 financial difficulties.

 18
World Bank Report 2016 – ‘hidden costs’
(hidden from consumers by not being reflected in price)
 (12/22)

• The World bank study defined certain parameters that reflect efficient operations. Any
 deviation from these norms are seen to be inefficient
• The norms are
 - Transmission & distribution losses (both technical and commercial) should be
International experience: Overall average price increase with incentives for sensitive sectors (13/22) Nearly all countries have a goal to move towards cost-reflective tariffs based on prudent and efficient cost: – The pace of movement is based on fiscal strength, need to protect vulnerable sectors and relative sector competitiveness – Industries in countries are subsidized in different manners, dependent on the historical development, level of government involvement and socio-economic issues. – Subsidies towards the poor: Various initiatives exist, depending on the focus and developmental phase the country is in. – The common thread is that the State is significantly involved in determining vulnerable sectors and type of support that is needed with short and long term incentives (including tax breaks; consumption subsidies, direct subsidies, etc.) However, currently in SA, the protection of most vulnerable sectors are carried within the electricity tariff through cross-subsidies to a limited number of customer categories. – Large municipalities, industrial and mining customers contribute to the cross- subsidies while residential and rural consumers receive the cross-subsidies – Large customers and the state cannot continue to carry the burden.
How can the poor be protected?
 (14/22)

 Through the MYPD process NERSA approves the prudent and efficient revenue
 that must be recovered by Eskom to remain financially sustainable. Eskom must
 therefore recover the full revenue as approved by NERSA.
 • If one customer group pays less (are subsidised) within the tariff base, another
 customer group must pay more (to pay for the subsidies) as costs do not go away
 and Eskom must still recover approved revenue.
 • Eskom does not have the mandate to determine which customers should be
 subsidised – government should develop and integrated policy.
 • International regulatory practices clearly make a distinction between role players in the
 industry
 – Government: Policy
 – Regulator: Implementation rules and ensuring implementation of policy
 – Utility: Implementation of policy according to regulatory rules
 • The Eskom Retail Tariff and Structural Adjustment (ERTSA) methodology, however,
 provides for “…..the Energy Regulator to…..allow cross-subsidies between
 various customer groups”.
 • In the past NERSA has made a decision to limit the increase to the 2 blocks of
 the Eskom lifeline tariff (Homelight 20A) to protect the poor. Regulators typically do
 not have policy powers which are normally reserved for Governments. 21
21
Industry Pressure Points are more than just energy
requirements (15/22)

Energy: Economy/Growth:
• Annual Price Increases [above inflation] • Low commodity prices
• No clear long term price indication – 10 year plus • Rising raw material costs
 required to increase investment (ito refurbishment, • Forex exchange rate
 new capacity) • Low economic growth
• Cross-Subsidisation through tariffs • Excess productive capacity in many countries
• Availability & Reliability of Electricity
• Increasing Fuel costs Technology:
 • Companies are not upgrading to newer
Manpower: technologies and processes due to uncertainty
• Manpower costs in SA
• Unrest and strikes
 Environment:
Logistics: • Carbon Tax
• Rising prices due to fuel costs • Emissions compliance costs
• High cost of rail (one example quoted - it cost more
 to transport internally to our ports than to ship
 overseas)
• Large distance of transport – international
Overview of the Multi-Year Price Determination
 (MYPD) Framework
 (16/22)

• MYPD Revenue Applications are usually made for a three year period, after which
 an Allowed Revenue Determination is made by NERSA for each of the years

• Thereafter, on a yearly basis, a Regulatory Clearing Account (RCA) Application is
 made to NERSA, to deal with variances between what was determined by NERSA
 for purposes of its revenue determination, and what actually materialised

• Is seen as a backward looking reconciliation

• The variances are mainly as a result of two key reasons:-
 • Change in assumptions made during the MYPD Revenue decision
 • Poor decisions made by NERSA

• The application is based on Eskom’s Audited Financial Statements and is for
 efficient and prudent costs incurred by Eskom

• The RCA Balance could be either in the favour of Eskom or in the favour of the
 consumer similar to the slate mechanism in the petrol price only over longer
 periods
• Nersa decides the period over which under or over recoveries are collected.
 23
NERSA RCA decisions based on incorrect application
 of MYPD methodology resulted in R41.2bn shortfall
 (17/22)
• Eskom made RCA application in accordance with MYPD methodology and precedents of FY
 2014 and MYPD 2 period
• Eskom did not review the 2014 RCA decision as it was based on sound principles in terms of the
 methodology

 Financial Eskom NERSA Court applied Efficient cost Timing of Delay in
 year application decision Shortfall incurred liquidation recovery

 2014 R22.8bn R11.2bn None 2014 2017 3 Years

 2015 R19.1bn R12.6bn R4.9bn 2015 2020 and 2021 5 years

 2016 R23.6bn R12.1bn R8.4bn 2016 2021 and 2022 5 years

 2017 R23.9bn R8.1bn R13.6bn 2017 2023 6 years

 2018 R20.6bn R3.9bn R14.3bn 2018 2021 and 2022 4 years

 Total R110.0bn R47.9bn R41.2bn
 This values of R26.9bn
 NERSA disallowed relate to recent court
 total of R62bn however judgement on RCA’s for
 Eskom is only years FY15-17
 reviewing R41.2bn
 24
Eskom incurs irrecoverable carrying costs (TVM) of
 R18bn for delay in implementing approved RCAs
 (18/22)

 Eskom Application Nersa decision Shortfall Time value of money
 27
 24 24
23
 21
 19

 14 14
 13 13
 11 12
 8 8
 5 5 5
 4 4
 3
 1

 2014 2015 2016 2017 2018 2019

Assumptions and notes made for the determination of these values
• Shortfalls refer to court applications made by Eskom Board due to MYPD methodology and previous
 precedents not being applied by NERSA
• Court review applications are successful and remitted to NERSA to make further adjustments
• The MYPD methodology does not allow for time value of money (TVM)
• The TVM indications are shown (calculated at a rate of 10%). These do not translate into any recovery
• Estimated TVM calculated only for RCA balances determined by NERSA
 25
The Court set aside NERSA’s FY2015 to 2017 RCA decision and finds failure to process decisions within reasonable time inconsistent with Constitution (19/22) Extracts from Judgment Fundamental factual errors and decisions were not rational: – In respect of sales, NERSA deducted primary costs relating to lower sales volume. The judgment specifically states that while there is logic in how NERSA approached its decision on sales it overlooked that Eskom already deducted the primary energy costs and therefore it was impermissible for NERSA to deduct the primary energy costs again – With regards to coal costs, NERSA disallowed costs on the basis that Eskom should have purchased coal under cost plus contracts rather than short to medium term contracts. However Eskom was unable to procure this coal from cost plus contracts due to underinvestment in these mines as a result of a government request.* Therefore this decision was found to be not rational The Judgement accepts that Eskom had put forward a proper case for relief in those key areas where NERSA did not implement its methodology and precedents The areas specifically dealt with are the treatment of revenue variances, coal costs, Independent Power Producer Costs and the capital expenditure clearing account Way forward: – Decisions are remitted to NERSA – NERSA will make revenue and liquidation decisions NB: * Government request refers to Eskom not investing in any new cost plus mines when the 2015 equity support was provided. 26
Incorrect deduction of R69bn Government equity
 (20/22)
 763 Misappropriation of equity support through MYPD
 Only reviewing the 4 Decision
 decision to • By the date of the hearing (24 June 2020) NERSA
 deduction the had already conceded that its decision be
 R69bn equity reviewed and set aside. The only issue which
 661
 remained to be adjudicated was an appropriate
 remedy (Extract from NERSA heads of argument)
 • The Judgment requires the recovery of R23bn per
 69 annum from FY 2022 to FY 2024
 • NERSA has requested leave to appeal
 16 • Process is underway

 MYPD 4

 Eskom Application Shortfall
 Nersa decision Time value of money

 27
Conclusion (21/22) Striving for ‘User Pay” principle as alluded to by the President and Minister of Finance Currently Eskom’s average price is
Urgent intervention on vulnerable industrial sectors (22/22) Tariff support for large industrial customers in SA Eskom/electricity price is the wrong instrument for delivering subsidies to derserving customers because: Electricity price is not the only determinant of their competitiveness It’s a government policy decision. Not an electric utility decision. Using Eskom to deliver subsidies camouflages the subsidies and confuses Eskom’s financial picture To the degree that certain consumers and industries might be vulnerable to the cost-reflective price, the mechanism of direct, targeted subsidies could be used and would cost the central fiscus very much less than the cost of subsidising the current annual shortfall between Eskom’s regulated revenue and its prudent and efficient costs. Internationally utilities and governments are retaining large industrial (baseload) customers through tax rebates, tariff discounts or similar financial mechanisms. The baseload customers in South Africa are competing internationally with these ‘subsidised’ customers, so they need support to be competitive and sustainable. These customers are a large contributor to the SA GDP, jobs and Eskom’s revenue. The country needs to urgently assist industry to remain sustainable, as retaining these operations is critical from an economic perspective. Also, the loss of baseload customers sales and revenue results in additional upward price pressure on all customers than would otherwise be the case, placing further sales at risk. Relevant Government Departments together with Eskom have finalised proposals NERSA urgently requires Minister of DMRE to approve and provide the necessary long-term and short-term NPA frameworks against which any proposed negotiated pricing agreements (NPAs) would be adjudicated. 29
To contribute to the easing of Eskom’s financial challenges by cutting coal costs the entire portfolio of Eskom coal contracts were reviewed Recommendation 9.1.3 (1/4) Eskom undertook a bottom-up cost of mining exercise on all existing Short/Medium Term coal contracts. The exercise was based on information available to Eskom and the knowledge of internal coal mining subject matter experts. Due to the low stock days experienced in FY19, a number of short to medium term coal contracts were concluded through urgent and emergency procurement activities. The desperate situation that was known to coal suppliers, Eskom had very limited negotiation leverage and some of the contracts were sub optimally priced Engagements were held with seven suppliers (i.e. suppliers with high profit margins) to explore opportunities to reduce the contracted prices Eskom approached suppliers on individual contracts; however, it soon became apparent that most of the suppliers were only willing to engage on a portfolio basis. This meant that the lower priced contracts would be included for re-opening on price discussions. This resulted in higher overall costs to Eskom Suppliers saw this as an opportunity to increase their overall supply to Eskom by either offering additional volumes or new resources as a condition for price reductions. This approach did not present a cash savings for Eskom as the additional coal offered is not the cheapest option and given the current low demand and high stock days this is not a viable solution 30
While most suppliers were amenable to engage with Eskom, unfortunately, the majority of these engagements did not achieve the intended result of cash savings for Eskom (2/4) One of Eskom’s cost reduction levers was the optimization of the coal inventory by reducing coal deliveries to minimum contractual levels for all contracts, without compromising the station grid code levels. In addition, due to the low demand experienced in the first half of 2020, force majeure letters were issued to suppliers and engagements are underway to reduce coal deliveries to below the minimum contractual levels. These operational requirements posed challenges to the re-negotiation process as some suppliers wanted the resolution of operational issues as a pre-requisite for any engagements on cost reduction initiatives. Given the current high stock levels, an increase in their monthly volumes back to nominal levels is not feasible. Out of the negotiations with identified seven (7) suppliers, only one (1) supplier negotiation has yielded a viable and beneficial offer for Eskom. The offer is currently going through the governance processes for approval The high-level savings potential identified for the renegotiation initiative is approximately R127M. 31
Feedback on negotiations per supplier
 (3/4)

SUPPLIER No. Of SUPPLIER OFFER OUTCOME
 Contracts
Supplier 1 6 • Not willing to consider specific contracts but rather • Analysis shows increasing the price of the lower
 a portfolio review and a price increase on their lower priced contract and decreasing the expensive
 priced contract contracts will be net negative for Eskom.
 • The supplier has also requested a response from • Eskom’s position is that the offer tabled is
 Eskom on an offer from an associate company first unaffordable
 prior to the supplier responding back to Eskom on this • No savings have been achieved and related
 engagement. The associate company’s coal offer engagements have been terminated
 was expensive for Eskom.

Supplier 2 4 • The supplier offered a tiered discount based on • The suppliers offer does not reduce the current
 monthly volumes with the effective discount being price to an acceptable level to justify a 3 year
 ~10.3% subject to a 3 year contract tenure increase tenure
 and monthly volumes increase • Based on the current low demand, additional coal
 • This would have resulted in an approximately 211% is not required and hence the conditions for savings
 contract value increase. offered cannot be considered

Supplier 3 1 • Supplier has offered to double their monthly • Based on the current low demand, high stock days
 contractual supply schedule and to be allowed to and associated minimum offtake profile, any
 supplement ~25% of the supply from alternate consideration of an increase in monthly offtake
 sources for a period of 24 months. volumes are not feasible at moment.
 • The price reduction offered is 2% on the ~25% • No savings achieved, however the offer is being
 alternate supply for 24 months. This proposal results analysed to quantify the impact of the small savings
 is a small saving to Eskom offered against the offer to double the monthly
 contractual supply to ensure it is a feasible option
 for consideration.

 32
Feedback on negotiations per supplier
 (4/4)
SUPPLIER No. Of SUPPLIER OFFER OUTCOME
 Contracts
Supplier 4 4 • An offer was received offering a 4% reduction on 2 • All Eskom’s new coal contracts have to come
 of the current contracts subject to the following through a tendering process and the proposal to sign
 • Enter into a new contract from the identified contract new CSAs outside of a tender process will result in
 resource at a higher price and quality (for approximately unfair procurement practices and is thus not
 6Mt). supported.
 • Enter into new contracts from 2 additional resources • No savings achieved
 (approximately 40Mt)
Supplier 5 4 • Offer based on other negotiations in portfolio • Savings opportunity implementation stage based
 • Savings opportunities offered are being explored as on changing loading point thereby reducing logistics
 part of negotiations on the Kusile RFP and changing costs.
 the coal loading point on an existing contract • The option to collapse an existing high price
 CSA and conclude a new CSA under the Kusile
 RFP at a lower price is being negotiated
Supplier 6 1 • Operational issues (low monthly offtake) to be • Based on the current low demand, high stock
 resolved before price engagements can commence. days and associated minimum offtake profile, any
 • However, they have offered coal from an alternative consideration of an increase in monthly offtake
 resource that is not part of this contract with an volumes are not feasible at moment
 associated price reduction to an alternate Power • The proposal for the alternate resource for another
 Station. Power Station is not viable as this station is fully
 • This resource is currently under business rescue, contracted.
 which they have been selected as a preferred bidder, • This option is also not preferred as a contracted
 however this process is not yet finalised. resource being replaced by an alternate one with
 associated legal implications.
 • No savings have been achieved
Supplier 7 1 • Supplier requires that the contracts monthly nominal • Based on the current low demand, high stock days
 values to be maintained (without any possibility of a and associated minimum offtake profile, any
 reduction) prior to any price reduction discussions consideration of an increase in monthly offtake
 volumes are not feasible at moment.
 • No savings have been achieved
 33
The Eskom Board and senior executives comply with the declaration of financial interest regulations and declare their financial interest Recommendation 9.1.4 Rate of completion Quality of information • Board - 100% A & F department conducted a review of the interest • Exco - 100% disclosed by the Board and • Employees - 90% Exco members • Some employees could not Non-disclosed interests connect from home due to 3G identified in the reviews have been addressed or not having access to eForms 34
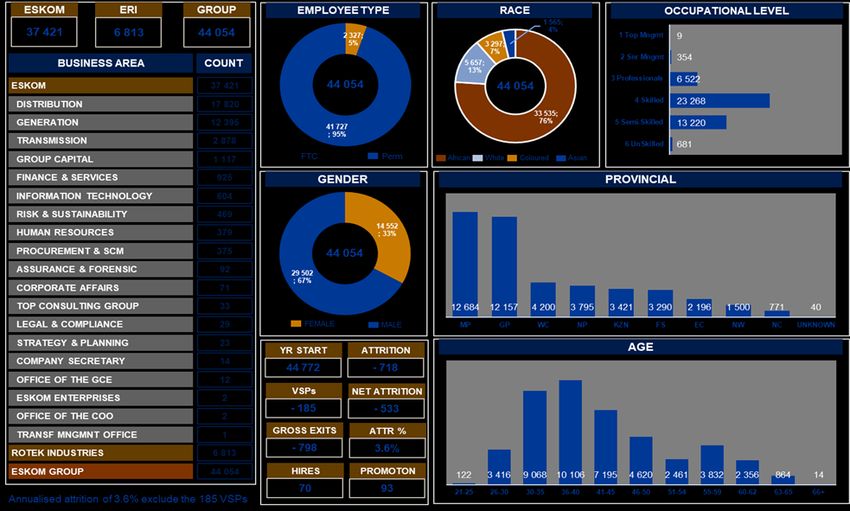
35 The filling of critical vacancies is to be expedited within a reasonable time at Eskom Recommendation 9.1.5 (1/7) • The Eskom workforce profile (below) at a glance indicates that Eskom has enough resources to deliver on its mandate. Some areas we will continue to source critical resources internally and externally to address attrition. Apply sentence case at all times (i.e. only the first letter of a sentence has a capital letter) • In the last 12 months, Eskom implemented two levers. One is the relinking of resources from Head Office to Operations Two a special dispensation was provided for Transmission, Generation, Eskom Rotek Industries, Distribution and Group Capital to fill critical resources through either an internal sourcing process or external recruitment. • These processes contributed a great deal to closing the critical vacancies 35
Eskom Workforce profile
 (2/7)

 36
Eskom undertook a process to relink staff to
Operations in 2019. (3/7)

• The aim of the relinking process is in order to strengthen operations,
 maximise decision-making, improve levels of accountability at the right levels
 of business, improve operational and financial efficiencies, maximise execution
 of strategy.

• A total of 8904 employees were relinked from service and support functions
 back to line (incl. Customer Services move to Dx).

• This includes the integration of 2371. Customer Services personnel into
 Distribution and 1511 employees from Group Technology back to line
 divisions.

• This process has yielded positive results in dealing with shortages of
 engineers in the line divisions. Distribution received 4154 employees, with
 Transmission receiving 1017 employees and Generation received 3023
 employees.

• Since the commencement of this process, Group Technology that is
 comprised of highly experienced technicians and engineers, Revenue
 Services, and Fleet Services were migrated to Operations.

 37
Breakdown of relinked employees from various
departments back to operations (4/7)

Customer Services integration into Distribution (2379 employees)

Group Technology (1511 employees)

Security (1072 employees)

Human Resources (784 employees)

Finance (772 employees)

Procurement and Supply Chain (732 employees)

Telecommunication (331 employees)

Facilities (294 employees)

Information Technology (144 employees)

Corporate Affairs (92 employees)

Primary Energy (71 employees)

 38
BREAKDOWN OF PERSONNEL BY ROLE
 (5/7)

 39
Continuously reviewing our resource
requirements in line with our workforce skills plan(6/7)

 • Parallel to this process of moving resources to beef up operations was
 a process to fill the rest of the critical vacancies through a
 recruitment process.

 • In May 2019, the People and Governance Committee
 subcommittee of the Eskom Board supported a special dispensation
 for the acquisition of 3 638 skills to fill critical positions in Operations in
 support of the Eskom turnaround.

 • The special dispensation was a once-off decision intended to be
 completed within five months from the approval date. Most
 appointments were through internal recruitment, followed by fixed-term
 contractors.

 • In settling the top leadership, Eskom set out to fill ten vacant executive
 positions at the beginning of the financial year. Seven appointments were
 made to date.

 40
Breakdown of personnel by role
 (7/7)
 Role Status Recruitment stage Next actions
 Transformation Management Office Concluded Appointment concluded. Candidate
 started on 1 June 2020
 (Group Executive F-Band)

 Corporate Affairs Internal movements (optimisation) Decision was taken to optimise the
 structures. The role will be filled from
 (General Manager E-Band) internal

 Company Secretary Concluded Appointment concluded. Candidate
 started on 1 June 2020

 Treasury Concluded Appointment concluded. Candidate
 started on 15 May 2020
 (General Manager E-Band)

 Information Technology Concluded Appointment concluded. Candidate
 started on 15 May 2020
 (General Manager E-Band)

 Project Engineering Concluded Appointment concluded – candidate
 started on 1 March 2020
 (General Manager E-Band)

 Government and Regulatory Affairs Concluded Appointment concluded. Candidate
 starting on 1 October
 (Group Executive F-Band)

 Strategy and Planning Offer Sourcing concluded. Offer made to a
 candidate with anticipated start date of 1
 (General Manager E-Band) September 2020

 Legal and Compliance Sourcing/Candidate search In the process to source/search for
 suitable candidates – anticipate offer by
 (Group Executive F-Band) 30 September 2020

 Audit and Forensic Sourcing/Candidate search In the process to source/search for
 suitable candidates – anticipate offer by
 (General Manager – E Band) 30 September 2020

 41 41
Contents

• How allocated funds were used

• Progress on recommendations from oversight visit

• Review of all contracts

• Clarity on overpaid contracts

• Kusile and Medupi cost overruns

• Contracts that have increased in value

• Update on illegal contracts

• Clarity on loadshedding

• Eskom contribution to B-BBEE
Review of Contracts “During the 2019 oversight visit by the Committee, Eskom reported that they are reviewing all contracts in order to ascertain whether the entity receives value for money. Kindly provide progress in this regard and realised savings if any” Contract review Outcome of reviews In the absence of confirmed volume/demand no discounts could be provided. Contracts with major suppliers were Suppliers proposed sliding scale discounts identified and renegotiated and linked to confirmed volumes. the following were the responses Some suppliers were introducing the renegotiation of other contract conditions from suppliers including the contract price adjustment formula. Savings achieved were mainly in new contracts 43
Contents

• How allocated funds were used

• Progress on recommendations from oversight visit

• Review of all contracts

• Clarity on overpaid contracts

• Kusile and Medupi cost overruns

• Contracts that have increased in value

• Update on illegal contracts

• Clarity on loadshedding

• Eskom contribution to B-BBEE
Contracts implicated by R4bn Overpayment
 (1/9)

1 ABB South Africa (Package 21A) R1bn

 Tenova Mining and Minerals SA (Pty) Ltd R735m
2 (Package 24B, 24C and 24E)

 Tubular Construction Projects (PTY) Ltd R1bn
3 (Package 11A &17A)

4 Stefanutti Stocks Basil Read JV (Package 16)
 and Stefanutti Stocks Izazi JV (Package 28)
 R1bn

 Various site service contracts (Not in SIU scope) R180m
5

 45 45
Report on contracts overpaid by R4 billion (2/9) ABB – Estimated overpayment - >R1billion. During the tender between Siemens and ABB, the ABB price was higher than the price submitted by Siemens, however due to technical price adjustments made to the Siemens tender, ABB emerged as the cheaper option. The adjustment on Siemens was due to the fact that Siemens could not meet the synchronisation date for Kusile Unit 1 It is suspected that the dates used by Eskom during tender stage were never realistically achievable but this criterion was used to award the contract to ABB ABB was issued with four (4) major variation orders (VO)) with no substantiation documentation or records. These variation orders include: Kusile Unit 1 - Acceleration – R251m – VO was issued in February 2016 Kusile Unit 1 - Demobilisation Claim- R179m – VO was issued in October 2017 Kusile Unit 2 - Cabling – R311m – VO was issued in October 2016 Kusile Unit 2 - Acceleration – R290m – VO was issued on February 2017 46
Report on contracts overpaid by R4 billion (3/9) Tenova Mining and Minerals SA (Pty) Ltd – estimated overpayment - R735m. Tenova had claims for extension to the Time for Completion due to the delayed access to site and disruptions In 2015 the Contractor and the Employer engaged in a series of negotiations and both parties settled at R700m in 2016. Due to cash flow constraints from the Contractor, the Employer confirmed entitlement of R400m on 4 March 2016, R300m on 18 March 2016 and R35m in January 2017 This settlement agreement does not have all the requisite particulars to assess or verify the delays or costs claimed. On 23 August 2019 the SIU informed Eskom that they were investigating the Tenova contract for potential overpayment. The SIU further confirmed that on 1 October 2019, evidence in support of criminal charges against the relevant role players was referred to the NPA. 47
Report on contracts overpaid by R4 billion (4/9) Tubular Construction Projects (Pty) Ltd estimated overpayment of R450m and R163m. General Electric (GE) estimated overpayment of R400m. The Contractor submitted a value engineering proposal, which when evaluated led to Modification # 1 The modification was approved through Eskom governance structures including National Treasury As part of National Treasury’s approval they requested that an independent audit be conducted and was duly undertaken by Harvest. Items included in the modification remain questionable as to whether they provided Eskom any value and/or if the Contractor was really entitled to the additional monies Tubular contract was also an outcome of a de-scoping exercise concluded through a settlement agreement in February 2017 with Alstom (now GE), the main contractor originally appointed for the execution of the air cooled condenser scope of work. 48
Report on contracts overpaid by R4 billion (5/9) Tubular Construction Projects (Pty) Ltd estimated overpayment of R450m and R163m. General Electric (GE) estimated overpayment of R400m. The employer’s representative and contracts manager at the time did not recover the advance payment made to the contractor due to there being a R495m claim lodged by the contractor. The advance payment would have been offset against this claim if the adjudication went against Eskom. Eskom was successful in defending this claim and the advance payment bond for a value of R163 701 263,00 was encashed in April 2020. An investigation into the settlements reached and paid to GE in the de-scoping exercise has also been initiated. The amount under investigation is R400m. Tubular was also awarded a contract (P17A) for the Waste Water Treatment Plant in December 2012 after a de-scoping exercise from the contract originally awarded to Mott McDonald/PDNA This contract and the circumstances around the de-scoping are also being investigated. 49
Report on contracts overpaid by R4 billion (6/9) Stefanutti Stocks Basil Read (SSBR) - (P16) & Stefanutti Stocks Izazi JV (SSIJV) - (P28) – estimated overpayment of R1bn. SSBR (P16) put in claims for additional preliminaries and general (P&G) due to prolongation and stacking - working in multiple areas at the same time. These claims were not substantiated as required by the contract The employer’s representative and contracts manager at the time (2015 to 2018) made interim payments to the contractor without the requisite substantiation. This was done on the basis that they would conclude an overall “settlement agreement”. There was no consistency or verification of the actual P&Gs being paid on a monthly basis. The monthly payments varied between R15m to R50m per month No settlement agreement was reached and in early 2018 the new project director stopped the interim payments that were being made. SSBR referred this action (non-payment) to the dispute adjudication board (DAB). 50
Report on contracts overpaid by R4 billion (7/9) Stefanutti Stocks Basil Read (SSBR) - (P16) & Stefanutti Stocks Izazi JV (SSIJV) - (P28) – estimated overpayment of R1bn. Eskom successfully defended this adjudication and is now in mutually agreed discussions with SSBR and the standing DAB about the process to determine the actual claim entitlement Progress has recently been made in relation to the delay analysis between the contractor and Eskom experts. The quantum analysis will begin once adequate progress is made to the delay analysis SSIJV (P28) - during the execution of the contract, certain compensation events (CE’s) were agreed and paid without the final measurements being done The contractor has also submitted various other deemed accepted CEs claiming that the work was done and needs to be paid for at the contractor’s CE values. These disputes are currently in adjudication. 51
Report on contracts overpaid by R4 billion (8/9) General – (> R180m) There are numerous other services, CSI and Panel contracts that have been “red flagged” in multiple audits and reviews done on the project. Although these findings do not fall within the ambit of overpayment, these findings have been referred to Eskom Assurance and Forensic, Eskom Legal or possibly the SIU for further investigation. The project experienced problems in extending contracts to conclude the forensic, delay and quantum investigations. These problems are now mostly resolved and progress is evident. For the purpose of clarification, it must be noted that once an Eskom employee resigns, he or she is outside Eskom’s scope, and the law enforcement agencies then need to take over the process. Additionally, Eskom is supporting the law enforcement agencies to pursue civil claims against former employees involved in all the contracts mentioned above 52
The R5 billion Tegeta Resources & Exploration (9/9) The R5 billion is the total value of Eskom’s claim against Tegeta Resources & Exploration, which is in business rescue. Tegeta contract was concluded years ago, and was set aside by the high court earlier this year, 2020. In a joint presentation to parliament’s Standing Committee on Appropriations (SCOA) on 27 May 2020, Eskom was asked by the Chairperson of SCOA, Mr Sfiso Buthelezi who the contractor was that it had allegedly erroneously paid R5 billion to, what were the circumstances that led to this overpayment, and what progress had Eskom made in recovering the funds The response was that Eskom had awarded a coal supply contract to Tegeta Resources & Exploration. The contract was originally valued at R3 billion Eskom levied some penalties on the supplier, for various performance failures, that inflated the value of its claim against Tegeta at R5 billion Tegeta has been in business rescue process since 2018, and Eskom’s claim against Tegeta has since been reduced to R1.24 billion 53
Contents

• How allocated funds were used

• Progress on recommendations from oversight visit

• Review of all contracts

• Clarity on overpaid contracts

• Kusile and Medupi cost overruns

• Contracts that have increased in value

• Update on illegal contracts

• Clarity on loadshedding

• Eskom contribution to B-BBEE
Reasons for Kusile and Medupi power plants cost
overruns (1/15)

 Various issues at differing times resulted in delays of the programme and
 cost movements. The time buckets below highlights occurrence of key
 events since inception.

 • 2004: Government gives Eskom approval to • Eskom experienced unforeseen circumstances
 build power plans – A decision take “too late” • Eskom plagued by strike action, which in total
 • Needs necessitated by power insufficiency accumulated to 18 months of down time
 sees Eskom needing to commence the New • Failure of Factory Acceptance Tests (FATs)
 Build Programme urgently resulted in further delays
 • Eskom’s planning is inadequate due to the • Welding issues also led to delays of a minimum
 rush of 8 months
 • Inclement weather delayed certain activities on
 site

 2004-2007 2009-Present

 2007-2009

 • Issues around technical designs surfaced
 • Due to inadequate planning scoping was done
 incorrectly, costs estimates were inaccurate
 and designs were incomplete
 • Furthermore, due to market related issues, the
 costs that the equipment came at when orders
 were placed far exceeded Eskom’s estimates
 55
Reasons for Kusile and Medupi power plants cost overruns (2/15) Given the inadequate time to plan, absence of suitable resources in the country (in quantum and skill) and other consequential issues, Eskom, in an overly optimistic way, endeavoured to manage a programme of this magnitude for the benefit of the country. Eskom intended to partner with the best in the world to assist with engineering and integration issues. The governance process within Eskom as an organ of state was seen to be onerous and inhibiting from the point of view of these contractors. This left many of the engineering and integration processes wanting. It is clear, that the contractors and partners did not deliver against expectation Eskom had to make an impact on the local economy through its contracting approach. The timing and placement of the contracts e.g. the placement and finalisation of the boiler, turbine and civil contracts made integration difficult This together with the nature of the contracts left Eskom exposed to many claims from contractors 56
Reasons for Kusile and Medupi power plants cost overruns (3/15) For the key contracts placed, the choice of suppliers was limited; although processes were fair, Eskom was at times left with one supplier with which to negotiate Contractors provided prices based on the fast tracked schedules against which they were asked to deliver As the schedules moved out and the designs completed, the costs increased. To re-iterate the designs were not complete at the time of contracting and the project managers/developers were designing and managing risks after contracting In the end, Eskom decided to move decisively along a certain path for the benefit of the country, and there were mistakes made 57
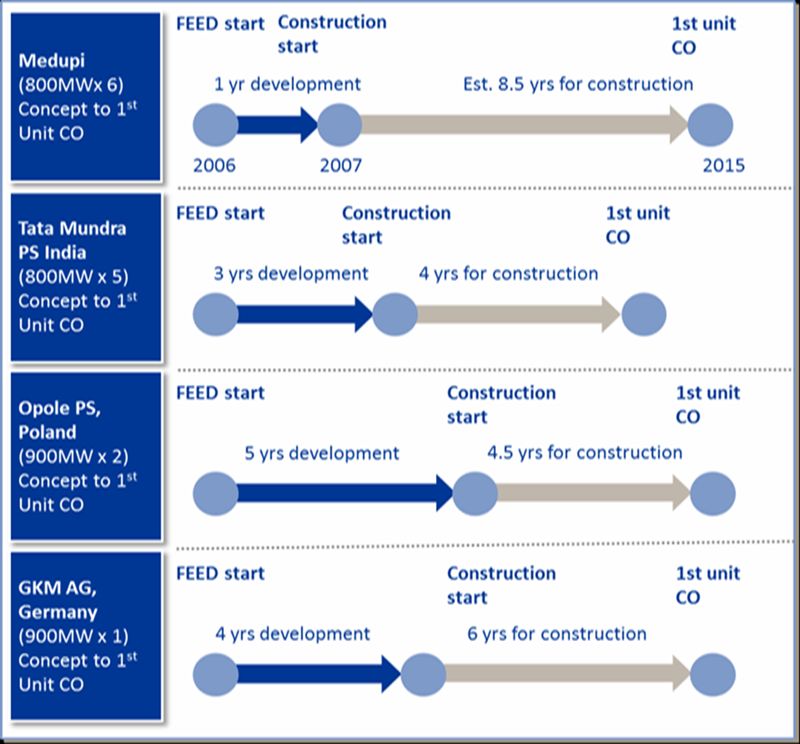
Reasons for Kusile and Medupi power plants cost
overruns (4/15)

 Schedule and Cost benchmarking: Medupi
 • Medupi has more units than the other power
 stations in this comparison

 • Medupi had only 1 year allocated to FEED, the
 shortest of all the projects profiled. 8.5 years
 were dedicated to construction

 • Medupi’s timeline between project
 development and the commissioning of the first
 unit is 9.5 years. It is still shorter than the
 Germany’s GKM AG10 years for a 900MW x 1
 plant

 • Medupi’s timeline is equivalent to Poland’s
 Opole 900MW x 2 plant, which also took 9.5
 years. However Poland had 5 years dedicated
 to FEED

 • Tata Mundra (800MW x 5) commissioned the
 first unit after 7 years, with 3 years allocated to
 project development. This was only 1.5 years
 shorter than Medupi’s commissioning timeline.

 58
Reasons for Kusile and Medupi power plants cost overruns (5/15) Globally projects are not built the way Eskom approached Medupi but are built one unit a time. Ideally in the South African context, a comprehensively defined green field project should take approximately 5 years in development. The results of poor pre-planning due to late start decisions are detrimental to project execution. Repeatability and forward planning can produce better cost and schedule certainty 59
Reasons for Kusile and Medupi power plants cost overruns (6/15) Key issues that lead to cost movements/cost/escalations/under estimations Set up and development: Due to the time constraints, insufficient upfront work was done on the projects leading to incomplete scoping before contract awards When the decision was made pressure to bring new capacity online placed time constraints on project teams. Additional work that was not part of the plan as well as additional engineering information led to delays and cost movements. Changes in environmental standards and requirements, the geotechnical and environmental conditions at the location of the projects and the lack of updated and current engineering standards during the early days of the projects further resulted in cost escalations and time delays later in the projects’ life (through variation and claims). 60
Reasons for Kusile and Medupi power plants cost overruns (7/15) Key issues that lead to cost movements/cost/escalations/under estimations Execution: This phase started without a firm design to meet a fast tracked schedule Eskom should accept responsibility for not internally aggressively pushing back on the expectation to meet an unrealistic schedule The lack of upfront integrated schedule covering all project development, engineering, procurement and construction management activities and timelines meant that all activities were out of phase and this resulted rework, delays and subsequent (both local and international) claims. Projects were also stalled after starting due to funding availability. Contractor expertise: The initial assumption that the contractors have the necessary knowledge and skills to execute mega projects in the South African environment to supplement Eskom did not prove to be valid Supplementing the Eskom knowledge and experience with that of the Execution Partners was also only partially successful. 61
Reasons for Kusile and Medupi power plants cost overruns (8/15) Key issues that lead to cost movements/cost/escalations/under estimations Project Integration: This was also another major contributor to cost overrun Eskom was aware from the beginning that not having a firm design, but rather using the Majuba design as a proxy for the project, was not optimal (but a necessary requirement to fast track the project) The linkages between packages were not properly understood. Eskom should have contracted to overcome this challenge; also a truly turnkey approach was not an option at that time Force majeure (strikes): led to >24 month delay with associated cost movements. Contractor performance and productivity: specialized welding on the boiler was of poor quality, the control and instrumentation factory acceptance test (FAT) and substantially lower than anticipated productivity resulted in both cost and schedule delays 62
Reasons for Kusile and Medupi power plants cost overruns (9/15) Key issues that lead to cost movements/cost/escalations/under estimations Resources constraints: Eskom recognised from the beginning of the new build programme that there were insufficient competent engineering practitioners to execute Medupi, Kusile, Return to Service Units and Gas projects at the same time A strategy was formulated to contract-in large and multinational Engineering Companies (e.g. Black & Veatch, PB Power, ESBi, etc.) to assist Eskom. However, the roles and responsibilities were not ideally defined. As a result, the decision making and processes to be followed sometimes took too long, and in some cases resulted in the duplication of effort. The design assurance accountability and requirements for compliance with the South African Engineering Profession Act was not dealt with early enough The Panel members had limitations in this regard and Eskom had to close the gap. In the end, the context in which Eskom operated in proved to be something that the contractors were unable to cope with; these included some of the commercial / procurement processes and requirements, the public finance management act requirements of a state owned company. Eskom had to insist that these be followed 63
Reasons for Kusile and Medupi power plants cost overruns (10/15) Key issues that lead to cost movements/cost/escalations/under estimations Investigations into corruption: Delays caused as a result of modifications to critical contracts not being possible due to these contractors being investigated for alleged corruption. Business Rescue & Financial Stability: The impact of various contractors that have gone into business rescue has significantly affected the schedule including (Clyde Bergerman (CBZ), who were contracted to construct the dust handling plant in Kusile, Unit 4, 5 & 6 not started. Contractors’ financial stability and poor cash flow resulting in reduced resources and slow progress. Contractors that are terminating their contracts have also impacted negatively on the schedule Claims: Delayed claims settlements between Eskom and Contractors resulting in low productivity. Unrecoverable delays due to: low productivity; contractors not achieving contractual completion dates which impact the works of the follow-on contractors (access delays – Chemical Clean and Steam Blow), demobilization of critical resources (Boiler package, balance of plant mechanical and miscellaneous structures), Rework, design changes and construction integration challenges have also caused significant delays. 64
You can also read