Quarterly Gas Review: Analysis of Prices and Key Themes for 2020 - Oxford Institute for Energy
←
→
Page content transcription
If your browser does not render page correctly, please read the page content below

January 2020

                              Quarterly Gas Review:
         Analysis of Prices and Key Themes for 2020

    Introduction
    The OIES Natural Gas Quarterly aims to provide a regular insight into the thoughts of Research Fellows
    on topical issues as well as providing a different angle on trends in global gas pricing. In the pricing
    section we review our LNG Tightness measure, look at the Russian gas export price to Europe versus
    the marginal cost of US LNG and also review prices on Gazprom’s Electronic Sales Platform (ESP). In
    Asia we compare the Japanese LNG import price with the LNG spot price and also look at Chinese
    domestic prices compared with JKM.
    This quarter we also outline our views on the Key Themes for 2020, including thoughts from Mike
    Fulwood on LNG project FIDs and how developers may need to accelerate plans if they are not going
    to miss the next window of opportunity in the mid-2020s. Mike Fulwood and Jack Sharples then question
    the availability of LNG for Europe and ask whether sufficient storage will be available to take all the
    possible supply. Anouk Honore then looks at a possible cause for optimism for European gas demand,
    highlighting key legislation that should be passed in 2020 concerning coal phase out in Germany.
    Continuing the European theme, Marshall Hall discusses likely further progress this year in the
    transformation of the Dutch gas market, while James Henderson considers the increasing diversity of
    Russian gas export flows via pipeline and LNG.
    Jack Sharples develops the theme of Russian gas exports further, suggesting that the Gazprom ESP
    can provide further evidence concerning the company’s export strategy in 2020. On a different, but still
    European, theme Anouk Honore then considers the potential impact of the new EU Green Deal and
    considers how it could be developed further during the year with potentially long-lasting consequences
    for the energy system. Martin Lambert then suggests that 2020 could be the year when we start to see
    more active progress in decarbonisation outside Europe, with Australia, Japan and even the US
    highlighted as possible sources of technology development and practical action in the decarbonisation
    of the gas sector. Michal Median then outlines her view on the outlook for the Chinese gas sector in
    2020, suggesting that coal to gas switching could regain some momentum and that LNG could benefit
    as a result. Finally, Patrick Heather looks at the emergence of the JKM price marker as a benchmark
    for gas prices in Asia and suggests that further progress could be made this year towards it becoming
    the pre-eminent pricing tool in the region.
    The names of authors can be found at the bottom of each article, along with their email addresses, and
    we encourage you to contact them individually if you have any comments or questions.
    James Henderson
    Director, Natural Gas Programme
    Oxford Institute for Energy Studies
    james.henderson@oxfordenergy.org

Energy Insight: xxxx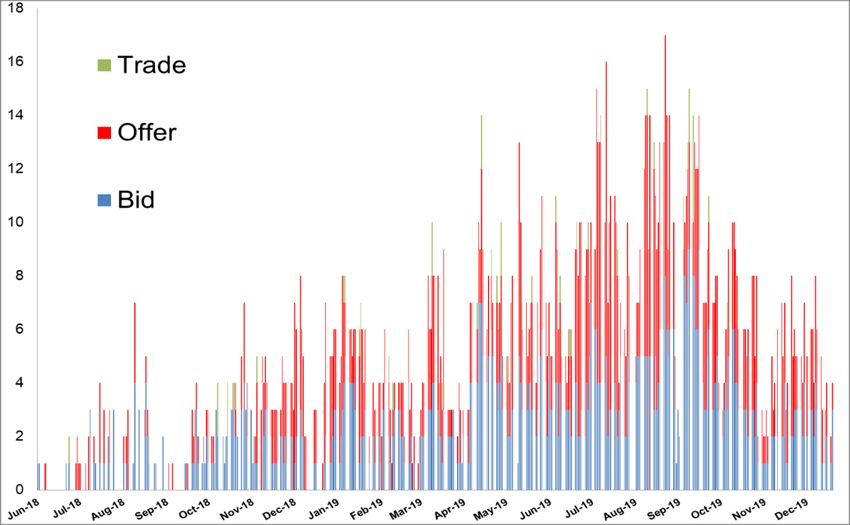
1. Pricing Analysis
In terms of prices, we set out below four charts that we believe offer interesting insights into gas prices
on a global and regional basis. We will continue to follow these trends throughout the year, and may
add others as and when they become relevant, and would be happy to receive feedback from readers
if they think that new and interesting points of comparison are emerging in the global gas market.
1.1 LNG Tightness
Firstly, we consider our “LNG Tightness” analysis as an indicator of whether the gas market is providing
any indication that new projects are required to balance the market or alternatively whether there is no
need for new FIDs in an oversupplied global balance. The graph below is based on data from Argus
Media and shows the prices for TTF in the Netherlands, the ANEA spot price in Asia and the Henry
Hub price in the US. It then calculates the highest netback from Europe or Asia to the Gulf of Mexico
based on the relevant transport costs. The LNG Tightness calculation is then shown on a historical
basis and also based on futures prices, and provides an indication of whether developers in the US can
expect to recover the cost of liquefaction on the Gulf Coast (which here is assumed to be $3/mmbtu
based on the traditional Cheniere contract). A margin above this level would provide an obvious
incentive for new projects while a margin well below this would suggest an oversupplied market.
As can be seen from Figure 1.1 below, the margin has fallen sharply from its highs in 2018 and was
below $2/mmbtu for most of 2019. It continues to languish at this level in early 2020 and futures prices
suggest that there is little likelihood of a sustained recovery until well into 2021. Indeed, on current
assessments the margin could even get close to zero in the middle of this year, suggesting that even
short-run marginal costs may not be covered. As Mike Fulwood and Jack Sharples note in their article
later in the Quarterly, the nadir for European hub prices could be reached in Q3 2020, especially if
storage in Europe is filled faster than in 2019. Given that Europe acts as the ‘market of last resort’ for
global LNG supplies, this could present serious challenges to LNG exporters, depending on the extent
to which they consider aspects of their value chain to be ‘sunk costs’ that must be borne regardless of
their export netbacks.
Figure 1.1: An assessment of “LNG Tightness”
14.00
12.00
10.00
8.00
$/MMBtu
6.00
4.00
2.00
-
Jan-16
Oct-16
Jan-17
Oct-17
Jan-18
Oct-18
Jan-19
Oct-19
Jan-20
Oct-20
Jan-21
Oct-21
Jan-22
Oct-22
Jan-23
Oct-23
Apr-23
Apr-16
Apr-17
Apr-18
Apr-19
Apr-20
Apr-21
Apr-22
Jul-16
Jul-17
Jul-18
Jul-19
Jul-20
Jul-21
Jul-22
Jul-23
LNG Margin LNG Margin (Forward) HH TTF ANEA HH (Forward) TTF (Forward) ANEA (Forward)
Source: Argus Media, OIES Analysis
Despite this it is interesting to note that LNG project FIDs continue to move ahead, as described by
Mike Fulwood in his article on page 6. The LNG Tightness graph does suggest that the market situation
will improve by the mid-2020s, although the margin barely reaches $3/mmbtu by 2023. Nevertheless,
the pace of current investment decisions could still lead to a further surplus of supply by 2025 and
beyond. We can perhaps already see a determination by lower cost producers to reinforce their position
in the market as soon as possible in order to reduce the risk of having their reserves stranded by the
The contents of this paper are the authors’ sole responsibility. They do not necessarily represent the views of
the Oxford Institute for Energy Studies or any of its Members. 2uncertain gas demand outlook, and the LNG Tightness assessment will continue to provide a good
indication of the impact that this may have on the outlook for US LNG.
1.2 Russian gas price and TTF versus US LNG in Europe
In establishing a global balance for LNG, Europe remains a key market, mainly because of the liquidity
of its trading hubs and the availability of storage. This means that it tends to be the ‘market of last resort’
for LNG supply that cannot find a market elsewhere, especially in Asia. However, Europe is also the
main market for pipeline gas, with the most flexible source of this coming from Russia. As a result, it is
always interesting to compare the price of Russian gas with its key competitor at the margin, US LNG,
and also to see how the price of Gazprom’s is situated relative to the hub price in Europe at the TTF.
Figure 1.2 compares the average Russian export price with TTF and then compares both with the Long-
and Short-Run Marginal Cost of US LNG, based on the Cheniere formula.1
Figure 1.2: Russian gas price and TTF versus US LNG in Europe
12.00
10.00
8.00
US$/mmbtu
6.00
4.00
2.00
0.00
Jan-15 Jul-15 Jan-16 Jul-16 Jan-17 Jul-17 Jan-18 Jul-18 Jan-19 Jul-19
TTF Ave Russia US SRMC US LRMC
Source: Data from Argus Media
A logical strategy for Gazprom and other flexible pipeline suppliers to Europe would be to manage
supply in order to help maintain a hub price at or above the SRMC of US LNG but below the LRMC.
This would allow revenues to be optimised without creating any incentive in Europe for new
development of US projects. Figure 1.2 shows that, with rare monthly exceptions, the price has been
in the optimal range since mid-2015, suggesting that pipeline suppliers such as Gazprom, although
being largely price-takers, may also be mindful that in a loose market (as at present) there is little
commercial logic in supplying extra gas that would push the European price below the SRMC of US
LNG while in a tight market it makes sense to offer extra gas to keep the price below the LRMC. Of
course, it should be acknowledged that the outcome is not driven by Gazprom as both consumers who
nominate sales of Russian gas under their contracts and other suppliers (such as Equinor and
Sonatrach) who compete with Russian supply in Europe certainly have an influence. Nevertheless, the
graph can give some indication of market conditions and also how Gazprom is coping with an over-
supplied or under-supplied market.
1.3 The Price at Gazprom’s Electronic Sales Platform (ESP)
Another interesting and new indicator of Gazprom’s pricing strategy in Europe can be found by looking
at the prices generated in the regular auctions there. Jack Sharples discussed the details around the
ESP in his article on page 17, but we will continue to monitor the ESP price relative to Gazprom’s
contract prices and relative to European hubs on a quarterly basis. As Figure 1.3 shows, prices on the
ESP were initially higher than Gazprom contract prices, with the company’s stated strategy being to sell
extra gas at a premium price, not a discount. However, it is clear that from early 2019 this strategy was
put aside, and the ESP was used to sell extra gas at levels increasingly in line with relevant European
1
The Long Run Marginal Cost of US LNG (LRMC) is calculated as ((Henry Hub Price x 1.15) + $3 liquefaction tolling fee + $0.7
transport cost to Europe + $0.4 regasification cost in Europe). The Short Run Marginal Cost (SRMC) is the same calculation
without the liquefaction fee.
The contents of this paper are the authors’ sole responsibility. They do not necessarily represent the views of
the Oxford Institute for Energy Studies or any of its Members. 3hubs. Deliveries to TTF-Gaspool, NCG and Austria-Slovakia account for well over 90 per cent of the
ESP total since the start of 2019, and the fact that Gazprom is prepared to sell its gas at these prices
and well below its own long-term contract price suggests that it has been pursuing a market share,
volume-based strategy during this period. We will continue to monitor its pricing strategy using this
graph over the next few quarters as an indicator of its continuing tactics.
Figure 1.3: Gazprom’s ESP price versus European Hub Prices
ESP vs Average of Day-Ahead and Month-1 European Hub Prices
(EUR/MWh)
30.00 28.77
27.45
25.46
23.63
21.11
25.00
18.01
16.09 15.56
14.86 15.52
20.00
12.02 13.54
11.52 11.76
11.71
15.00
10.00
5.00
ESP Index TTF-Gaspool NCG-Czech Austria-Slovakia Gazprom LTC
Source: GazpromExport, Argus Media, OIES Analysis
1.4 Japan contract and spot prices
The relationship between contract and spot prices in Asia is becoming of increasing interest. As Patrick
Heather notes in his article on the increasing liquidity of the JKM benchmark on page 25, customers
tend to demand change in the formation of prices when the current situation creates a significant
disadvantage for them. This certainly occurred in Europe when spot and contract prices diverged and
customers began to demand an end to oil-linked pricing, catalysed by new EU rules on market
liberalisation. The trend away from oil-linked pricing in Asia has been much more gradual, and indeed
some might argue that it has barely started, but as Figure 1.4 shows, a significant divergence between
spot and contract prices has emerged in 2019 and is starting to act as a prompt to action. The instance
of arbitration cases has started to increase, albeit from a low base, and rumblings of discontent from
those tied into higher-priced oil linked contracts has grown. We will continue to follow this trend through
2020 to see whether the pressure for change continues to build.
Figure 1.4: Japan contract price versus spot price
25.00
20.00
US$/mmbtu
15.00
10.00
5.00
-
Jul-14
Mar-16
Nov-17
Jul-19
Jun-12
Nov-12
Apr-13
May-15
Jun-17
Apr-18
Jan-12
Sep-13
Feb-14
Dec-14
Aug-16
Jan-17
Sep-18
Feb-19
Oct-15
Contract Spot
Source: Argus Media
The contents of this paper are the authors’ sole responsibility. They do not necessarily represent the views of
the Oxford Institute for Energy Studies or any of its Members. 41.5 Chinese domestic price versus LNG import price
An increasingly important indicator in Asia will be the Chinese domestic gas price, and we plan to start
monitoring this on a quarterly basis. The market continues to expect that low spot JKM prices will filter
through to domestic prices, leading to an uptick in China’s gas demand. But as the chart below
highlights, domestic city gate prices (taking Shanghai as an example) are disconnected from JKM (and
from other international prices for that matter). With JKM prices currently falling, city gate prices remain
unchanged while domestic wholesale prices (assessed based on gas sold to end-users, given that
sellers can adjust prices up or down by 20 per cent on city gate prices) are inching up, likely on rising
heating demand. That said, domestic prices are nowhere near the highs seen in the winter of 2017-
2018, or even close to last year’s winter prices, suggesting the market remains relatively well supplied.
But going forward, it will be important to monitor the relationship between domestic city gate prices,
wholesale prices and import costs and how this will impact price reform. As the government opens the
market to new buyers, who will likely purchase more spot cargoes or index their contracts to spot/JKM
values, and with supplies from the Power of Siberia now coming into Northern China, the impetus for
changing the domestic pricing mechanism is increasing. While the government is unlikely to liberalise
prices altogether, it will want to see domestic prices reflect international movements more regularly. Yet
while Beijing wants lower prices to encourage end-user demand, it would also like to maintain sufficient
incentives for the majors to keep producing domestic gas, suggesting that some level of administrative
intervention will remain.
Figure 1.5 Chinese domestic wholesale assessed gas price versus JKM and Shanghai prices
(US$/mmbtu)
25 Average dom wholesale Shanghai citygate
Shanghai industrial JKM
20
15
10
5
0
Jun 17 Dec 17 Jun 18 Dec 18 Jun 19 Dec 19
Source: NBS
The contents of this paper are the authors’ sole responsibility. They do not necessarily represent the views of
the Oxford Institute for Energy Studies or any of its Members. 52. Key Themes for 2020 2.1 LNG FIDs in 2020 – Is this The Final Countdown? At the beginning of 2019 OIES looked at the prospects for LNG FIDs for the year and noted that if FIDs exceeded 60 mtpa then there was every prospect of another supply glut in the mid-2020s, when the projects started up. In the event, with the late and slightly unexpected FID for Nigeria Train 7, the total of FIDs exceeded 70 mtpa. Figure 2.1 - LNG FID Barometer 2019 Source: OIES In addition to those projects which took FID in 2019, there are at least three projects which look likely to take FID in the first half of 2020, including the prospect of six new Qatar trains totaling 48 mtpa. Rovuma LNG – the Exxon/ENI project in Mozambique – and the small Woodfibre project in Canada, also look imminent, adding another 17 mtpa. There are also numerous US projects which are looking to progress to FID if they can line up offtake agreements in the near future. These include Tellurian, Next Decade, Venture Global (Plaquemines) and Texas LNG. Possible expansions of recently started US projects such as Cameron and Freeport have also been discussed. The rest of the world is not standing idly by either, with possible new or expansion projects in Russia, Papua New Guinea, Mozambique, Senegal/Mauritania and Australia. At the end of 2019, total available LNG export capacity was some 520 bcm. By 2027, only taking into account projects which have taken FID, total export capacity will have risen to 700 bcm. Adding in Qatar, Rovuma and Woodfibre would take total export capacity to some 785 bcm – an increase of 50 per cent over end 2019. While LNG import growth has been strong in 2019, with an estimated increase of 45 bcm or 11 per cent, this has largely relied on Europe’s ability to absorb rising supply rather than any fundamental rise in demand for LNG. Even taking this into account, unused LNG export capacity (available capacity minus total exports) in 2019 was around 30 bcm, up slightly from 2018. If this level of spare capacity is maintained, the increase in LNG imports between 2019 and 2027 would need to average some 35 bcm a year – a growth rate of almost 9 per cent a year. Apart from 2019, only 2010 and 2017 have seen higher volume growth. The contents of this paper are the authors’ sole responsibility. They do not necessarily represent the views of the Oxford Institute for Energy Studies or any of its Members. 6
Figure 2.2 - LNG Capacity Growth

Source: OIES

Once again, the Asian markets would be relied on to provide a home for most of the rise in LNG supply.
Europe’s supply gap is widening but not by anywhere near enough to absorb much of the rise in supply
compared to 2019 levels. It doesn’t appear likely that the Americas and Africa will take much more LNG
and while the Middle East might see some growth in Bahrain and Kuwait, Jordan and UAE may need
less LNG. In Asia, Japan, Korea and Taiwan could see some bounce back from the 2019 level, but this
is unlikely to be much. With growth of some 250 bcm in imports needed to absorb the rise in supply,
how much can China, India, Pakistan, Bangladesh and the ASEAN countries take? LNG into China will
be under pressure from increasing pipeline imports from Russia, rising domestic production and
uncertainty on demand. India is a price sensitive market and while rapid growth is expected in the
smaller emerging markets, can they take possibly well over 100 bcm of additional imports by 2027?
If Qatar, Rovuma and Woodfibre all take FID in early 2020 as expected, the prospect of another glut of
LNG in the mid-2020s is very real. It may then be difficult for other potential projects to find room in the
market to take their FIDs. If FID has not been taken by the end of 2020, then even the most optimistic
developers could find offtakers hard to come by. 2020 could be, therefore, the final countdown for FIDs
for some time.
Mike Fulwood (mike.fulwood@oxfordenergy.org)

The contents of this paper are the authors’ sole responsibility. They do not necessarily represent the views of
the Oxford Institute for Energy Studies or any of its Members.                                                    7
2.2 LNG into Europe 2020 – Will there be enough room in storage?
Last year European regas facilities imported over 110 bcm of LNG, an increase of 45 bcm over 2018.
While there were month to month fluctuations in volumes, broadly half the imports were in the winter
period (Q1 and Q4) and half in the summer period (Q2 and Q3).
Europe acts as an absorber of LNG when the global market is over-supplied. It wasn’t that European
consumers were crying out for LNG, but rather that the European market has the ability to absorb large
quantities as a result of its seasonality of demand and large storage capacity. Some 60-65 per cent of
European demand occurs in the winter period, which means there is room in the market for LNG, while
in the summer the refilling of storage also allows LNG in as well.
The summer of 2019 saw a significant increase in consumption (+15 bcm), mostly reflecting price-driven
coal to gas switching, and also saw a decline in European production (-10 bcm). Pipeline imports were
also marginally lower (-3 bcm), as Algeria reduced volumes. However, the summer had started with the
highest volume of gas in storage for five years, as a result of a mild winter. To return to the average
end-September stored gas level for the previous five years would have required injection into storage
of 43 bcm between April 1 and September 30. Instead, the increase in LNG imports resulted in a storage
injection of 58 bcm, almost filling European storage to capacity.
Figure 2.3: Gas in Storage in Europe

                   Gas in Storage (bcm) and % of Storage Capacity Used (%) at End of Month
 120                                                                                                                       120%
                                                                                                            100.8
 100                                     90.1                               88.6                                           100%
            91.3
   80                                                                                                                      80%
                                                                                                                   91.7
   60                                                                                                                      60%

   40                                                                                                                      40%
                                                                                         41.3
   20                                                                                                                      20%
                      26.0
                                                       17.9                     Gas in Storage (bcm)              % Full
    0                                                                                                                      0%
       6

                                          7

                                                                            8

                                                                                                               9
                          7

                                                           8

                                                                                              9
    t-1

                                       t-1

                                                                         t-1

                                                                                                            t-1
                       r-1

                                                        r-1

                                                                                           r-1
  Oc

                                     Oc

                                                                       Oc

                                                                                                          Oc
                     Ap

                                                      Ap

                                                                                         Ap

Source: ENTSOG

The graph above highlights gas in storage at the end of October (maximum) and at the end of March
(minimum), plus the amount of gas in storage at the end of December 2019 (91.7 bcm). The amount of
gas in storage reached 97.5 per cent of storage capacity at the end of October 2019, substantially
above the capacity utilisation rates of 87-91 per cent seen at the end of October in the three preceding
years. Even by the end of December 2019, the amount of gas held in storage was slightly greater than
at the start of winter in 2016, 2017, and 2018. The amount of gas left in storage at the end of March
2020 will provide an estimate of how much gas can be absorbed into storage during the summer of
2020.
Looking ahead towards the summer, gas storage levels throughout Q2 and Q3 will paint an increasingly
precise picture of when storage will become effectively ‘full’. In 2019, storage volumes reached 97 per
cent of capacity by the end of September, and net storage injections for the whole of Europe were just
1.3 bcm in October. If Q1 proves mild, and weather-related gas demand is thus limited, storage facilities
could be filled back to capacity even more quickly than in 2019.

The contents of this paper are the authors’ sole responsibility. They do not necessarily represent the views of
the Oxford Institute for Energy Studies or any of its Members.                                                                    8
For example, in Q1 2019, total European net storage withdrawals totaled 28.3 bcm. If storage withdrawals in Q1 2020 are at a similar level, Europe will reach the end of winter with 63.4 bcm in storage. To get back to an ‘effectively full’ storage level of 100 bcm would require just 36.6 bcm of injections in summer 2020. Storage injections averaged just under 10bcm per month in the April to September period of 2019. At that rate storage would be full by the second half of July 2020. The tracking of storage levels throughout the summer will provide an increasingly accurate idea of when storage will reach full capacity and the European market could tip into substantial oversupply. On the supply side, the large increases in LNG supply that have occurred since 2016 have not yet finished. The ramping up of volumes from Freeport, Cameron and Elba in the US will continue, while Damietta in Egypt is expected to be back operating soon and Malaysia’s second FLNG is likely to start up this year. By the summer of 2020, another 25 bcm of supply will be looking for a market. On the demand side, Asia is the prime candidate. Some recovery in Japan, Korea and Taiwan is expected, while China’s import growth could accelerate again, with additional growth in the other Asian markets. This could lead to a rise of 25 bcm in demand. However, the prospects for the Americas, Middle East and North Africa are much less rosy. Latin America is sensitive to the hydro in Brazil, and Argentina is importing less as shale production rises. Mexico is also importing less and North Africa is importing nothing. While Bahrain’s terminal is slated to start up, Jordan’s imports are declining as they import more pipe gas. Europe, therefore, might be expected to import at least as much in the summer of 2020 as in summer 2019 i.e. some 56 bcm. Europe Supply Demand Balance BCM 2018 S 2019 S 2020 S Production 117.74 107.23 105.00 Pipeline Imports 119.07 115.57 112.00 LNG Imports 30.36 55.76 56.30 Storage withdrawal - - - Total Supply 267.16 278.56 273.30 Consumption 192.66 207.22 210.00 Pipeline Exports 7.22 10.08 10.00 LNG Exports 3.18 3.22 3.30 Storage injection 65.98 57.89 50.00 Total Requirement 269.04 278.42 273.30 Statistical Difference - 1.88 0.14 - Source: OIES As shown in the table, even with a small decline in production and pipeline imports, combined with a small rise in consumption (there isn’t much more scope for coal to gas switching compared to 2019), storage injection of some 50 bcm would be required to allow LNG imports similar to last summer. Indeed, in the event of less growth in LNG imports elsewhere, even more might try to get into Europe. However, the storage dynamics discussed above suggest that in the summer of 2020, the European market will be less able to absorb LNG into storage than it was in summer 2019. In which case, the competition between LNG, pipeline imports and indigenous production will become intense and the prospect of $2/mmbtu gas (that is, a monthly average European hub price of $2.99 per MMBtu or less) in Europe will become more likely during 2020. Our monitoring of LNG and pipeline flows into Europe, storage stocks and monthly storage injections throughout 2020 will provide an increasingly clear picture of when the ‘perfect storm’ of full storage, continued abundant supply relative to consumption, and the related nadir of European hub prices might be reached. Jack Sharples (jack.sharples@oxforenergy.org) & Mike Fulwood (mike.fulwood@oxfordenergy.org) The contents of this paper are the authors’ sole responsibility. They do not necessarily represent the views of the Oxford Institute for Energy Studies or any of its Members. 9
2.3 German coal phase out: key legislation in 2020
In early 2019, the German “Coal Commission” (Commission for Growth, Structural Change and
Employment – KWSB) published its long-awaited report in which it recommended the phase out of
hard-coal and lignite power generation by 2038.
The coal exit law draft that followed stipulates a strategy for the phase out in three stages as seen in
Table 2.1. By 2038, at the latest, there will be no more coal power capacity in the electricity mix.
However, the government may decide to bring forward the exit date to 2035 during one of the scheduled
reviews (in 2023, 2026 and 2029), depending on progress made.
Table 2.1: Planned reduction of coal installed capacity in Germany

                                             2019                   2022                   2030                   2038
Hard coal                                    22.8                    15                     8                      0
Lignite                                      21.1                    15                     9                      0
Total                                        43.9                    30                     17                     0
Source: Commission report2

The phase out of hard-coal and lignite power plants will follow two different pathways. More clarity is
expected in the full Coal Exit Law, which is expected to be drafted in January 2020. The government
plans to get it passed by parliament in mid-2020.3

Hard coal phase-out
For hard coal, the capacity reductions will be implemented using auctions where coal plant operators
tender capacity volumes to be taken offline. These auctions will be organised by the Federal Network
Agency (BNetzA) up to 2026.
•    The first auction is expected in July 2020 to take 4 GW offline by the end of winter 2020/21.
•    The second auction is planned for early 2021. BNetzA will decide how much capacity is required
     to hit the target of 15 GW of hard coal power plant left at the end of 2022 depending on other closure
     applications, the outcome of capacity reserve auctions and the start-up of Datteln 4 in mid-2020.
•    The third auction is planned for late summer 2021 for capacity to be taken offline by the end of
     2023.
•    Then yearly auctions will take place about three years before capacity has to be offline by the end
     of 2024/25/26.4
The dates of auctions, volumes and the auctioning system could still change in the final Coal Exit Law.
The economy ministry will also be able to cancel auctions or adapt the capacity volume in case capacity
reductions affect power and heat supply security and power prices too negatively.
For the following years (2027-2038), the government plans to present an amendment to the Coal Exit
Law by the end of 2022, which could eventually contain provisions on forced plant closures, in the case
that not enough capacity is closed voluntarily.

Lignite phase-out
For lignite plants, an agreement was announced in January 2020 between the government and the
coal-producing regions about a shutdown schedule for individual plants in exchange for compensation
and benefits worth €40bn 5 to be paid to the states affected (subject to state aid approval by the

2
   https://www.handelsblatt.com/downloads/23912864/3/190126_abschlussbericht_kommission-wachstum-strukturwandel-und-
beschaeftigung_beschluss.pdf?ticket=ST-2742616-M45MFxf4B4x4GGfLZRwm-ap5
3
  https://www.bbc.co.uk/news/world-europe-51133534
4
  https://www.spglobal.com/platts/en/market-insights/latest-news/electric-power/111219-germany-plans-4-gw-hard-coal-closure-
auction-in-2020-draft-law
5
  https://www.dw.com/en/germany-to-pay-energy-firms-billions-in-coal-phaseout-plan/a-52022317

The contents of this paper are the authors’ sole responsibility. They do not necessarily represent the views of
the Oxford Institute for Energy Studies or any of its Members.                                                                 10
European Commission). The timetable shows that 1.2 GW of lignite power capacity is due to be taken offline by end-2021 and a further 1.62 GW by end-2022.6 How relevant is it for natural gas? Natural gas represents only about 10 per cent of German electricity generation while the share of hard coal and lignite fell to 29 per cent in 2019.7 The next few years should, in theory, be an opportunity for gas to gain market share, especially as Germany is also going to close its remaining six nuclear reactors (about 9.5 GW of installed capacity) by end-2022. With almost 30 GW of installed capacity, natural gas can provide some initial replacement but investments in new builds will depend on the future of electricity, fuel and carbon prices, which are uncertain. It is expected that extra EU Emission Trading System (EU ETS) allowances due to coal plant closures will be cancelled via the market stability reserve to avoid shifting emissions to European neighbours, but this is to be verified later in 2020. The amount of gas needed in the mix will also depend on the availability of renewable energies. According to the 2019 Climate Law, Germany is expected to increase its dependence on renewable sources such as wind and solar in the power mix to 65 per cent by 2030 (34 per cent in 2019). This means stronger competition from renewables for market share but at the same time additional gas will be needed as a back-up for intermittent supplies. The latter will be especially important in the early to mid-2020s before zero-carbon technologies such as energy storage, demand-side response and power-to-gas develop further. All in all, natural gas will be part of the transition and will support both the coal and nuclear phase-out as well as growth in renewables,8 but many uncertainties remain. What happens and gets decided in 2020 (Germany is also expected to reform its EEG renewable energy law and propose a hydrogen strategy) will help to explain what the 2020s will look like for the German electricity sector and what the role of gas will be. Anouk Honore (Anouk.honore@oxfordenergy.org) 6 https://interfaxenergy.com/article/34943/germanys-lignite-phase-out-begins-to-take-shape 7 https://interfaxenergy.com/article/34925/german-spark-spreads-improve-year-on-year 8 https://interfaxenergy.com/article/32617/germany-bets-on-gas-to-fuel-energy-transition The contents of this paper are the authors’ sole responsibility. They do not necessarily represent the views of the Oxford Institute for Energy Studies or any of its Members. 11
2.4 Dutch gas market and Groningen phaseout: more decisions expected in 2020
The Dutch gas market is facing a challenge unique in Europe as it simultaneously attempts an
accelerated phase-out of production from the Groningen field and an increase in the rate of
decarbonisation of the entire economy by 2030. The government’s Climate Agreement of June 2019
sets out a target to reduce GHG emission by 49 per cent from the 1990 baseline by 2030. The coming
year is expected to provide further evidence as to whether and how these ambitious objectives can be
realized at an acceptable cost.
In March 2018, the Dutch government decided to protect the safety of local residents from the risk of
further earthquakes by restricting Groningen output to 12 bcm by October 2022 and to cease production
completely by 2030. However, another significant earthquake in May 2019 prompted a further urgent
review by the Dutch State Supervision of Mines (SodM) and Gasunie Transport Services (GTS). In
September, based on their advice, the government decided to accelerate the planned reduction and to
aim for the complete cessation of production by 2022. The ceiling for production in Gas Year 2019-20
(Oct 2019 – Sep 2020) was lowered from 15.9 bcm to 11.8 bcm. Future permitted Groningen output
will continue to be sensitive to winter temperatures and the field will remain on stand-by until 2026 to
respond to the uncertainty over the timing and operation of new nitrogen-based quality conversion
capacity. The exceedingly low level of output in October 2019 (0.65 bcm) and the relatively warm
weather to mid-January suggest the new annual ceiling will be respected in 2019-20. Although the road
to cessation is clearly marked, there are still important issues to be decided and resolved in 2020,
notably how the costs of cessation, decommissioning and contingent supply arrangements are to be
shared between the government and the NAM shareholders, Shell and Exxon Mobil, and how the
proposed winding-up of Gas Terra will be implemented. The chart below assumes cessation is achieved
in 2025, implying the eventual write-off of about 450 bcm of Groningen gas reserves.

Figure 2.4 Gas Production in the Netherlands 2005-2030

Sources: TNO, GTS and OIES projections from 2020

The cessation of Groningen production is sometimes mistakenly described as the ‘end of Dutch gas
production’. In fact, ‘small fields’, onshore and offshore, contributed about half the estimated Dutch gas
production in 2019 of 32 bcm and are unaffected by the Groningen decision. EBN, the state oil and gas
company, is quietly continuing its efforts to attract new exploration and development expenditure to
slow the expected decline from these small fields. Output from producing fields and known resources
is expected to continue at least until the late 2030s. Preserving the viability of offshore production and
the associated infrastructure is likely to be a valuable element in the intended decarbonisation of the
Dutch economy. Offshore reservoirs may be suitable for future CO2 storage which forms a major part
of the government’s long-term decarbonisation plan.

The contents of this paper are the authors’ sole responsibility. They do not necessarily represent the views of
the Oxford Institute for Energy Studies or any of its Members.                                                    12
It is sometimes alleged that the decommissioning of Groningen means that the Netherlands ‘is getting
out of natural gas’. This is not the case. In recent years, the restrictions on domestic L-gas output from
Groningen has largely been replaced by higher imports (and lower exports) of H-gas. In the medium-
term, until at least 2030, it is expected that natural gas will continue to account for the largest share of
demand in heating and industry. As the latest projections by GTS of the energy mix in 2030 show, the
share of natural gas in final energy demand (excluding electricity generation) is expected to decline
only marginally, from 29 per cent in 2015 to 27-28 per cent in 2030. Natural gas use in final energy
demand is expected to fall by 11-17 per cent in this period as hydrogen, green gas and electricity will
make small but growing additional contributions to final demand by 2030. The picture beyond 2030
remains very unclear since progress towards a net zero target by 2050 will depend critically on the
economic viability and acceptability of technology applications introduced in the 2020s.
What links the cessation of Groningen production and decarbonisation is the extensive gas
infrastructure, most of which is operated by GTS. As L-gas use in the Netherlands and adjacent
countries declines, existing L-gas infrastructure may be incorporated into the H-gas networks or in some
cases re-deployed for alternatives to natural gas such as renewable gas, hydrogen or CO2 use. The
options to re-configure and redeploy the existing extensive natural gas infrastructure will open up
decarbonisation options, particularly in the main centres of industrial activity, which may not be
economically available in other less gas-intensive countries. The direction the Dutch take in the 2020s
on green gas, hydrogen and CCS promises to make the Netherlands a fascinating proving ground for
European decarbonisation.
Marshall Hall (marshall.hall@oxfordenergy.org)

The contents of this paper are the authors’ sole responsibility. They do not necessarily represent the views of
the Oxford Institute for Energy Studies or any of its Members.                                                    13
2.5 Russian export flows in 2020 – an expanding portfolio of routes
During 2019 the main interest in Russian gas export flows concerned the possibility of an interruption
to the route via Ukraine as negotiations continued over a new transit contract. Following the successful
resolution of this issue, attention in 2020 will now turn to the increasing diversity of routes that flow from
Russia to Europe, the utilisation of the 65 bcm of transit that has been agreed with Ukraine for this year,
the ramp up of the Power of Siberia pipeline to China and the direction of flow of Russia’s expanded
LNG exports to Europe and Asia. As can be seen from Figure 2.5 below the mix of Russian exports is
already changing, and events in 2020 should give further momentum to this trend.
Figure 2.5: Russian gas export flows via pipeline route and LNG to Europe and Asia

                   25.00

                   20.00
   bcm per month

                   15.00

                   10.00

                    5.00

                    0.00

                      Ukraine   Nord Stream   Yamal   Blue Stream   Finland   LNG Europe   LNG Other      Power of Siberia

Source: ENTSOG, Argus Media, OIES

The transit deal with Ukraine has guaranteed volumes over the next five years, with 65 bcm in 2020
and 40 bcm in 2021-2024, levels significantly lower than the 80-85 bcm which flowed in 2018 and 2019.
The reason for this is the emergence of two new routes, Turk Stream and Nord Stream 2. Turk Stream
has two 15.75 bcm lines, one targeted at Turkey itself and one at SE Europe, and gas flowed through
both from the end of 2019. 2020 will reveal two interesting trends – firstly how much gas from Russia
is actually needed in Turkey, given that country’s new focus on renewables and coal, and secondly how
quickly the flows to SE Europe can be ramped up. A new pipeline from Turkey to Bulgaria has been
opened, and Bulgaria will ultimately buy around 3 bcm of Russian gas per annum, but onward lines to
Serbia, Hungary and Austria have yet to be completed and so the full capacity of Turk Stream 2 is
unlikely to be used until the end of 2021. Nevertheless, there should be an increase in supply in 2020
and progress on pipeline construction into the heartland of Europe will be eagerly followed. At the same
time flows through the Blue Stream pipeline into northern Turkey and Turk Stream 1 will give an
indication of the Turkish appetite for Russian gas.
As far as Nord Stream 2 is concerned, it now seems unlikely that gas will flow in 2020 as even President
Putin has stated that a most likely start date is Q1 2021. As a result, flows through Ukraine this year
may well be higher than the contracted 65 bcm, if European gas demand holds up. Nevertheless,
progress on Nord Stream 2 will be watched with interest as Gazprom attempts to navigate around US
sanctions by bringing in its own pipe-laying vessels. Interest will also focus on how European

The contents of this paper are the authors’ sole responsibility. They do not necessarily represent the views of
the Oxford Institute for Energy Studies or any of its Members.                                                               14
regulations are imposed on the pipeline and whether the German regulator is able to mitigate the Third Energy Package rules that were imposed by the European Commission in 2019. Attention will also be on whether the European Court of Justice ruling on the OPAL pipeline, which runs from Nord Stream 1, can be appealed to allow greater utilisation of that route by Gazprom. The flows through Nord Stream 1 will give some indication of the answer to that question. As far as exports to Europe are concerned, a further question is whether transit flows through the Yamal-Europe line that crosses Belarus and Poland will come under any pressure. To date the route has tended to be used to its full capacity, except during periods of maintenance, as Gazprom has attempted to put pressure on Ukraine. However, the Poles have made no secret of their desire to end their purchases of Russian gas when the current contract expires in 2022, and it will therefore be interesting to see whether Gazprom attempts to reduce its exposure to the Yamal pipeline now that the Ukraine issues have been resolved. A growing source of Russian gas to Europe has also been supplied via LNG as exports from the Yamal project grew significantly in 2019. Indeed, as the project’s first three trains reached full capacity earlier than expected around 80 per cent of its total volumes were sold in Europe last year, leading to complaints by Gazprom about excessive competition by Novatek. 2019 may well have been something of an anomaly, as the Yamal contracts had not fully started due to the early completion of the project, and 2020 may well give us a better idea of how Russian LNG volumes will be split going forward. Output from the Sakhalin 2 project will clearly go to Asia but it will be important to see how much LNG from Yamal flows east through the northern sea route or is transshipped for onward sale to the East via the Suez canal and how much actually remains in Europe, where the current low level of prices and high levels of gas in storage mean that competition is likely to remain intense. Finally, Gazprom has opened a new pipeline in the East, the Power of Siberia route to China, and gas began to flow in December 2019 with 0.3 bcm crossing the border in that month. The ramp up towards full capacity of 38 bcm will only accelerate once the Amur processing plant, which will strip a number of valuable components out of the gas before it heads to China, comes online in 2021, but nevertheless 5 bcm is expected to flow in 2020 and 10 bcm in 2021. One concern is that the Chinese side may try to re-negotiate the oil-linked price, which is currently higher than LNG delivered on the eastern seaboard of China, and it will therefore be important to monitor flows through the pipe to see if there is any hint of dissatisfaction on the Chinese side. Overall, then, 2020 should be a year when Russia’s plan to diversify its export routes starts to come to full fruition. The balance of deliveries in Europe will start to change and increasing volumes of LNG should start to accelerate the pivot to Asia, which will also be helped by the expansion of Power of Siberia sales. However, much will depend upon the level and balance of global gas prices, and if significant Russian LNG again remains in Europe then increased rivalry between Gazprom and its key competitors can be expected. James Henderson (james.henderson@oxfordenergy.org) The contents of this paper are the authors’ sole responsibility. They do not necessarily represent the views of the Oxford Institute for Energy Studies or any of its Members. 15
2.6 Gazprom’s Electronic Sales Platform (ESP) as an indicator of Russian pricing
    strategy
In late September 2018, Gazprom launched its Electronic Sales Platform (ESP). The first nine months
of its operation were analysed in a paper published by OIES in July 2019. The six months since that
analysis have provided several interesting developments and allow more robust conclusions to be
drawn about the operation of the ESP. Throughout 2019, four key trends became evident.
Firstly, sales volumes from April to November remained relatively stable, between 1.0 bcm and 1.5 bcm
per month (except for a peak of 2.8 bcm in July), before falling to 788 mmcm in December. Total sales
in 2019 reached 14.9 bcm – equivalent to 7.5 per cent of Gazprom’s LTC exports to Europe in 2019. It
is possible that ESP sales were buoyed by the desire to place gas into storage in Europe throughout
the summer (and avoid taking it out of storage in the first half of winter) in anticipation of a possible
Ukrainian transit interruption – a scenario that will not be repeated in 2020.
Secondly, month-1 sales remained the most popular delivery schedule, followed by prompt (day-ahead,
Saturday, Sunday, and weekend), and within-month. Together, these accounted for 88 per cent of ESP
sales in 2019, with the remainder sold on a month-2, month-3, or specified quarterly delivery basis.
New options were added recently: The first within-day transaction was concluded on December 20
2019, and the first sale for delivery in ‘summer 2020’ was concluded three days later. No volumes have
yet been sold for delivery in Q1 or Q2 2020.
Thirdly, sales to the most liquid markets in NW Europe (TTF and Gaspool) accounted for just under 49
per cent of all ESP sales in 2019. Sales to slightly less competitive markets, NCG and the Czech VTP,
accounted for a further 20 per cent. These four markets are primarily reached via Nord Stream and the
Yamal-Europe pipeline (i.e. non-Ukrainian transit routes). Austria (VTP and Baumgarten) and Slovakia
(VTP) accounted for a further 29 per cent of sales, while sales to Italy (Arnoldstein) and Hungary
(Beregovo) accounted for just over 2 per cent of the total. These latter four markets are reached via
Ukrainian transit.
Fourthly, the weighted average price of sales on the ESP (the ESP Index) has been at a discount to
Gazprom’s LTC sales since January 2019. From April to November 2019, the ESP Index was broadly
in line with European hub prices: above TTF and Gaspool, but below the Austria and Slovakia VTP
market areas. The ESP regained a slight premium over these hubs in December 2019. The point of
comparison is the average of day-ahead and month-1 prices on the European hubs versus the ESP
Index, to reflect the fact that prompt and month-1 sales account for the vast majority of ESP sales.
Looking ahead to 2020, the interconnected issues of price, volumes, and sales destinations/schedules
in relation to the ESP will indicate key aspects of Gazprom’s European sales activities. It is important
to remember that the ESP is not a ‘hub’ per se, but an auction with Gazprom setting a ‘reserve price’.
This allows Gazprom to control how cheaply it is prepared to sell gas. Therefore, the ESP serves as an
indicator of the short-term competitiveness of Gazprom’s gas supplies, and the extent of Gazprom’s
willingness to concede on price in order to retain sales volumes and market share. In 2020, that market
is likely to be characterised by abundant supplies and potentially low hub prices. If European hub prices
do fall substantially in the summer of 2020, how low will Gazprom let the ESP prices go to follow them?
A related question is how much gas Gazprom is prepared to make available on the ESP, if prices do
fall substantially. If ESP and European hub prices fall, but Gazprom continues to make substantial
volumes available on the ESP, this would be a further sign of Gazprom prioritising volumes over price
and could illustrate the value of the ESP in Gazprom’s efforts to compete for sales outside its LTCs.
While the volumes made available on the ESP are not published, the actual volumes sold on the ESP
will be an indicator of Gazprom’s success (or otherwise) in this regard.
Finally, ESP sales in 2020 are likely to continue to be concentrated on NW Europe under prompt, within-
month, and month-1 delivery schedules. However, short-term sales in NW Europe will also be subject
to the most intense competition between pipeline and LNG supplies in 2020. Once again, Gazprom’s
ESP sales volumes here will be an indicator of its ability and willingness to compete on price in order
to preserve volumes and market share.

The contents of this paper are the authors’ sole responsibility. They do not necessarily represent the views of
the Oxford Institute for Energy Studies or any of its Members.                                                    16
Figure 2.6: Gazprom ESP sales and deliveries
Gazprom ESP sales & deliveries by month (mmcm)
3,000
Sales (mmcm)
2,500 Deliveries (mmcm)
2,000
Total sales in 2019:
14,862 mmcm
1,500
1,000
500
Data from Gazprom Export
-
9
8
8
8
8
19
19
9
9
9
9
19
19
19
19
9
l -1
-1
-1
1
-1
-1
-1
-1
-1
-1
n-
n-
p-
g-
p-
-
b-
ov
ec
ov
ec
ct
ct
r
ar
ay
Ju
Ap
Ja
Ju
Se
Au
Se
Fe
O
O
M
N
D
N
D
M
Jack Sharples (jack.sharples@oxfordenergy.org)
The contents of this paper are the authors’ sole responsibility. They do not necessarily represent the views of
the Oxford Institute for Energy Studies or any of its Members. 172.7 The EU Green Deal: more clarity expected in 20209
On December 11 2019, Commission President Ursula von der Leyen unveiled the European Green
Deal. Presented as Europe's ‘man on the moon' moment, the main objective is to make the EU the first
climate neutral continent by 2050. The ‘Roadmap' annexed to the main text provides indications of how
the Commission plans to tackle environmental and climate-related problems while at the same time
maintaining economic growth. The annex also offers some indicative timelines for when the most
important initiatives can be expected (Table 2.2). The initial measures will be detailed in the
Commission's first work programme in 2020, while others will be developed over the duration of the
current Commission.
Table 2.2: Green Deal roadmap - Example of key actions planned in 2020 with a possible impact
on natural gas
Actions Indicative Timetable
Proposal on a European ‘Climate Law’ enshrining the 2050 climate
Mar-20
neutrality objective
Comprehensive plan to increase the EU 2030 climate target to at least
Summer 2020
50% and towards 55% in a responsible way
Assessment of the final National Energy and Climate Plans Jun-20
‘Renovation wave’ initiative for the building sector 2020
EU Industrial strategy Mar-20
Proposal to support zero carbon steel-making processes by 2030 2020
Proposal for a Just Transition Mechanism, including a Just Transition
Jan-20
Fund, and a Sustainable Europe Investment Plan
Source: https://eur-lex.europa.eu/legal-content/EN/TXT/?qid=1576150542719&uri=COM%3A2019%3A640%3AFIN
An important step will be a ‘Climate Law’, expected in spring 2020, which will give legal force to the
objective of climate neutrality by 2050. It is intended to provide regulatory certainty and trigger public
and private investment in modernising the economy and reducing everyone’s environmental impacts.
All sectors of the economy will be involved in the Green Deal and while further details will be provided
progressively over the next few years, the gas industry is likely to be impacted as well. The whole EU
energy system needs to be decarbonised, and early priorities will be towards energy efficiency
measures and developing a power sector based largely on renewable sources, including a focus on
developing offshore wind potential. This logically follows the main targets to be achieved by 2030 and
detailed in the ‘2030 climate and energy framework’.
The European Commission will make proposals to increase these objectives. This signals renewed
efforts to decarbonise the economy faster than previously envisaged. More ambitious targets towards
GHG reduction by 2030 will be made ahead of the Conference of the Parties of the UN's Framework
Convention on Climate Change which will be held in November 2020. Possible instruments to reach
this objective include a lower cap for the number of emissions to be traded on the EU Emissions Trading
System (ETS), including emissions from sectors such as road transport, shipping and buildings'
emissions which are not yet part of the EU ETS as well as cancelling free allocations awarded to some
industries. Regarding the latter, the Commission will look at a possible border adjustment mechanism
for industries at risk of carbon leakage. National emissions targets for sectors outside of the ETS, for
instance residential heating, may also be revised if necessary.
9
More information can be found at https://ec.europa.eu/info/strategy/priorities-2019-2024/european-green-deal_en
The contents of this paper are the authors’ sole responsibility. They do not necessarily represent the views of
the Oxford Institute for Energy Studies or any of its Members. 18Heating represents about two thirds of natural gas demand and is essentially concentrated in the building sector and process heat for industry.10 Any action to speed up the decarbonisation of the heating sector could have an important impact on gas demand. The Green Deal communication mentions several measures, such as a renovation initiative to promote energy efficiency investments in buildings and which is set to be unveiled in 2020. Similarly, an industrial strategy is also expected around spring this year. It will support the modernisation of the sector and aim to stimulate the decarbonisation of energy-intensive industries, such as steel and cement. The Commission will also propose support for zero carbon steelmaking by 2030. The transport sector will also be at the core of the transformation, although how this may impact gas demand (positively or insignificantly) is yet uncertain. The strategy is planned for the second half of 2020. Meeting the objectives of the European Green Deal will require major additional investments. Early in 2020, the Commission will propose the creation of a ’Just Transition Mechanism’ to support regions that rely heavily on carbon intensive activities and a ‘Sustainable Europe Investment Plan’ to help meet investment needs. The region will turn its focus to ‘climate friendly’ industries, clean technologies and green financing, all of which may include the use of natural gas as a bridge at least in the early years. The main uncertainty will be how much effort is to be put into the Green Deal and how soon the first impacts will be felt. For example, decarbonising the gas sector is cited as one of instruments to achieve carbon neutrality by 2050 but it is unclear how soon this will need to begin. More clarity about all these measures (and others) and a more precise timeline are expected in 2020. Additional information about future national policies and targets affecting natural gas will also be available once the final national climate and energy plans (NCEPs) are published at some point in 2020. Finally, the ‘decarbonisation package’ (formerly known as the ‘gas package’) is expected to provide details about a regulatory framework for renewable and/or decarbonised gases. Publication is foreseen in late 2020 or early 2021. Anouk Honore (Anouk.honore@oxfordenergy.org) 10 https://www.oxfordenergy.org/wpcms/wp-content/uploads/2018/05/Decarbonisation-of-heat-in-Europe-implications-for- natural-gas-demand-NG130.pdf The contents of this paper are the authors’ sole responsibility. They do not necessarily represent the views of the Oxford Institute for Energy Studies or any of its Members. 19
2.8 Will there be signs of decarbonisation spreading outside Europe?
By December 2020 it will be five years since the Paris COP21 meeting where world leaders
representing 195 nations agreed the objective to hold the global average temperature increase to well
below 2°C above pre-industrial levels and to pursue efforts to limit the temperature increase to 1.5°C.
The report has since been formally ratified by 169 countries representing 87.75 per cent of global
emissions. In June 2017, US President Trump announced his intention to withdraw the US (around 15
per cent of global emissions) from the Paris Agreement. Under the terms of the agreement, the earliest
possible date for the US to withdraw is November 4 2020, one day after the next US presidential
election.
Until very recently, most of the action on decarbonisation, and particularly consideration of the
decarbonisation of gas, appeared to be focused in Europe. Figure 2.7 shows how carbon emissions in
Europe have fallen from around 6 Gt in 1990 to around 4 Gt today. Despite this, Europe’s trajectory is
not yet seen to be consistent with COP21 commitments.
Figure 2.7: Climate Action Tracker showing GHG emissions in Europe

Source: Climate Action Tracker
By contrast, over the same period emissions in China have increased from around 4 Gt to around 13
Gt. Meanwhile, emissions in the US are around the same level as 1990 (around 7 Gt), having risen until
the mid-2000s before declining as the shale gas revolution stimulated significant coal to gas switching.
In the gas sector, the most significant form of decarbonised gas currently is biogas. Most biogas is
consumed locally at the point of production for combined heat and power, with only around 10 per cent
being upgraded to biomethane for injection into the natural gas grid. Total biogas production in 2016
(the latest year for which consistent data is available) is estimated at around 60 bcm of natural gas
equivalent, with over half of that total being produced in Europe.
Although at a much earlier stage, Europe has also led the development of other forms of renewable
gas. For example, demonstration plants to produce synthetic natural gas via thermal gasification have
been built in Sweden, UK, France and Austria. A 10 MW electrolyser to produce renewable hydrogen
(promoted by its developers as ‘the largest in the world’) is under construction in Germany, and plans
are also being developed for several 100 MW electrolysers. The Norwegian company, Equinor, is
involved in several projects aiming to demonstrate the feasibility of hydrogen production via reforming
of natural gas combined with Carbon Capture and Storage.

The contents of this paper are the authors’ sole responsibility. They do not necessarily represent the views of
the Oxford Institute for Energy Studies or any of its Members.                                                    20
You can also read