LANDSCAPE SURVEY OF THE - MAY 2019 - Cushman & Wakefield
←
→
Page content transcription
If your browser does not render page correctly, please read the page content below

MAY 2019

SURVEY OF THE

LANDSCAPE

CONTENTS NATIONAL EXPANDING COMPETITIVE INSTITUTIONAL
OVERVIEW RENTER RENTAL MATRIX INVESTMENT IN
 PROFILES OPTIONS COLIVING

CONCLUSION APPENDIX SOURCES

©2019 Cushman & Wakefield. All rights reserved. The material in this presentation has been prepared solely for information purposes, and is strictly confidential. Any disclosure,
use, copying or circulation of this presentation (or the information contained within it) is strictly prohibited, unless you have obtained Cushman & Wakefield’s prior written consent.
The views expressed in this presentation are the views of the author and do not necessarily reflect the views of Cushman & Wakefield. Neither this presentation nor any part of it
shall form the basis of, or be relied upon in connection with any offer, or act as an inducement to enter into any contract or commitment whatsoever. NO REPRESENTATION OR
WARRANTY IS GIVEN, EXPRESS OR IMPLIED, AS TO THE ACCURACY OF THE INFORMATION CONTAINED WITHIN THIS PRESENTATION, AND CUSHMAN & WAKEFIELD IS UNDER
NO OBLIGATION TO SUBSEQUENTLY CORRECT IT IN THE EVENT OF ERRORS.

COLIVING’S
 MOMENT

6

 COLIVING: WHERE LOCATION, CONVENIENCE, COMMUNITY AND
 AFFORDABILITY ARE ALL MAXIMIZED FOR THE TENANT, WHILE
 REVENUE IS MAXIMIZED FOR THE OWNER AND OPERATOR.

 INTRODUCTION RENTERSHIP BY AGE
 A housing crisis is raging across the United States. For decades,
 young professionals have been steadily emigrating into the RENTER HOUSEHOLDS (MILLIONS)
 once inert urban submarkets of major cities like New York, Los 0 1 2 3 4 5 6 7
 Angeles and San Francisco among many others. A positive
 Under 25
 feedback loop formed between the influx of highly-educated
 25-29
 workers and the concentration of corporate investment and job
 30-34
 opportunities in these areas. Over the course of this past decade,
 35-39
 this feedback loop has heated both renter and owner housing 40-44
 markets. Between 40% and 50% of residents in these key 45-49
 markets have become cost-burdened - spending more than over

 2006
 50-54
 30% of their pre-tax household income on rent. 55-59
 60-64
 Simultaneously, other demographic trends began to affect
 65-69
 the prime renting population in their twenties and thirties.
 70-74
 Marriage and family formation have been delayed. Educational
 75-79
 attainment among this age bracket is at record highs.
 80 & Over
 Consequently, student loan debt is also at record numbers, along
 with record low savings accounts.

 Coliving is a natural solution to this housing environment where
 Under 25
 tenants can share units and amenities in a cohesive community
 25-29
 AGE OF HOUSEHOLD HEAD

 assisted by a skilled operator. Location, lifestyle, community
 30-34
 and affordability are all maximized for the tenant. In this
 35-39
 environment, operators are providing product that better reflects 40-44
 the price range and types of living situations people are looking 45-49
 2017

 for when they move into an urban area. Through coliving, 50-54
 tenants are able to pay less rent by trading private space for 55-59
 more and better shared communal space. Typically, coliving 60-64
 providers include additional services and perks, including 65-69
 fully furnished units, all utilities included, hosted community 70-74

 events and even housekeeping, which in the aggregate 75-79

 represent as much as a 20% discount to living alone. For the 80 & Over

 operator, this opens new avenues to differentiate their product,
 taps into a large renter base not currently served by top-end
 luxury product, and maximizes revenue on a per square foot
 basis. Under 25
 25-29
 First emerging among the high cost coastal markets where
 30-34
 the necessity was greatest for young professionals, the model
 35-39
 has continued to evolve. Coliving has now begun to appear
 40-44
 in secondary and tertiary markets. The phenomenon has also 45-49
 2023*

 spread to a wider range of incomes and ages. Given long-term 50-54
 demographic trends and the continued tightening of the housing 55-59
 market, coliving sits on the precipice of rapid expansion. 60-64
 65-69
 70-74
 75-79
 80 & Over
 OVER THE NEXT TEN YEARS, AGING
 BABY BOOMERS AND MILLENNIALS
 WILL CONTINUE TO DRIVE GROWTH IN GEN Z MILLENNIAL GEN X
 BABY
 SILENT GEN
 GREATEST
 BOOMER GEN
 RENTER HOUSEHOLDS.
 *(JCHS Projected)
 Source: The State of the Nation’s Housing, Joint Center for Housing Studies

 C U S H M A N & WA K E FI E L D

7

THE AMERICAN DREAM IS SHIFTING
The American dream has always been partially defined as to the suburbs has decreased by 40% in the last 20 years.
owning your own house. It helped elucidate status, inspire Furthermore, Americans increasingly spend disposable income
community engagement and promote a path toward financial on experiential activities, rather than tying up equity in homes.
stability if not substantial wealth. Several factors have changed 72% of millennials said they would like to increase their spending
this revered and longstanding model. The first of which is on experiences rather than physical things in the next year.
a demographic shift toward delayed household formation. Since 1987, consumer expenditures on experiential activities
Although the 25-to-34-year-old population has grown rapidly, has increased by 70% relative to total consumer spending.
this is not translating into increased household formation, The seismic shift from rural to urban life has also impacted the
meaning that headship rates have been declining (ratio of shifting American Dream. According to the United Nations, 55%
households to population). The headship rate declined from of the world’s population lives in urban areas, a proportion
49.2% in 2005 to 44.3% in 2017. The Great Recession saw that is expected to increase to 68% by 2050. Additionally,
economic destruction of homeownership as a means to wealth, the economic reality of graduating from college with student
given that an estimated 9.3 million Americans experienced debt cripples the ability to save money for a down payment on
foreclosure or lost their homes. Lifestyle changes have also a house. Ultimately, due to societal shifts, renting has become
altered the American Dream. The stigma against city living a viable, destigmatized housing choice, rather than just an
and the corresponding romanticization of the white-picket economic necessity. Given that renting is both sustainable and
fence suburbs was the mantra of the second half of the 20th socially acceptable, Americans will continue to rent indefinitely.
century which has evaporated due to renewed urban interest.
The number of 18-to-28 year olds moving from the cities

 TOTAL INDIVIDUALS UNDER 30
 WITH STUDENT LOAN DEBT
 (IN THOUSANDS)

 OF MILLENNIALS ARE UNHAPPY WITH THE PURCHASE
 OF THEIR HOME. FACTORS SUCH AS ONGOING
 HOMEOWNER EXPENSES, SHORTAGES OF STARTER
 HOMES IN DESIRED LOCATION AND LIMITATIONS OF
 SIZE HAVE ALL CONTRIBUTED TO THESE PURCHASING
 REGRETS.

Source: JCHS, Bankrate.com

 SURVEY OF THE COLIVING LANDSCAPE

8

 IN THE WAKE OF THE GREAT RECESSION, THE INCREASINGLY URBAN-FOCUSED
 HIGH-SKILL U.S. ECONOMY HAS RESULTED IN A NUMBER OF CONSEQUENCES:

 Core urban areas expect continued growth
 ACTUAL AND PROJECTED
 As projected by the Joint Center for Housing Studies of Harvard POPULATION GROWTH BY
 University, population growth will continue to center around DISTANCE FROM CITY CENTER
 dense urban cores. Factoring in longstanding trends in U.S.
 marriage rates, educational attainment and evolving diversity 0 to 3 miles 3 to 10 miles 10 to 45 miles 45 miles +

 Annualized Growth Rate (% per year)
 2.5
 leads to a striking outcome: the urban cores of U.S. cities will
 continue to witness incredible growth. 2.0

 1.5
 Harvard’s Hyojung Lee states, “These findings indicate that while
 Nat’l Avg: 0.9%/year
 downtown areas will continue to grow, racial and ethnic diversity, 1.0

 delayed or non-marriage, and higher educational attainment, 0.5
 not the aging of millennials and post-millennials, will be the key
 0.0
 Standard Including
 drivers behind the continued demand for downtown living.”

 2010-2015
 1990-2000

 2000-2010
 Population Education,
 Growth Marriage and
 Diversity Trends

 Actual Estimated, 2015-2035

 U.S. HOUSEHOLD FORMATION
 VS. HOUSING STARTS 5-YEAR MOVING AVERAGE IN MILLIONS

 There has been a historical shortage of new 2.00

 housing supply in dense urban areas HOUSING
 STARTS

 1.50
 Urban areas across the country have seen limited housing starts
 MILLION PER YEAR

 in recent times. The number of households in the U.S. grew by
 10.8 million over a 10-year period between 2008 and 2018, while 1.00

 only about 9.2 million new housing units were permitted over HOUSEHOLD
 FORMATION
 that same period. 2010-2016 0.72 UNITS PER HOUSEHOLD
 0.50

 2000-2016 0.98 UNITS PER HOUSEHOLD

 SINCE 1960 - 1.11 UNITS PER HOUSEHOLD
 0.00
 1963

 1983

 1993

 2013
 1973

 2003

 HOUSEHOLD FORMATION HOUSING STARTS

 As the population grows more educated, marriage DELAYED MARRIAGE AND
 and family formation has begun later
 HOUSEHOLD FORMATION
 From 1988 to 2016, the age of individuals over 25 who were
 married declined by 8%. Over the same time period, the share of % People 25+ Who Are Married Share of People 25+ With
 Bachelor’s Degree or Higher
 68
 individuals with a bachelor’s degree or higher increased by over 40
 Share of People With Bachelor’s Degree+ (%)

 66
 15%. This correlation suggests that increased time dedication
 Share of People Who Are Married (%)

 35

 61
 to education may have a delaying effect upon marriage and 30

 62 25
 ultimately raising a child. A study conducted in 2017 by Pew
 20
 60
 Research Center found that 58% of millennials still wanted to 15

 marry at some point. Additionally, individuals with a bachelor’s
 58
 10
 56
 degree were more likely to get married in the long run as 5

 compared to individuals with only a high school diploma. 54 0
 1988
 1990
 1992
 1994
 1996
 1998

 2010
 2012
 2014
 2016

 1988
 1990
 1992
 1994
 1996
 1998

 2010
 2012
 2014
 2016
 2000

 2000
 2004

 2004
 2006

 2006
 2008

 2008
 2002

 2002

 Year Year

 C U S H M A N & WA K E FI E L D
9

 US households, particularly tenants, are increasingly housing cost-burdened

 During the previous 11 years, the volume of student loans tuition costs at both private and public institutions continue to
 issued has grown 157% cumulatively, a number expected to grow. In terms of delinquency, student loan debt currently has
 increase. Both the cost of college tuition and student borrowing the highest 90+ day delinquency rate of all household debt.
 continue to rise, which has resulted in a widening default crisis. More than 1 in 10 borrowers is at least 90 days delinquent, while
 In comparison to student loan debt, mortgage and credit card mortgages and auto loans have a 1.1% and 4% delinquency rate,
 debt fell 1%, according to Bloomberg Global Data. This means respectively, according to Bloomberg Global Data. The cost of
 44 million Americans share $1.5 trillion in student loan debt borrowing has also risen over the last two years. Subsidized and
 (through the second quarter of 2018). The average student in the unsubsidized loan interest grew 5% last year, the highest rate
 graduating class of 2016 has $37,172 in student loan debt. And since 2009.
 while student loans are being issued at unprecedented rates,

 Higher attainment in education has correspondingly resulted in higher student debt

 Similarly, professional degree loan interest rates grew 6.6%, tend to contain more low-income borrowers, which drives debt
 according to the U.S. Department of Education. Experts suggest burden as high as 10%. Ultimately, when the cost of college rises
 that student debt has delayed household formation and led to nearly eight times faster than wages, the magnitude of student
 a decline in homeownership. On average, Americans pay 6% loan debt will only increase.
 of each paycheck toward students loans. However, large cities

 RISING STUDENT LOANS
 Student Loans Mortgages Auto Loans Credit Card

 160%
 140
 THE FASTEST GROWING SEGMENT 120
 100
 OF U.S. HOUSEHOLD DEBT, STUDENT
 80
 LOANS SAW AN ALMOST 157% 60
 GROWTH SINCE 2008. 40
 20
 0
 -20
 2007 2018

 AVERAGE SAVINGS ACCOUNT
 These and other factors have driven down savings and
 BALANCES BY AGE disposable income

 $8,362 Average Savings Average savings accounts for Americans has plateaued, sliding
Under 35
 $2,000
 Median Savings from more than $33,000 in 2013 to $30,600 in 2016. The growth
 $20,839
 35-44
 $5,000 of disposable income and savings has not kept pace with rent
 45-54
 $30,441 growth across major U.S. metros.
 $6,500

 $45,133
 55-64
 $12,000

 $54,089
 65-74
 $15,000

 $42,291
 75+
 $16,250

 Source: Up For Growth, Apartment List Research, Bloomberg Data, Federal Reserve

 SURVEY OF THE COLIVING LANDSCAPE
10

 PERCENTAGE (%) OF RENTER $45,000-$74,999 range was used throughout this analysis as an
 approximation of the American middle class.
 POPULATION COST BURDENED
 Rents are rising more in places with a constrained housing stock,
 particularly where a lack of available land or regulations limit
 development. A Zillow study last April found that rents in cities
 33.4% with the most restrictive land use policies were growing nearly
 three times faster than those with the least restrictive regulations.
 Of course, housing affordability is also influenced by the extent
 26.5% 35.1%
 to which regional economies and incomes have grown. Since last
 43.0%
 35.0% summer, rents have fallen for the highest earners while increasing
 34.2%
 37.4% 31.8%
 for workforce residents** in San Francisco, Atlanta, Nashville,
 31.9%
 Chicago, Philadelphia, Denver, Pittsburgh, Washington and

 46.7%
 Portland, Ore., among other cities.
 31.3%
 30.9% In several other metro areas — including Los Angeles, Las Vegas,

 32.7%
 Houston and Miami — rents have risen for workforce residents and
 the rich alike. The ongoing increase in prices for low-end tenants
 45.7% poses a challenge for city officials who have vowed to lower
 housing costs for working-class residents already struggling with
 tepid wage growth in the U.S. economy. City officials have said
 % RENTERS BURDENED a boom in luxury housing construction would cause rents to fall
 25% 50% for everyone else, arguing that creating new units for those at the
 LOW HIGH
 top would ease competition for cheaper properties. In part based
 on that theory, cities have approved thousands of new luxury
 Source: JCHS,2018
 units over the past several years, hoping to check high rents that
 have led more than 20 million American tenants to be classified
 as “cost burdened,” defined as spending more than 30% of one’s
 income on housing.
 WHAT IS RENT BURDENSHIP But although some advocates say the dividends could still pay off
 for low-income tenants, others say more direct government action
 According to the U.S. Department of Housing and Urban
 is needed to prevent workforce residents from being forced out of
 Development, families that pay more than 30% of their
 their cities or into homelessness. They have called for the federal
 incomes on housing are considered cost burdened and may
 government to help construct more affordable units, or offer
 have difficulty affording rent as well as other necessities,
 greater rental assistance for workforce families. Workforce city
 such as food, clothing, transportation and medical care. residents have experienced significant rent increases over the past
 While workforce families are the most likely to be cost several years. In Portland, average rents for workforce residents
 burdened, skyrocketing home prices in U.S. metropolitan have risen from about $1,100 to $1,600 — or by more than 40% —
 areas have caused the nation’s housing affordability crisis since 2011. In San Francisco, the average rent at the bottom of the
 to spread to a large number of middle class Americans. market has soared from $1,700 to $2,600, a nearly 50% increase.
 Seattle’s workforce residents have also had their rents rise by
 While housing cost burden for low-income households is often close to 40%. Nationwide, rents for those at the bottom have
 offset through housing subsidies, there are few forces protecting increased by 18%. Rising rents for workforce residents threatens
 middle-income households from the rising cost of real estate. to put an additional severe strain on tens of millions of families,
 Fast-growing cities with high construction costs and low housing often forcing them to forgo other basic needs to avoid losing their
 inventories have experienced some of the sharpest spikes in housing.
 home prices over the past several decades, and today these cities
 have some of the largest shares of cost-burdened middle-class
 **Workforce residents being defined as those making between 60-100% AMI for their
 households. MSA

 Definitions of the middle class vary by housing organization and
 geography. Nationwide, the middle 20% of U.S. households earn
 between $45,325 and $72,384, roughly in line with the $45,000-
 $74,999 breakout provided by the JCHS. While the incomes
 earned by the middle class of earners varies city to city, the
11

RENT BURDENSHIP IS INCREASING formation, meaning that headship rates have been declining
 (ratio of households to population). The headship rate declined
 from 49.2% in 2005 to 44.3% in 2017. This may be due to a
Soaring housing costs are largely to blame, with the national
 confluence of economic (e.g., slow wage growth, student debt
median rent rising 20% faster than overall inflation in 1990–
 burden, weak credit profiles) and demographic or lifestyle
2016 and the median home price 41% faster. Although better
 factors (e.g., delayed marriage, multi-generational living, etc.).
housing quality accounts for some of this increase, sharply
 In fact, according to a Pew Research Center study, millennials
higher costs for building materials and labor, coupled with
 in 2014 were more likely to live with their parents than with a
limited productivity gains in the homebuilding industry, have
 romantic partner
made housing construction considerably more expensive. Land
prices have also skyrocketed as population growth in metro The patterns in headship rates over the housing cycle differ
areas has intensified demand for well-located sites. In addition, considerably across age groups. Specifically, in recent years
new regulatory barriers have also served to limit the supply of most of the changes were among young adults. For two
land available for homes and increased the time, complexity groups—ages 18-to-24 and ages 25-to-29—headship rates have
and risks of housing development declined appreciably in recent years. Headship rates among
 older age groups have been more stable. Headship rates among
 young adults rose considerably from the mid-1990s up to the
 financial crisis. That was the period of the strong housing market,
AFFORDABILITY CHALLENGES HAVE rapidly rising house prices, and booming homeownership rates,
REDUCED HOMEOWNERSHIP IN including among young adults. The movements in shares of
YOUNGER POPULATIONS young heads of household closely track the rise and decline in
 homeownership ratios.
First-time homebuyers accounted for 31% of all home sales
transactions in May 2018, according to the May 2018 REALTORS®
Confidence Index Survey. The share of first-time buyers has
hovered at about this level for most of the housing market’s
recovery since 2012. The share of first-time buyers has not
increased even with the growing population of 25-to-34-year-
olds because of slow household formation and the delayed
transition to homeownership.

Homebuying has similarly been delayed due to these
affordability challenges. The 25-to-34-year-olds now make up
the largest population age group, at 45.3 million as of July 2017,
about six million more than in 2009. However, the number of
households headed by 25-to-34-year-olds remained stagnant at
about 20 million. Real wages have been slow to recover from the
Great Recession, with negative to zero real growth from 2010-
2014 and 1% growth from 2015-2017.

The notable shift in the relative growth rates after 2007 reflects
declines in “headship” rates, that is, the share of the population
identified as heads of households. By definition, the percent
change in household formation equals the sum of the percent
growth in population and the percent change in headship rates.
This means that for over five decades headship rates in the
United States had increased on average before falling off in the
wake of the financial crisis.

In other words, although the 25-to-34-year-old population has
been strongly rising, this is not translating into rising household

 CHALLENGES TO HOMEOWNERSHIP
 HAVE DESTIGMATIZED RENTING
 AS A LIFESTYLE.

 SURVEY OF THE COLIVING LANDSCAPE
RENTER PROFILES
14

 WHILE INCOMES REMAIN STAGNANT FOR POPULATIONS THAT
 INCREASINGLY COMPRISE RENTERS, RENT HAS INCREASED
 ON AVERAGE BY OVER 20% ACROSS MAJOR U.S. MARKETS.

 SEATTLE

 MINNEAPOLIS BOSTON

 NEW YORK CITY
 PHILADELPHIA
 CHICAGO
 WASHINGTON, D.C.
 SAN FRANCISCO
 DENVER

 LOS ANGELES

 ATLANTA

 DALLAS

 AUSTIN

 MIAMI

 BY CITY BOUNDARIES
 Total Population Median Age Median Income Renter Occupied Bachelor’s + Degree
 Atlanta 475,836 40.1 $32,376 69.6% 25%
 Austin 927,556 32.9 $65,643 55.3% 47%
 Boston 679,660 32.2 $64,290 66.8% 46%
 Chicago 2,736,994 34.2 $53,335 56.3% 36%
 Dallas 1,316,726 32.7 $48,244 58.0% 31%
 Denver 713,294 34.4 $60,437 51.2% 45%
 Los Angeles 3,965,206 35.5 $56,797 63.6% 32%
 Miami 443,268 40.1 $32,376 69.6% 25%
 Minneapolis 413,416 32.4 $55,526 52.9% 47%
 New York 8,590,165 36.3 $58,271 68.7% 36%
 Philadelphia 1,586,356 34.1 $43,106 47.6% 26%
 San Francisco 876,259 38.3 $104,986 64.4% 54%
 Seattle 689,131 36.1 $82,778 54.0% 60%
 Washington D.C. 680,420 33.9 $76,587 60.5% 55%

 For each city across the U.S., several key indicators are correlated with the potential of the market for renting as well as coliving more
 specifically. Age is reflective of the type of workforce common in a given market; higher cost markets often have a concentration
 of older, and therefore wealthier populations. The percentage of the population occupied by renter delineates more renter-focused
 markets like New York from more homeowner-centered markets like Minneapolis.

 C U S H M A N & WA K E FI E L D
15

 RENT GROWTH BY CITY

 2.8% 3.6% 3.8% 3.2% 4.0%
 2.8% 3.0%
 34.0% 27.9% 23.6% 14.2% 22.2%
 19.5% 15.1%

 SEATTLE

 MINNEAPOLIS BOSTON

 NEW YORK CITY
 CHICAGO PHILADELPHIA
 WASHINGTON, D.C.
 SAN FRANCISCO
 DENVER

 LOS ANGELES

 ATLANTA

 DALLAS

 AUSTIN
 MIAMI

 4.0% 3.1% 4.4% 2.1% 5.1% 2.9% 2.8%
 23.7% 24.7% 18.6% 27.3% 35.3% 20.1% 17.1%

 1 Year
The most recent real estate cycle has led to strong, prolonged rent growth across many of the major
 5 Year
markets across the US. As the nation enters the tenth year of this cycle, vacancy rates have begun
to edge incrementally upward with rent growth also reaching a plateau within traditional multifamily Rent Growth
 MSA Boundaries
product classes and types. As the cycle matures, developers and investors have begun to seek product
types that will continue to be recession-proof going forward.

 SURVEY OF THE COLIVING LANDSCAPE
16

 RENT GROWTH AND VACANCIES CAN VARY GREATLY
 BY MARKET, AN IMPORTANT CONTRIBUTING FACTOR TO
 WHERE RENTERS CHOOSE TO LIVE.

 VACANCY BY MARKET 2016-2018
 New York

 Los Angeles

 San Francisco

 Boston

 Minneapolis

 Seattle
 MSA

 Miami

 Philadelphia

 Washington
 D.C.

 Chicago

 Denver

 Austin

 Dallas

 Atlanta
 2 4 6 8 10

 % (%) VACANCY
 2016 2017 2018

 C U S H M A N & WA K E FI E L D
17

DURING THIS CYCLE, MANY MAJOR MARKETS HAVE
EXPERIENCED STRONG RENT GROWTH.

 AVERAGE RENT GROWTH
 MSA City Downtown CBD

 1 Year 5 year 1 Year 5 year 1 Year 5 year

 Atlanta 5.1% 35.3% 3.3% 21.7% 4.3% 20.5%

 Austin 4.4% 18.6% 3.1% 14.1% 3.2% 25.4%

 Boston 4.0% 22.2% 4.4% 18.3% 1.9% 12.2%

 Chicago 2.8% 19.5% 3.8% 14.2% 5.1% 21.0%

 Dallas 2.1% 27.3% 3.6% 24.6% 4.3% 22.7%

 Denver 3.6% 27.9% 0.7% 26.2% -1.4% 18.6%

 Los Angeles 3.1% 24.7% 2.3% 11.4% 2.2% 11.4%

 Miami 2.9% 20.1% 3.5% 23.4% 2.9% 23.2%

 Minneapolis 3.8% 23.6% 2.6% 24.8% 1.5% 13.5%

 New York 3.0% 15.1% 8.2% 12.0% 8.8% 14.1%

 Philadelphia 2.8% 17.1% 1.8% 20.3% 0.6% 28.6%

 San Francisco 4.0% 23.7% 0.2% 12.0% 0.4% 15.6%

 Seattle 2.8% 34.0% 2.9% 13.2% 1.2% 10.3%

 Washington D.C. 3.2% 14.2% 3.6% 31.4% 2.9% 30.9%

 AVERAGE EFFECTIVE RENT BY MARKET 2016-2018
 New York

 San Francisco

 Boston

 Los Angeles

 Seattle

 Washington D.C.
 MSA

 Denver

 Miami

 Chicago

 Philadelphia

 Austin

 Minneapolis

 Dallas

 Atlanta
 $1.00 $1.50 $2.00 $2.50 $3.00 $3.50
 AVERAGE EFFECTIVE RENT PSF

 2016 2017 2018

 SURVEY OF THE COLIVING LANDSCAPE
18

 NEED FOR WORKFORCE HOUSING IN URBAN AREAS
 The Department of Housing and Urban Development (HUD) Cities have begun to realize that policies are needed to address
 utilizes the concept of AMI (Area Median Income) to determine the affordability issues for this segment of the populace, many
 which areas are in need of what types of housing. For every state of whom occupy vital service professions. Current policies such
 and MSA, a median income is determined and percentages of as inclusionary zoning have had limited results, pushing cities to
 that income are used to stratify need and affordability in that search for incentive-based solutions in the private sector
 market. Many municipalities utilize this measure to set affordable
 housing goals and policies. The graphic below represents the
 AMI ranges for Chicago.

 While traditional city programs have been targeted at individuals
 at below 60% AMI, in many cities individuals making between
 80 and 120% AMI have increasingly become cost-burdened.
 According to JCHS, the income band of individuals making over
 $75,000 (which falls within the 80-120 AMI range for many major
 markets) has witnessed the fastest increases in cost burdenship
 across all cohorts.

 EXAMPLE AREA MEDIAN INCOME (AMI)
 RANGES FROM THE CITY OF CHICAGO

 • Lyft / Uber Driver • Entry Level • Public School • Financial Analyst
 Firefighter Teacher • Nurse
 • Restaurant Server
 • Retail Store Manager • Construction • Electrician
 • Security Guard
 • Receptionist Worker
 • Daycare Teacher • College Instructor
 • Bartender • Experienced
 • Barista Firefighter • Experienced Police
 • Cable Technician (5+ years) Officer (5+ years)
 • Courier
 • Nurse Assistant • Restaurant Manager
 • Yoga Instructor
 • Graphic Designer
 • Entry Level Police
 Officer

 $35,580 $47,400 $59,300 $71,160
 60%AMI 80%AMI 100% AMI 120% AMI

 Source: Glassdoor, City of Chicago Quarterly Affordable Housing Report

 C U S H M A N & WA K E FI E L D
19

TENANTS OCCUPY PROFESSIONS THAT ARE VITAL TO ANY CITY,
BUT CONTINUE TO HAVE INCOMES THAT CANNOT AFFORD THE
HIGH AMOUNT OF RENT GROWTH HAPPENING IN MAJOR CITIES.

TENANTS SPAN A WIDE RANGE OF INCOME BANDS, AND
THEREFORE ARE DIFFERENTLY AFFECTED BY RENT INCREASES.

 MARKET POPULATION BY INCOME
 Area AMI Area AMI $15,000 - $30,000 - $45,000 - $60,000 - $75,000 - $100,000 $125,000 -
 Market
RENTAL OPTIONS
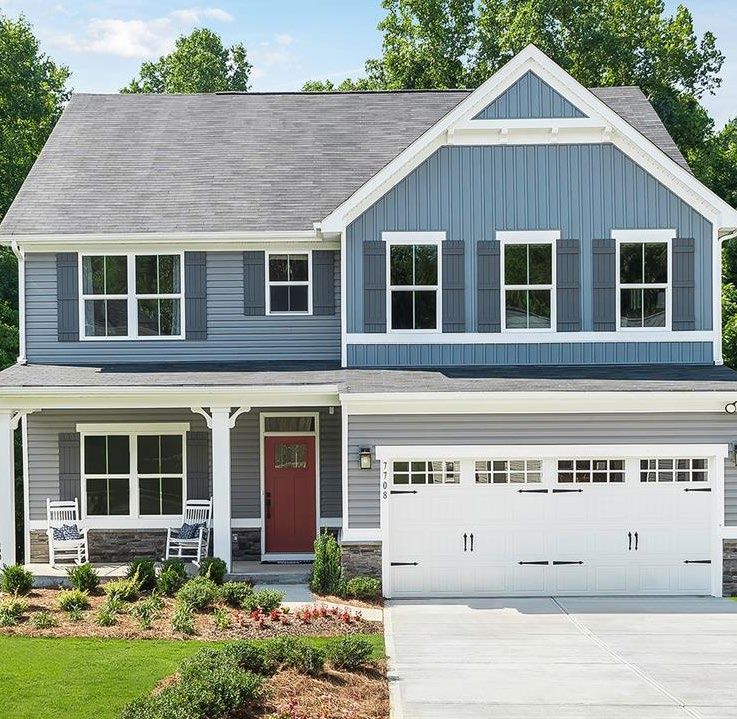
In 1960, rental buildings housed 20 million tenants across the U.S. Most of these
tenants lived in traditional 3-flats across the urban landscape.

Over time, rental properties were built to accommodate the middle and lower
classes who had no economic means to own a home. This often meant that rental
units were located in less than desirable parts of the city. Therefore renting was
stigmatized by a population focused upon homeownership. As opportunities and
talent have clustered in major urban cores, prices have risen and a larger spectrum
of the population in terms of age, income and education has decided to rent. Now
in 2019, not only has renting become destigmatized but more communal and
flexible renting models have begun increasingly become accepted by the renter
population.

HAVE EXPANDED
23

 TRADITIONAL RENTING
 Traditional renting involves long-term leases; buildings and units offer standard
 amenities. For new delivery buildings, this includes a number of in-unit ameni-
 ties such as a complete kitchen, living area, in-unit laundry and secure private
 access. Amenities not in-unit can include fitness centers, outdoor amenity
 decks, dogruns and coworking space.

 SINGLE-FAMILY HOME RENTAL
 A free-standing residential building maintained and used as a single dwelling
 unit. In many instances renting can be cheaper than paying a mortgage, and
 does not require a long-term commitment. Certain life scenarios may render
 renting a home more optimal than outright buying one. Amenities often match
 those of other single fmaily residences in the submarket.

 EXTENDED STAY
 Length of stay is shorter than a full-term lease - with durations often running
 between one to nine months. Tenants are seeking temporary accommodations,
 though also may value similar benefits to coliving.

 MICRO-LIVING
 Community tenants do not share units. Unit sizes are minimized. In-unit ame-
 nities such as kitchen and bathroom are explicitly not shared. Tenants often
 prefer to live without roommates.

 COLIVING
 A community of tenants seeking socializing, convenience, flexibility and
 affordability. A multifamily building with a coliving situation is one where
 community and sharing of common space is fundamental, often facilitated
 by the operator’s platform. The building may have a mix of traditional unit
 types, micro-units and coliving units. A coliving unit is comprised of shared
 areas such as living room, dining room and kitchen with private bedroom and
 bathroom for each renter. The additional density provided in coliving allows
 real estate owners to enjoy substantially higher rents per square foot, while
 still providing a more affordable option for renters.

IN LIGHT OF THESE TRENDS, TENANTS HAVE INCREASINGLY SEARCHED FOR MODELS THAT OFFER
BOTH AFFORDABILITY AND THE COMMUNITY LIFESTYLE THEY DESIRE. SIMULTANEOUSLY, MULTIFAMILY
OPERATORS HAVE SOUGHT MODELS THAT CAN OPTIMIZE PER SQUARE FOOT RENT WHILE
UNDERSTANDING AVERSION TO HIGH UNIT RENT PRICES.

 SURVEY OF THE COLIVING LANDSCAPE
24

 BACKGROUND ON COLIVING
 Shared and communal housing models have
 existed for millenia in many different forms.
 Since the turn of the century, a standard home
 included a family with multiple generations
 living in a 3-flat under the same roof. Then,
 during the WWI and WWII period, Americans
 began to rent with roommates in order to
 make ends meet. Thus began the genesis
 of coliving: tenants who forsook space and
 privacy in search for affordability. For early
 coliving adopters, it was an economic decision.
 A trend that continues to today’s high cost
 environment.

 Coliving is a type of intentional community of
 housing where multiple people share a single
 home with shared areas such as bathrooms,
 kitchens and living rooms as well as other
 amenities.

 Tenants who choose coliving do so for a
 variety of reasons, one of which includes
 flexible lease terms. This allows renter to
 determine how long they stay at a given
 location and where they go next. They are only
 responsible for themselves and can choose to
 leave more easily compared with traditional
 lease terms. Tenants who choose to colive also
 do so for a sense of community belonging. The
 social norms of inclusion and sharing entice the
 modern renter more so than ever before. These
 tenants are also technology driven and enjoy
 the operating systems that coliving facilities
 provide. Amenities like advanced security
 systems and phone applications (for billing and
 maintenance requests) are a must for a modern
 renter.

 AMERICANS WHO CHOOSE TO RENT EXPECT CERTAIN
 STANDARDS ASSOCIATED WITH THEIR LIVING
 ARRANGEMENT. SOME OF THESE FACTORS INCLUDE
 FLEXIBILITY, COMMUNITY AND AFFORDABILITY.

 C U S H M A N & WA K E FI E L D
25

SOME LOCAL GOVERNMENTS HAVE STARTED
TO TAKE NOTICE OF THE RISE OF COLIVING.

A MODERN VISION FOR A
TRADITIONAL HOUSING MODEL
Despite market-to-market differences in application, coliving
has gained mainstream prominence in recent years due in part
to a surge of millennials adopting coliving as their standard of
living. Financial circumstances and housing supply remain the
most significant factors impacting millennial renting tendencies.
Moreover, millennials tend to engage in lifestyles that align with
coliving environments. Shared values, lifestyles and motivations
often unite coliving tenants.

Additional newer renting models include micro-units and
extended stay leases. However, according to the Urban Land
Institute, no formal definition for micro-units exists. Per their
study, “a micro-unit is a somewhat ambiguous term that
covers anything from a relatively small studio or one-bedroom
apartment to a short-term lease, SRO unit with communal
kitchen and common room areas.” ULI goes on to suggest
that companies are avoiding the term “micro-units” in order to
avoid negative connotations associated with the term. In any
case, micro-units (relative to the market in which it exists) are
an economically efficient alternative to conventional renting in
urban areas.

SHARENYC
New York City placed a request for information and interest
to various coliving and shared housing companies in Q1 2019.
The request asked for both information on the development,
operations, benefits, and challenges of shared housing from
private parties in the space. Furthermore, the city requested
expressions of interest to develop sustainable and affordable
shared housing on private land. Stakeholders selected through
this second request will work in concert with NYC’s HPD’s
iterative process, gaining financing or other assistance and
expediting the pre-development process.

Source: NYC Housing Preservation & Development

 SURVEY OF THE COLIVING LANDSCAPE
MATRIX
28

 These companies feature all-inclusive amenities, though the degree to which
 they emphasize the coliving experience varies. Additionally, size affects the
 number of amenities and features that each company can provide to tenants.
 For example, most coliving operators offer catered social events and weekend
 getaways. Firms like Hubhaus and Bungalow use their platform to provide a
 market for single family homes to be leased on a per bed basis, building a small-
 scale coliving communities. The remaining investment grade operators are
 aiming for ever larger scale communities with resident totals in the hundreds.

 C U S H M A N & WA K E FI E L D
29

COMPETITORS ACROSS NEW RENTAL MODELS
 Who are some of the players in these spaces?

 COLIVING

 QUARTERS X SOCIAL
 COMMUNITIES

 OLLIE THE COLLECTIVE

 COMMON WELIVE

 HUBHAUS

 MICRO-LIVING

 NICHOLS FLATS
 PARTNERSHIP

 MONADNOCK PANORAMIC
 DEVELOPMENT INTERESTS
 LLC.

 SHORT-TERM RENTAL / EXTENDED STAY

 ROAM OUTSITE

 THE GUILD STAY ALFRED
 HOTELS

 SONDER WHYHOTEL

 AIRBNB LYRIC

 SURVEY OF THE COLIVING LANDSCAPE
30

 COMPETITIVE OVERVIEW
 Some of the most standard features that these companies the community including: group events, catered events, fully-
 provide are common areas that are integral to the coliving furnished rooms (with fully-integrated kitchens, bathrooms and
 experience. These areas provide the community aspect for washers and dryers), cleaning services, all-inclusive bills, gyms
 individuals renting in a coliving building. Integrated technology, and movability. A majority of coliving firms allow tenants to
 such as in-app full-service management and complementary move into any company-owned building throughout the country.
 Wifi, are community essentials in all of these buildings. Tenants That is, a renter coliving in Chicago who moves to New York for
 are expecting a seemless operating platform that can provide a new job may simply transfer to a New York building owned by
 everything from necessities to communication to even planning. the same coliving company.
 More specifically, this operating platform connects all aspects of

 FUNDING FOR COLIVING COMPANIES IS DIVIDED BETWEEN:
 - OPERATIONS: VENTURE CAPITAL OR ANGEL FUNDING FOR BUILDING
 PLATFORM AND FEATURES
 - PROPERTY: DEBT AND EQUITY FOR DEVELOPING GROUND-UP PROJECTS

 PLAYERS IN EACH SPACE
 Where do these companies rank in terms of funding vs. production?
 Operations Funding: Existing U.S. Bedrooms vs. Funding for Coliving Companies

 10,000

 BUNGALOW2
 1,000

 COMMON WELIVE1
 OLLIE
 Existing Bedrooms

 HUBHAUS2
 STARCITY
 100

 10

 0
 0 10 100 1000

 Operator Model Funding (in $ Millions)
 Full Stack (Developer-Owner-Operator) Model
 Single Family Conversion Model
 1.WeWork has raised $12.8B in venture funding and has recently opened a $2.9B acquisitions platform, allocations toward WeLive concept have not been publicized.
 2. Both Bungalow and Hubhaus utilize a different operational model - converting primarily single family homes into coliving assets
 C U S H M A N & WA K E FI E L D
31

 Property Funding: Existing U.S. Bedrooms vs. Funding for Coliving Companies

 10,000

 X SOCIAL
 1,000
 COMMUNITIES

 WELIVE1
 Existing Bedrooms

 QUARTERS3
 100

 THE COLLECTIVE

 10

 0
 0 10 100 1000

 Operator Model Funding (in $ Millions)
 Full Stack (Developer-Owner-Operator) Model

One other feature that distinguishes more established coliving themselves. Much like an office building, the curated community
companies from smaller firms is an integrated app. Groups like in a coliving building fosters inclusivity that enables tenants to
Common, Quarters and X Social Communities enhance the meet a variety of other individuals and expand their network.
coliving experience by providing tenants with a phone app that Firms that offer group activities within coliving spaces provide
makes the coliving experience easier. The phone application the opportunity for tenants to interact with other tenants,
allows tenants to manage bills, make payments, request engage and build relationships. A third reason why tenants
maintenance and interact with other community tenants through choose to colive is the ephemeral nature of community renting.
the safety and convenience of an electronic device. Generation Y tenants are predominantly single, want flexibility
 and convenience and value authentic experiences.
Individuals choose coliving for a variety of reasons. Firstly, the
cost of living in a shared community is less than in an individual
apartment. Secondly, individuals who choose coliving also do
so for the network of individuals with whom they can surrounds

3. Includes only U.S. Quarters funding, Quarters also raised $1.1B from Corestate Capital for European expansion.

Source: Cushman & Wakefield Research, CoStar, Crunchbase, Crain’s, The Real Deal, Curbed

 SURVEY OF THE COLIVING LANDSCAPE
32

 COMMON
 EXISTING MARKETS

 TARGET MARKETS

 LOS ANGELES CHICAGO WASHINGTON D.C.
 Common Briar

 Common Richardson
 Common Melrose
 Common Bowman
 Common Belmont
 Common Damen

 Common Addams
 Common Racine

 SEATTLE NEW YORK SF / OAKLAND
 Common MacArthur

 Common Summit
 Common Clinton
 Common Terry

 Common Havenmeyer
 Common Fairview Common Minna
 Common Valencia
 Common Baltic

 Common Lincoln

 Business Model: Operator with development partners Known Target Markets: Philadelphia, Pittsburgh,
 Denver, Austin, Minneapolis, Dallas, Nashville,
 Current U.S. Bedrooms Estimate: 731 San Diego, Portland, Boston, Charlotte, O

 Operations Funding Reported: $63+M Common is a tech-enabled, community-focused residential
 property manager working with real estate partners to
 Operations Fund Entities: Norwest Venture Partners, operate traditional apartments and coliving suites. We
 8VC, Solon Mack Capital, Circle Ventures, Justin Mateen, manage 26 buildings across New York City, Chicago, San
 Richard LeFrak, Circle Ventures, Maveron, Wolfswood Francisco, Seattle, Los Angeles, and Washington, D.C.
 Partners, Grand Central Tech, Inevitable Ventures at a 98% occupancy rate and above-market NOI.

 Partnerships: CityPads, Anew Apartments, Patoma Common has a proven history of keeping vacancy low and
 Partners, YD Development, Duke Properties, Proper retention high through its recognizable consumer brand,
 Development, Harrison Capital, Six Peak Development superior digital marketing and leasing capabilities, and tech-
 enabled tenant experience. Common currently receives 3,200
 Markets Existing: New York City, Washington D.C., leads every week.
 Chicago, Los Angeles, San Francisco, Seattle

 EXAMPLE DEVELOPMENT

 COMMON ADDAMS, CHICAGO 223 BEDS 2019 EXPECTED

 C U S H M A N & WA K E FI E L D
33

OLLIE
 EXISTING MARKETS

 TARGET MARKETS

 BOSTON NEW YORK

 ALTA+ by Ollie

 (Ollie at Boston) Ollie at Carmel Place

 LOS ANGELES PITTSBURGH

 Ollie at Baumhaus

 Ollie at DTLA

Business Model: Operator with equity to joint venture on Founded by brothers Andrew and Chris Bledsoe, Ollie
new projects originated in New York City and has partnered with
 developers for projects in Long Island City, Kips Bay
Current U.S. Bedrooms Estimate: 512
 and Pittsburgh - with known future developments
Operating Funding: $15+M in the pipeline for Boston and Los Angeles. Ollie has
 focused its efforts in not only providing an in-app
Operating Funding Sources: Aviva Investors, The Moinian interface and necessities, but also a fully furnished
Group, Texas Employees Retirement System, Justin Mateen experience complete with a lifestyle and wellness
Partnerships: Simon Baron Development, Quadrum Global goods division known as Ollie Provisions Co.

Markets Existing: New York City, Pittsburgh
Known Target Markets: Los Angeles, Boston

 EXAMPLE DEVELOPMENT

 ALTA+ BY OLLIE, 2018 DELIVERED
 467 BEDS
 LONG ISLAND CITY

 SURVEY OF THE COLIVING LANDSCAPE
34

 QUARTERS
 EXISTING MARKETS

 TARGET MARKETS

 CHICAGO PHILADELPHIA NEW YORK
 Quarters East Village
 Quarters Lower East Side

 Quarters Chicago
 Quarters NoLibs

 Quarters Brooklyn

 Business Model: Operator with equity to joint venture on new Founded by Gunther Schmidt in 2015 out of Berlin, Quarters
 projects has quickly expanded across Europe and over the Atlantic
 to the United States. Across both continents, Quarters
 Current U.S. Bedrooms Estimate: 293 currently operates 1,300 rooms. In Europe, Quarters has
 received $1.1B from Corestate Capital to buy and build 35
 Property Funding Reported: $300M (U.S.), $1.1B (Europe) coliving projects in Europe, totaling up to 6,000 beds. This
 initiative will target cities over 500,000 in population and
 Operation/Property Fund Entities: Ralph Winter
 have an approximate deal size of $22M to $66M. Meanwhile,
 (U.S.), Corestate Capital (Europe), Medici Group
 in the U.S., Quarters $300M infusion from W5 Group,
 the family office for Ralph Winter, is targeting a national
 Partnerships: Caton Commercial, MCZ Development
 expansion that will partner with local developers in target
 Markets Existing: New York City, Chicago cities, providing a portion of capital for each project. The
 ultimate aim of this funding is to produce 1,500 units of
 Known Target Markets: Washington D.C., Denver, Quarters-managed units across the country. Quarters has
 Austin, Dallas, Minneapolis, Indianapolis also developed a proprietary app to provide an interface
 for resident services and property management.

 EXAMPLE DEVELOPMENT

 QUARTERS WEST LOOP,
 175 BEDS 2018 DELIVERED
 CHICAGO

 C U S H M A N & WA K E FI E L D
35

STARCITY
 EXISTING MARKETS

 TARGET MARKETS

 LOS ANGELES SAN FRANCISCO SAN JOSE
 Starcity Venice Beach Starcity North Beach
 C1 at Marina Arts
 (Starcity Bassett)
 Starcity Soma South Park
 (Starcity Minna)
 Starcity NoPA
 Starcity West SoMA

 Starcity The Mission

 Business Model: Owner and operator with equity to joint Established in 2016 by Jon Dishotsky, Jesse Suarez, Mo
 venture on new projects Sakrani and Josh Lehman, Starcity is a West Coast-based
 coliving operation based around a combined ownership and
 Current U.S. Bedrooms Estimate: 440 management platform. Founded by veterans of real estate,
 Operations Funding Reported: $20.3M tech and hospitality, Starcity has the largest stock of coliving
 beds along the West Coast. With all of its current assets
 Operations Fund Entities: Bullpen Capital, Y
 located in the markets of San Francisco and Los Angeles,
 Combinator, Urban Us, Alrai Capital, Vander
 Starcity has taken particular care in branding itself as a
 Capital Partners, Social Capital
 solution to the affordability crises in both areas, as well as a
 Partnerships: CLG partner of local communities.
 Markets Existing: San Francisco, Los Angeles
 Known Target Markets: San Jose,

 EXAMPLE DEVELOPMENT

STARCITY BASSETT, SAN JOSE 790 BEDS 2020 EXPECTED

 SURVEY OF THE COLIVING LANDSCAPE
36

 EXISTING MARKETS

 THE COLLECTIVE TARGET MARKETS

 CHICAGO NEW YORK
 Paper Factory

 633 S LaSalle

 555 Broadway

 1215 Fulton

 Business Model: Ground up Developer and Operator Founded by Reza Merchant in 2010, the Collective
 began in London with the largest (currently operating)
 Current U.S. Bedrooms Estimate: 125+
 coliving development, the 546-bed Old Oak. The
 Property Funding: $800+ M Globaly Collective has raised $800M to ground-up develop
 6,500 new units across Europe and the United States.
 Property Fund Entities: Jonathan Teklu, Undisclosed Three projects been announced for New York, while
 Partnerships: N/A two more have been announced for London as well
 as a third headquarters in Germany. The Collective
 Markets Existing: London, New York City partners with local developers to develop purpose-
 Known Target Markets: New York City, Dublin, Chicago built locations that they will own and operate.
 Development plans are in the works for three sites in
 Brooklyn and announced another for downtown Chicago
 in May, 2019. The Collective also continues to expand
 in Europe, dwarfing Old Oak with the 705-bed Canary
 Wharf development in London due July 2019. The firm
 has also announced plans for a site in Dublin, Ireland.

 EXAMPLE DEVELOPMENT

 OLD OAK, LONDON 546 BEDS 2017 DELIVERED

 C U S H M A N & WA K E FI E L D
37

WELIVE
 EXISTING MARKETS

 TARGET MARKETS

 NEW YORK SEATTLE WASHINGTON D.C.

 (WeLive Belltown)

 WeLive Wall Street
 WeLive Crystal City

Business Model: Operator with equity to joint venture on new The coliving division of WeWork, WeLive opened its first
projects coliving operations on Wall Street and Crystal City in 2017.
 These provided testing sites for WeLive to determine how
Current U.S. Bedrooms Estimate: 351+
 they wanted to execute their coliving concept, while also
Operations/Property Funding Reported: Determined by determining the best way to connect the concept with
allocation from WeWork. WeWork has raised $12.8B in WeWork. In the intervening two years, WeLive worked
funding. in concert with Martin Selig Development in Seattle to
 develop a ground-up combined WeWork and WeLive
Funding Source: WeWork, SoftBank concept built on what they’ve learned in New York and
 Washington DC. Plans have already been circulated
Partnerships: Martin Selig Development, JBG Smith,
 for a follow-up project in Seattle. Furthermore, WeLive
Rudin Management
 announced plans to debut a coliving concept in India
Markets Existing: New York City, Washington D.C. in 2019, likely targeting cities where WeWork already
 has a presence: Bengaluru, Mumbai and Gurgaon.
Known Target Markets: Seattle

 EXAMPLE DEVELOPMENT

 WELIVE WALL STREET, 93 BEDS 2016 DELIVERED
 NEW YORK CITY

 SURVEY OF THE COLIVING LANDSCAPE
38

 X SOCIAL EXISTING MARKETS

 COMMUNITIES TARGET MARKETS

 MIAMI/ORLANDO PHOENIX OAKLAND

 (X Orlando) (X Phoenix) (X Oakland)

 CHICAGO DENVER
 X Logan Square

 (X Las Olas) (X Denver)
 (X Denver 2) (X Denver 3)
 X Miami

 X Chicago

 Business Model: Full-stack developer, owner and operator A division of Property Markets Group, XSL focuses on
 offering its residents the experience of “social living”. XSL
 Current U.S. Bedrooms Estimate: 970
 has branded a combination of traditional units and rent-
 Property Funding Reported: $300+M by-the-bedroom larger units under a coliving banner. XSL
 launched its first test projects in Chicago in 2015 and 2018,
 Property Fund Entities: Raven Capital with deliveries in both Florida and Denver on the horizon.
 Management, PMG (Property Markets Group) All new projects are planned to be ground-up, large-
 Partnerships: N/A scale (from 200 to 1,500 beds) targeting markets outside
 of the urban centers of New York, Los Angeles and San
 Markets Existing: Chicago, Miami, Fort Lauderdale Francisco - the logic being that these markets are fertile
 Known Target Markets: Denver, Oakland, Orlando, ground for the talent and renter base that finds coliving
 Phoenix, Tempe, Houston, Tampa, Minneapolis, Atlanta attractive, but are not impacted by the competition of those
 top three affordability-challenged markets. XSL has also
 made a strong push to promote the community of their
 developments through a fully-integrated in-app experience.

 EXAMPLE DEVELOPMENT

 OWNED/UNDER
 X LAS OLAS, FT LAUDERDALE 1,994 BEDS
 DEVELOPMENT

 C U S H M A N & WA K E FI E L D
39

 Major U.S. Coliving Developments

 (BELLTOWN)

 SUMMIT ALTA+ BY OLLIE
 TERRY KIPS BAY
 (CLINTON HILL)
 PAPER FACTORY

 NORTH BEACH
 EAST VILLAGE
 SOMA SOUTH PARK EAST SIDE
 MISSION (BROOKLYN)
 WEST SOMA
 NOPA
 (633 S LASALLE) WEST LOOP (BOSTON)
 (HAYES VALLEY)
 (MINNA)
 (BASSETT)
 (NOLIBS) WALL STREET
 BAUMHAUS
 (DENVER 1)
 CHICAGO
 (DENVER 2)
 (OAKLAND) (DENVER 3) LOGAN SQUARE BRIAR ALBANY

 DAMEN CRYSTAL CITY BALTIC
 MACARTHUR
 RACINE BALTIC WEST
 MINNA
 (ADDAMS) CORNELIA
 VALENCIA
 FAIRVIEW
 RICHARDSON
 HAVEMEYER
 BOWMAN
 HERKIMER
 KINGSTON
 LINCOLN
 (DTLA)
 PACIFIC
 BELMONT STERLING
 MELROSE (CLINTON)

 (PHOENIX)
 VENICE BEACH
 C1 AT MARINA ARTS

 (ORLANDO)

 (LAS OLAS)
 (TWO SAINTS)
Note: developments with MIAMI
 (BISCAYNE)
parentheses “()” have an
executed agreement and
are in some phase of pre- (LITTLE HAVANA)
development or construction.

 COMPANY CURRENT U.S. BEDS ESTIMATED BEDS IN PIPELINE LOWER BOUND

 Common 731+ 2,000+
 Ollie 512+ 600+
 Quarters 293+ 1,200+
 Starcity 200+ 1,600+
 The Collective 125+ 1,000+
 WeLive 351+ 400+
 X Social Communities 970+ 9,930+
 TOTAL 3,182+ 16,730+

 FUNDING EXISTING U.S.
 COMPANY TYPE PARTNERS FUNDING / EQUITY
 (IN $ MILLIONS) BEDROOMS EST.
 Operations Fund Entities: Finitive,
 Operations Khosla Ventures, Founders Fund, Wing
Bungalow Operator 584
 Funding: $64.0 Venture Capital, UpHonest Capital,
 Cherubic Ventures, Wei Guo, Atomic
 CityPads, Anew
 Operations Fund Entities: Norwest
 Apartments, Patoma
 Venture Partners, 8VC, Solon Mack
 Partners, YD Development,
 Operations Capital, Circle Ventures, Justin Mateen,
Common Operator 731 Duke Properties,
 Funding: $63.4 Richard LeFrak, Circle Ventures,
 Proper Development,
 Maveron, Wolfswood Partners, Grand
 Harrison Capital, Six
 Central Tech, Inevitable Ventures
 Peak Development

 Operations Operations Fund Entities: Social
Hubhaus Operator 240
 Funding: $13.4 Capital, General Catalyst
 Operations Fund Entities: Aviva Investors,
 Operations Simon Baron Development,
Ollie Operator 512 The Moinian Group, Texas Employees
 Funding: $15.0 Quadrum Global
 Retirement System, Justin Mateen
 Property Funding: Property Fund Entities: Ralph Winter (U.S.),
 MCZ Development.
Quarters Operator $300+ (U.S.) 293 Corestate Capital (Europe)
 Caton Commercial
 $1,100 (Europe) Operations Fund Entities: Medici Group
 Operations Fund Entities: Bullpen Capital,
 Operations
Starcity Owner-Operator 200 CLG Y Combinator, Urban Us, Alrai Capital,
 Funding: $20.3
 Vander Capital Partners, Social Capital
 Property Funding:
The Collective Owner-Operator 125 Property Fund Entities: Undisclosed
 $800+
 Determined by
 allocation from Martin Selig, JBG Smith, Operations Fund Entities:
WeLive Operator 351
 WeWork. WeWork has Rudin Management WeWork Via SoftBank
 raised $12.8B in funding.
 Developer-Owner- Property Fund Entities: Raven Capital
X Social Communities Property Funding: $300 970
 Operator Management, PMG (Property Markets Group)

Source: The Collective, OpenDoor, Starcity, Hubhaus, Quarters, WeLive, Ollie, Bungalow, Common , X Social Communities,Crunchbase, Pitchbook

 SURVEY OF THE COLIVING LANDSCAPE
IN COLIVING
42

 THE HUNT FOR NICHE ASSETS
 Niche Asset Investment Sales Volumes
 Rolling 4Q, Dollars in Billions

 80

 70

 60

 50

 40

 30

 20

 10

 0
 DEC-01

 DEC-02

 DEC-03

 DEC-04

 DEC-05

 DEC-06

 DEC-07

 DEC-08

 DEC-09

 DEC-10

 DEC-11

 DEC-12

 DEC-13

 DEC-14

 DEC-15

 DEC-16

 DEC-17

 DEC-18
 Medical Office Datacenter Cold Storage Age-Restricted Student Housing Affordable Housing Senior Housing

 Source: RCA, Cushman & Wakefield Research

 RISE OF NICHE ASSET CLASSES DISRUPTION IS THE NEW NORMAL
 Post-Recession, niche real estate classes such as allocations Despite a relative nascent entrance into the real estate world
 across age restricted and affordable housing, coworking, data housing market, coliving has already reached the beginning
 centers, as well as self and cold storage have soared as solid of a critical tipping point. There is a proven demand for the
 investments. Over time, investors have taken notice and many product, as evidenced by the burgeoning number of companies
 of these niche classes now make an appearance in the most entering the market. From well established firms to newer
 prestigious portfolios. In Price Waterhouse Cooper's annual players, all of these organizations are grabbing a foothold. And
 2018 Emerging Trends in Real Estate, age restricted housing these organizations are evolving. They’re entering new cities
 reached nearly $14B in year-over-year transactions. In the same and markets, increasing capacity at established locations and
 report, Price Waterhouse Coopers found that Medical Office partnering with other services to curate an experience that
 was the strongest prospect among office sub-sectors for the attracts the largest number of tenants. Demand is proven. Yet,
 third year in a row. More emergent niche areas have also seen there is still a lack of supply despite market expansion, and this
 signs of promise. Data centers held another banner year in 2018, enables institutions to enter during this inflection point. The
 absorbing over 474 megawatt users and pre-leasing more than ability to deploy large amounts of capital in a relatively new and
 55% of all new developments. Coworking office space reached small arena will have an enormous impact. However, this impact
 a record 51 million square feet globally in 2018. Cushman & will shrink once more coliving companies emerge and more
 Wakefield investors surveys found that many were comfortable institutions with capital enter the fray.
 with up to 30% of a building devoted to coworking.

 Coliving follows in the footsteps of these niche asset classes
 that began with a small footprint but have been making a large
 impact in investor portfolios.

 C U S H M A N & WA K E FI E L D
43

Dry Powder Target at North America Commercial Real Estate by Strategy
Dollars in Billions

 70

 60

 50

 40

 30

 20

 10

 0
 DEC-00

 DEC-01

 DEC-02

 DEC-03

 DEC-04

 DEC-05

 DEC-06

 DEC-07

 DEC-08

 DEC-09

 DEC-10

 DEC-11

 DEC-12

 DEC-13

 DEC-14

 DEC-15

 DEC-16

 DEC-17

 DEC-18
 ➖ Opp ➖ VA ➖ Debt ➖ Core-Plus ➖ Core

Source: Preqin, Cushman & Wakefield Research

Intensive Competition for Assets
But also a necessary expansion of liquidity by market, sector and deal size

 2%
 4%
 16%

 32% 32%
 AMOUNT OF CAPITAL
 FUND MANAGERS PLAN
 FUND MANAGERS’
 30% TO DEPLOY IN REAL
 PLANNED CHANGE IN THE
 ESTATE ASSETS IN
 THE NEXT 12 MONTHS LEVEL OF EXIT ACTIVITY
 COMPARED WITH THE IN THE NEXT 12 MONTHS
 PAST 12 MONTHS

 52%
 32%

 ◼ Significantly More Capital ◼ Slightly More Capital ◼ Increase ◼ No Change ◼ Decrease
◼ Same Amount of Capital ◼ Slightly Less Capital ◼ Significantly Less Capital

Source: Preqin Fund Manager Survey, Nov 2017

 SURVEY OF THE COLIVING LANDSCAPE
44

 COLIVING IS THE CURRENT NICHE ASSET
 CLASS ON INVESTORS’ RADAR
 In order for any real estate product to achieve true market
 penetration and dominance, institutional capital is needed. Most
 of these capital sources have a number of prerequisites that
 must be met before an allocation can be decided. While every
 institution may have its own formula for requirements, they
 generally fall somewhere along the following sequence:

 1. Proven Demand
 The market must be of sufficient size to warrant investment.

 SIZE OF MILLENNIAL AGE GROUP, WITH
 GEN Z ALREADY AT 74M

 A RECORD NUMBER OF UNDER
 35-YEAR-OLDS ARE RENTING

 % OF HIGHLY EDUCATED UNDER 30
 WORKFORCE WITH STUDENT DEBT

 2. Lack of Supply
 There must be demonstrable evidence that there is continued
 runway for the asset type going forward.

 ESTIMATED TOTAL NUMBER OF
 CURRENT U.S. COLIVING BEDS

 C U S H M A N & WA K E FI E L D
You can also read