Internationalisation of the Rupee - No. 222 07-Feb-2018 Shekhar Hari Kumar, and Ila Patnaik - NIPFP
←
→
Page content transcription
If your browser does not render page correctly, please read the page content below
NIPFP Workingpaper
                                                         NIPFP Working paper series
                                                                             series

Internationalisation of the Rupee

No. 222
07-Feb-2018
Shekhar Hari Kumar, and Ila Patnaik

               National Institute of Public Finance and Policy
                                  New Delhi
Working paper No. 222

                         Internationalisation of the Rupee
                                                           ∗                      †
                           Shekhar Hari Kumar                       Ila Patnaik

                                                  Abstract
           The Indian Rupee currently accounts for approximately 1% of global foreign ex-
       change turnover. It has a smaller market size across most trading instruments when
       compared to the top 8 emerging market currencies. In this paper, we evaluate the
       current status of the Indian Rupee as an international currency using the Chinn and
       Frankel (2008) framework, and explore the possibility of future Indian Rupee interna-
       tionalisation. We find that the Indian Rupee has a negligible role as an official sector
       currency. It has some use as a reserve currency in its economic sphere of influence,
       but no role as an anchor or intervention currency. Private actor adoption of the Indian
       Rupee is much larger and more diverse than the official sector. However, this role is
       mostly restricted to financial flows and portfolio investment. In terms of trade invoic-
       ing and settlements in the private sector, the Indian Rupee plays a limited role due to
       concerns of convertibility and risk management. Given the current path of exchange
       control and capital account liberalisation, we anticipate gradual internationalisation of
       the Indian Rupee due to regional competition from the Renminbi.

   ∗
    This paper is accepted as a chapter in a book on Use of National Currencies in International Settlements:
Experience of the BRICS countries, a publication by the Russian Institute for Strategic Studies.
  †
    The authors would like to thank Mohit Desai for his excellent research assistance.

                                                       1

 Accessed at http://www.nipfp.org.in/publications/working-papers/1815/                           Page 2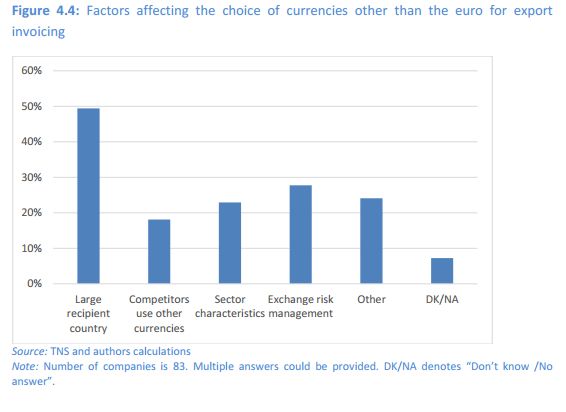
Working paper No. 222

1       Introduction

The global financial crisis (GFC) of 2008, for a variety of complex reasons, prompted
emerging markets (EMs) to reconsider the role of their currencies as global alternatives to
the “big four” currencies.1 Zhou (2009) argued that the outbreak of the GFC and its
spillover to the entire world reflected the inherent vulnerabilities and systemic risks in the
existing international monetary system. This was an indirect assertion that US was taking
advantage of the reserve currency status of the US dollar and dollar liquidity shortages were
a real problem for EMs during the GFC (Ito, 2016). China in response embarked on an
ambitious project of “Renminbi internationalisation” with the coupled goals of international
monetary reform and diversification of global currency risk through internationalising its
currency (Gao et al., 2011; Lee, 2014; Eichengreen, 2013; Shu et al., 2015).
China’s policy pivot prompted policy makers in India to consider the possibility of in-
ternationalising the Indian Rupee (INR). The Reserve Bank of India (RBI)
commissioned two studies in 2010 and 2011 (Ranjan and Prakash, 2010; Gopinath,
2011) to examine the issues surrounding the internationalisation of the INR. Both
studies recommended a cautious approach towards currency internationalisation given the
size of the Indian GDP, lower presence in global trade and partial capital account
convertibility. They also added that while the Rupee is a natural contender for
transitioning into a global currency, policy-makers should start by increasing the role of the
INR in its local region where the Renminbi has taken a lead over the Rupee. In spite of an
early interest in pursuing a policy of currency internationalisation, both the Indian
government and the RBI do not consider it to be a priority in the short to medium
term.2 3
In this paper, we evaluate the current status of the Rupee as an international currency and
look at the possibility of future INR internationalisation. Section 2 revisits the definition of
an international currency and looks at the pre-conditions for currency internationalisation.
We compare the growth of currency markets in EMs and discuss the roles of macroeconomic
fundamentals in currency internationalisation in Section 3. We summarise the role of the
INR as an international currency in Section 4. Section 5 concludes by discussing some near
term measures that may be undertaken to accelerate the process of internationalisation. We
also try and place Rupee internationalisation in the broader process of financial and
exchange control liberalisation.

2       What is meant by the internationalisation of the Rupee?

There is a well established literature to define what is meant by an internationalisation of a
currency (Eichengreen and Flandreau, 2012). According to Kenen (2011), an international
currency is one that is used and held beyond the borders of the issuing country, not merely
    1
      US Dollar, Euro, British Pound and Japanese Yen
    2
      Lok Sabha question answered by Jayant Sinha, Minister of State, Finance https://goo.gl/TbWRxD
    3
      Response by Governor Raghuram Rajan on Rupee internationalistion https://goo.gl/eYPcCK

                                                        3

Accessed at http://www.nipfp.org.in/publications/working-papers/1815/                       Page 3
Working paper No. 222
for transactions with that country's residents but also, and importantly, for transactions
between non-residents. Chinn and Frankel have developed a framework based on interna-
tional functions of a currency to determine the level of its internationalisation. Table 1
shows the various roles of an international currency. The “big four” currencies fulfill all the
6 roles of an international currency. BRICS currencies may fulfill some if not all private
roles but have a limited role as an international currency in the official sector. We will use
this framework to evaluate the internationalisation of the Rupee in Section 4.
Table 1 Roles of an international currency; based on Chinn and Frankel (2008)
Function of money Governments Private actors
Store of value International Reserves Currency substitution
and investment
Medium of exchange Vehicle currency for Invoicing trade and fi-
FX intervention nancial transactions
Unit of account Anchor for local cur- Denominating trade
rency pegging and financial transac-
tions
Kenen (2011) also enumerates the process of internationalisation of a currency including
the necessary preconditions. They are as follows:
1. The government must remove all restrictions on the freedom of any entity, domestic
or foreign, to buy or sell its country’s currency, whether in the spot or forward market
2. Domestic firms are able to invoice some, if not all, of their exports in their country’s
currency, and foreign firms are likewise able to invoice their exports in that country’s
currency, whether to the country itself or to third countries
3. Foreign firms, financial institutions, official institutions and individuals are able to
hold the country’s currency and financial instruments denominated in it, in amounts
that they deem useful and prudent
4. Foreign firms and financial institutions, including official institutions, are able to
issue marketable instruments in the country’s currency
5. The issuing country’s own financial institutions and non-financial firms are able to
issue on foreign markets instruments denominated in their country’s own currency
6. International financial institutions, such as the World Bank and regional development
banks, are able to issue debt instruments in a country’s market and to use its currency
in their financial operations.
7. The currency may be included in the “currency baskets” of other countries, which
they use in governing their own exchange rate policies
4
Accessed at http://www.nipfp.org.in/publications/working-papers/1815/ Page 4Working paper No. 222
A national currency may be regarded as internationalised if most of the above conditions
hold. Please note that condition 1 is a binding constraint to currency internationalisation
of a national currency. Given that the BRICS countries have imperfect capital account
convertibility, most the internationalisation is driven by the trade channel and growth
of bilateral trade. Currency invoicing (condition 2) seems to be independent of capital
account convertibility problems as long as there is an adequate volume of trade and some
basic accessibility to hedging markets, natural hedges or forward contracts. The BRICS
countries have liberalised their investment frameworks considerably over the last 20 years
and con-dition 3 and 4 holds for most large EM currencies including the INR. However,
condition 5 is not met by any large EM as the problem of “original sin” makes raising
foreign debt in foreign currency easier than raising foreign debt in local currency.
Condition 6 is partially met by BRICS countries being involved in the New Development
Bank (NDB) and Asian Infrastucture Investment Bank (AIIB) (Dixon et al., 2015).
However, it is interesting to note that only China has raised capital in local currency
terms in the local market from the NDB, whereas Brazil, Russia, India and South
Africa (BRIS) all raised funding in dollars. Condition 7 is the last stage in the
internationalisation of a currency and there is increasing evidence that the Renminbi is
being held as a reserve currency whereas the BRIS currencies are only used in their local
regions (Eichengreen et al., 2015).
Irrespective of capital controls, there has been tremendous growth in the trading of BRICS
currencies in the last 20 years. We shift gears and look at market outcomes in Section 3
to get a sense of what drives growth of currency markets and how internationalised is the
Rupee compared to the BRICS currencies.
5
Accessed at http://www.nipfp.org.in/publications/working-papers/1815/ Page 5Working paper No. 222
3 Rise of Rupee trading
Figure 1 Average daily turnover in the Rupee since 1995
60
50
40
USD Billion
30
20
10
0
1995 2000 2005 2010 2015
Source: BIS triennial survey 2016, Table D11.3, All instruments, net-net basis
The triennial Central Bank Survey of Foreign Exchange and Derivatives Market Activity
published by BIS is currently the most comprehensive source of information on trading in
FX markets (BIS, 2010, 2013, 2016). The survey provides consistent comparison on the
size and structure of FX and OTC derivatives markets, and has been conducted every 3
years since 1995. In the latest edition of the survey, data was collated for 53 currencies,
encompassing instruments such as spot transactions, outright forwards, foreign exchange
and currency swaps and options. Central banks collect data from various banks and other
dealers within their jurisdictions, which is reported to BIS and used to calculate global ag-
gregates. For the first time since 2001, global FX trading declined between two consecutive
surveys. Global FX turnover fell to $5.1 trillion per day in April 2016, from $5.4 trillion in
April 2013. However, trading in EM currencies grew over this period with the Renminbi
gaining market share (Moore et al., 2016). The “big four” currencies maintained their mar-
ket shares and remain the only currencies which account for more than 10% market share
of all trades.4 As per the BIS, the INR was ranked 20th by average daily turnover, across
all FX instruments in April 2016. There average daily turnover in the INR has increased
almost 20 times from USD 3 Billion in 2001 to USD 58 Billion in 2016 (See Figure 3).
The BIS data has its limitations and might be an underestimate of forex trading volumes for
four reasons. Firstly, it does not provide much information on the time series behaviour of
trading volumes (Galati, 2000), or of offshore OTC data, due to its low frequency of
4
As of 2016; USD: 88% EUR: 31% JPY:22% GBP:13% is on the other side of all the reported currency
trades
6
Accessed at http://www.nipfp.org.in/publications/working-papers/1815/ Page 6Working paper No. 222
three years. Second, data from BIS may not capture activities of non-bank players (King
and Mallo, 2010). For example, if a hedge fund sends an order to an exchange, it is
likely to elude the measurement of the BIS. Three, there are some internal discrepancies
in the data, and the offshore figures quoted are only for the OTC market. Fourth, the
survey is conducted on a representative sample of market participants for a short period in
April; where volumes may be low for seasonal reasons.5 It is for these reasons that we believe
that the forex market is bigger than currently estimated by the BIS and the current
estimates should be seen as lower bound. Kumar et al. (2015) find that average daily Rupee
turnover is between USD 80-100 Billion once they account for the undercounting by the
BIS. Nevertheless, for purposes of cross-country comparison we use the BIS measure for
the remainder of this paper.
Figure 2 Average daily turnover in BRICS currencies since 1995
250
Country China Russia India Brazil South Africa
Average daily turnover (USD Billion)
200
150
100
50
0
1998 2004 2010 2016
Source: BIS Triennial Survey 2016, Table D11.3, All instruments, net-net basis
Figure 3 shows that trading in BRICS currencies grew on average at 20% every year
between 2001-2010. During this period the levels of trading in the BRICS currencies were
also comparable with average daily turnover averaging between USD 20-50 Billion. After
2010, trading in the Renminbi grew rapidly as Chinese authorities start pursuing a policy
of internationalisation. The Brazilian Real (BRL), South African Rand (ZAR) and Russian
Ruble (RUB) grew faster than the INR after 2010 but they pare their gains after the taper
tantrum of 2013. As of April 2016, the sum of the average daily turnover in the BRIS
currencies was roughly equal to the daily turnover in the Renminbi. We extend our sample
to large EMs (including the BRICS) tracked by the BIS to include the Turkish Lira, the
Korean Won and the Mexican Peso to look at the INR’s position amongst peer currencies
in Table 2. INR turnover was ranked 6th amongst a set of 8 comparable EMs and INR lost
5
Indian financial year is from April to April.
7
Accessed at http://www.nipfp.org.in/publications/working-papers/1815/ Page 7Working paper No. 222
some ground compared to this group after 2010.6 Moreover, the swap and option markets
for the INR were relatively small in comparison to the RUB and RMB.
Table 2 Ranking Rupee turnover versus large EM currencies, Split by instrument
Spot Forwards FX swaps Currency swap Options Total
INR 6 4 7 7 6 6
TRY 5 7 2 1 5 4
ZAR 7 8 5 2 7 8
RUB 4 6 4 6 8 5
MXN 2 5 3 8 3 2
KRW 3 1 6 5 4 3
BRL 8 3 8 4 2 7
CNY 1 2 1 3 1 1
Source: BIS Triennial Survey 2016
Ma and Villar (2014) use foreign exchange turnover as one of the proxies for identifying
the extent of internationalisation of a currency, as it helps shed light on the currency’s
use by non-residents. As a currency internationalises, we can expect to see greater trading
to take place in offshore financial centres. By this metric India ranks 6th or 7th amongst
comparable EM currencies depending on whether we consider Hong Kong an extension
of the Chinese onshore market (Table 3). Only the RUB has more onshore trading than
the INR. As a comparison, INR’s onshore share has been consistent at 41-44% between
2013-2016 whereas the RUB’s onshore share increased from 47-56% in the same period.
Table 3 Location of currency trading by EM currency
Location INR TRY ZAR RUB MXN KRW BRL CNY
Brazil 0 0 0 0 1 0 25 0
China 0 0 0 0 0 0 0 22
Hong Kong SAR 8 1 1 0 1 16 2 31
India 44 0 0 0 0 0 0 0
Korea 0 0 0 0 0 38 0 0
Mexico 0 ... ... ... 16 0 0 0
Russia ... 0 0 56 0 ... 0 0
Singapore 24 2 2 0 1 21 0 17
South Africa 0 0 24 0 0 ... ... 0
Turkey 0 13 0 0 ... ... ... 0
United Kingdom 13 61 44 29 29 13 21 16
United States 8 15 19 8 43 9 45 9
ROW 3 9 10 7 9 3 6 5
Total 100 100 100 100 100 100 100 100
Source: BIS Triennial Survey 2016, Table 7
6
Refer to https://goo.gl/7lHJqu
8
Accessed at http://www.nipfp.org.in/publications/working-papers/1815/ Page 8Working paper No. 222
If we compare the change in onshore shares between 2013 to 2016 (Table 4), there is
substantial heterogeneity in our sample of EM currencies. TRY, KRW, MXN and CNY
have become more internationalised over 2013-16 whereas ZAR, INR, RUB and BRL have
gained onshore trading shares. The INR was ranked 6th amongst peers by this proxy of
currency internationalisation as well.
Table 4 Change in percentage of onshore trading since 2013; Author’s calculations
Currency 2013 2016 Change
INR 41 44 7.32
TRY 19 13 -31.58
ZAR 23 24 4.35
RUB 48 56 16.67
MXN 20 16 -20.00
KRW 53 38 -28.30
BRL 20 25 25.00
CNY (Including HK) 57 53 -7.02
3.1 NDF markets in the INR
Non-Deliverable Forwards (NDF) differ from outright forward contracts where the coun-
terparties enter into a binding contract for a physical exchange of funds. NDF contracts
while similar in nature, impose no such restriction, allowing counterparties to settle profits
or losses on a notional amount without any physical exchange of funds. These contracts
are usually cash settled, denominated in USD, and traded on currencies which are not
readily available to trade globally. EM currencies, characterized by partial capital account
convertibility, form a bulk of NDF markets mainly because participants engaged in trade
and capital flows with these countries face barriers in access to domestic foreign exchange
markets.
In 2013, the estimated average daily turnover of NDF markets was USD 127 billion, ac-
counting for 19% of all outright forwards contracts traded globally (BIS, 2013). This figure
has grown by 5.3% in dollar terms to 134 Billion in 2016 (BIS, 2016). Four BRICS curren-
cies (excluding South Africa) contributed 36% to this turnover in 2016, down from 42%
in 2013. The decline has mainly been on account of China’s decreasing share (approx-
imately 40% decline) of NDF markets, with their offshore NDF markets being replaced
with offshore, deliverable forwards owing to Renminbi’s internationalization in the recent
years.
India’s turnover in the NDF market was reported to be at 16.5 billion USD in 2016, up
16.7% from 2013 in FX adjusted terms (BIS, 2016). The INR/USD NDF instrument
trades exclusively in offshore markets, forming approximately 60% of all turnover in INR
offshore markets. Comparison with the onshore currency derivatives market’s average daily
turnover of USD 17 Billion underscores the growing demand for the Rupee abroad. The
highly liquid offshore NDF market is a symptom of growing international interest in a
currency that is not fully convertible. Cut-off from access to the domestic INR markets,
9
Accessed at http://www.nipfp.org.in/publications/working-papers/1815/ Page 9Working paper No. 222
participants compensate for their forex risk by trading heavily in the offshore NDF markets.
Historical empirical evidence seems to suggest that the onshore-offshore forward premium
gap for the INR was always lower than the RMB (Hutchison et al., 2012), suggesting
greater financial integration in INR markets as compared to the RMB (Ma and McCauley,
2013). This may be changing as China internationalises the RMB and allows for greater
participation of non-residents in an offshore deliverable forward (CNH) market (McCauley
and Shu, 2016).
3.2 What determines forex market turnover?
Forex market turnover is a function of EM fundamentals like size of the economy, share
in global trade, financial depth and capital account openness (Eichengreen and Kawai,
2015). He and Yu (2016) find that share of a country in world trade has a clear positive
effect on the turnover of its currency in FX markets, but the effect of capital flows appears
insignificant. They also find that share of currency trade is significantly associated with
the financial depth measured by size of stock market size to GDP. He and Yu (2016) take
the full sample of BIS reporting currencies while conducting their analysis. We restrict our
sample to the 19 largest EMs7 in the BIS reporting group and look at correlations between
FX market size and various fundamentals. This exercise pins down which fundamentals
are important for growth in EM forex market turnover. Moreover, it helps us evaluate
whether FX market turnover is higher or lower compared to the level predicted by the
country’s fundamentals.
Figure 3 Drivers of FX market turnover in EM currencies: GDP
10000
CN
GDP 2015 (USD Billion)
2000
BRRU
IN
KRMX
ID TR
500
PL
CO TH ZA
MY
PH CL
200
PE CZ
HU
5 10 20 50 100 200
Daily Turnover 2016 (USD Billion)
Source: BIS triennial survey (2016), Table D11.3, WDI
Figure 3 shows the relationship between level of real GDP and forex market turnover. The
7
Refer to Section 6 for the list of countries
10
Accessed at http://www.nipfp.org.in/publications/working-papers/1815/ Page 10Working paper No. 222
correlation between these two variables is positive and significant. By this metric, INR,
BRL, RUB and RMB have smaller forex market turnover than predicted by their GDP
level. We look at the relationship between level of capital account openness as proxied by
the Fernndez et al. (2015) measure and forex market turnover in Figure 4. The Fernndez
et al. (2015) measure is rescaled from 0 to 1 with zero meaning a completely closed capital
account and one meaning a completely open capital account. The correlation between
forex market turnover and capital account openness is negative and insignificant. This is
primarily because INR and RMB are large EM currencies who are significant in spite of
being fairly closed capital account economies. The negative and insignifcant correlation is
opposite to what is predicted by the literature.
Figure 4 Drivers of FX market turnover in EM currencies: Openness
1.00
PE HU
KR
Openness (FKRSU (2015))
CZ RU
0.50
CL
BR MX
CO ID PL ZA TR
TH
0.20
PH MY
0.10
CN
0.05
IN
5 10 20 50 100 200
Daily Turnover 2016 (USD Billion)
Source: BIS triennial survey (2016), Table D11.3, FKRSU (2015)
11
Accessed at http://www.nipfp.org.in/publications/working-papers/1815/ Page 11Working paper No. 222
Figure 5 Drivers of FX market turnover in EM currencies: Trade turnover
5000
Volume of Trade 2015 (USD Billion)
CN
2000
KR
RU
IN
MX
BR
500 ID
TH
MY PL TR
CZ
HU ZA
CL
PH
CO
100
PE
5 10 20 50 100 200
Daily Turnover 2016 (USD Billion)
Source: BIS triennial survey (2016), Table D11.3, WDI
Figure 5 evaluates the relationship between volume of trade proxied by the value of imports
and exports from the WDI and forex market turnover. The relationship between these
variables is positive and significant. By this metric, the BRL and ZAR have larger forex
market sizes as predicted by their volume of trade whereas the INR, RUB and RMB have
smaller forex markets. We finally evaluate the relationship between fincancial depth as
proxied by market capitalisation to GDP to forex market turnover in Figure 6. We find
a negative and insignificant correlation between these two variables, similar to capital
account openness.
Figure 6 Drivers of FX market turnover in EM currencies: Size of financial market
MY ZA
MCAP to GDP 2015 (%)
CL
100
PH TH
KR
CO IN
BR
50
PE
ID RU MX CN
TR
PL
20
CZ
HU
5 10 20 50 100 200
Daily Turnover 2016 (USD Billion)
Source: BIS triennial survey (2016), Table D11.3, WDI
12
Accessed at http://www.nipfp.org.in/publications/working-papers/1815/ Page 12Working paper No. 222
This parsimonious correlation exercise tells us that level of GDP and volume of trade
are the most important fundamentals driving EM forex market turnover. This is a little
different to advanced countries where financial depth and capital account openness are
significant factors determining forex market turnover. This is most likely due to the fact
that a majority of EM currency demand comes through current account linkages rather
than financial account linkages given the presence of capital controls in large EMs. The
presence of capital controls seems to dampen currency demand in the case of INR and
RMB, as forex market turnover is lower than what is predicted by level of GDP and
volume of trade. This also indicates that these currencies have additional room to
grow as international currencies once there is greater capital account liberalisation (Ma
and Villar, 2014).
4 Role of INR as international currency
4.1 Official sector
Table 5 Allocation of foreign currency reserves: COFER, IMF (2016)
Currency 2016 Q2
Claims in U.S. dollars 63.4
Claims in Euros 20.2
Claims in Pounds sterling 4.7
Claims in Japanese yen 4.5
Claims in Canadian dollars 2
Claims in Australian dollars 1.9
Claims in Swiss francs 0.3
Claims in Other currencies 3
We switch gears and evaluate the internationalisation of the Rupee in terms of its roles as
an international currency in the tradition of Chinn and Frankel (2008) and Ito (2016) 8 .
We first look at the role of the INR as an international currency in the official sector. The
IMF collects information regarding a country’s composition of foreign currency reserves via
the Special Data Dessimination Standard (SDDS) and this data is released in aggregate
terms as Currency Composition of Official Foreign Exchange Reserves (COFER). COFER
gives us a sense of countries’ foreign currency asset holding. Table 5 shows the currency
composition of reserves as of Q2 2016. We can see that around 93% of all forex reserves are
denominated in the “big-four” currencies. The BRICS currencies are part of claims in other
currencies which at best amount to 3% of global reserve holding. As part of the inclusion
of the RMB in the Standard Drawing Rights (SDR), COFER will report breakdown of
RMB reserves from April 2017.9
8
See Table 1
9
Refer to http://www.imf.org/en/News/Articles/2015/09/14/01/49/pr1690 or https://www.imf.
org/external/np/pp/eng/2016/021816.pdf
13
Accessed at http://www.nipfp.org.in/publications/working-papers/1815/ Page 13Working paper No. 222
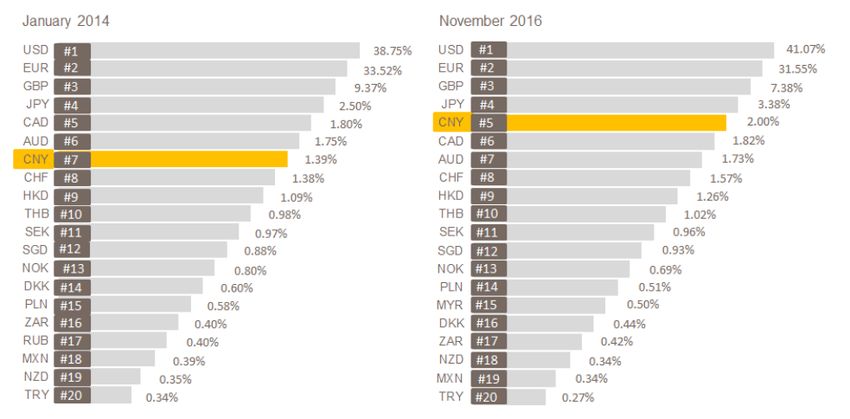
To supplement the COFER, the IMF conducted an ad-hoc survey of 130 member countries
on their holding of currencies in official foreign currency assets (IMF, 2015). The country
level information was classified but the IMF released summary information regarding the
global distribution of reserve assets along with their associated magnitudes. Figure 7 shows
that 6 countries claimed that they use INR in their official sector assets as of 2014. Only
the BRL has lower reserve asset penetration than the INR. There is a clear difference
between the RMB and the BRIS currencies. BRIS countries are used as reserve currencies
in their economic area of influence whereas the RMB had much wider usage in reserve
assets.
Figure 7 Role of INR in international reserves, Distribution
Source: IMF (2015)
14
Accessed at http://www.nipfp.org.in/publications/working-papers/1815/ Page 14Working paper No. 222
Figure 8 Role of INR in international reserves, Magnitude
Source: IMF (2015)
Figure 8 shows the magnitude of reserve assets holding in various currencies. By this
metric the INR is ranked second last amongst all major currencies. The volume of INR
held as reserve assets has increased from 2013 to 2014 to around a billion dollars. There is
some anecdotal evidence in some pockets of the economy that Indian rupee is accepted in
Singapore, Malaysia, Indonesia, Hong Kong, Sri Lanka and the UK. The Central Bank of
Nepal, Nepal Rastra Bank, also holds Government of India Treasury Bills (Ranjan 2010).
The INR is also a historical outlier, given the fact that INR was legal tender in Qatar,
Bahrain, UAE, Kuwait, Oman and Malaysia till the mid 1960s (Ranjan and Prakash,
2010).
Another mode of official sector currency internationalisation goes through bilateral swap
lines. After the GFC, use of swap lines between central banks has become a popular mode
for sharing dollar funding (liquidity) risk as well as currency internationalisation. The
People’s Bank of China (PBoC) has had tremendous success internationalising the RMB
through bilateral swap lines (Garcia-Herrero and Xia, 2013). The RBI unlike the PBoC has
utilised the swap line channel to mitigate dollar funding risks rather than build bilateral
ties to internationalise the Rupee. The RBI has entered into four swap line agreements,
out of which 3 are active.
15
Accessed at http://www.nipfp.org.in/publications/working-papers/1815/ Page 15Working paper No. 222
Table 6 RBI swap lines
Counterparty Last renewal Size Objective
Bank of Japan (inac- 2014-01-01 USD 50 Billion Mitigation of Dollar
tive) funding risk
SAARC countries 2016-02-01 USD 2 Billion Mitigation of Dollar
funding risk
Central Bank of UAE 2016-02-01 ?? Bilateral swap line,
management of INR-
AED mismatch
BRICS (Contingent 2015-07-01 USD 18 Billion Mitigation of Dollar
Reserve arrangement) funding risk
Table 6 shows bilateral swap arrangements entered into by the RBI. Out of the 4 swap
lines, the swap line with the Central bank of UAE is the only one denominated in local
currency.10 All the other swap lines have a dollar transaction leg. Table 7 summarises the
roles of the INR as a currency in the official sector and we can see that it has a negligible
role as an international currency.
Table 7 Roles of an INR as an offical sector currency
Function of money Governments Private actors
Store of value International Reserves Currency substitution
Negligible and investment
Medium of exchange Vehicle currency for Invoicing trade and fi-
FX intervention None nancial transactions
Unit of account Anchor for local cur- Denominating trade
rency pegging None and financial transac-
tions
4.2 Use of INR by private actors
4.2.1 Currency substitution and investment
India has a liberalised framework for foreign portfolio investment since the notification
of the Foreign Institutional Investor (FII) framework11 in 1995. The Indian securities
regulator, Securities and Exchange Board of India (SEBI) liberalised the foreign investment
framework recently in July 2014.12 Over 1000 new foreign investors registered with SEBI
10
Refer to https://www.rbi.org.in/Scripts/BS_PressReleaseDisplay.aspx?prid=36229
11
Refer to http://www.sebi.gov.in/acts/fiiregu2009.pdf, last accessed on on Jan 17th, 2017
12
Refer to http://www.sebi.gov.in/cms/sebi_data/attachdocs/1389083605384.pdf, last accessed on
on Jan 17th, 2017
16
Accessed at http://www.nipfp.org.in/publications/working-papers/1815/ Page 16Working paper No. 222
during the period June 2014 to August 2015, marking a 12% increase in the number of
investors registered with SEBI. On average, 19-20% of Indian equities are held by foreign
investors.13 Foreign portfolio investment (FPI) in debt is subject to limits, There is total cap
of USD 84 Billion for FPI-debt with a sub limit of USD 33 Billion for sovereign debt and
USD 51 billion for corporate debt. Prior to 2016, most of the FPI-debt limit for sovereign
debt was fully utilised with some room in the corporate bond segment. Given the changing
stance of global monetary policy, t here was a selloff i n EM bonds and current utilisation of
the FPI-debt i s below t he notified limit f or both sovereign and corporate segment.14 The
INR i s actively used f or currency substitution and i nvestment.
4.2.2 Rupee-denominated bonds
Liberalisation of the external commercial borrowings (ECB) framework in 201515 and 2016
allowed Indian coporates to issue INR denominated bonds overseas. These bonds are
commonly referred to as “Masala bonds”. The rupee denominated bond is an attempt to
shield issuers from currency risk and instead transfer the risk to investors buying these
bonds. The currency risk is borne by the investor and hence, during repayment of bond
coupon and maturity amount, if rupee depreciates, RBI will realize a marginal saving.
Many commentators have pointed out the issuance of Rupee denominated bonds overseas
is a major step in internationalising the INR. As of November 2016, there are 13 active
masala bonds listed in LSE, raising ≈ USD 2 billion. Out of these 13 bonds, 10 masala
bonds have been raised by multilateral organisations and remaining 3 by Indian corporates.
Both multilateral organisations and corporates have raised a billion dollars each (LSE,
2016). However, Masala bonds have had low uptake by foreign investors when compared
to Dimsum bonds (USD 50 billion outstanding). The uptake of Masala bonds is also low
as a percentage outstanding international debt securities issued by Indian national entities
(Table 8).
Table 8 Offshore Local currency (LCY) to Foreign currency (FCY) debt, by nationality
Country Offshore LC International Per cent
bonds (USD Debt securities
Billion) (USD Billion)
India 2 86 2.3
China 50 565 8.8
Source:BIS 2016, Author's calculations
13
Market capitalisation of Indian equities: USD 1.5 trillion, FPI-Equity:≈ USD 300 Billion
14
Refer to https://www.fpi.nsdl.co.in/Reports/ReportDetail.aspx?RepID=1 for the latest number;
last accessed on 23rd December, 2017
15
Refer to https://www.rbi.org.in/Scripts/NotificationUser.aspx?Id=10049, last accessed on
Jan 17th, 2017
17
Accessed at http://www.nipfp.org.in/publications/working-papers/1815/ Page 17Working paper No. 222
4.2.3 Invoicing and settlement of trade in INR
Currency invoicing in trade is an important first step for any national currency to become
an international currency. Local currency (LCY) invoicing of trade in the Rupee is less
than 2.5% of total trade as of the last release of currency invoicing data by the RBI16 in
2014. Most of the trade invoicing in India goes through USD and EUR.
Table 9 Invoicing of exports
Currency 2008-09 2009-10 2010-11 2011-12 2012-13
Pounds Sterling 2.77 2.81 2.47 2.31 2.31
US Dollar 84.06 84.75 86.41 87.01 88.41
Japanese Yen 0.48 0.35 0.22 0.26 0.15
Euro 10.85 10.13 8.88 8.14 6.97
All other Currencies 1.84 1.96 2.02 2.28 2.16
Source:RBI
Table 10 Invoicing of imports
Currency 2008-09 2009-10 2010-11 2011-12 2012-13
Pounds Sterling 0.89 0.66 0.71 0.5 0.42
US Dollar 86.06 83.91 85.38 88.67 86.06
Japanese Yen 2.3 1.98 1.73 1.41 1.47
Euro 9.82 12.61 11.13 8.29 9.44
All other Currencies 0.93 0.84 1.05 1.13 2.61
Source:RBI
This structure of invoicing is a reflection of the transaction costs faced by external trade
partners and local traders in invoicing trade in local currency. Around 22% of all Chinese
trade is now settled using the RMB,17 which is down from a high of 26% prior to the
RMB’s devaluation.
16
Refer to https://rbi.org.in/Scripts/BS_PressReleaseDisplay.aspx?prid=31788, last accessed on
on Jan 17th, 2017
17
Refer to https://www.ft.com/content/e480fd92-bc6a-11e6-8b45-b8b81dd5d080, Last accessed on
23rd Dec, 2016
18
Accessed at http://www.nipfp.org.in/publications/working-papers/1815/ Page 18Working paper No. 222
Figure 9 Indirect evidence of Rupee invoicing
Source: EC survey on invoice currency, 2016
Goldberg and Tille (2008) and Ito and Chinn (2014) argue that hedging costs are a primary
driver after “size” of a country in explaining local currency use in invoicing. This assertion
is backed by recent survey evidence from European traders (Langedijk et al., 2016). The
survey finds that only a small number of firms invoice in currencies (Figure 9) outside
the “big four” and the levels of local currency invoicing of trade in RMB and INR are
similar for European firms. Moreover, hedging costs are the primary determinants of local
currency use after size of recepient country (See Figure 10).
19
Accessed at http://www.nipfp.org.in/publications/working-papers/1815/ Page 19Working paper No. 222
Figure 10 What are the factors driving utilisation of LCY in invoicing?
Source: EC survey on invoice currency, 2016
The Indian government has promoted bilateral invoicing and settlement in local currencies
since 201218 in order to facilitate deeper current account linkages between trading partners.
The key features of this proposed facility were as follows:
• To provide the facility to settle payments in home currency, on a bilateral basis,
for current account transactions settlement between India and the trading partner
countries;
• To promote the use of participants’ currencies in current account transactions be-
tween their respective countries;
• To promote co-operation among the participants and closer relations among the
banking systems in the two countries, and thereby, contribute to the expansion of
trade and economic activity between the two countries;
• The exporters / sellers of each country shall denominate the export contracts and
invoices in their home currency thereby eliminating exchange-risk and resultantly,
may discover competitive pricing.
18
MoF note F.No.20/15/2012-BO.II, RBI Master Circular No. 14/2012-13, Refer to http:
//financialservices.gov.in/banking/circulars/2012/INR%20Local%20Currency%20Settlement%
20Mechanism.pdf, last accessed on on Jan 17th, 2017
20
Accessed at http://www.nipfp.org.in/publications/working-papers/1815/ Page 20Working paper No. 222
Figure 11 Top 20 settlement currencies
Source: SWIFT (2016)
In spite of this facility being proposed in 2012, it has not been notified by the RBI. As of
the writing of this paper, only Bhutan and Nepal have access to direct invoicing and set-
tlement of their trade in Rupees. For all other countries, as per the last notification issued by
the RBI,19 trade from and to India may be invoiced in “freely convertible currencies” or
Rupees. Amongst the BRICS currencies, only the South African Rand (ZAR) is considered
a freely convertible currency by the RBI. This limits the invoicing and settlement possibil-
ities of trade partners who do not have freely convertible currencies. Bilateral trade deals
provide a work-around and allow for limited local currency settlement. There are active
bilateral arrangements with Iran20 and Russia. President Putin and Prime Minister Modi
announced a push towards bilateral settlements in the Ruble and Rupee during President
Putin’s visit in December 2014. After initial excitement surrounding this arrangement
limited bilateral banking presence, small volume of trade between both countries, limita-
tions in availability of hedging instruments and continued depreciation of the INR/RUB
currency pair against the Dollar21 have effectively put a stop to bilateral settlement.22
According to (non-publically available data) SWIFT,23 in Apr 2016 80% of trade to India
19
Refer to Notification FEMA 14(R)/2016-RB, https://goo.gl/WAjL9G, Last accessed on 17th January
2017
20
This is an artefact of membership in the Asian Clearing Union (ACU) and is also related to the
economic sanctions Iran faced until 2016. As of 2016, after sanctions on Iran have been lifted, the future of
bilateral settlement in Rupees is uncertain. Indian firms have accrued large payment obligations to Iranian
firms, prompting Iran to demand settlement of these debts in Euros instead of Rupees. Source:https:
//goo.gl/VtmmXU, Accessed on January 17, 2017
21
Refer to https://goo.gl/ZkAfCJ, Last accessed on January 17th, 2017
22
Given evolving global macroeconomic conditions and expectations of Dollar appreciation, India’s foreign
trade policy for 2015-2020 does not mention any explicit incentive for LCY invoicing and settlement. MoF
note F.No.20/15/2012-BO.II was proposed at a time when the Rupee was relatively stronger compared to
the current macroeconomic situation. Refer to http://dgft.gov.in/exim/2000/ftp2015-20E.pdf
23
Refer to https://goo.gl/bazUrF, Last accessed on Dec 23, 2016
21
Accessed at http://www.nipfp.org.in/publications/working-papers/1815/ Page 21Working paper No. 222
was settled in USD. This followed by 7.2% in INR, 6.3% in EUR with the remaining 6.5%
split over all other currencies. This percentage share indicates approximately USD 50-70
Billion of trade settled in Rupees. However, the INR does not make the top 20 interna-
tional settlement currency list (See Figure 11) indicating that there is a great potential in
improving settlement of trade using the INR.
The INR is more actively used by private actors than the official sector. The bulk of
INR’s international utilisation comes from the usage of INR in currency substitution and
investment activity by private actors. Table 11 summarises INR’s role as international
currency across both official and private sectors and we can see that it has a negligible role
as an international currency.
Table 11 Roles of INR as an international currency
Function of money Governments Private actors
Store of value International Reserves Currency substitution
Negligible and investment FPI
framework
Medium of exchange Vehicle currency for Invoicing trade and
FX intervention None financial transactions
Negligible
Unit of account Anchor for local cur- Denominating trade
rency pegging None and financial transac-
tions Negligible
Figure 12 shows the roles of the RMB as an international currency. China’s policy push
to internationalise the RMB has been relatively successful and utilisation of the RMB in
global transactions is similar in magnitude to the Swiss Franc (CHF). Given that India and
China are in the same geographical vicinity, the rise of the RMB increases local competition
for regionalising the INR and makes it difficult to use regional agreements as a pathway
for internationalisation.
22
Accessed at http://www.nipfp.org.in/publications/working-papers/1815/ Page 22Working paper No. 222
Figure 12 Role of RMB as an international currency
Source: Ito (2016)
5 Looking ahead
“Internationalization of Rupee will facilitate greater degree of integration of Indian economy with rest of
the world in terms of foreign trade and international capital flows. Key benefits of internationalization
of Rupee include savings on foreign exchange transactions for Indian residents, reduced foreign exchange
exposure for Indian corporate, reduction in dependence on foreign exchange reserves for balance of payment
stability etc. One of the important drivers for internationalization of a currency is the country's share in global
merchandise and commercial services trade. India's percentage share in the global trade is still on the lower
side and it limits the pricing ability of domestic businesses in Indian Rupee. Moreover, the share of Indian
Rupee in the Global foreign exchange market turnover at present is also very low. Internationalization of
Indian currency would also require full capital account convertibility. As a policy, we have followed a gradual
and cautious approach in opening up the capital account. The capital account is being progressively liberalized
in accordance with the evolving macro-economic conditions and requirements of the Indian industries,
individuals and financial sectors.”
Written reply by Jayant Sinha, Minister of State in the Ministry of Finance, Lok Sabha, May
6th, 2016
Governor Raghuram Rajan while addressing reporters regarding the inclusion of the RMB
as a SDR currency stated that there would be no “big bang” measures to internationalise
the INR. It is more likely that Indian policymakers will choose a gradual move towards
internationalisation in the medium term. As of writing this paper India only satisfies the
size of GDP and political stability pre-conditions for currency internationalisation.
Restrictions on currency convertibility, both on the current and capital account hamper
growth of INR as a global currency. The framework for exchange controls in India comes
23
Accessed at http://www.nipfp.org.in/publications/working-papers/1815/ Page 23Working paper No. 222
from the Foreign Exchange Management Act (FEMA), which was passed in December
1999 and enacted in 2000. FEMA categorises transactions into current account and capital
account transactions and has specific rules and restrictions for across classes of individuals
and investors; based on residence, size of transaction, instruments used, tenor of instrument
and vehicle currency. For the purposes of India’s ascension to the WTO, the Rupee is a
fully convertible currency on the current account. However, as we described in the previous
section, simple transactions like realization of payments for exports and imports cannot
be in Rupees unless its specifically approved. Current account transactions exceeding $
250,000 for individuals24 require RBI approval. Rupee accounts cannot be held abroad25
and therefore overseas cash settlement in Rupee is not currently possible. Table 14 lists
out limits for “general permission” or “unrestricted” current account transactions. This is
ignoring the approval route transactions which need prior Government/RBI approval
and prohibited transactions which are not allowed.26 The documentary requirements
along with delays in approvals disincentivise both residents and non-residents from
using the Rupee for current account transactions.
As far as the capital account is concerned there is a large framework of controls split by
residency, instrument, transaction size and investor category. The power to regulate capital
account transactions currently vests with the RBI. This power has been conferred on it by
Section 6(3)(b) of FEMA. A general overview of the framework is as follows (Patnaik and
Shah, 2012; Sengupta, 2016):
Outward flows by firms : Outbound FDI by a firm is capped at a multiple of its
net worth
Foreign Banks : RBI restricts the growth of foreign banks by permitting all foreign
banks, put together, to open 20 branches a year
Foreign borrowing by firms : Maturity of loan, amount, interest rate, end-use and
the sector to which the debtor firm belongs, are prescribed. The aggregate borrowing
by all firms in a year is subject to a ceiling.
Debt investment by foreign portfolio investors : The aggregate investment by
all foreign investors is subject to one ceiling for government bonds, and another for
corporate bonds
Equity investments by foreign portfolio investors : Only registered “foreign
portfolio investors” are permitted to buy shares in India. Their investments are
subject to sectoral and firm level ceilings
FDI : Foreign ownership in certain sectors (e.g. telecom, insurance, banking) is
capped at various levels
24
Refer to https://rbi.org.in/Scripts/NotificationUser.aspx?Id=10192&Mode=0
25
Rupee Drawing arrangements (RDA) exist with Gulf countries, Hong Kong, Singapore, Malaysia and
other FATF compliant countries. These accounts can be used for channeling cross-border inward remittances
into India primarily on private account upto Rs. 1,500,000 per transaction. These accounts cannot be used
for trade settlement, even though in theory they may be utilised to do so. Refer to https://www.rbi.org.
in/Scripts/BS_ViewMasDirections.aspx?id=10205
26
Refer ro https://goo.gl/Lf5uSu for full list of prior-approval based (Schedule II) and prohibited
(Schedule I) transactions
24
Accessed at http://www.nipfp.org.in/publications/working-papers/1815/ Page 24Working paper No. 222
The FEMA reform process in terms of both current and capital account transactions
has tended to drift towards greater openness. Current account outflow restrictions on
individuals have been eased in 4 incremental steps27 between 2004-2015 with the limits being
increased from $ 25,000 to $ 250,000 over the 11 year period.28 In terms of foreign portfolio
investment, India moved to a unified portfolio investment (FPI) framework for institutional
investors, non resident individuals and venture capital funds in 2014.29 Recent
developments in the FPI framework for investment in Rupee denominated bonds and the
external commercial borrowing (ECB) framework for foreign borrowing by firms gives us
some insight about the current state of the capital account reform process.
When we evaluate the evolution of the foreign investment limits in Rupee denominanted
debt, we find that the limit enhancement30 has been non-linear. There was a 10 times
enhancement in combined limit for investment in Rupee denominated bonds between 2008-
2014 (Table 12) over 9 incremental liberalisations. This process was ad-hoc and was usually
driven by indirect exchange rate management concerns given that most liberalisations took
place around months of heavy exchange rate stress and increase in interest rates (Pandey
et al., 2016).
Table 12 Foreign investment limits in Rupee denominated debt (USD Billion)
Date Government Securities Corporate Bonds Total
Jun 08 5 3 8
Oct 08 5 6 11
Feb 09 5 15 20
Nov 10 10 20 30
Mar 11 10 40 50
Aug 11 10 40 50
Nov 11 15 45 60
Jun 12 20 45 65
Apr 13 25 51 76
Jun 14 30 51 81
The introduction of the FPI31 framework marked a structural change in regulation of in-
ward portfolio flows. This allowed for rationalisation of documentary requirements, merg-
ing of investor categories, clarifications on tax treatment and a reduction in processing time
for foreign investor registration.32 This was followed a year later by announcement of a
medium term framework (MTF)33 for investment in onshore Rupee denominated govern-
27
These limits were partially reversed during the taper tantrum
28
Refer to https://rbi.org.in/Scripts/NotificationUser.aspx?Id=10192&Mode=00
29
Refer to http://www.sebi.gov.in/cms/sebi_data/attachdocs/1467282054952.pdf
30
Refer to https://goo.gl/rnx8R3 for a history of limits till 2012. Refer to https://goo.gl/lzlVuf for
a specific study on foreign investment in Rupee denominated government securities
31
Refer to http://www.sebi.gov.in/cms/sebi_data/attachdocs/1389083605384.pdf, last accessed on
on Jan 17th, 2017
32
Refer to https://goo.gl/tnmWQY, Last accessed on Jan 17, 2017
33
Refer to https://www.rbi.org.in/scripts/NotificationUser.aspx?Id=10059&Mode=0, Last ac-
cessed on 17th Jan, 2017
25
Accessed at http://www.nipfp.org.in/publications/working-papers/1815/ Page 25Working paper No. 222
ment securities. The key announcement was that limits for FPI investment in the Central
Government securities34 will be increased in phases to reach 5 per cent of the outstanding
stock by March 2018 along with limit enhancements announced every March and Septem-
ber. This announcement along with the introduction of the FPI framework was made
to provide foreign investors a more predictable investment regime in Rupee denominated
assets. This marks the first instance of the RBI committing to a glide-path or a medium
term plan for capital account liberalisation similar to PBoC’s announcements regarding the
Renminbi. The ECB framework also saw large scale changes in 2015 with the introduction
of offshore Rupee trade credit35 and offshore Rupee denominated bonds36 in September.
These changes are an integral part of internationalising the Rupee and allow for deepening
of Rupee liquidity in offshore centres. This was followed by a rationalistion of the ECB
framework in November 201537 with the introduction of a unified framework for Rupee de-
nominated debt for Indian firms encompassing both onshore and offshore issuances, across
a range of instruments including trade credit, loans and bonds. Around one-fifth of Indian
corporate financing needs are met by foreign currency borrowing. Almost all trade credit
is denominated in foreign currency. Permitting international banks and capital markets
to raise Rupee debt marks a small but important step in solving the problem of “original
sin” faced by firms and the government (Hausmann and Panizza, 2003).
In this context, it is important to highlight the role of hedging markets. The presence of
hedging markets allows for internationalistion of a currency as both a vehicle for invoicing
trade as well as financial portfolio diversification. The RMB losing market share as an
invoicing currency after its devaluation in August 2015, reflects the realities of currency
internationalisation without provision of an adequate risk management infrastructure.
In India’s case, exchange traded currency derivatives were introduced in 2008 but foreigners
were not allowed to participate on exchanges till June 2014. Their participation is limited by
detailed documentation requirements to show a “demonstratable” exposure along with
margin requirements and position limits on exchanges. This problem is accentuated by
restrictions on types of products, lack of overlap between Indian trading hours and global
trading times and regulatory risk. There are similar restictions in OTC markets as well
and this pushes market participants to access offshore NDF markets.38
The existence of such large NDF markets for the INR should be of concern for domestic
policymakers. IGIDR Finance Research Group (2016) estimates that based on the trade
volumes in these markets, Indian financial firms are potentially losing out on revenues
worth USD 500 billion annually. Additionally, segmentation of foreign exchange markets
makes it difficult for the central bank and market regulators to effectively manage the
34
Additionally, a separate limit for investment by all FPIs in the State Development Loans (SDLs) was
also announced, to be increased in phases to reach 2 per cent of the outstanding stock by March 2018.
35
Refer to https://www.rbi.org.in/Scripts/NotificationUser.aspx?Id=10023&Mode=0, Last ac-
cessed on 17th Jan, 2017
36
Refer to https://www.rbi.org.in/Scripts/NotificationUser.aspx?Id=10049&Mode=0, Last ac-
cessed on 17th Jan, 2017
37
Track III in the revised ECB framework, Refer to https://www.rbi.org.in/Scripts/
NotificationUser.aspx?Id=10153&Mode=0, Last accessed on Jan 17th, 2017
38
Refer to Standing Council on International Competitiveness of the Indian Financial System (2015) for
a detailed discussion
26
Accessed at http://www.nipfp.org.in/publications/working-papers/1815/ Page 26Working paper No. 222
exchange rate stress. During the “taper tantrum” episode of 2013, market participants
primarily transacted in offshore NDF markets for their risk management needs, given the
restrictions in onshore markets (Tayal, 2013). Divergence of rates in offshore NDF markets
and the onshore currency markets can be frequently observed in the Indian case (Hutchison
et al., 2012). This may have negative spillover effects on domestic rates and price discovery
if onshore liquidity becomes tight, as was the case during May-September 2013.
Dealing with offshore NDF markets will have implications on the development of onshore
INR hedging markets. India can learn significantly from the experience of the China and
Russia - Two BRICS countries which have charted divergent paths towards internationali-
sation of their currencies. The Ruble was made fully convertible in mid-2006. Subsequently,
the offshore NDF markets for Ruble shifted to onshore currency markets. The Ruble NDF
has the smallest share out of the BRICS currencies in the global NDF market. China on
the other hand, chose a gradual approach using partnerships with global financial centres.
Chinese authorities impose strict onshore capital controls but have permitted a pool of
offshore Renminbi instruments that can be freely traded and delivered. Both these ap-
proaches have been useful in gaining domestic currency trading shares but the continued
effectiveness of these approaches rests on unconstrained arbitrage between onshore and
offshore rates (McCauley and Shu, 2016).39
Increasing access to onshore hedging markets for foreigners and allowing access to offshore
markets to residents is an easy first step towards improving INR currency risk management.
Standing Council on International Competitiveness of the Indian Financial System (2015)
and (IGIDR Finance Research Group, 2016) list out short term policy responses that can
aid the competitiveness of onshore hedging markets like increasing position limits, reducing
documentary burden and allowing domestic financial firms to participate in offshore NDF
markets. Improvement in INR risk management is likely to increase the utilisation of the
INR as a trade currency. The government can continue its policy efforts in promoting use
of the INR as trade invoicing currency, especially for South-South trade and subsequently
look at a gradual extension of offshore INR settlement (deposits) and trade credit. The
RBI however, is taking a calibrated approach40 to Rupee internationalisation and does
not mention any changes in local currency invoicing and settlement for 2016-17; its policy
focus is on slowly improving hedging markets and increasing use of INR as a currency for
raising debt from foreign counterparties.
RBI’s reluctance to allow for LCY invoicing and settlement is based on practical consid-
erations. First, India’s trade exposure to non-convertible currency based trade partners is
less than 10% excluding China and oil producing countries. Second, there is a lack of risk
management facilities in non/partially convertible currencies and there are associated risks
in dealing with banks from these countries in “making” bilateral currency markets.41 This
is unlikely to change soon given the reversals in capital account liberalisation in the emerg-
39
Sanctions and political uncertainty in Russia revived the Ruble NDF market whereas imposition of
capital controls following the exchange rate depreciation of August 2015 in China quadrupled the volume
of Renminbi NDF trading.
40
Refer to https://www.rbi.org.in/scripts/AnnualReportPublications.aspx?Id=1178, Last ac-
cessed on Jan 17th, 2017
41
Refer to https://goo.gl/EHl3Iw, Last accessed on January 17th, 2017
27
Accessed at http://www.nipfp.org.in/publications/working-papers/1815/ Page 27You can also read