How Do Different Indicators of Household Food Security Compare? Empirical Evidence from Tigray - Daniel Maxwell, Jennifer Coates and Bapu Vaitla
←
→
Page content transcription
If your browser does not render page correctly, please read the page content below
August 2013

Strengthening the humanity and dignity of people in crisis through knowledge and practice

How Do Different Indicators of Household
Food Security Compare?
Empirical Evidence from Tigray
Daniel Maxwell, Jennifer Coates and Bapu Vaitla
©2013 Feinstein International Center. All Rights Reserved.

Fair use of this copyrighted material includes its use for non-commer-
cial educational purposes, such as teaching, scholarship, research,
criticism, commentary, and news reporting. Unless otherwise noted,
those who wish to reproduce text and image files from this publication
for such uses may do so without the Feinstein International Center’s
express permission. However, all commercial use of this material
and/or reproduction that alters its meaning or intent, without the ex-
press permission of the Feinstein International Center, is prohibited.

Feinstein International Center
Tufts University
114 Curtis Street
Somerville, MA 02144
USA
tel: +1 617.627.3423
fax: +1 617.627.3428
fic.tufts.edu
Suggested Citation
Maxwell, Daniel, Jennifer Coates, and Bapu Vaitla (2013). How Do Different Indicators of
Household Food Security Compare? Empirical Evidence from Tigray. Feinstein International
Center, Tufts University: Medford, USA.

Acknowledgements
This paper is based on data collected by the “Livelihoods Change over Time” (LCOT) study
in two districts of Tigray State in northern Ethiopia. We would like to thank Dr. Girmay
Tesfay and Dr. Nigussie Abadi who led the field team that collected the data for the LCOT
study, and their colleagues from the College of Dryland Agriculture and Natural Resources at
Mekelle University.
At the Feinstein International Center, we thank Peter Walker, Rosa Pendenza, Ann O’Brien,
Beth O’Leary, and Anita Robbins, for their support to the study. We are very grateful to
Joyce Maxwell for editing and formatting this lengthy report.
And of course we would like to thank the many people in Tsaeda Amba and Seharati Samra
woredas in Tigray who generously gave their time and knowledge in four rounds of survey
interviewing.
Funding for this research came from the Swedish International Development Agency
(SIDA). We gratefully acknowledge SIDA’s support throughout the research and publication
process.
All analysis is by the authors, who are responsible for any errors.

							                                                               The Authors
							                                                               August 2013

Cover Photo Credit
James P. Wirth, GroundWork
Table of Contents
I.   Introduction                                                                3
II. Measuring food security                                                      3
III. Empirical context and methodology                                           5
IV. Analytical results
     A.   How do these seven measures compare?                                   5
          1.   How well do the different measures correlate?                     5
          2.   What do the different measures tell us about changes in
               food insecurity across rounds?                                    7
          3.   What do the different indicators say about the distribution of
               food security outcomes within each round?                         8
               a.   Static classification                                        9
               b.   Dynamic correlation                                         10
          4.   How differently are households classified by each of the measures? 9
     B.   What dimensions of food insecurity do each of
          these measures capture?                                               12
     C.   How can measures be combined or used in complementary
          ways to yield a more multidimensional picture of
          a household’s food insecurity situation?                              15
          1.   Cross-classification                                             15
          2.   Comparing with other aggregate indicators                        16
          3.   An algorithmic approach                                          17
V.   Conclusions and discussion                                                 20
References                                                                      22
Annexes (found in a separate paper by the same name)
     Annex A: Food security questions
     Annex B: Bivariate correlations by round
     Annex C: Food insecurity by round and categorical indicator
     Annex D: Distributions of all variables, by round
     Annex E: Tables of all indicators, by round
     Annex F: Histograms of all indicators, by round
     Annex G: Cross-tabulations of food security measures
     Annex H: Correlations between all sub-questions
     Annex I: Average correlation coefficients of variables
     Annex J: Scatterplots
     Annex K: Integrated Phase Classification maps
I. Introduction compare seven different measures collected across all
rounds: (1) Coping Strategies Index (CSI); (2) Reduced
With recent food crises at both regional and global Coping Strategies Index (rCSI); (3) Household Food In-
levels, and renewed commitments from major donor security and Access Scale (HFIAS); (4) The Household
countries to address chronic hunger, food security is Hunger Scale (HHS); (5) Food Consumption Score
more prominent on the policy agenda today than it (FCS); (6) Household Dietary Diversity Scale (HDDS);
has been in the past. Food security hardly needs to be and (7) a self-assessed measure of food security (SAFS).2
defined again, and this paper follows others in using the
We assess inter-correlations among the seven indicators
UN Food and Agriculture Organization (FAO) defini-
and then analyze whether the different measures detect
tion.1 The renewed emphasis on addressing constraints
the same or different dimensions of the complex phe-
to food security has intensified the search for accurate,
nomenon of food insecurity. Finally, we use these results
rapid, and consistent indicators of food security. Barrett
to illustrate other means of capturing food insecurity,
(2010) notes that approaches to measurement follow the
including combinations of stand-alone indicators as
four major “pillars” of food security—availability, access,
well as the development of an operationally simple but
utilization, and risk (sometimes alternatively labeled
dimensionally rich food security tool. The answers to
stability or vulnerability) —which in turn tend to follow
the questions posed in this study have implications for
different strands of analysis. Measures of food access
(1) which measure, or which combinations of measures,
are important for many reasons but, practically speak-
is more appropriate for a given purpose and (2) the costs
ing, they are most urgently required for purposes of
of relying on single measures or indicators, in terms of
early warning, for assessment of current and prospective
potential misclassification of the food-insecure.
status of at-risk populations, and for monitoring and
evaluating specific programs and policies. More recently,
given innovations such as the Integrated Phase Clas-
sification (IPC) tool, they are important for establishing II. Measuring Food Security
the comparability of food security status in dissimilar
Given the multidimensional nature of food security,
contexts—a task that is critical for targeting resources on
practitioners and policy makers have long recognized the
any sort of rational or impartial basis.
need for a variety of means of measurement (Kennedy
Different measures of the access dimension of food 2002, FAO 2013). The “holy grail” of food security
insecurity are used interchangeably, without a good measurement would be a single measure that is valid
idea of which food-security dimensions are captured by and reliable, comparable over time and space, and which
which measures. The associated risk is that the number captures different elements of food security. In spite of
of food-insecure individuals is underestimated when the development of many different indicators in the past
single measures are applied that are incongruent with a decade, no single one meets these criteria (Coates and
more holistic food-security definition (Coates, 2013). Maxwell 2012). For many years, age-adjusted per-capita
This paper seeks to address this important gap in the caloric intake was considered the “gold standard” for
literature through a comparative empirical analysis of access to food at the household level, and anthropomet-
common food-security indicators. Specifically, the paper ric measures of nutritional status were the gold stan-
addresses the following questions: dard at the individual level (Hoddinott and Yohannes
2002, Weismann et al. 2006; Coates et al. 2007). But
1) How do the seven measures listed below com-
nutritional status is determined by many factors, food
pare—do they tell the same “story” about house-
security being only one (Young and Jaspars 2006, 2009).
hold food insecurity and classify households
And while per-capita caloric intake reflects current
similarly?
consumption—the question of quantity—it does not
2) Which elements of food insecurity does each of
address many other elements of the complicated notion
these measures capture?
of “food security,” such as quality (dietary diversity and
3) How can metrics be combined or used in comple-
micronutrient sufficiency), vulnerability and risks, and
mentary ways to yield a more multidimensional
fluctu¬ations and trends in consumption over time.
picture of a household’s food insecurity situation?
Caloric intake can also be very time consuming and
The paper draws on four rounds of data from a panel expensive to measure and so is rarely used as a measure
survey of 300 rural households in northern Ethiopia to of food security in any context other than basic research.
1
“Food security exists when all people, at all times, have Progress on developing indicators has been mixed. The
physical and economic access to sufficient, safe and nutri- FAO measure for prevalence of undernourishment—
tious food that meets their dietary needs and food prefer- most prominently used to track progress against
ences for an active and healthy life” (World Food Summit, 2
The actual wording of the questions used in the household
1996).
survey to derive these indicators is reprinted in Annex A.
How Do Different Indicators of Household Food Security Compare? 3Millennium Development Goals—has recently been • Spending on food. Given the propensity of people
completely revamped, but it is not intended for detect- closer to the edge of poverty to spend a greater and
ing short-term changes or acute emergencies (Cafiero greater proportion of their income on food, esti-
2012). Significant progress has been made on utilizing mating the proportion of expenditure on food has
Household Consumption and Expenditure Surveys become an important measure (Smith et al. 2006).
(HCES) for tracking food insecurity (Smith et al. 2006, • Consumption behaviors. These measures capture
Fiedler 2013), but this kind of measure is not typically food security indirectly, by measuring behaviors
used for rapid field assessments in dynamic contexts as related to food consumption. Perhaps the best
data are only updated every few years. Looking specifi- known example is the Coping Strategies Index or
cally at rapid field measures, several recent studies have CSI (Maxwell and Caldwell 2008), which counts
confirmed a significant correlation between the Food the frequency and severity of behaviors in which
Consumption Score (FCS)—a food frequency measure people engage when they do not have enough food
developed by the World Food Programme (WFP)—and or enough money to buy food. Recent work on
caloric consumption, but degrees of correlation across the CSI has identified a more “universal” sub-set
contexts vary, and it often underestimates the prevalence of coping behaviors found to be relevant in 14 dif-
of food insecurity (IFPRI 2008, Coates et al. 2007). ferent context-specific CSI instruments (Maxwell,
One recent field validation test conducted in Latin Caldwell, and Langworthy 2008). This “reduced
America found that the proposed “universal” thresholds CSI” (rCSI) is probably more widely used now
for the FCS were badly misclassifying food insecurity than the original form, but tends to measure only
(defined in that study as caloric adequacy)—but also the less-severe coping behaviors. Versions of the
found that conducting field validation tests everywhere CSI have been widely adopted by WFP/VAM
would be prohibitively expensive, putting into question (World Food Programme/Vulnerability Analysis
whether thresholds could actually be considered univer- Mapping unit), FAO/FSNAU (UN Food and
sal, even while validating the FCS measure in terms of Agriculture Organization/Food Security and Nu-
correlation with other indicators (WFP 2010). A series trition Analysis Unit for Somalia), and the Global
of articles outlined the development of a Coping Strate- IPC (Integrated Phase Classification) team, among
gies Index that correlates with both caloric intake and others. The Household Hunger Scale (HHS—see
other measures of food access (Maxwell 1996; Maxwell below) is also essentially a behavioral measure. It
et al. 1999; Maxwell, Caldwell, and Langworthy 2008). tends to capture more-severe behaviors.
A different strand of research outlines the development • Experiential measures. Some indicators combine
of the Household Food Insecurity Access Scale (Coates, behavioral with psychological measures. The
Swindale, and Bilinsky 2006; Webb et al. 2006). Re- Latin America and Caribbean Food Security Scale
cently, there has also been a rise in self-assessments of (ELCSA) and the Household Food Insecurity
food security status, as noted by Headey (2011, 2013). Access Scale are the best known and most widely
used of these measures in international contexts
Rapid, accurate, cross-contextual indicators of food
(ELCSA Scientific Committee 2012; Swindale
security have been developed over the past decade or so.
and Bilinsky 2006; Coates, Swindale, and Bilinsky
These fall into several recognizable categories:
2006). The HFIAS was designed to capture house-
• Dietary diversity and food frequency. This type hold behaviors signifying insufficient quality and
of metric captures the number of different kinds quantity, as well as anxiety over insecure access.
of food or food groups that people eat and the The Household Hunger Score (HHS) was derived
frequency with which they eat them, and some- from the HFIAS as a culturally-invariant subset of
times involves weighting these groups. The result questions, and includes three specific questions,
is a score that represents the diversity of intake, but none of which are psychological in nature (Dei-
not necessarily the quantity, though such scores tchler et al. 2010). USAID, FAO, and others have
have been shown to be significantly correlated with adopted and promoted the HFIAS and HHS.
caloric adequacy measures (IFPRI 2006, Coates • Self-assessment measures. Though highly subjec-
et al. 2007). The Food Consumption Score (FCS) tive in nature and perhaps too easy to manipulate
is a specific type of dietary diversity index used in programmatic contexts, self-assessment mea-
primarily by the World Food Programme (WFP sures have been introduced in recent years. These
2009). The Household Dietary Diversity Score include self-assessments of current food security
(HDDS)—similar to the FCS, but with a 24-hour status in a recent recall period and the change in
recall period without frequency information or livelihood status over a longer period of time. Self-
weighted categorical cut-offs—has been widely assessed food security was collected through the
promoted by the UN Food and Agriculture Orga- Gallup poll to examine the food security effects of
nization and USAID (FANTA 2006, FAO 2010). the global food price crisis (Headey 2011, 2013).
4 Feinstein International CenterRecently, Headey and Ecker (2013) critique self- Each survey round not only gathers information on the
assessment measures in a review of food security situation prevailing at the time, but also asks retrospec-
metrics. In the present study, the self-assessed food tive questions about household decisions and experi-
security measure was constructed by asking house- ences over the six-month period prior to the survey (i.e.,
holds to characterize the state of food security as since the last survey round) and, in the case of the food
compared to a “normal” (not good, not bad) year security measures discussed earlier, over the one month
on a five-category scale.3 preceding the survey. All four rounds of the survey are
now complete.
There is strong evidence that all these measures are
capturing something about the multidimensional nature The survey sample was stratified to represent the liveli-
of food security. However, there have been few assess- hood- and food-security related variables of two wore-
ments of which dimensions of food security are captured das: Tsaeda Amba (Eastern Tigray) and Seharti Samre
by each measure and few direct empirical comparisons (Southern Tigray). In each woreda, 150 households
among them. The rest of this paper will compare these were selected, 75 from each of two kebeles (sub-district
measures directly to answer the research questions noted units). The sub-kebele (i.e., village- or kushet-level)
earlier. sampling units were obtained by systematic selection
with a random start. The probability of each sampling
unit being selected was proportional to the village’s size.
III. Empirical Context and Within the village, sampling of households was done by
random selection of transects.
Methodology
The data for this paper come from the Livelihoods
Change Over Time (LCOT) four-round panel sur- IV. Analytical Results
vey conducted in two districts (woredas) of northern
Ethiopia between August 2011 and February 2013. A. How do these seven measures
The overall objective of the LCOT panel survey is to compare?
assess household resilience in the face of an annually
recurring shock: the “hunger season.” This time of year 1. How well do the different measures
is characterized by price inflation as the previous year’s
harvest stocks diminish and grain prices increase in local correlate?
markets. The higher prices during the hunger season are
To examine this question, the strength of the correla-
coupled with increased illness, especially malaria and
tion among indicators was examined using Spearman’s
acute respiratory infections, during the months im-
r, which is similar to Pearson’s r but is used to examine
mediately preceding the harvest. Rates of acute under-
non-parametric relationships. The HFIAS, HHS, CSI,
nutrition and morbidity increase, and households are
rCSI, and SAFS scales were adjusted so that a higher
often forced to sell key assets, especially livestock, to
score indicates greater food insecurity, whereas higher
meet basic needs. Families also engage in a wide range
HDDS and FCS scores indicate greater dietary diversity
of behaviors—some harmful or unsustainable—to cope
and food frequency and, thus, less food insecurity. Thus,
with hunger season difficulties4.
inverse correlations among some of these indicators
To capture within-year as well as across-year livelihood were expected. The Spearman’s r correlations among the
dynamics, we chose to collect panel data on our sample seven measures are generally quite strong, are associated
two times a year: at the height of the hunger season in the expected direction, and are all significant at the
in August and in the middle of the postharvest season pTable 1. Spearman’s rho correlations between food security measures, all rounds pooled
CSI rCSI HFIAS HHS FCS HDDS SAFS
CSI 1 0.95 0.85 0.44 -0.51 -0.56 0.45
rCSI 0.95 1 0.84 0.42 -0.48 -0.53 0.46
HFIAS 0.85 0.84 1 0.48 -0.57 -0.63 0.46
HHS 0.44 0.42 0.48 1 -0.34 -0.34 0.23
FCS -0.51 -0.48 -0.57 -0.34 1 0.92 -0.24
HDDS -0.56 -0.53 -0.63 -0.34 0.92 1 -0.29
SAFS 0.45 0.46 0.46 0.23 -0.24 -0.29 1
* All correlations significant at the pTable 3. Food insecure households as percentage of total, by round and
indicator
Round CSI RCSI HFIAS HHS FCS HDDS SAFS
1 48.0 38.9 81.8 6.0 24.5 46.2 45.7
2 31.0 26.1 52.9 3.4 16.8 43.2 35.9
3 29.1 25.7 51.7 5.2 17.9 36.3 26.4
4 26.8 21.9 49.7 2.9 11.7 34.6 29.8
Figure 1. Food insecure households as percentage of total, by round and indicator
2. What do the different measures tell from Table 2). In some of the analysis below, we convert
the classification systems into binary categories of “food
us about changes in food insecurity
secure” and “food insecure,” for simplicity of presenta-
across rounds? tion purposes. The final column in Table 2 presents
these binary classifications.5
Most of these measures can be used in a continuous
form (as a scale or index) or as a categorical indicator We now compare trends in food security across rounds,
(for estimating prevalence). Different assumptions and as shown by the different measures. Annex C shows
methods were used to derive cut-points for the creation more detailed results.
of each of these categorical indicators. These indicators
Table 3 and Figure 1 suggest that, as measured by any
also classify households into different numbers of cat-
of the indicators, food security improved across the
egories, and in some cases the qualitative labels attached
timeframe of the survey; the differences in prevalence
to these categories differ as well. This information is
between rounds are statistically significant across all
summarized in Table 2. (Note that HDDS does not
5
have established categorical cut-offs and is analyzed only Sensitivity analysis of the conclusions in the following
as a continuous measure; for this reason, it is excluded pages, using different binary classification systems, was also
performed. The results were substantively similar.
How Do Different Indicators of Household Food Security Compare? 7Table 4. Coefficient of variation of all measures, by round
ROUND CSI rCSI HFIAS HHS FCS HDDS SAFS
1 0.87 0.83 0.66 2.50 0.37 0.33 0.46
2 1.33 1.35 1.16 3.32 0.36 0.35 0.52
3 1.31 1.28 1.11 3.54 0.38 0.35 0.50
4 1.41 1.40 1.14 4.21 0.35 0.35 0.43
Pooled 1.20 1.18 0.99 3.23 0.37 0.35 0.49
Table 5. Percentage of households with highest possible food security score,
by indicator and round
ROUND CSI rCSI HFIAS HHS FCS HDDS SAFS
1 15.3 17.9 12.0 81.5 0.0 0.0 30.8
2 46.9 50.2 39.4 89.0 0.0 0.0 38.6
3 38.5 44.1 38.9 90.3 0.0 0.0 44.7
4 47.0 49.1 41.5 92.6 0.0 0.0 33.7
Pooled 36.7 40.1 32.7 88.2 0.0 0.0 37.4
measures and all rounds at the pThe distributions in Annex D suggest some Table 6. Under- or over-estimation of food insecurity
reasons for the observed data in Table 4:
of the row measure relative to the column measure
• CSI and rCSI. The relatively high CSI rCSI HFIAS HHS FCS SAFS
variance shown by the CSI and rCSI
CSI - +0.12 -0.49 +0.31 +0.04 -0.11
is largely due to the high number of
households reporting “0” values (mean- rCSI -0.12 - -0.61 +0.29 +0.12 -0.23
ing no coping behaviors reported), es- HFIAS +0.49 +0.61 - +0.74 +0.57 +0.38
pecially in the latter three rounds. Table HHS -0.31 -0.29 -0.74 - -0.17 -0.38
5 shows the percentage of households
reporting the best possible food security FCS -0.04 -0.12 -0.57 +0.17 - -0.22
state for each measure—which, in the SAFS +0.11 +0.23 -0.38 +0.38 +0.22 -
case of the CSI, is a zero value. In the
harvest season rounds, nearly half of The shape of the distribution largely explains these
households had a zero CSI score, quite an unusual measures’ low variance relative to the others.
distribution in a poor rural area: in comparable • SAFS. The comparatively low relative standard
studies, zero scores were rare (Maxwell et al. 1999; deviation for the self-assessment measure is largely
Maxwell, Caldwell, and Langworthy 2008).7 an artifact of the few discrete values available as
• HFIAS. The HFIAS shows a similar distribution responses (1–5 for SAFS).
to the CSI in the final three rounds, also due to a
large percentage of zero values. It is worth not- The strong correlations among the measures as well as
ing that if zero values are excluded, in the hunger the depiction of generally similar food security trends
seasons (especially Round 1) the HFIAS distribu- over time suggest that they are indeed all useful mea-
tions tend more towards normal than do the CSI surements of food security. They do also have significant
measures. (Note that the use of the term “normal” differences, however, reflected both in the correlation
refers to the shape of the distribution, and does coefficients and in the distributions. These differences
not imply “correct” or “true” inequality. Rather the may reflect different dimensions of food security, a topic
relative distributions display only differences in explored in more detail in Section B. First, however, we
the degree of inequality suggested by the various look at the implications of different approaches to the
measures). The distribution of HFIAS scores may classification of households’ food security status.
imply that the types of behaviors and attitudes
captured by the HFIAS would, in stressful but not
4. How differently are households
catastrophic times, be more normally distributed
than the coping strategies in the CSI. Another classified by each of the
explanation is that the algorithmic methodology measures?
used to determine the HFIAS categories leads to a
high estimate of food insecurity, a topic explored a. Static classification
later in this paper. Annex E presents tables of the different food security
• HHS. An extremely high percentage of households measures, converted into categorical measures by their
have zero HHS scores in all rounds. This largely severity cut-offs. Annex F provides histograms of every
explains the high variance seen in the sample. As categorical measure, as well as the HDDS continuous
noted earlier, HHS is concerned with relatively measure, by round. Annex G presents cross-tabulations
severe conditions—complete lack of food in the of each indicator (presented in categories) with each
household, going to sleep hungry, and going other indicators noted in the study. Note the extent to
an entire day without eating—which were rare which the cut-offs used to determine household food
throughout the time period in the population security status yield dramatically different prevalence
studied. estimates, even among indicators that are otherwise
• FCS and HDDS. The dietary diversity measures reasonably well correlated as continuous measures.
have a distribution much closer to normal than summarizes Annex F by presenting the extent (i.e., the
any of the others; in fact, the FCS in Round 1 and number of categories) by which the row food security
HDDS in Rounds 1 and 3 are the only measures measure over- or under-calculates food insecurity relative
that pass a formal Shapiro-Wilk test for normality. to the column measure8; note that this table represents
7 8
We are fairly certain that the issue did not stem from faulty The procedure for constructing this value is as follows.
data collection; after the high prevalence of zeros in the first First, for measures with unequal numbers of categories (see
round, enumerators in subsequent rounds were retrained Table 2), categories are combined following the classifica-
and asked to probe carefully and extensively when a house- tion implied by the measure with fewer categories. Then,
hold reported not a single manifestation of food insecurity. for each cell in which the row measure and column measure
How Do Different Indicators of Household Food Security Compare? 9data pooled across all rounds. For example, in Table 6 the highest estimate of food insecurity prevalence, fol-
we see that CSI under-calculates food insecurity relative lowed by SAFS, CSI, rCSI, FCS, and HHS (HDDS was
to HFIAS by about half a category (-0.49); in other not evaluated, as it lacks a “food insecure” cut-off ). As
words, for any given household we would expect to see discussed in greater detail below, this difference in the
a CSI food security score that indicates it is about half a degree to which a measure indicates food insecurity can
category less food insecure (i.e., more food secure) than help inform the choice of measure used, depending on
the corresponding HFIAS score. Similarly, HFIAS over- the timing (e.g., season and emergency onset) and pur-
calculates food insecurity relative to HHS by almost pose (e.g., development or relief ) of data collection and
three-quarters of a category (+0.74). While the relevance intervention. At the same time, this presents a puzzle for
of, for example a score that shows three quarters of a analysis that relies on more than one indicator: Which
category difference is not operationally clear from this one is “correct?”
depiction, it does aid in the comparison of the relative
classifications of food security status among indicators. b. Dynamic correlation
Several conclusions emerge from this table: We can also look at “dynamic correlation”: whether dif-
ferent food measures portrayed movement of households
• CSI and rCSI. As would be expected, CSI and
in and out of food insecurity similarly across the four
rCSI classify households similarly; the CSI tends to
rounds. Again, for purposes of simplicity, we reclassified
portray a slightly more food insecure situation rela-
households using the binary categories “food secure” and
tive to the rCSI (+0.12). The CSI and rCSI both
“food insecure”; see Table 2 for the original categories
tend to show greater food insecurity as compared
and how these were converted into binary categories.
to the HHS and FCS, but less than the HFIAS,
and slightly less than the SAFS measure. Tables 7 and 8 show two ways of looking at this issue.
• HFIAS and HHS. HFIAS will give the highest Table 7 shows “net movement into food security”: as
prevalence estimates of food insecurity, as might be identified by each measure, the number of households
expected as it includes less-severe manifestations, who moved from food insecurity between Round 1 and
including psychological anxiety and food con- Round 4 minus the number who were originally food
sumption preferences (although this may also be secure but fell into food insecurity, taken as a percentage
due to the algorithm for classification—a topic we of the original number of food insecure households. For
discuss below). In contrast, the HHS depicts the example, CSI identifies 144 households as food insecure;
lowest prevalence of food insecurity. Households of these, 87, or 60.4 percent (Column A), were food
are only identified as food insecure if their situa- secure in Round 4: they moved into food security.9 Con-
tion is quite severe, as the measure only counts the versely, 26 of the 156 households who were originally
most extreme behaviors. food secure, or 16.7 percent (Column B), fell into food
• FCS. After HHS, FCS is the least likely to identify insecurity by Round 4. Thus the net number of house-
a household as food insecure. holds who moved into food security is 61: 87 - 26 = 61;
• Self-assessment. SAFS, the food security self- that number represents 42.4 percent of the original 144
assessment measure, was more likely to classify food-insecure households (Column C).
households as food secure than all measures but
the HFIAS. Table 7 shows dynamic differences as well between the
Overall, we see that, while broadly correlated, differ- measures. There are significant differences between in
ent measures classify food-insecure households quite the indicators in Column A’s gross movement into food
differently. A static classification of food insecurity by security: FCS has the lowest rate (i.e., is most likely to
the different measures implies a hierarchy with respect depict persistent food insecurity), followed by HFIAS.
to the estimation of food insecurity. HFIAS provides CSI, rCSI, SAFS, and HHS show relatively high move-
agree on food security status—that is, for matched pairs— ment into food security. The converse—the measure-
the observations are dropped. For each cell in which the ment of falling into food insecurity (Column B)—
row measure over-calculates the degree of food insecurity follows a different pattern. According to HFIAS, SAFS,
(again, relative to the other measure) by one category, the and CSI, between one-sixth and nearly one-fourth of
number of such observations are simply summed (i.e., given food secure households became food insecure (although
a weight of 1 and summed); when the over-calculation is the number of households originally identified as food
two categories, the number of observations are multiplied
insecure was much greater for the latter two indicators).
by 2 and summed; and so on. The same is done for under-
calculation, except that the number of such observations
Few households became food insecure according to
is multiplied by -1 and summed, by -2 and summed, etc. HHS and FCS. Net totals (Column C) roughly mir-
The totals for each group are then summed and divided 9
Note that Round 1 was completed during a hunger season
by the total number of observations in question (i.e., the
and Round 4 a harvest season, and so some of the move-
surveys in which food security scores were present for both
ment into food security is likely to be temporary.
measures).
10 Feinstein International CenterTable 7. Net movement into food security from Round 1 to Round 4, by indicator
C. Net as percentage
of those originally food
A. Gross movement into B. Gross movement into insecure and became food
food security food insecurity secure
CSI 60.4% (87/144) 16.7% (26/156) 42.4% (61/144)
rCSI 60.7% (71/117) 12.0% (22/184) 41.9% (49/117)
HFIAS 38.6% (102/264) 23.7% (9/38) 35.2% (93/264)
HHS 100.0% (18/18) 2.8% (8/284) 55.6% (10/18)
FCS 21.6% (16/74) 1.8% (4/227) 16.2% (12/74)
SAFS 55.1% (76/138) 17.7% (29/164) 34.1% (47/138)
Table 8. Dynamic correlation between indicators of movement into food security between
Rounds 1 and 4
CSI rCSI HFIAS HHS FCS SAFS Corroboration of row mea-
sure by all other measures
CSI - 65.5% 51.7% 4.6% 5.7% 43.7% 34.3%
rCSI 80.3% - 52.1% 3.9% 7.0% 43.7% 38.3%
HFIAS 44.1% 36.3% - 1.1% 2.0% 36.3% 24.3%
HHS 22.2% 27.8% 16.7% - 22.2% 27.8% 23.3%
FCS 31.3% 37.5% 12.5% 11.5% - 25.0% 26.3%
SAFS 50.0% 40.8% 48.7% 1.8% 5.3% - 30.3%
Corroboration of all other 52.7% 45.5% 46.3% 6.0% 5.9% 39.1%
measures by
column measure
rored the gross movement into food security of Column Table 8 also provides convenient summary measures
A, with the exception of SAFS, for which the amount in the final column and row. The totals in the final
of households falling into food insecurity reduced net column could be seen as a kind of “movement into food
movement considerably. security” implied by a measure: the extent to which all
other measures corroborate the claim of movement into
Table 8 presents a more comparative picture of the rela-
food security by a given measure. For example, when
tive dynamics implied by each indicator. Of the total
rCSI claims that a household moved into food security,
households that the row measure reported as having
in a total of 38.3 percent of possible instances the claim
moved into food security between Rounds 1 and 4, each
is corroborated, with most of the disagreements coming
cell represents the percentage of households that the
from HHS and FCS. In contrast, when HHS claims
column measure corroborates as having moved into food
movement into food security, the other measures only
security. For example, of all the households that the CSI
corroborate this claim 23.3 percent of the time. Note
measure reports as having moved into food security (first
that CSI and rCSI are most often corroborated by the
row), the SAFS measure corroborates the movement
other measures.
into food security rate of 43.7 percent of them (second
to last column). Similarly, of all the households that The totals in the final row, meanwhile, capture the “total
HFIAS reports as having moved into food security, FCS dynamic correlation” of a given column measure to the
corroborates just 2.0 percent of these. Thus the matrix full set of other row measures; it is the percentage of
provides a rough “dynamic correlation matrix” between times that this given column measure corroborates the
Rounds 1 and 4 of the binary outcome of food security/ instances of households’ movement into food security
insecurity. identified by all the row measures combined. Thus we
see that CSI, rCSI, and HFIAS tend to corroborate the
How Do Different Indicators of Household Food Security Compare? 11full set of measures more than the others—corroborating study is listed in Table 9. The last column of the table
52.7 percent, 45.5 percent, and 46.3 percent, respec- suggests the dimension each measure or constituent
tively, of the instances of movement into food security primarily describes, based on the conceptual categoriza-
identified by the other measures. HHS and FCS are at tion above.
the other extreme, corroborating just 6.0 percent and
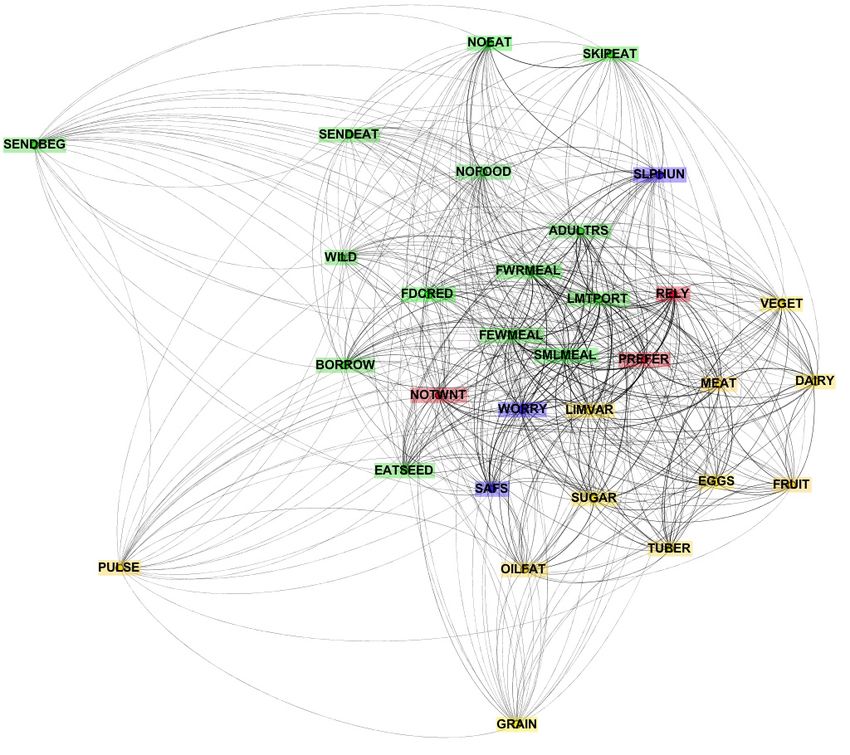
We then ran correlations between all of the measures
5.9 percent of the claims of movement into food secu-
and sub-questions (Annex H). To understand whether
rity by other measures. It is worth noting that the choice
these measures and sub-questions are grouped into
of cut-offs used in the development of the categorical
dimensions, we used the correlation coefficients to
indicator for each of these measures was ultimately
represent distance on a network diagram. Network
subjective. Some of the differences observed between
diagrams allow correlation matrices to be represented in
among indicators would be increased or decreased by
a visual, intuitive manner. In Figure 2, each node is one
altering the cut-offs. While some sensitivity analysis was
of the measures/sub-questions, and the edges (distances)
done on the cross-corroboration matrices by altering
between them represent the correlation coefficients; the
indicator cut-offs, it would be useful to do further work
higher the correlation coefficient, the shorter the edge.
along these lines, including identifying which cut-points
Thus groups of variables that are highly correlated ap-
on different indicators ultimately yield similar static and
pear as clusters in the diagram, while weakly correlated
dynamic classifications.
variables are at the borders of the network. Each dimen-
sion hypothesized in Table 9 is coded by color in Figure
B. What dimensions of food 2: the blue variable names represent those indicators in
the “stability” group, red “acceptability,” green “quan-
insecurity do each of these tity,” and yellow “quality/diversity.”
measures capture? The clustering is evident with respect to the quality/di-
versity (yellow) questions and the food quantity (green)
The World Food Summit definition of food security,
questions. The remaining stability (red) and acceptabili-
adopted and widely promoted by FAO, contains several
ty (blue) are less clustered, with some outliers: SLPHUN
key elements, or dimensions, each of them difficult
(going to sleep hungry) from the vulnerability group
enough to measure separately, but nearly impossible
and NOTWNT (eating foods not wanting to eat) from
to measure in totality using any single indicator. The
the preferences group. SENDBEG (sending household
definition is “Food security exists when all people, at all
members to beg), PULSE, GRAIN, and to a lesser
times, have physical and economic access to sufficient,
extent SKIPEAT (skipping entire days without eating)
safe and nutritious food that meets their dietary needs
are relative outliers, the former two because they are rare
and food preferences for an active and healthy life”
extreme behaviors and the latter two because they are
(World Food Summit 1996). As described by Coates
very common behaviors. Both characteristics will tend
(2013), identifiable “elements” or “dimensions” include:
to weaken correlation with other measures.
• Quantity (sufficiency): “…physical and economic
Part of the reason that the stability measures do not
access to sufficient…”
correlate so well might be that the sub-questions selected
• Quality (diversity): “…nutritious food that meets
to represent that dimension only poorly represent the
dietary needs…”
concept. But it may also be the case that stability is not
• Acceptability: “…preferences…”
a stand-alone dimension per se in the same way that
• Safety: “safe…food”
quantity, quality/diversity or preference is: that is, stabil-
• Stability: “…at all times…”
ity may be an important component of each of those
The dimension of “stability” is crosscutting. According to dimensions over time, rather than a stand-alone. Stabil-
this understanding, “the experience of food insecurity can ity (or its inverse, vulnerability) is probably the most
be isolated from potential causes (i.e., lack of availability, difficult element of food insecurity to capture.
lack of access) and potential consequences, both nutri-
tional and non-nutritional, and can be considered within
a framework of risk that could jeopardize the secure
achievement of the first four elements” (Coates 2013).
In the sections below we draw on this standard defini-
tion of food security and use a combined theoretical and
empirical approach to examine the extent to which the
indicators examined in this study appear to capture one
or more of the five identified dimensions. Each of the
component questions of the seven indicators used in this
12 Feinstein International CenterTable 9. Indicators and component questions
Indicator NAME Question or specific measure Dimension
SAFS SAFS Self-assessed food security during past 30 days Stability
CSI/rCSI RELY In the past month, how often has the HH had to rely on less preferred Acceptability
or less expensive food?
CSI/rCSI BORROW In the past month, how often has the HH had to borrow food, or rely Quantity
on help from a relative?
CSI FDCRED In the past month, how often has the HH had to purchase food on Quantity
credit?
CSI WILD In the past month, how often has the HH had to gather wild food, Quantity
hunt, or harvest immature crops?
CSI EATSEED In the past month, how often has the HH had to consume seed stock Quantity
held for next season?
CSI SENDEAT In the past month, how often has the HH had to send HH members to Quantity
eat elsewhere?
CSI SENDBEG In the past month, how often has the HH had to send HH members to Quantity
beg?
CSI/rCSI LMTPORT In the past month, how often has the HH had to limit portion size at Quantity
mealtimes?
CSI/rCSI ADULTRS In the past month, how often has the HH had to restrict consumption Quantity
by adults in order to allow children to eat?
CSI/rCSI FWRMEAL In the past month, how often has the HH had to reduce the number of Quantity
meals eaten in a day?
CSI SKIPEAT In the past month, how often has the HH had to skip entire days Quantity
without eating?
HFIAS WORRY In the past 30 days, how often did you worry that your HH would not Stability
have enough food?
HFIAS PREFER In the past 30 days, how often were you or any HH member not able Acceptability
to eat the kinds of foods you preferred?
HFIAS LIMVAR In the past 30 days, how often did you or any HH member have to eat Quality/
a limited variety of foods? diversity
HFIAS NOTWNT In the past 30 days, how often did you or any HH member have to eat Acceptability
foods you did not want to eat?
HFIAS SMLMEAL In the past 30 days, how often did you or any HH member have to eat Quantity
a smaller meal than you felt like you needed?
HFIAS FEWMEAL In the past 30 days, how often did you or any HH member have to eat Quantity
fewer meals in a day?
HFIAS/ NOFOOD In the past 30 days, how often was there ever no food in your HH? Quantity
HHS
HFIAS/ SLPHUN In the past 30 days, how often did you or any HH member go to sleep Stability*
HHS at night hungry?
HFIAS/ NOEAT In the past 30 days, how often did you or any HH member have to go Quantity
HHS a whole day without eating?
FCS/ GRAIN In the past month, how often has the household eaten any food made Quality/
HDDS from grain? diversity
FCS/ TUBER In the past month, how often has the household eaten any tubers? Quality/
HDDS diversity
FCS/ PULSES In the past month, how often has the household eaten any pulses? Quality/
HDDS diversity
How Do Different Indicators of Household Food Security Compare? 13FCS/ VEGET In the past month, how often has the household eaten any vegetables? Quality/
HDDS diversity
FCS/ FRUIT In the past month, how often has the household eaten any fruits? Quality/
HDDS diversity
FCS/ MEAT In the past month, how often has the household eaten any meat, fish? Quality/
HDDS diversity
FCS/ EGGS In the past month, how often has the household eaten any eggs? Quality/
HDDS diversity
FCS/ DAIRY In the past month, how often has the household eaten any dairy prod- Quality/
HDDS ucts? diversity
FCS/ SUGAR In the past month, how often has the household eaten any sugar or Quality/
HDDS honey? diversity
FCS/ OILFAT In the past month, how often has the household eaten any oils, fat, or Quality/
HDDS butter? diversity
* This question could arguably also be classified as a “sufficiency”-related item, and will be examined as such in
further analysis.
Figure 2. Network diagram of correlation coefficients of measures and sub-questions
14 Feinstein International CenterC. How can measures be in the CSI with FCS plot. It is clear that relying on only
CSI, HFIAS or FCS alone would result in the misclas-
combined or used in sification of a substantial proportion of households as
complementary ways to yield either food secure or food insecure by the measurement
of the other indicator. However, cross tabulating them
a more multidimensional results in a new categorization. In conceptual terms,
picture of a household’s food cross-classification would look like Figure 3. Tables 10
and 11 apply this conceptual approach to the empirical
insecurity situation? data, yielding different, relevant information from both
indicators.
In the first sub-section below, we use the network diagram
from Section B to propose a cross-classification measure. This conceptual cross-tabulation yields results that can
In the second sub-section, we compare our results with be characterized as follows:
another multi-dimensional indicator of food security—
• Green: The low CSI/high FCS area is clearly the
the Integrated Phase Classification (IPC Partners 2012).
food-secure group likely to be doing satisfactorily
In the third sub-section, we construct a new multi-dimen-
in terms of both quality and quantity.
sional indicator of food security based on elements of all
• Red: The high CSI/low FCS area is clearly the
the measures we have analyzed in this paper.
food-insecure group that might require some kind
of assistance or intervention.
1. Cross-classification • Yellow: The intermediate group—those with low
CSI but low FCS, those with high CSI but high
Two dimensions in the definition of food security are FCS, or those genuinely intermediate on both—
distinct in both conceptual and empirical terms—the constitutes an in-between category requiring spe-
elements of quality (diversity) and quantity (sufficiency). cial operational considerations, discussed at greater
A simple measure to capture more of the dimensions length below.
of food security therefore might be proposed simply by
combining the two indicators that best capture these Table 10 suggests that nearly 27 percent of households
two dimensions. CSI and HFIAS are composed mostly would be misclassified by using only one or the other
of questions that reflect the “quantity” dimension of indicator rather than the combination of both. Table
food security (though both contain elements of accept- 11 cross-classifies FCS and HFIAS with similar results
ability and stability); FCS is composed mostly of ques- except that, with HFIAS’s higher prevalence estimates
tions that reflect the diversity (quality) dimension. An- of food insecurity, the intermediate category contains a
nex J depicts the scatterplots of CSI with HFIAS, CSI larger proportion of the total sample.
with FCS, and HFIAS with FCS, with the cut-offs or The obvious point arising from this kind of combined
thresholds for food secure, borderline, and food insecure indicator is that there is less error (defined as a measure-
Figure 3. Conceptual rendering of cross-classification between CSI/HFIAS and FCS
Low High
High
Food Consumption Score
Low
Coping Strategies Index (or HFIAS)
How Do Different Indicators of Household Food Security Compare? 15Table 10. Cross-classification of CSI and FCS categories, all rounds pooled
FCS category Total
Acceptable Borderline Poor
Food secure (0–2) 39.1% 2.4% 0.3% 41.7%
CSI category
(492) (28) (3) (483)
Mildly food insecure (3–12) 20.2% 3.6% 0.6% 24.5%
(234) (42) (7) (283)
Moderately/severely 22.8% 8.3% 2.7% 33.8%
food insecure (13+) (264) (96) (31) (391)
82.1% 14.3% 3.5% 100.0%
Total
(950) (166) (41)
Table 11. Cross-classification of HFIAS and FCS categories, all rounds pooled
FCS category Total
Acceptable Borderline Poor
HFIAS category
Food secure 33.4% 1.0% 0.1% 34.5%
(387) (12) (1) (400)
Mildly food insecure 5.2% 0.9% 0.2% 6.2%
(60) (10) (2) (72)
Moderately/severely 43.6% 12.4% 3.3% 59.3%
food insecure (506) (144) (38) (688)
82.2% 14.3% 3.5% 100.0%
Total
(953) (166) (41)
ment more consistent with the definition of food secu- would correspond to our findings. They also show a
rity) in identifying the food-insecure and food-secure significant worsening of conditions in surrounding areas
groups by using two indicators. The practical implica- following the main 2012 harvest (Round 4), which our
tions of this for analysis and programming are discussed results do not. Our results are not intended to represent
in the final section of the paper. the whole woreda. They were randomly sampled; but
being statistically representative of the two woredas was
not an objective of the study. However, broadly speak-
2. Comparing with other aggregate ing, our results are fairly similar to IPC analysis, if one
indicators considers that overall the situation was worse in the hun-
gry season of 2011 (the period of the major crisis in the
The obvious aggregate measure with which to compare Greater Horn of Africa).
the results of these indicators (individually and col-
lectively) is the Integrated Phase Classification (IPC In terms of how these results would inform future itera-
Partners 2013). The IPC maps corresponding to the tions of the IPC (which includes various measures com-
times of the survey rounds are found in Annex K. For pared here: the CSI, FCS, and, in some cases, HFIAS,
all rounds of the survey, the areas in which the survey HHS, and rCSI), further research that is representative
was conducted are listed as Phase 2 (stressed). This of different geographic areas would be necessary. Broadly
would imply that IPC analysis noted no major change speaking, however, the range of indicators shown here
in food security status over time in the areas surveyed. would seem to be indicative of “stressed” or Phase 2
Our results, on the other hand, show a relatively poor (Rounds 2, 3, and 4) and “crisis” or Phase 3 (Round 1).
food security situation during Round 1, with improve- To use these indicators to determine IPC categories in
ments over time in the following three rounds, with a an algorithmic method would require decisions both
slight (and expected) reversal during the hungry season about thresholds (what level of each indicator must be
of Round 3. The IPC maps in fact show a poor situation reached to qualify for Phases 2, 3, 4, and 5), and preva-
in many of the surrounding woredas in Round 1, which lence (what proportion of the population has to reach
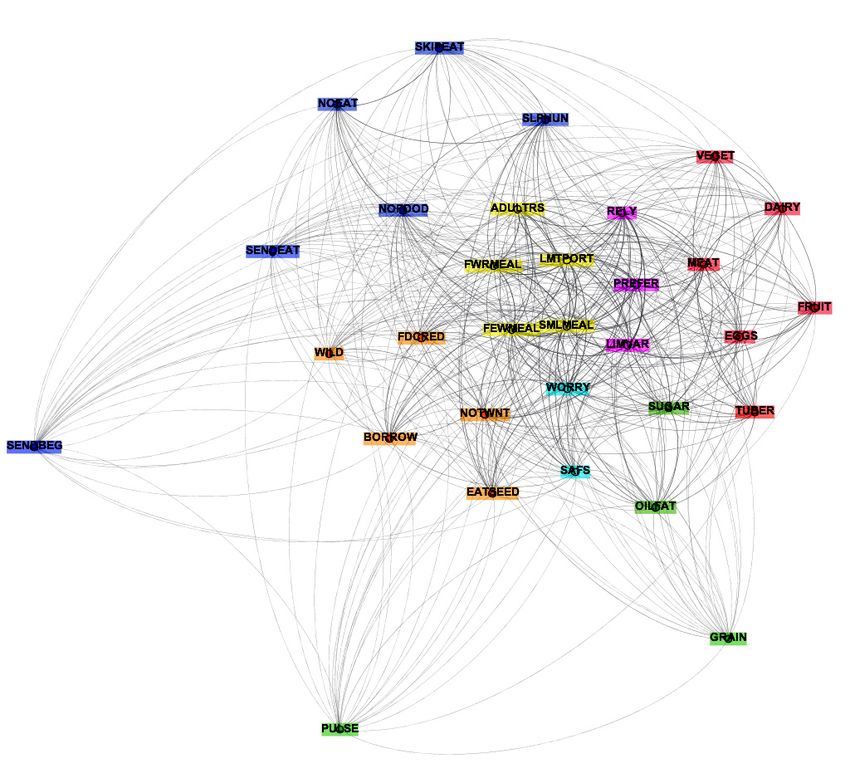
16 Feinstein International CenterFigure 4. Network diagram of correlation coefficients, color-coded by food security dimension
the threshold before that phase can be declared). This daily foods (green). Note again the outliers SENDBEG
study did not have adequate empirical evidence on IPC (sending household members to beg), PULSE, GRAIN,
phases to make such a determination. and, to a lesser extent, SKIPEAT (skipping entire days
without eating).
3. An algorithmic approach How then can this diagram, depicting different dimen-
sions of food security, be operationalized? Below, we
We constructed a multidimensional indicator using an
propose a methodology for constructing a multidimen-
approach that first extracted categories empirically using
sional food security measure.
a network modularity approach and then refined these
inductive results with theory. First, we used the correlation matrix in Annex H,
and depicted visually in Figures 3 and 4, to eliminate
A modularity algorithm with a pre-specified resolu-
redundant questions—those that seemed to be pick-
tion of 0.77 was then run to group neighborhoods of
ing up similar aspects of food security. To determine
nodes into clusters (Blondel et al. 2008, Labiotte et al.
candidates for exclusion, we looked at each variable’s
2009.) From this, we returned to theory to interpret the
average correlation coefficient—the simple mean of its
clusters as dimensions of food security. In Figure 4, each
correlation coefficients with all other variables; these
dimension is coded by color: rationing strategies (yel-
are the variables whose information is most likely to be
low), food-increasing behaviors (orange), dietary change
gathered by other variables. Annex I presents the results
preferences (purple), rare and severe behaviors (blue),
from strongest to weakest. Some candidates for elimina-
vulnerability (light blue), high value foods (red), and
tion emerged. The pair SMLMEAL and LMTPORT
How Do Different Indicators of Household Food Security Compare? 17Table 12. Questions used in multidimensional indicator
Indicator Name Food Security Dimension
SAFS SAFS Stability
HFIAS WORRY Stability
CSI/rCSI LMTPORT Rationing strategies
CSI/rCSI FWRMEAL Rationing strategies
HFIAS PREFER Dietary change preferences
HFIAS LIMVAR Dietary change preferences
HFIAS NOTWNT Dietary change preferences
CSI/rCSI BORROW Food-increasing behaviors
CSI FDCRED Food-increasing behaviors
CSI WILD Food-increasing behaviors
CSI EATSEED Food-increasing behaviors
FCS/HDDS VEGET High value foods
FCS/HDDS FRUIT High value foods
FCS/HDDS MEAT High value foods
FCS/HDDS EGGS High value foods
FCS/HDDS DAIRY High value foods
FCS/HDDS GRAIN Daily foods
FCS/HDDS PULSE Daily foods
CSI SENDEAT Rare and severe behaviors
CSI SENDBEG Rare and severe behaviors
CSI SKIPEAT Rare and severe behaviors
HFIAS/HHS NOFOOD Rare and severe behaviors
HFIAS/HHS SLPHUN Rare and severe behaviors
HFIAS/HHS NOEAT Rare and severe behaviors
and the pair FEWMEAL and FWRMEAL are somewhat With the exception of SAFS, each question can be
redundant in their questions; we choose to eliminate the answered from a set of four responses, borrowed from
HFIAS questions SMLMEAL and FEWMEAL. RELY is the HFIAS: often, sometimes, rarely, and never, with the
strongly correlated with PREFER, so we excluded RELY exact meaning of these responses differing by question.
as well. ADULTRS is strongly correlated with LMT- For SAFS, the responses would correspond to severely
PORT, SMLMEAL, and FWRMEAL, so we excluded food insecure (4 or worst), moderately food insecure (3),
ADULTRS as well. SUGAR, TUBER, and OILFAT mildly food insecure (2), and food secure (1).
were removed because of concerns over their cross-
The algorithmic method is depicted in Figure 5. The
contextual applicability and nutritional importance in
worst or second-worst response to any of the first six
relation to the other dietary measures.
questions (from NOEAT to SENDEAT) results in an
Table 12 presents the streamlined set of 25 questions, automatic classification into the overall “severely food
categorized by dimension. In future analyses, Principal insecure category”; any worst response to any of the next
Components Analysis or Rasch modeling or both will seven questions (from PULSE to NOTWNT) results in
be used to compare the results presented here to those the same; and so on.
achieved by these traditional scaling methods.
In this illustrative, exploratory approach, the classifi-
We now propose an algorithmic means of classification cation of “food secure” can only result if the optimal
based on the HFIAS category construction methodology response is given for questions 1–13, at least the optimal
for using the questions to divide households into catego- or second-best response for questions 14–19, and any-
ries of “food secure,” “mildly food insecure,” “moderately thing but the worst response for questions 20–25.
food insecure,” and “severely food insecure.”
18 Feinstein International CenterFigure 5. Algorithmic classification of food security
NAME 1 (best) 2 3 4 (worst)
1 NOEAT
2 SLPHUN
3 NOFOOD
4 SKIPEAT
5 SENDBEG
6 SENDEAT
7 PULSE
8 GRAIN
9 EATSEED
10 WILD
11 FDCRED
12 BORROW
13 NOTWNT
14 LIMVAR
15 PREFER
16 FWRMEAL
17 LMTPORT
18 WORRY
19 SAFS
21 DAIRY
22 EGGS
23 MEAT
24 FRUIT
25 VEGET
Severely food insecure
Moderately food insecure
Mildly food insecure
Food secure
Using this algorithm, the Multi-dimensional Food Secu- ultimately still subjective, an algorithmic approach de-
rity Indicator (MFI) shows dynamics similar to the other mands careful conceptual attention (compared with the
food security measures, and is generally quite sensitive in standard definition) to the implications of each answer
the portrait it paints of food insecurity (Figures 6 and 7). for overall food security classification.
The advantages of this illustrative MFI over the other For this indicator to be even more operationally useful,
stand-alone measures are threefold. First, it is data-rich, each category currently labeled according to degrees
capturing multiple dimensions of food security. Second, of food security severity could, and should, be further
by taking this broad approach, its range of sensitivity described according to the types of conditions experi-
to food insecurity is wider; it is able to pick up both enced by households classified into the category. This
milder food insecurity manifestations as well as severe additional step would produce more-transparent results
outcomes. Third, by taking an algorithmic approach, it than those stemming from a purely aggregated classifica-
avoids the pitfalls of arbitrary quantitative food security tion system labeled according to status along a single
cut-offs along a raw score. Though a choice of cut-offs is dimension of severity.
How Do Different Indicators of Household Food Security Compare? 19You can also read