APPENDIX 3 : Laois County Council Comhairle Chontae Laoise - Laois County Development Plan 2011-2017
←
→
Page content transcription
If your browser does not render page correctly, please read the page content below
Laois County Council
Comhairle Chontae Laoise

      APPENDIX 3 :
  Housing Strategy 2011-2017

Laois County Development Plan
          2011-2017

     Adopted 11th October 2011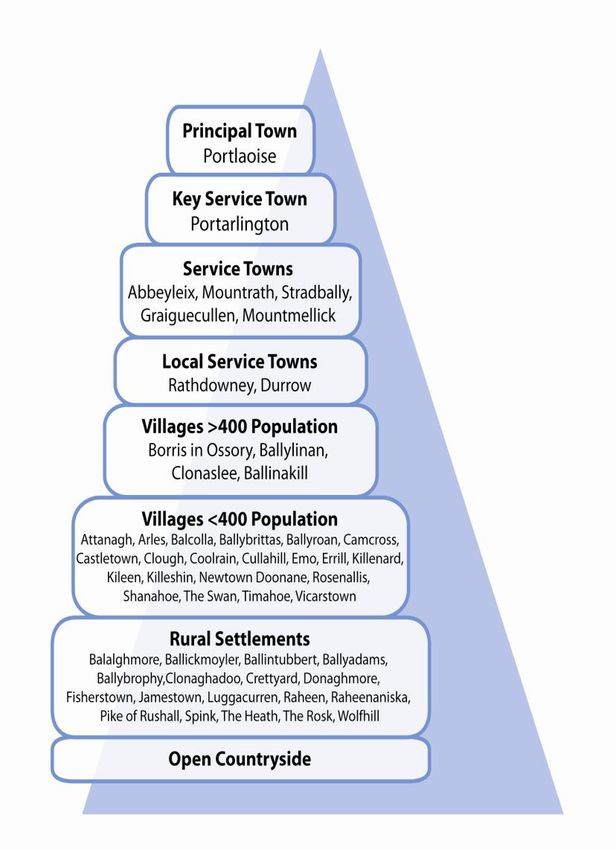
Laois County Council Housing Strategy 2011-2017

                                                  1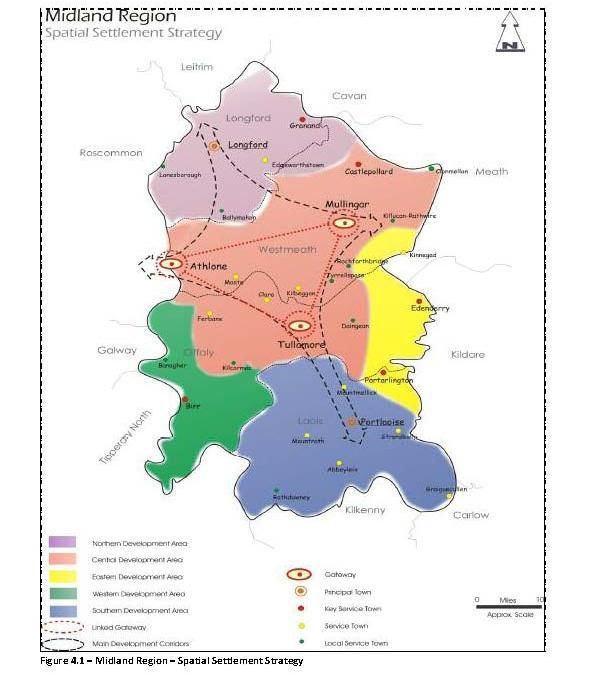
Table of Contents

1.0 Introduction
1.1 Statutory Background                                      3
1.2 Policy Background                                         4
1.3 Structure of the Document                                 4

2.0 Housing Demand
2.1 County Population Trends                                  8
    2.1.1 Growth of County Laois’s Population                 8
    2.1.2 Components of County Laois’s Population Change      9
    2.1.3 Factors Influencing Future Population Growth        11
2.2 Projected Population Growth                               11
2.3 Projected Household Growth                                12
2.3.1 Household Sizes                                         12
2.4 Implications for the Housing Strategy                     14

3.0 Housing Supply
3.1 Recent Trends in Housing Supply                           15
3.2 Spatial Allocation of Population Growth in County Laois   18
3.3 Regional Settlement Hierarchy                             22
3.4 Settlement Hierarchy within Laois County                  23
    3.4.1 Principal Town                                      27
    3.4.2 Key Service Town                                    27
    3.4.3 Service Towns                                       28
    3.4.4 Local Service Towns                                 28
    3.4.5 Villages 400 Population                             29
    3.4.7 Rural Settlements Suitable for Urban Generated Housing   29
Laois County Council Housing Strategy 2011-2017

3.4.8 Open Countryside                                               29         5.0 Social and Affordable Housing
3.5 East-West Divide                                                 29         5.1 Introduction                                           64
3.6 Wastewater and Water Supply Infrastructure                       37         5.2 Social Housing Need                                    64
    3.6.1 Wastewater Capacity and Demand                             37         5.3 Provision of Local Authority Housing in County Laois   64
    3.6.2 Waste Supply Capacity and Demand                           37         5.4 Current Local Authority Housing Stock                  67
                                                                                5.5 Vacancies and Stock Utilisation                        69
4.0 Housing Affordability                                                       5.6 Age Profile of Social Housing Stock in County Laois    69
4.1 Introduction                                                     39         5.7 Special Needs Housing                                  70
4.2 Affordability - Household Incomes                                39             5.7.1 Homeless                                         70
    4.2.1 Compilation of Data on Household Incomes                   39             5.7.2 People with Disabilities                         71
    4.2.2 Level of Disposable Income in County Laois                 39             5.7.3 Traveller Accommodation                          72
    4.2.4 Household Income Analysis                                  40
    4.2.5 Projected Disposable Household Income                      43         5.8 Affordable Housing                                     74
4.3 Affordability – House Prices                                     45             Shared Ownership Scheme                                74
    4.3.1 House Prices and Distribution in County Laois              47             1999 Affordable Housing Scheme                         74
    4.3.2 House Value Distribution of Transactions                   47             Part V Planning & Development Acts 2000-2006           76
    4.3.3 National Housing Market Overview                           48             Low Cost Sites                                         75
    4.3.4 Housing Market in County Laois in 2009                     49             Mortgage Allowance Scheme                              75
    4.3.5 Survey of Auctioneers in County Laois                      49             Council Mortgage                                       75
    4.3.6 Survey of Laois Property Market using Daft.ie              50             Mortgage Subsidy Scheme                                75
    4.3.7 Interest Rates                                             51         5.9 The Role of the Voluntary and Community Sector         78
4.4 House Price Projections                                          53         5.10 Changes in the Approach to Social Housing Supply      81
4.5 House Price Bands                                                56             Implementation of the Social Leasing Scheme            81
4.6 Annual Affordability Thresholds                                  57         5.11 Infrastructure                                        83
4.7 Social & Affordable Need Calculation for 2012                    60
4.8 Summary of Anticipated Social and Affordable Housing Need        62         6.0 Summary & Policy Conclusions                           84

                                                                                                                                                2
Laois County Council Housing Strategy2011-2017
1.0 Introduction
1.1 Statutory Background
This Housing Strategy has been prepared by Laois County Council and the National Building Agency Ltd in accordance with the requirements of Part V of the Planning and
Development Act, 2000 - 2011. In accordance with the legislative requirements, this Housing Strategy will form part of the Laois County Development Plan 2011-2017 (herein
referred to as the Development Plan). It is an update of the County Laois Housing Strategy 2006-2012.
In accordance with the Act, this Housing Strategy aims to:
o Ensure that adequate zoned and serviced lands for residential purposes are available in appropriate locations to meet the existing and future demand for housing -
including social and affordable housing.
o Ensure that housing is available to people of different income levels and determine the distribution of this housing.
o Ensure that a mixture of house types and sizes is developed to reasonably match the requirements of the different categories of households, including the special
requirements of elderly persons and persons with disabilities.
o Counteract undue segregation in housing between people of different social backgrounds.
o Ensure that a specific percentage (not exceeding 12%) of the land zoned in the Development Plan for residential use or a mixture of residential and other uses; be
reserved for those in need of social or affordable housing in the area.
Section 96 of the Act provides details on the manner in which this percentage (not exceeding 20%) can be met. This includes for:
o The building and transfer of houses;
o The transfer of fully or partially serviced sites;
o The transfer of land;
o The transfer of other land in the functional area;
3Laois County Council Housing Strategy2011-2017
o The build and transfer of houses in the functional area;
o The transfer of fully or partially serviced sites in the functional area;
o The payment of a financial contribution;
o The transfer of land and/or a combination of the others;
o The combination of two or more of the others.
In considering these details, the Planning Authority must consider each of the following:
o whether such an agreement will contribute effectively and efficiently to the achievement of the objectives of the housing strategy;
o whether such an agreement will constitute the best use of the resources;
o the need to counteract undue segregation in housing between persons of different social background in the area of the authority;
o whether such an agreement is in accordance with the provisions of the Development Plan;
o the timeframe within which housing is likely to be provided.
Part V of the Act applies to all applicants for residential developments on sites in excess of 0.1 hectares or 4 units on residential/mixed use zoned land. The decision on the
transfer of sites or houses in lieu of land or such other compliance as specified in the Act is a matter for negotiation between the developer and the planning authority and is
subject to agreement between the two parties.
1.2 Policy Background
There are a number of policy documents, of national, regional and local significance, that have had a bearing on the direction of this Housing Strategy (herein referred to as the
Strategy). These include:
o National Spatial Strategy 2002-2020 (NSS);
o National Development Plan 2007-2013 (NDP);
o Circular AHS/4/06 – Guidelines on Part V of the Planning and Development Acts 2002-2006: Implementation Issues, Department of the Environment, Heritage and
Local Government (DoEHLG);
o Delivering Homes Sustaining Communities Quality Housing for Sustainable Communities 2007 (DoEHLG);
o Sustainable Rural Housing – Guidelines for Planning Authorities 2005 (DoEHLG);
o Sustainable Residential Developments in Urban Areas 2009 (DoEHLG);
4Laois County Council Housing Strategy2011-2017
o Residential Density Guidelines 1999 (DoEHLG);
o Sustainable Urban Housing: Design Standards for New Apartments 2007 (DoEHLG);
o Midland Regional Planning Guidelines 2010-2022;
o Laois County Development Plan, 2006-2012 which includes settlement plans for towns and villages within the county, excluding the following which have their own
dedicated local area plans;
o Portlaoise Local Area Plan 2006-2012, Mountmellick LAP 2007-2013, Portarlington LAP 2007-2013 and Graiguecullen LAP 2007-2013;
o Rental Accommodation Scheme (RAS).
In addition, the following publications and data sources have been analysed:
o Publication of the full results of the Central Statistics Office (CSO) 2006 Census;
o Relevant CSO publications, namely, Population and Labour Force Projections 2011-2041 (April 2008), County Incomes and Regional GDP 2006 (February 2009) and
Household Budget Survey 2004-05 (December 2007);
o A Model Housing Strategy and Step by-Step Guide (December 2000);
o Economic and Social Research Institute (ESRI) Medium Term Review 2008-2015(May 2008); ESRI Recovery Scenarios for Ireland (May 2009);
o Permanent TSB/ESRI House Price Index (June 2009).
o The ESRI Quarterly Economic Commentary (Spring 2010)
1.3 Structure of the Document
The aim of this Strategy is to set out how Laois County Council will meet the housing needs of existing and future populations of the county within the Development Plan
period. Despite the sharp decline in housing demand being experienced in Ireland at present, this document follows the DoEHLG Model Housing Strategy Guidelines (2000) for
the preparation of a Housing Strategy as it is statutorily obliged to do so.
5Laois County Council Housing Strategy2011-2017
The document is laid out as follows:
Housing Demand (Section 2): this section provides estimates for overall housing demand, based on anticipated population
projections and household projections;
Housing Supply (Section 3): this section examines trends in the supply of housing in County Laois in recent years; it examines
growth patterns in different towns, and the spatial distribution of development throughout the county
focusing on a noticeable east-west division. Factors associated with the settlement strategy are
examined, including vacancy rates, incomplete estates and land use zoning.
Housing Affordability (Section 4): this section examines housing affordability based on average anticipated income levels in the County
and likely average house prices;
Social & Affordable Housing (Section 5): this section looks at current social housing provision in County Laois;
Summary & Policy Conclusions (Section 6): this section outlines specific policy responses.
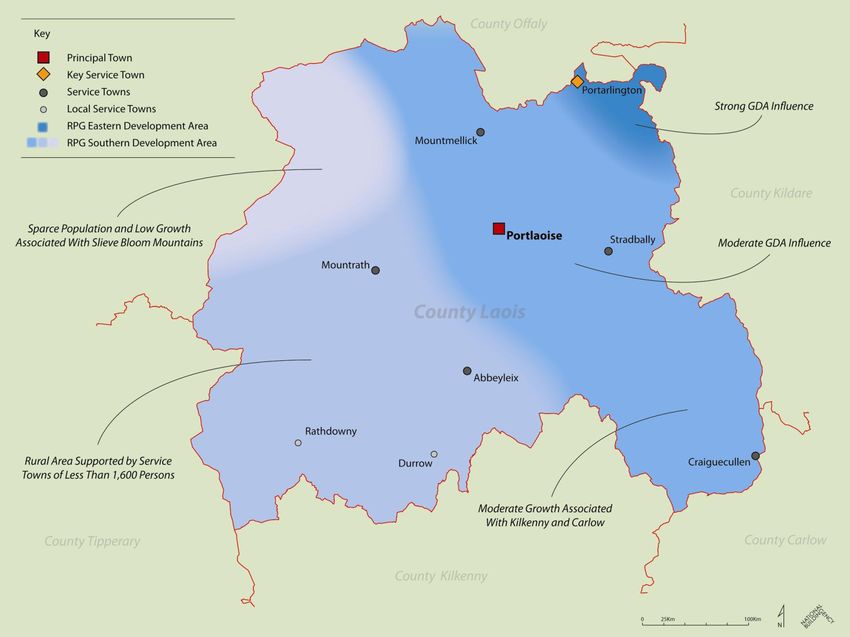
Map 1: County Laois Context
6Laois County Council Housing Strategy2011-2017
2.0 Housing Demand
7Laois County Council Housing Strategy2011-2017
This section of the Strategy provides estimates for overall housing demand, based on anticipated population projections and household projections. The Strategy relies on the
National Population Projections and Regional Population Targets 2010-2022 (January 2010) issued by the DoEHLG and the Midland Regional Planning Guidelines 2010-2022,
population projections and housing land requirements.
2.1 County Population Trends
2.1.1 Growth of County Laois‟s Population
There has been substantial population growth in County Laois in recent years. The population of the county grew from 52,945 persons in 1996 to 67,059 persons in 2006,
representing an increase of approximately 27%. This growth is well in excess of the State average for the same period, which was approximately 17%. Table 1 illustrates that
the population of Laois has been growing steadily since 1996, rising by 11% up to 2002, and by a further 14% up to 2006.
Table 1: Population Analysis of County Laois (and State) from 1996-2006 (Source: www.cso.ie)
POPULATION % POPULATION CHANGE
LOCATION
1996 2002 2006 1996-2002 2002-2006 1996-2006
County Laois 52,945 58,774 67,059 11% 14.10% 26.60%
State 3,626,087 3,917,203 4,239,848 8.02% 8.23% 16.90%
Table 2: Population Analysis of the Midland Region (Source: www.cso.ie)
% Population Change
Midland Region
2002-2006
Laois 14.10%
Offaly 11.30%
Westmeath 10.40%
Longford 10.70%
Total 11.60%
8Laois County Council Housing Strategy2011-2017
Table 2 illustrates that out of the four counties in the Midland region, County Laois experienced the highest percentage of population growth during the 2002-2006 inter-censal
period. Laois‟s population grew at an average annual rate of 2.6% over the ten year period from 1996 to 2006 (compared with the national average of 1.6%). Growth in the
Laois population was strongest in the last four years (2002-2006) of this period – accelerating to an annual rate of 3.35%. Graph 1 illustrates the pattern of this population
growth over the 1996-2006 period.
Graph 1: Population Analysis of County Laois from 1996-2006 (Source: www.cso.ie and NBA)
County Laois
70000
60000
50000
40000
30000
20000
10000
0
POPULATION POPULATION POPULATION
1996 2002 2006
2.1.2 Components of County Laois‟s Population Change
Between 1996 and 2002, the number of births in County Laois exceeded the number of deaths by 1,900. Thus there was a natural increase in the population, which accounted
for 33% of the total increase over the period, with net inward migration into County Laois accounting for the majority of the increase (3,929 or 67% of the total).
In the latest inter-censal period (2002-2006), the number of births in Laois again exceeded the number of deaths, resulting in a natural population increase of 2,300. However,
in this period natural increase accounted for a lower proportion of the increase (28%), with net inward migration into Laois accounting for a phenomenal 72% of the 2002-2006
total population increase. Table 3 shows the contribution of natural increase and net migration to the annual average growth rate of the Laois population over the last two inter-
censal periods. As can be seen from this table, net inward migration exceeded natural increase over both periods.
9Laois County Council Housing Strategy2011-2017
Table 3: Annual Average % Growth in County Laois (Source: www.cso.ie and NBA)
1996 - 2002 2002 - 2006
Natural Increase 0.61% 0.99%
Estimated Net Migration 1.23% 2.54%
Total Population 1.84% 3.53%
Table 4 details the components of population change in County Laois over the decade from 1996 to 2006. Both the rate of natural increase and the rate of net migration in
Laois were ahead of the State average over this period.
Table 4: Components of Population Change in County Laois 1996-2006 (Source: www.cso.ie and NBA)
Annual Rates* County Laois State Average
1996-2002 Births 13.8 14.3
Deaths 8.1 8.3
Net Migration 11.7 6.8
2002-2006 Births 15.2 15.0
Deaths 6.1 7.0
Net Migration 23.6 11.7
* Average annual rates per 1,000 of average population
It is therefore evident that County Laois has experienced remarkably high rates of net migration in recent times. These high rates can be attributed to the exceptional period of
st
sustained growth in the Irish economy from 1994 through to the early years of the 21 century. This growth drove the need for substantial immigration to Ireland to help relieve
labour market pressures. As property prices rose – particularly in the greater Dublin region, affordability became an issue and commuter distances increased to include north
east Laois.
10Laois County Council Housing Strategy2011-2017
2.1.3 Factors Influencing Future Population Growth in County Laois
The ESRI publication Recovery Scenarios for Ireland (May 2009) highlights that the Irish economy is in the “throes of a deep recession, unemployment is rising rapidly and the
1
Irish banking system is facing serious funding difficulties” . The downturn in the construction industry has had a substantial impact on the economy of County Laois. The
unemployment rate for the County now stands at 14.45% which is slightly more that the national average rate of 13.4%.This very significant increase in unemployment is
reflective of the situation across the country and indicates the strong challenges facing the County in terms of economic growth, and thus population growth.
The CSO Live Register Additional Tables (June 2009) record the rate of unemployment with reference to the local offices of registration. In County Laois, the local offices are
located in Portlaoise, Portarlington and Rathdowney. It is clear that those areas which experienced the highest levels of population growth in recent years, i.e. Portarlington and
Portlaoise, are the same areas which are now facing the highest levels of unemployment.
It is evident that the downturn in the Irish economy could lead to a reversal of the high population growth rates experienced by counties such as Laois in the future. In
particular, it seems that the high rates of net inward migration, which were a feature of Laois‟s population growth for many years, are set to moderate. The CSO publication
Population and Migration Estimates (April 2009) notes that:
“the number of emigrants from the State in the year to April 2009 is estimated to have increased by over 40% from 45,300 to 65,100, while the number of immigrants
continued to decline over the same period, from 83,800 to 57,300. These combined changes have resulted in a return to net outward migration for Ireland (-7,800) for the
2
first time since 1995” .
The ability of County Laois to maintain the high levels of population growth experienced during the 2002-2006 inter-censal period will depend significantly on the employment
prospects which can be created in the local economy and an ability to halt outward migration.
2.2 Projected Population Growth
The population projections for County Laois (including Principal Town allocation) are derived from the population targets published by the DoEHLG and the Midland Regional
Authority MRPG‟s. These are revised population targets which were published in January 2010, and are lower than those previously released, whereby the higher population
targets are to be achieved by 2022 rather than 2020. For County Laois, a population target of 75,931 persons is assigned for 2016 and 79,314 persons for 2022. If we take the
1
Economic and Social Research Institute, Recovery Scenarios for Ireland (May 2009), page IX
2
Central Statistic Office, Population and Migration Estimates (April 2009), page 1.
11Laois County Council Housing Strategy2011-2017
intervening years as deciles from 2006 (recorded population 67,059), then the annual increase in population would be 766 persons per annum up to 2022. We assume that the
total growth projected is evenly distributed across the period.
2.3 Projected Household Growth
2.3.1 Household Sizes
In Census 2006, the average number of persons per private household recorded for County Laois was 2.91 (See Table 5). This figure is slightly lower that the average
household size recorded for the Midlands Regional Area (2.94), but higher than the national average (2.81). An examination of the average household size in the County
reveals an urban/rural divide. Portlaoise recorded 2.79 persons per household, Portarlington 2.55 persons and Mountmellick 2.79 persons. Given that the average number of
persons recorded for the County was 2.91, it would appear that average household size in the aggregate rural areas of County Laois is higher than the household sizes for the
main urban centres.
Table 5: Household Sizes in the Midlands Region and County Laois (Source: www.cso.ie)
Number of Household
Population
Households Size
Midlands 251,664 85,535 2.94
Laois 67,059 22,591 2.91
Laois as a % of the
Midland‟s Population & 26.6% 26.4% N/A
Household Numbers
, In accordance with the Midland Regional Planning Guidelines 2010-2022, a figure of 2.4 was used for the average household size, over the Development Plan period. Table 6
outlines projected household formations over the period of the Strategy.
12Laois County Council Housing Strategy2011-2017
Table 6: Projected Household Formations for County Laois corresponding to the Regional Population Targets (DoEHLG)
Projected Average Projected
Additional
Year Population Household Household
Households
of Laois¹ Size (AHS) Numbers
4
2006 67,059 2.91² 22,591 1,009
2007 67,946 2.4³ 23,675 369
2008 68,833 2.4 24,323 369
2009 69,721 2.4 24,990 370
2010 70,608 2.4 25,676 370
2011 71,495 2.4 26,382 370
2012 72,382 2.4 27,109 369
2013 73,269 2.4 27,859 370
2014 74,157 2.4 28,632 370
2015 75,044 2.4 29,429 369
2016 75,931 2.4 30,251 370
2017 76,495 2.4 30,970 235
2018 77,059 2.4 31,712 235
2019 77,622 2.4 32,478 234
2020 78,186 2.4 33,130 235
2021 78,750 2.4 33,798 235
2022 79,314 2.4 34,484 235
(Source: NBA analysis)
1. According to the CS0 2006 Census, County Laois accounted for some 26.6% of the population recorded for the Midlands region (includes Laois, Longford, Offaly and
Westmeath). Laois also accounted for 26.4% of the households recorded for the Midlands region.
2. The average persons per household recorded in the CSO 2006 Census for Laois was 2.91.
13Laois County Council Housing Strategy2011-2017
3. According to the Midland Regional Planning Guidelines, the projected number of units in Laois over the period 2006-2016, is given as 3,696 units (based on an
average household size of 2.4 persons).
4 The annual average of additional households during the Census period 2002-2006.
2.4 Implications for the Housing Strategy
The DoEHLG projections forecast that in the period 2006-2022, Laois will have experienced a 53% increase in the number of households in the County (22,591 households in
2006 to 34,484 in 2022), this translates into a population increase of 18% (67,059 persons in 2006 to 79,314 persons in 2022) with an average household size of 2.4, expected
over this period.
3
Although the DoEHLG population projections were revised as recently as October 2009 „in order to provide a more conservative estimate‟ , they still appear to be somewhat
excessive, at least in the short-term. Given the that Ireland has returned to net outward migration for the first time since 1995, with emigration at 65,100 persons now exceeding
4
immigration at 57,300 persons , and taking into account the country‟s extremely challenging economic environment, it is clear that the task of population forecasting is fraught
with difficulty at present. The DoEHLG national projections of annual inward migration of 20,000 persons between 2008-2010 and 22,500 persons between 2011-2016 go
5
against current economic commentaries, which predict that the economy will contract by 8.7% in 2009 with a further contraction of 1.7% in 2010. However, in spite of the
precarious condition of the Irish economy at present, and its consequent negative impact on the country‟s housing market, this Strategy follows the DoEHLG population
projections as it is required to do so, with the expectation that over the long-term (to 2022) a re-adjustment will take place.
3
National Population Projections and Regional Population Targets 2010-2022 page 4
4
Source Irish Times September 26, 2009
5
Source: ERSI Quarterly Economic Commentary Spring 2009
14Laois County Council Housing Strategy2011-2017
3.0 Housing Supply
3.1 Recent Trends in Housing Supply
Housing construction throughout County Laois has been very strong in recent years, with a total of 7,947 houses granted planning permission over the period 2005-2009 (See
Table 7).
Table 7: Number of houses granted planning permission from 2005-2009 (Housing Developments within zoned areas)
TOTAL 2005 2006 2007 2008 2009 TOTAL PER TOWN
Abbeyleix 36 8 11 8 3 66
Ballinakill 15 22 28 65
Ballybrittas 102 102
Ballylinan 153 7 74 25 259
Ballyroan 52 161 3 19 6 241
Borris in Ossory 222 56 143 421
Durrow 6 10 16
Errill 92 92
Graiguecullen 774 199 4 102 79 1158
Killenard 118 118
Killeshin 14 14
Mountmellick 55 361 44 63 523
Mountrath 61 43 45 149
Newtown Doonane 15 14 49 78
Portarlington 455 154 4 63 47 723
Portlaoise 826 411 805 1277 63 3382
Rathdowney 39 19 86 12 156
Stradbally 68 6 259 333
Vicarstown 51 51
TOTAL PER YEAR 2803 1402 1335 1975 432 7947
15Laois County Council Housing Strategy2011-2017
Table 8 outlines the pattern of housing supply in County Laois over the past ten years (1999-2009). It is evident that the level of housing completions rose dramatically in 2004
(increasing by 58%) and continued to rise, albeit more slowly, until 2006.
Table 8: Historic Housing Completions (based on DoEHLG Figures) (Source: DoEHLG)
Year 1999 2000 2001 2002 2003 2004 2005 2006 2007 2008 2009 2010
Annual House Completions
Private 577 791 905 808 903 1,363 1,640 2,104 1,920 917 213¹ NA
Social including voluntary 83 48 122 54 128 263 162 140 257 239 87¹ NA
Total 660 839 1027 862 1031 1626 1802 2244 2177 1156 523² 77³
Annual % Increase /
46% 27% 22% -16% 20% 58% 11% 25% -3% -47% -55% NA
Decrease
Notes:
1. Figures for social and private completions only given up to second quarter.
2. Total figure of completions indicated for the year.
3. Figure up to April 2010
After 2004, the percentage growth in the number of housing completions began to moderate. By 2007, the level of housing completions had fallen by 3% and in 2008 a very
sharp decline of 47% was experienced. Similar declines were recorded for 2009, with housing levels falling by 55% This pattern is illustrated on Graph 2. Trends with regard to
2010 also point toward a very significant slowing of activity in the development/construction sector, with only 77 housing completions occurring in the County in the first four
months of 2010.
16Laois County Council Housing Strategy2011-2017
Graph 2: Analysis of Housing Completions 1999-2009 in County Laois (Source: DoEHLG)
Total Housing Completions 1999-2009
2500
Number of Housing Units
2000
1500
1000
500 Total Housing
Completions
0
99 00 01
02 03 04
05 06 07
Year
08 09
17Laois County Council Housing Strategy2011-2017
3.1 Spatial Allocation of Population Growth in County Laois
Table 9 and Graph 3 illustrate the population change experienced in the major settlement centres of County Laois from 1996 to 2006.
Table 9: Population Analysis of Settlement Centres in County Laois 1996-2006 (Source: www.cso.ie and NBA)
POPULATION % POPULATION CHANGE
LOCATION
1996 2002 2006 1996-2002 2002-2006 1996-2006
Abbeyleix 1259 1383 1568 9.8 13.4 24.5
Ballinakill 299 328 430 9.7 31.1 43.8
Ballylinan 406 430 754 5.9 75.3 85.7
Borris-in-Ossory 282 379 488 34.4 28.8 73
Graiguecullen (rural/Laois) 1508 1819 3115 20.6 71.2 106.5
Clonaslee 504 538 501 6.74 -6.87 -0.59
Castletown 294 289 314 -1.7 8.7 6.8
Durrow 696 717 811 3 13.1 16.5
Emo 231 220 225 -4.8 2.3 -2.59
Mountmellick & environs 2919 3361 4069 15.1 21 39.3
Mountrath 1298 1331 1435 2.5 7.8 10.55
Portarlington (Laois) 2630 3260 5054 23.9 55 92.1
Portlaoise & environs 9474 12127 14613 28 20.4 54.2
Rathdowney 1066 1111 1212 4.2 9.1 13.6
Stradbally 1047 1178 1056 12.5 -10.4 0.8
Towns of all sizes in the State 2373741 2616472 2870395 10.22 9.7 20.9
County Laois 52945 58774 67059 11 14.1 26.6
18Laois County Council Housing Strategy2011-2017
Graph 3: Percentage Population Change within Settlement Centres in County Laois 1996-2006 (Source: www.cso.ie and NBA)
Stradbally
Rathdowney
Portlaoise
Portarlington
Mountrath
Mountmellick
Emo
Durrow
Castletown
Clonaslee
Graiguecullen
Borris-in-Ossory
Ballylinan
Ballinakill
Abbeyleix
-20 0 20 40 60 80 100 120
It is evident that in the 1996-2006 period, the majority of towns and villages in the County experienced substantial population increases:
The largest growth rate occurred in Graiguecullen (106.5%), a town experiencing considerable development pressure from people commuting to counties such as
Kildare and Dublin for employment, and from the growth of Carlow Town.
The county‟s three largest towns of Portlaoise, Portarlington and Mountmellick experienced very significant growth rates of 54.2%, 92.1% and 39.3% respectively.
These towns offer good quality road and rail infrastructure (particularly Portlaoise and Portarlington) and are consequently within easy distance of the largest urban
centres in the Greater Dublin Area (GDA).
19Laois County Council Housing Strategy2011-2017
The village of Ballylinan situated on the N78 linking Kilkenny to Athy/Kilcullen (N9), experienced a growth rate of 85.7%, largely attributable to the growth of
surrounding towns such as Portlaoise, Athy, Naas and Carlow.
The only areas which experienced negative population growth were Emo (-2.59) an attractive, historic village and Clonaslee (-0.59), situated at the foothills of the
Slieve Bloom Mountains. The village of Stradbally also recorded a surprisingly low population growth rate (0.8).
Table 9 puts the population growth rates experienced in County Laois into a national context. As can be seen from this table, the average growth rate for towns in Ireland
during 1996-2006 was 20.9%. The majority of towns and villages in Laois grew at a rate far in excess of this. A closer examination of this data reveals that the majority of the
settlements in Laois which had growth rates in excess of the national average are situated on the eastern half of the County. The one exception to this is Borris-in-Ossory,
which actually grew from a very low population base.
This data highlights the rapid population expansion that occurred in the eastern half of the County in recent years, the majority of which is attributable to its location on the
periphery of the GDA. Relatively affordable house prices and good quality transport infrastructure, such as the M7 motorway and frequent train services to and from
Portarlington and Portlaoise, made Laois an attractive location for many people. Settlements in the south-east of the County also appear to have prospered due to their
proximity to the county towns of Carlow and Kilkenny. The data also highlights the relative peripherality of the western half of the County, situated some distance from large
market towns and employment centres, and dominated to the north-west by the Slieve Bloom Mountains, despite close proximity to national road network and public transport
provision at Ballybrophy Train Station.
20Laois County Council Housing Strategy2011-2017
Map 2: Settlement Centres Population 2006
21Laois County Council Housing Strategy2011-2017
3.3 Regional Settlement Hierarchy
County Laois is part of the Midland Region, which also includes the Counties of Offaly, Westmeath and Longford. The Regional Planning Guidelines 2010-2022 for the
Midland Region sets out an overall Regional Settlement Strategy. While the populations of Offaly and Westmeath are larger than that of Laois, the population of Laois grew by
8,285 in the last inter census period. This was a larger increase than the other Counties and represented a 14.1% growth rate (while the average for the region was 11.6%).
The RPGs acknowledge that some parts of the region which lie close to the Greater Dublin Region (GDA) and its associated radial road (motorways) and rail lines are
effectively a part of the GDAs economic sphere of influence. The RPGs divided the region into five key areas – Central, Eastern, Southern, Northern and Western.
The strongest population growth occurred in the Eastern Region, which is located in proximity to the Greater Dublin Area.
Eastern Sub-Region
Within County Laois, the hinterland around Portarlington is included in the Eastern Sub-Region. The Eastern Development Area of the RPGs identifies just two Key Service
Towns – Edenderry (County Offaly) and Portarlington (County Laois). These areas are closest to the GDA. This area of the region continued to experience rapid population
and housing growth but has experienced a rapid fall off in development as a consequence of the economic downturn.
Southern Sub-Region
This area includes the bulk of County Laois (aside from Portarlington) the parts of the region along the M7/M8 road and rail routes associated with Portlaoise and Ballybrophy.
Patterns of development in this area have been consistent with the 2004 RPG‟s with Portlaoise being a particular focus for development.
The Midland Linked Gateway – comprising Athlone, Tullamore and Mullingar – is seen as a key driver of growth in the region. Key investment in infrastructure prioritises the
national secondary road network linking the gateway towns as the initial focus with additional concentration on enhancing links between the gateway and the principle towns of
Longford and Portlaoise. The public transport system between these towns is also a priority.
22Laois County Council Housing Strategy2011-2017
3.4 Settlement Hierarchy within Laois County
Having regard to the Eastern and Southern Development Areas of the Regional Planning Guidelines, the Settlement Hierarchy of the County can be summarized as follows –
Urban Core
Principal Town Portlaoise
Settlements and Rural Hinterland
Key Service Town Portarlington
Service Towns Abbeyleix, Mountrath, Stradbally, Graiguecullen, Mountmellick,
Local Service Towns Rathdowney and Durrow
Borris in Ossory, Ballylinan,
Villages >400 Population
Clonaslee, Ballinakill
Attanagh, Arles, Ballacolla, Ballybrittas, Ballyroan, Camross,
Castletown, Clough, Coolrain, Cullahill, Emo, Errill, Killenard,
VillagesLaois County Council Housing Strategy2011-2017
Having regard to the very significant growth rates that were experienced in the three largest towns – Portlaoise, Portarlington and Mountmellick (54%, 92% and 39%,
respectively), it is clear that the sphere of GDA influence extends significantly into the County. Most of the settlements that had the highest growth rates are situated in the
eastern half of the County, with the one exception of Borris-in-Ossory, which had a very low population base. Settlements in the south-east of the County – such as Abbeyleix,
Graiguecullen and Ballylinan have prospered due to their proximity to the County towns of Carlow and Kilkenny.
County Laois has a well-defined hierarchical settlement structure which is set within the over-arching regional context of the linked gateway – Athlone, Tullamore & Mullingar.
The Council wishes to reiterate the importance of the designation of Portlaoise as one of the Principal Towns (along with Longford) within the Midland Region. Portlaoise
provides the focus for attracting business and population to County Laois and the wider midlands region. It is supported by Portarlington, a designated Key Service Town which
has experienced strong growth over the last census period and has significant future development potential. The designated Service Towns of Abbeyleix, Mountrath,
Graiguecullen, Mountmellick, Stradbally, and the Local Service Town of Rathdowney and Durrow, play an important role in the urban hierarchy by contributing to population
growth and by providing vibrant, strong and local commercial centres. They are supported by a network of Villages and Rural Areas, the role of which is to strengthen small-
scale locally based enterprises and to encourage local level services and functions to revitalise smaller settlements and their outlying rural communities.
24Laois County Council Housing Strategy2011-2017
Map 3: Midland Region – Spatial Settlement Strategy (Midland Regional Planning Guidelines)
25Laois County Council Housing Strategy2011-2017
Map 4: Settlement Heirarchy and Regional Development Areas
26Laois County Council Housing Strategy2011-2017
3.4.1 Principal Town – Portlaoise
The principal commercial town and administrative capital of the County is Portlaoise. It commands a central location in County Laois and is served by an excellent road
network, notably the M7, M8 and N80 – in effect, it is situated at a National cross-roads. Portlaoise is the largest town in the County, with a population of 14,613 recorded for
the town and its environs in 2006. This is three times as big as the County‟s next largest town, Portarlington, which, in 2006, recorded a population of 5,054.
Portlaoise‟s level of primacy has increased dramatically in recent years, having grown by a remarkable 54% in the last two inter-censal periods (1996-2006). The factors driving
this growth relate to improved road (motorway) infrastructure and a regular and reliable rail service, both of which allowed Portlaoise to capitalise on relatively easy access to
the Greater Dublin Area. In the buoyant housing market of the Celtic Tiger years, a significant commuter population settled in Portlaoise.
The growth of Portlaoise is in keeping with the objectives of the NSS and the Midland Regional Planning Guidelines (MRPGs). These policy documents set out a settlement
hierarchy which focuses primarily on the development of a linked midland regional gateway encompassing Athlone, Mullingar and Tullamore, supported by the development of
the region‟s principal towns – Portlaoise and Longford. Growth is promoted in Portlaoise due to the good quality broadband communications, strong transport infrastructure,
including public transport, and significant employment opportunities and facilities. Furthermore, the NSS recognises the potential of Portlaoise as a key national transport node
with the capacity for associated economic and logistic activities. The Togher National Enterprise Park Masterplan, as incorporated into the Portlaoise LAP in April 2010, sets
out a vision for the delivery of a flagship national transport hub and inland port in the Portlaoise area. In addition, Irish Rail have opened their National Traincare Depot in
Togher which services their new Intercity fleet of trains. Portlaoise was chosen as the best location to build the facility because of its strategic position in relation to the Irish
Rail Intercity Rail Network.
3.4.2 Key Service Town – Portarlington
Portarlington lies within the Eastern Development Area of the Midland Region, reflecting the fact that it is just 74 kilometres from Dublin. In administrative terms, the town and
its urban area are divided between counties Laois and Offaly. It has experienced significant growth in recent years (55% in the inter-censal period 2002-2006), this growth has
been recognised by the MRPGs which designated Portarlington as a Key Service Town acting as an important driver of their local economy in areas that are comparatively
remote form the main population centres of the region providing vital, economic, administrative and social functions. The NSS states that smaller towns such as Portarlington
can be enhanced through physical and townscape improvements, water services, facilities for smaller enterprises and enhancements to road and bus networks, offering an
attractive environment for residential, employment, retailing and service functions. It is an objective of the Regional Planning Guidelines to consolidate residential development
in this area, thus ensuring a sequential approach to development.
3.4.3 Service Towns – Abbeyleix, Mountrath, Graiguecullen, Mountmellick and Stradbally
27Laois County Council Housing Strategy2011-2017
Both Abbeyleix and Mountrath are important strategic towns serving the south and west of County Laois. Abbeyleix is situated on the N77, to Cork, while Mountrath is situated
on the R445 to Limerick (and leading to the N21 to Tralee).
Graiguecullen, situated in the south east of the County, is essentially a suburban extension to Carlow Town, but situated within County Laois. It grew by over 106% during the
last two inter-censal periods (1996-2006), capitalising on its proximity to Carlow town.
Stradbally, has a population of 1,056, and is an attractive village best known for its Steam Rally and the Electric Picnic – an annual boutique music festival held at Stradbally
Hall. This settlement serves a more rural hinterland in their respective areas. Interestingly, Stradbally only grew by 0.8%, between 1996 and 2006, in a slight reversal of the
eastern dominance over the western part of the County.
3.4.4 Local Service Towns –Rathdowney and Durrow
Rathdowney and Durrow are both designated Local Service Towns serving the west and south of the County. Both towns play an important role in performing local residential,
retailing, social and leisure functions and providing local services to a wider rural hinterland. Population growth was particularly strong in both towns over the period 1996-2006.
The population of Rathdowney increased by (13.6%) to 1212 persons while Durrow recorded a population increase of 16.5% to 811 persons.
A limiting factor in the growth of both these settlements is the greater distance they lie from larger towns and the availability of infrastructure, specifically wastewater treatment
facilities.
3.4.5 Villages >400 population
At the next level of the County Laois Settlement hierarchy are the villages with populations greater than 400, such as Borris in Ossory, Ballylynan, Ballinakill and Clonaslee.
These provide local facilities such as schools, churches, sports centres, community halls and convenience retail shops, with low to medium level services for village residents
and surrounding rural populations. The continued growth of Laois‟ villages and rural areas is important for the balanced and sustainable development of the County. 2006
Census figures show that Laois still has a relatively high percentage of the labour force employed in the agricultural sector – 7%, in comparison to the state average (4.7%) and
the average for Leinster (2.6%). It is therefore apparent that Laois is a county which is still influenced by rural settlement trends and patterns.
28Laois County Council Housing Strategy2011-2017 3.4.6 Villages
Laois County Council Housing Strategy2011-2017

of the few exceptions to this is Borris-in-Ossory, which grew by 73% during the same period, to reach a population of 488. However, the very high growth rates of some of
these tertiary settlements, has to be considered in the context of very low base rates (such as 200-400 persons) in 1996.

3.6 Supply and Demand

This section of the Housing Strategy sets out the projections for households over the period of the plan and examines how this demand can be met through existing over-
supply and through the completion of incomplete developments.
The 2010 DoEHLG population projections estimate that the population of County Laois will grow by 10,000 persons up to 2018, bringing the county‟s population to 77,059
persons by 2018. This population growth equates to a need for an additional 4,166 household units in the County up to 2018.

Table 10: Extract from Table7, showing anticipated household formation up to end of Development Plan period.
 Year            Average Household Size (AHS)                Additional Households
 2007                            2.4                                    369
 2008                            2.4                                    369
 2009                            2.4                                    370
 2010                            2.4                                    370
 2011                            2.4                                    370
 2012                            2.4                                    369
 2013                            2.4                                    370
 2014                            2.4                                    370
 2015                            2.4                                    369
 2016                            2.4                                    370
 2017                            2.4                                    235
 2018                            2.4                                    235
 Total                                                                 4,166

                                                                                                                                                                     30
Laois County Council Housing Strategy2011-2017
A key factor to be considered in the evaluation of future demand for housing and in turn future land required to accommodate future development, is the amount of vacant
properties that exist on the market and that are likely to be made available for occupancy. According to the 2006 Census, there was a vacancy rate of 15.7% in the County,
including holiday homes.
Excluding holiday homes, the average vacancy rate within the County over the three Census periods 1991, 1996 and 2002 was 8.5%. Whereas this had increased to 15.28%
by 2006, excluding holiday homes.
2006 CSO - Unoccupied Units = 4,240
Less 103 Holiday Homes = 4,137
The level of vacancy is likely to have risen since 2006, as more units were completed and market driven demand decreased. It would not be unreasonable, therefore to
assume that there are still at least 4,137 unoccupied units, of which a significant proportion of which are available to meet future demand. In a more „normal‟ market (as
existed in 1991, 1996 & 2002), with a vacancy rate of approximately 8.5% of properties, this would imply that there would be approximately 1,836 units available to meet future
housing demand.
In 2010, the National Building Agency Ltd. carried out a survey of all incomplete developments in the County. This study found that there were approximately 789 incomplete
units in the County (at varying stages of incompletion), with a further 2,625 which had been granted at these sites but to date had not commenced construction.
The projected demand for new housing units is 4,166 over the period of the plan (Table 10). Taking these factors– typical vacancy rates/surplus housing units, incomplete
units and units yet to be built into consideration – it is clear that these factors should be considered in determining future housing supply. This is outlined in the Table 11 below.
31Laois County Council Housing Strategy2011-2017
Table 11: Housing Demand
Projected Household Demand (from 2010 to 2018; 4,166
note period of the plan will be from 2012 to 2018),
Less surplus housing/unoccupied units (derived
from the difference between traditional vacancy rates -1,836
and current vacancy rates)
Less Incomplete Units from NBA survey
(this assumes that 90% of all incomplete units will at
some stage be completed; the remaining 10% may -711
not be complete or may account from demolition of
incomplete estates)
Less 2,625 units granted planning permission but -2,625
which have not been started.
Balance -1006
The current number of granted units in existing planning permissions, where development has started, would be sufficient to meet the projected demand, over the plan period.
This assumes that the finance would become available to satisfactorily complete these estates and that the units available would remain desirable for prospective purchasers
(it is still more likely that existing planning permissions for developments would have a better chance of being developed out and completed, rather than new finance being
provided for completely new developments).
Another factor to consider is the likely amount of one-off housing units that might be built over the period of the Development Plan. Between 01/01/2004 and 11/08/2009, there
were approximately 2,284 one-off houses granted planning permission in County Laois. It is therefore possible that between the existing surplus on the market, the incomplete
units (which could be finished off) and one-off housing, that of the future housing demand could be provided for, with no requirement for additional zoned land.
32Laois County Council Housing Strategy2011-2017
In projecting the future household projections on a town by town or settlement by settlement basis, and in turn the demand for future zoned lands, consideration should be
given to number of incomplete units and granted planning permissions in each of those settlements – particularly those with the highest number of incomplete units and
granted planning permissions. These are outlined on Table 12.
33Laois County Council Housing Strategy2011-2017
Table 12: Number of Incomplete Units in each town and Number of Units which have been granted planning permission but which have not commenced to
construction on incomplete developments; compared with total amount of Zoned Land.
Number of Remaining
No. of Total and Local Authority Zoned land Total amount of zoned serviced land that
Units which have been
Incomplete which could be developed for residential is currently under-going development or
granted planning on
Units development is ready for development
incomplete sites
Hectares % of County Total Hectares % of County Total
Principal Town
Portlaoise 317 954 346.70 22.38% 38.04 25.47%
Key Service Towns
Portarlington 117 212 93.76 6.05% 33.39 22.35%
Service Towns
Abbeyleix 0 0 158.29 10.22% 2.19 1.47%
Graiguecullen 64 895 75.56 4.88% 10.63 7.12%
Mountmellick 36 104 177.84 11.48 % 7.71 5.16%
Mountrath 58 79 111.64 7.21% 0.92 0.62%
Stradbally 84 28 83.39 5.38% 18.77 12.57%
Local Service Town
Rathdowney 5 11 115.16 7.43% 0.70 0.47%
Durrow 2 0 68.47 4.42% 4.80 3.21%
34Laois County Council Housing Strategy2011-2017 Villages >400 Population Ballinakill 1 1 16.03 1.03% 0 Ballylynan 9 129 17.95 1.16% 10.45 7.00% PoPoPoPopulation Borris in Ossory 40 163 48.32 3.12% 5.31 3.55% Clonaslee 0 0 13.23 0.85% 0 Villages
Laois County Council Housing Strategy2011-2017
From Table 12, it is possible to see the towns which have the highest level of incomplete units and those where significant development has been granted and yet to be
constructed on incomplete housing estates. Interesting observations can be made, when these figures are compared to the amount of land zoned and the relative position of
each town and village on the Settlement Hierarchy. These include –
Most of the future demand for housing could be met through existing unoccupied units, the completion of existing incomplete units and unfinished housing estates (as
outlined above) and therefore, there is an excess amount of land that is currently zoned. Even accounting for „headway‟, the demand for additional zoned land is likely
6
to be no more than 10% of the 1,549.11 hectares currently zoned.
The amount of land that is zoned and serviced is likely to be sufficient to meet the demands of the period of the plan when all factors are taken into account, though
there may be a demand to service additional lands in the towns of Abbeyleix, Mountrath and possibly Mountmellick. Development in Abbeyleix and Mountrath in
particular, should be encouraged and maintained so as to address the emerging east-west divide in the County – initiatives to encourage economic initiatives should
be encouraged so as to ensure a balance between employment opportunities and residential development.
A comparison between different service towns and the total amount of land which is zoned in each settlement, reveals that if each town is on the same hierarchic
level, then there should be greater consistency in relation to the amount of land zoned in each of these settlements. The amount of land zoned in three of the Service
Towns exceeds that which is zoned in the Key Service Town of Portarlington.
Rathdowney is just a Local Service Town, yet the amount of land zoned there exceeds that of three of the Service Towns (note, the amount of land zoned in
Rathdowney is sufficient to meet the demands of the entire County over the period of the plan). However, it is noted that Rathdowney would benefit from additional
water and/or wastewater services, as just 0.70 hectares are currently serviced.
The capacity of zoned land in Durrow, Killenard and Ballyroan should be reduced and spread more evenly among the other minor villages and settlements in the
County.
These factors will have implications for the future Local Area Plans that are prepared for these areas.
6
The Development Plan Guidelines (DoEHLG, 2007) state that local authorities should ensure that at the time of making a Development Plan, enough land should be made available to meet
residential needs for at least the next nine years. This means that more land than is necessary should be zoned, which would take into account the potential non-release of lands, avoidance of
monopoly in the market and delays in servicing some sites over others. This additional zoned land is referred to as „headway‟.
36Laois County Council Housing Strategy2011-2017
3.7 Wastewater and Water Supply Infrastructure
3.7.1 Waste Water Capacity and Demand
There are existing and potential deficiencies in the sewerage treatment facilities of towns and villages throughout County Laois. The situation is however particularly pressing in
Portarlington, Mountmellick and in the five so called Grouped Towns of Abbeyleix, Durrow, Mouthrath, Stradbally and Rathdowney where a moratorium on development of a
substantial nature is in place for the foreseeable future, irrespective of the wider economic climate. Many of the projects are focused on the main population centres and the
medium to lower order settlements.
Portlaoise currently has spare capacity of 14,351 PE (Population Equivalent). Abbeyliex and Mountrath also have spare capacity at 164 PE and 431 PE respectively.
Portarlington has a current shortfall in capacity of 3,480 PE; however, an upgrade is imminent. Stradbally and Mountmellick are identified as currently having shortfalls in
capacity while Rathdowney is operating at over capacity.
3.7.2 Water Supply Capacity and Demand
Potential water supply deficiencies in terms of quality, quantity and security of supply exist for many towns and villages in Laois. Those towns and villages under the greatest
pressure include, Portlaoise, Mountmellick, Portarlington, Durrow, Graiguecullen, Ballyroan and Newtown Doonane. A number of these towns have been included in the
Proposed Water Supply Schemes 2010-2012, see Table 13 below.
Table 13: Proposed Water Supply Schemes 2010-2012
Location Proposal
Portlaoise and Mountmellick Water Supply Scheme Construction of 10 new wells, 12 kms. Of new watermains, new reservoirs at Emo, Straboe,
and Acragar and extended capacity at Kilminchy Water Treatment Plant.
Portarlington Water Supply Scheme Development of 3 new wellfields at Lough, Doolough, and La Bergerie, water treatment
plant cum reservoir at Carrick Hill and approx. 3 kms of distribution mains.
Graiguecullen Development of 2 new wells, reservoir and treatment plant and watermains.
Ballyroan Development of 1 new source and watermains.
37Laois County Council Housing Strategy2011-2017
The Principal Town of Portlaoise is supplying more water than its water treatment plant is designed to treat with a shortfall of 2,000m³/day. The town‟s severely overstretched
water treatment plant is due to be upgraded in the future. It is envisaged that the Portlaoise/Mountmellick Water Supply Scheme will develop new water sources to supply
Portlaoise and subsequently double the town‟s water supply capacity. Portarlington is supplying more water than designed to treat with a shortfall of 250m³/day. There are
proposals to upgrade the existing water treatment plant at Portarlington.
38Laois County Council Housing Strategy2011-2017
4.0 Housing Affordability
4.1 Introduction
The aim of this section of the Strategy is to analyse the affordability of housing in County Laois over the period of the next Development Plan, 2011-2017. This will enable the
identification of the numbers of persons and households who will be eligible for social and affordable housing. The calculation of housing affordability is based on Section 93 of
the Planning and Development Act 2000, which defines an eligible person for affordable housing as someone:
“who is in need of accommodation and whose income would not be adequate to meet the payments on a mortgage for the purchase of a house to meet his or her
accommodation needs because the payments calculated over the course of a year would exceed 35 per cent of that persons annual income net of income tax and pay
related social insurance”
In keeping with the methodology outlined in the DoEHLG Model Housing Strategy Guidelines (2000), data has been gathered on Household Incomes and House Prices.
4.2 Affordability - Household Incomes
4.2.1 Compilation of Data on Household Incomes
In order to estimate housing demand in Laois, it is essential to ascertain the level of disposable household income available in the County. Income levels are a key determinant
of affordability. Compilation of data on income distribution will provide the basis for housing affordability analysis. Income figures for the County were derived from the following
sources:
The EU Survey on Income and Living Conditions (2007)
County Incomes and Regional GDP, 2006 (CSO, 2009)
The ESRI Medium Term Review 2008-2015
The Quarterly Economic Commentary (Spring 2009)
CSO Census of Ireland 2006
ESRI “Recovery Scenarios for Ireland” Research Series Number 7 (May 2009)
International Monetary Fund Country Report (June 2009)
The ESRI Quarterly Economic Commentary (Spring 2010)
39Laois County Council Housing Strategy2011-2017
4.2.2 Level of Disposable Income in County Laois
The CSO publication County Incomes and Regional GDP 2006 (published in February 2009) provides data on disposable income per person. The survey indicated that in 2006
County Laois had one of the lowest levels of disposable income per person in the Country; representing 89.5% of the state average, which is lower than that of the Midland
region (90.57% of the state average). Furthermore, Table 14 shows that the 2006 figure for disposable income in Laois represents a slight decrease from 2005 (89.8%), which
in turn is a decrease from 2004 (89.9%).
Table 14: Disposable Income per person (Source: County Incomes and Regional GDP, 2006 (CSO, 2009)
Region
2000 2001 2002 2003 2004 2005 2006
Laois 12,140 13,632 14,771 16,017 16,837 17,829 18,512
Midland Region 12,402 14,017 15,360 16,572 17,126 18,215 18,730
State 13,967 15,885 17,023 18,117 18,725 19,845 20,678
Midland Region as % of State
88.79 88.24 90.23 91.47 91.46 91.78 90.57
average
Laois as % of State average 86.91 85.81 86.77 88.40 89.91 89.84 89.52
Graph 4 illustrates the gap that exists between the level of disposable income available in County Laois in comparison to that available elsewhere in the Midland Region, and in
the State as a whole.
40Laois County Council Housing Strategy2011-2017
Graph 4: Income Analysis 2000 - 2006 (Source: www.cso.ie)
Disposable Income per Person
25,000
20,000
15,000
Laois
10,000 Midland Region
State
5,000
0 State
2000 2001 Midland Region
2002 2003 Laois
2004 2005
2006
4.2.2 Level of Disposable Income in County Laois
The EU Survey on Income and Living Conditions (SILC) is an annual survey conducted by the CSO to obtain information on the income and living conditions of different types
of households. It also collects information on poverty and social exclusion. A representative random sample of households throughout the country was derived to provide the
required information. The data outlines national gross and net weekly disposable incomes arranged in income categories (deciles). In the absence of any other appropriate
data, the most recent SILC (2007) will be used to estimate the distribution of disposable household income in County Laois.
For the purpose of the Strategy, an income deflator of 0.895 (based on the fact that disposable income per person in County Laois is 89.5% of the state average) has been
used to determine the likely disposable income within the County. This is shown in Table 15 which illustrates the percentage of Laois households in each income category
(deciles).
41You can also read