CAMBRIDGE CITY COUNCIL OUTDOOR PLAY INVESTMENT STRATEGY 2016 2021 - Prepared in September 2015 by Ashley Godfrey Associates 2, Fanhams Hall Road ...
←
→
Page content transcription
If your browser does not render page correctly, please read the page content below
CAMBRIDGE CITY COUNCIL

OUTDOOR PLAY INVESTMENT
STRATEGY 2016 – 2021

Prepared in September 2015 by

Ashley Godfrey Associates
2, Fanhams Hall Road
Ware
Hertfordshire
SG12 7NN

Tel:   01920 466601
E-mail ashley@ ashleygodfrey.co.uk
Cambridge City Council Outdoor Play Investment Strategy

CONTENTS                                                  PAGE No

        Executive Summary                                      3

1.      Strategic Vision & Aims                                4

2.      Background                                             6

3.      The Case for Play.                                     8

4.      The Strategy in Context.                               9

5.      Cambridge City Population Profile.                     11

6.      Financial Considerations                               24

7.      Auditing the Play Provision of Cambridge               27

8.      Quality of Outdoor Play Spaces.                        32

9.      Key Issues.                                            42

10.     Recommendations.                                       43

APPENDICES
APPENDIX A: PROJECT BRIEF
APPENDIX B: LOCAL STRATEGIC CONTEXT
APPENDIX C: WARD LEVEL CHILD POPULATION PROJECTIONS
APPENDIX D: PLAYABLE SPACE QUALITY ASSESSMENT TOOL
APPENDIX E: QUALITY ASSESSMENT OF CAMBRIDGE OUTDOOR PLAY SPACES

Ashley Godfrey Associates                                           2
Cambridge City Council Outdoor Play Investment Strategy

Executive Summary

This strategy provides a framework to steer future outdoor play provision and associated
investment decisions.

The strategy has been informed by a detailed audit of outdoor play provision including an
assessment of quantity, quality and accessibility against current and future population
growth. The results of this assessment have been used to identify deficiencies in provision in
terms of quantity, quality and accessibility.

The strategy has been developed in consultation with both internal and external
stakeholders including senior officers of the Council whose responsibilities relate to
children's and young people's play provision.

The strategy makes recommendations which aim to maximise the use of available resources
and associated future investment opportunities to deliver high quality, high value, well used
outdoor play provision for children and young people over the period 2016 to 2021.

Ashley Godfrey Associates                                                                   3
Cambridge City Council Outdoor Play Investment Strategy

1         Strategic Vision and Aims

1.1       Vision
          Play is a fundamental right1 and need for the health and well-being of children and
          young people, and is crucial in shaping their development and learning. Cambridge
          City Council will support and promote investment in the sustainable provision of good
          quality, high value outdoor play, which meets the needs of the city’s children and
          young people through the implementation of this strategy over the period 2016-2021.

1.2       Aims
          In pursuit of this vision, the Council will focus on the following strategic aims:

          a) To sustain the provision of good quality/ high value outdoor play across the city;
          b) To provide equitable access to good quality/ high value outdoor play provision for
             all sections of the community;
          c) To target investment in the provision of high quality/ high value/ low cost outdoor
             play provision to address current deficiencies, both in terms of quantity and
             quality;
          d) To fully engage local children, young people and their families in the review and
             decision making process surrounding the provision of outdoor play; and
          e) To ensure outdoor play provision, especially on new development sites, is good
             quality/ high value and meets the needs of the catchment community.

1.3      Play Statements
         Underpinning these aims, the Council will continue to pursue and promote the
         following seven ‘Play Statements’ from the Cambridge Play Strategy2.

          a) We are committed to making sure that all children have access to rich,
             stimulating environments that offer challenge and provide opportunities to take
             ‘acceptable’ risks
          b) We understand that children and young people need opportunities to play on their
             own but, also very importantly with others
          c) We believe that children and young people enjoy a range of play opportunities
             but that the built environment is not always conducive to safe or accessible play.
             We will work alongside partner organisations to ensure that good quality play
             provision in new communities is prioritised
          d) We are committed to ensuring that environments, services and provision for play

1   UN Convention on the Rights of the Child
2   Cambridge City Neighbourhood Play Strategy For Children and Young People 2007 - 2012

Ashley Godfrey Associates                                                                         4
Cambridge City Council Outdoor Play Investment Strategy
are fun, child friendly, welcoming and accessible to all children and young people
e) We will provide good quality play opportunities that support and promote children
and young people’s health and well being
f) We will continue to actively involve children and young people when developing
all of our play opportunities and play spaces and engage with them other issues
of local interest and importance that relate to their lives
g) Play facilities for children and young people will comply with all legislative
requirements and be ‘safe enough’
Ashley Godfrey Associates 5Cambridge City Council Outdoor Play Investment Strategy
2. Background
2.1 Purpose and Scope
The purpose of this strategy is to review the Council’s outdoor play provision and
inform and guide its future investment and development over the period 2016-21.
The aim is to reduce maintenance costs whilst sustaining and where possible
improving the quality of the ‘play offer’. In pursuing this strategy, the Council will
ensure there is no loss of existing public open space.
Guidance provided by Play England has been followed in the preparation of this
strategy3.
The strategy has been developed in accordance with the brief in Appendix A.
2.2 Framework of the Strategy
The strategy starts by defining play and demonstrating its value and significance for
children and young people and the contribution it makes to wider agendas.
It then goes onto outline the local and strategic context for the strategy provides the
direction for the development of the strategy. At the local level the strategy needs to
address a number of cross cutting issues such as health and wellbeing and anti-
poverty. In addition, there is a need for an understanding of the wider policy context
within which the play investment strategy will need to be implemented.
An audit of outdoor play spaces in Cambridge includes assessments of quality. The
audit informs an analysis of provision relative to needs and the population.
Consideration is given to the extent to which the existing stock of play areas meet the
needs of the catchment community and to any deficiencies in provision in terms of
quantity, quality and accessibility.
A review of the financial considerations looks at the annual revenue budget for
maintaining the play spaces and the capital resources required to undertake major
repairs and renewal of existing play areas which are reaching the end of their
lifecycle. Management issues are covered including the need for regular inspection,
routine maintenance, equipment and surfacing repair and minor replacements.
In addition the planning of new provision as part of new housing development is
considered along with the requirement for financial contributions to upgrade existing
play areas close to new development sites.
The strategy has been developed in consultation with both internal and external
stakeholders including senior officers of the Council whose responsibilities relate to
play provision, and children and young people.
3Planning for Play: Guidance on the development and implementation of a local play strategy, 2006 and
Embedding the Play Strategy 2010.
Ashley Godfrey Associates 6Cambridge City Council Outdoor Play Investment Strategy
2.3 Defining, What is Play?
‘Play’ has been defined4as, freely chosen, personally directed and intrinsically
motivated behaviour that actively engages the child or young person (inc. age range
covered). This definition is widely recognised and understood in the play sector; in
lay terms children are playing when they are doing what they want to do, in the way
they want to and for their own reasons.
The term ‘play provision’ is used to describe settings where the primary aim is for
children to play. Play England’s objective5 for good play provision has been
summarised as the delivery of play provision that is accessible, welcoming and
engaging for all children and young people including those who are disabled or have
specific needs and wishes; it is acknowledged that children and young people of
different ages have different play interests and needs.
This strategy is concerned principally with dedicated outdoor playable spaces which
are mostly equipped, although children often play in spaces with no specific play
equipment. In general, play provision is considered to be open access where
children can come and go as they please. A study carried out by the Joseph
Rowntree Foundation in 19966 found that just 12% of outdoor play by children occurs
in equipped play areas; in contrast, nearly half of all play was at that time in the street
or on the pavement and 18% in public open space including amenity space, showing
that this type of provision offers significant potential for children’s play.
Outdoor play spaces are predominantly located in parks, recreation grounds, playing
fields and other public open spaces or in housing estates, where they have been
designed as part of the development plan, or included when the area has been re-
developed or renovated.
4 Children’s Play Council (2002) Making the Case for Play
5 Tools for evaluating local play provision: A technical guide to Play England local play indicators. Ashley Godfrey
Associates and INSPIRE. October 2009
6 Child’s Play: facilitating play on housing estates; Rob Wheway and Alison Millward, JRF 1997
Ashley Godfrey Associates 7Cambridge City Council Outdoor Play Investment Strategy
3. The Case for Play
Good play experiences enrich children’s lives in a number of ways and have wider
benefits for health, well-being and learning and development. Play can also bring
benefits to other agendas including education, the environment and the community.
3.1 Health and Well-Being
Play fosters both physical and psychological health and well-being in children. Play
gives children opportunities for physical play exercise and supports psychological
well-being through increasing confidence levels, satisfaction, pride and sense of self-
worth and as a result self-esteem.7 The Chief Medical Officer noted8 that “active play
involving carrying, climbing, rough and tumble will help develop and maintain
muscular fitness and flexibility”
3.2 Child Development
Play also helps children’s social development through learning to cooperate with
other children, sharing and taking turns. Children can also learn how to resolve
conflicts with other children and to develop team work and leadership skills such as
the control of impulses and aggressive behavior. They also learn to express
themselves through play both verbally and non-verbally. 9
7 Play and health: making the links, Policy Briefing 3, Play England, 2008.
8 Chief Medical Officer (2004) At Least Five a Week: Evidence on the impact of physical activity and its
relationship to health, Department of Health.
9 Casey, T. (2002) Play Inclusive Action Research Project, The Yard. Ludvigsen, A., Creegan, C. and Mills, H.
(2005) Lets Play Together: Play and inclusion evaluation of better play round three, Barnardo’s. Woolby, H.,
Armitage, M., Bishop, J., Curtis, M. and Ginsberg, J. (2006) Informing Change: Inclusion of disabled children in
primary school playgrounds, Joseph Rowntree Foundation.
Ashley Godfrey Associates 8Cambridge City Council Outdoor Play Investment Strategy
4. The Strategy in Context
This section examines relevant local and national policies and strategies.
4.1 Children's right to play
The right to play (and informal recreation), for all children and young people up to 18
years of age, is enshrined in Article 31 of the UN Convention on the Rights of the
Child, ratified by the UK Government in 1991. The Government and the Council has
a duty under this convention to protect and promote play opportunities for all children
and young people.
4.2 Strategic Context
In response to the growing demand for better play opportunities, in 2008 the
Government recognised the importance of play to child development and produced a
national play strategy10 which set out plans to improve and develop play facilities for
children throughout the country. The strategy identified the importance of free play,
particularly outdoors, as being fundamental to children's learning, healthy growth and
development.
More recently the All Party Parliamentary Group (APPG) on ‘A Fit and Healthy
Childhood’ has produced a report, ‘The Early Years’11. The APPG contends that play
is an integral component of child health and wellbeing and recommends that the
government:
revises the 2008 National Play Strategy12
introduces statutory performance measures of children’s play using EU indices of
child health and wellbeing
establishes a standard for the amount of time that children should play during
their early years and at school
fosters child-friendly communities through planning
Guidance produced by Play England, ‘Better Places to Play Through Planning'13 aims
to support local planning and transport authorities to develop and implement planning
policy that ensures children and young people have access to high quality playable
spaces close to where they live and spend their time.
4.3 Play England typology
Play England has developed a typology of play spaces.14 This defines play provision
as spaces and facilities that are free of charge, where children are free to come and
10 The Play Strategy. DCFS and DCMS 2008.
11 ‘The Early Years’, A report of the All Party Parliamentary Group on A Fit and Healthy Childhood, 2015.
12 The APPG is currently preparing a report on a revised strategy, to be published in summer 2015
13 Better Places to Play Through Planning. Play England 2008.
14 Tools for evaluating local play provision: A technical guide to Play England local play indicators. Ashley
Godfrey Associates 2009
Ashley Godfrey Associates 9Cambridge City Council Outdoor Play Investment Strategy
go (other than where safety is an issue for children with particular needs), and where
they are free to choose what they do – the so-called “three frees”. The typology of
play spaces is shown in Table 4.1
Table 4.1: Play England Typology of Play Spaces
Walking
Type of Play Space Description Distance
(metres)
Type A: ‘Door-step’ A small space, within sight of home,
spaces and facilities for where children, especially young
100
play and informal children can play within view of known
recreation adults.
A larger space which can be reached
Type B: ‘Local’ spaces safely by children beginning to travel
and facilities for play independently and with friends, without 400
and informal recreation accompanying adults and for adults with
young children to walk to with ease.
A larger space or facility for informal
Type C:
recreation which children and young
‘Neighbourhood’
people, used, can get to safely and
spaces and facilities for 1,000
spend time in play and informal
play and informal
recreation with their peers and have a
recreation.
wider range of play experiences.
NB The Play England typology is the accepted national approach to the classification of
play spaces and has been applied to outdoor play spaces in Cambridge and used in
the development of this strategy.
4.4 Local Context
This strategy takes account of and is informed by key Council strategies and these
have been used in formulating the recommendations. The relevant documents
include:
The Council’s Vision for Cambridge and the seven themes for the achievement of
the Vision;
Cambridge Local Plan 2014 – Draft Submission Plan;
Sports & Physical Activity Action Plan 2015 – 2017;
Cambridge City Neighbourhood Play Strategy For Children and Young People
2007 – 2012;
Cambridge Anti-Poverty Strategy 2014-2017; and
Cambridge Parks - Managing the City’s Asset 2010 to 2014.
A summary of these documents can be found in Appendix B.
Ashley Godfrey Associates 10Cambridge City Council Outdoor Play Investment Strategy
5. Cambridge City Population Profile
5.1 Demographics
In the short term Cambridge is likely to experience significant population growth. The
projections15 indicate that the population of 132,000 in 2014 will carry on rising for at
least the next decade, adding about another 20,000 people in that time. However, in
the longer term, the projections suggest that the city’s population may start to fall
slightly in about twelve years’ time. It’s also interesting to note that it’s the younger
age bands that are set to reduce the most. Details of the population projections
broken down into age groups can be found in Appendix C.
It’s clear from Chart 5.1 below that the bulk of the population growth over the next
few years is expected in Castle and Trumpington wards, which each contain major
housing developments..
Chart 5.1: Population Growth in Cambridge Wards 2011 – 2031.
Chart 5.1 shows that the population is projected to increase steadily while the growth
sites are being built out. Empirical evidence from other large housing development
supports the view that during this phase the population will increase with the arrival
of new households to take up the new housing. The age structure of those moving
15Source: Population forecasts by ward and age, 2011 to 2036: Cambridge City, Research Group,
Cambridgeshire County Council 2015.
Ashley Godfrey Associates 11Cambridge City Council Outdoor Play Investment Strategy
into the development is likely to be relatively young and the average household size
will initially be high.
Once the housing development is complete, there will be some in- and out-migration
however the concentration of initial occupiers that had young families when they first
arrived will move into middle age. As a greater proportion of the population falls into
older age bands, the average household size will decline and so the size of the
population also declines. The population of the Growth Sites will become more like
the population of the mature surrounding settlements.
Because the population is initially young, the number of children is relatively high.
The child yield i.e. the number of children aged 0 to 15 years per household is initially
much higher in new developments compared to more mature settlements but drops
back in the longer term. This is shown in Chart 5.2 below.
The long-term context for the population projections is one in which the UK
population is aging and the number of childless households will increase, and so the
Cambridge child yield numbers is likely to decline in the longer term. Gradually, over
time, the age profile of the new developments will be similar to that in surrounding
areas of the City.
The child population figures used for Chart 5.2 are based on the population forecasts
by ward and age for Cambridge City produced by the Research Group at
Cambridgeshire County Council16. It was not considered appropriate to use the
Office of National Statistics (ONS) projections because these are are trend-based,
which means assumptions for future levels of births, deaths and migration are based
on observed levels. ONS population projections are not forecasts and, as such, do
not attempt to predict the impact that development might have on demographic
change. The Cambridgeshire County Council forecasts take account of the increase
in population resulting from known development proposals including the Northern
Fringe West Development and the Southern Fringe development.
The ward level changes in child population mirror those in Chart 5.2 for the total
ward population. The detailed child population projections for wards, broken down
into three age groups, can be found in Appendix C.
16Population forecasts by ward and age, 2011 to 2036: Cambridge City, Research Group, Cambridgeshire
County Council 2015.
Ashley Godfrey Associates 12Cambridge City Council Outdoor Play Investment Strategy
Chart 5.2 Changes in Ward Child Population 2013-2031
4000
Abbey
3500 Arbury
Castle
3000
Cherry Hinton
2500 Coleridge
East Chesterton
2000 King`s Hedges
Market
1500 Newnham
Petersfield
1000 Queen Edith`s
Romsey
500
Trumpington
West Chesterton
0
2013 2016 2021 2026 2031
Source: Based on population forecasts by ward and age, 2011 to 2036: Cambridge City, Research
Group, Cambridgeshire County Council 2015.
Table 5.2: Child Population by Ward (Ranked)
2013 0-5 6-10 11-15 Total
Abbey 896 530 569 1995
King's Hedges 755 475 509 1739
East Chesterton 716 480 509 1705
Cherry Hinton 753 465 475 1693
Queen Edith's 576 480 570 1626
Coleridge 600 450 556 1606
Trumpington17 573 465 514 1552
Arbury 662 410 470 1542
West Chesterton 516 380 431 1327
Romsey 599 295 426 1320
Castle18 330 200 690 1220
Petersfield 433 315 463 1211
Newnham 273 265 565 1103
Market 196 130 496 822
TOTAL 7870 5350 7250 20470
Source: Based on population forecasts by ward and age, 2011 to 2036: Cambridge City, Research
Group, Cambridgeshire County Council 2015.
17 Includes Southern Fringe Development
18 Includes Northern Fringe West Development
Ashley Godfrey Associates 13Cambridge City Council Outdoor Play Investment Strategy
Table 5.2 shows the child population in all of Cambridge’s wards in 2013, split into
the three age bands. There are currently 20,470 children and young people under
the age of 16 in Cambridge or 16% of the total population. In terms of absolute
numbers of children and young people under the age of 16, Table 5.3 shows that the
ward with the largest number of children under 16 is Abbey with 1995 which
represents 19.6% of the total population, the highest proportion of all wards. The
second largest number of children is in King’s Hedges with 1,739 children or 18.5%
of the total ward population. The ward with the lowest number and proportion of
children is Market with just 822 children or 11% of the total ward population.
The type of play provision provided will depend on the age and abilities of the
children who are likely to use the play equipment provided. The Play England
typology recommends that small spaces near housing (Type A spaces), specifically
designed for play might have some small items of equipment for children up to five
years old or alternatively the focus could be on the landscape setting, with an
emphasis on natural features rather than on fixed equipment. A playground with a
larger range of equipment, say, four to eight items possibly with space for ball games
is likely to be aimed at 5–11s (Type B space). Finally, facilities for older children and
teenagers (Type C spaces) are likely to have additional equipment which is
challenging to older children and may have a Multi-Use Games Area (MUGA) and/or
wheeled sports facilities. These sites will serve a considerably wider area than that
for the younger age groups.
Ashley Godfrey Associates 14Cambridge City Council Outdoor Play Investment Strategy
Table 5.3: Numbers and proportion of children and young people under the age of 16
in each ward.
Proportion of total
Population under 16
Ward children under 16 in
(2013)
population
Abbey 1995 19.6%
King`s Hedges 1739 18.5%
East Chesterton 1705 17.6%
Cherry Hinton 1693 18.8%
Queen Edith`s 1626 17.5%
Coleridge 1606 16.6%
Trumpington 1552 17.2%
Arbury 1542 16.6%
West Chesterton 1327 15.1%
Romsey 1320 14.2%
Castle 1220 11.8%
Petersfield 1211 14.2%
Newnham 1103 13.6%
Market 822 11.0%
Total 20470 16.0%
Source: Local Authority Population Forecasts by Age, 2011 to 2036, Research Group, Cambridgeshire
County Council, 2015
By 2031 it is projected that the City’s child population will have increased to 26,890
or 18% of the total population. Table 5.4 and Chart 5.1 show how this group is
projected to change over the next sixteen years. In the period 2016 to 2020, the child
population is estimated to increase by 3,020 (12.8 %) to 26,320 by 2021 and then by
750 (2.8%) to 27,320 by 2026. The child population is then projected to decline by
430 (-1.6%) by 2031. Overall it is projected that the number of children aged 0-15
years will have increased by 5,350 (24.8%) in the period 2013 to 2031.
Table 5.4: Changes in Population of Children & Young People in Cambridge 2014-
2031
Age Group 2013 2016 2021 2026 2031
Children 0-5 7,870 8,490 9,310 9,280 8,870
6-10 year olds 5,350 5,950 7,050 7,400 7,350
11-15 year olds 8,320 9,110 10,120 10,640 10,670
Total 0-15 Years 21,540 23,550 26,570 27,320 26,890
Source: Based on population forecasts by ward and age, 2011 to 2036: Cambridge City, Research
Group, Cambridgeshire County Council.
Ashley Godfrey Associates 15Cambridge City Council Outdoor Play Investment Strategy
The growth in the numbers of children and young people in the period 2015 to 2020
will require additional play and informal recreation provision to meet the needs of the
existing and future population.
Chart 5.1: Change in Numbers of Children 0-15 years 2013 to 2031
30000
25000
20000
15000
10000
5000
0
2013 2016 2021 2026 2031
0-5 6-10 11-15
Ashley Godfrey Associates 16Cambridge City Council Outdoor Play Investment Strategy
5.2 Health & Deprivation
The health of children in Cambridge is generally higher than the England average.
Deprivation is lower than average, however about 14.9% (2,475) children live in
poverty compared to the England average of 19.2%. In Year 6, 16.1% (124) of
Cambridge’s children are classified as obese which is better than the average for
England of 19.1%.
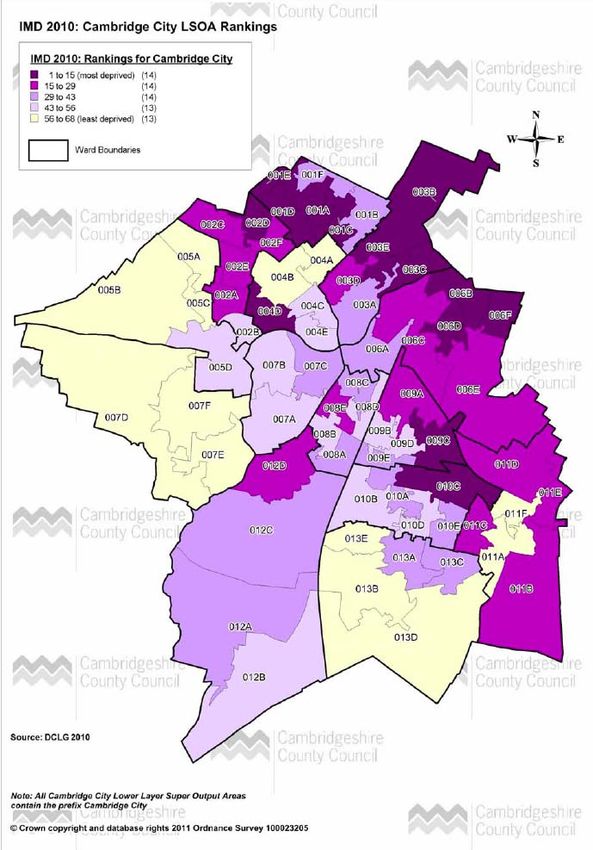
The Index of Multiple Deprivation 2010 (IMD) is a single measure of deprivation
which brings together seven different individual indices relating to income;
employment; education, skills and training; housing; crime; and living environment.
As Map 5.1 shows, the IMD identifies there are two areas within Kings Hedges which
fall within the 20% most deprived areas in the country. There are a further 18 areas
in the city which are amongst the 40% most deprived areas nationally.
As Table 5.5 and Map 5.1 show, seven of Cambridge’s 14 wards contain the
district’s most deprived LSOAs (Local Super Output Areas). Most of those wards and
LSOAs are located in the north and east of the city. King’s Hedges ward contains the
largest number of Cambridge’s 20% most deprived LSOAs, with four. It is made up of
six LSOAs in total.19
19Deprivation in Cambridgeshire Index of Multiple Deprivation 2010 Brief report prepared by Cambridgeshire
County Council Research Group, May 2011.
Ashley Godfrey Associates 17Cambridge City Council Outdoor Play Investment Strategy
Table 5.5: 20% most deprived LSOAs in Cambridge
National Rank 2010
National Rank 2007
% National Rank
District Rank
LSOAName
IMD Score
Change
Ward
1 Cambridge 001E King's Hedges 35.80 5942 18.3% 7353 -1411
2 Cambridge 001D King's Hedges 35.19 6152 18.9% 7985 -1833
3 Cambridge 006F Abbey 33.41 6769 20.8% 8223 -1454
4 Cambridge 006D Abbey 33.03 6925 21.3% 9494 -2569
5 Cambridge 001A King's Hedges 32.55 7111 21.9% 7377 -266
6 Cambridge 003B East Chesterton 30.55 7949 24.5% 9242 -1293
7 Cambridge 002D Arbury 30.50 7977 24.6% 10529 -2552
8 Cambridge 001C King's Hedges 27.85 9208 28.3% 11166 -1958
9 Cambridge 003E East Chesterton 27.26 9506 29.3% 13078 -3572
10 Cambridge 006B Abbey 26.96 9636 29.7% 11265 -1629
11 Cambridge 010C Coleridge 25.79 10246 31.5% 12997 -2751
12 Cambridge 004D West Chesterton 25.31 10498 32.3% 10003 +495
13 Cambridge 003C East Chesterton 24.48 10979 33.8% 12308 -1329
14 Cambridge 009C Romsey 24.29 11108 34.2% 14154 -3046
Source: DCLG, IMD 2010
The most deprived 20% of Cambridge’s LSOAs (14 in total) rank within the most
deprived 40% nationally but outside of the most deprived 10%.
Ashley Godfrey Associates 18Cambridge City Council Outdoor Play Investment Strategy Map 5.1: Cambridge IMD The LSOAs shaded darkest represent the most deprived 20% of LSOAs in Cambridge. Ashley Godfrey Associates 19
Cambridge City Council Outdoor Play Investment Strategy

5.3     Child Poverty
        The Cambridge Anti-Poverty Strategy points out that by focusing solely on income-
        based measures of poverty, there is the risk that some of the wider causes and
        effects of poverty on individuals and households in Cambridge is missed. The
        Joseph Rowntree Foundation (JRF) provides the following broader definition of
        poverty:
        “income and resources are so inadequate as to preclude them from having a
        standard of living considered acceptable in the society in which they live. Because of
        their poverty they may experience multiple disadvantage through unemployment, low
        income, poor housing, inadequate health care and barriers to lifelong learning,
        culture, sport and recreation. They are often excluded and marginalised from
        participating in activities (economic, social and cultural) that are the norm for other
        people.”
        Evidence suggests that people living in poverty in Cambridge experience the multiple
        disadvantages identified by the JRF.
        A significant proportion of children in Cambridge live either in poverty, or in low
        income households20. Improved play provision can help to improve the quality of life
        of children in Cambridge and support the objectives of the Anti-Poverty Strategy.
        (see Appendix B).
        Table 5.6 shows two measures of poverty, where income is measured before
        housing costs and after housing costs. The average of three years of data is used for
        greater accuracy. The proportion of people in low income is always lower on a
        'before deducting housing costs' measure than on an 'after deducting housing costs'
        measure, although the two have followed similar trends over time.
        The proportion of people in low income in Cambridge is much higher on an 'after
        deducting housing costs' measure than on a 'before deducting housing costs'
        measure. This is a reflection of the high costs of housing in the City.

20The most commonly used threshold of low income is a household income that is 60% or less of the average
(median) British household income in that year.

Ashley Godfrey Associates                                                                                   20
Cambridge City Council Outdoor Play Investment Strategy
Table 5.6: Percentage of children in poverty, October-December 2013
Local Authority & Wards Before Housing Costs After Housing Costs
King's Hedges 22.05% 33.82%
East Chesterton 20.24% 31.31%
Abbey 16.89% 27.03%
Arbury 17.06% 26.75%
Cambridge 13.04% 20.81%
Romsey 11.50% 18.43%
Trumpington 11.31% 18.09%
Coleridge 10.36% 16.65%
Cherry Hinton 9.75% 15.87%
Market 9.32% 14.97%
Petersfield 9.28% 14.90%
Newnham 9.07% 14.46%
West Chesterton 7.40% 11.97%
Queen Edith's 6.83% 11.16%
Castle 4.61% 7.54%
Source: The Campaign to End Child Poverty
In January 2014, the Institute for Fiscal Studies published projections showing that
poverty is projected to rise from 2.3m (2011-12) to 3.2m by 2020 on the statutory
Before Housing Costs measure. On the After Housing Costs measure, the IFS
projected child poverty would increase from 3.5m (2011-12) to 4.6m by 2020.
As might be expected, child poverty rates are higher in the more disadvantaged
areas of Cambridge. The wards in Cambridge with the highest rates of child poverty
are King’s Hedges (33.82%), East Chesterton (31.31%) and Abbey (27.03%). There
are two wards in Cambridge which fall within the top ten wards in Cambridgeshire
with the highest percentage of households with dependent children where there are
no adults in employment. These are Abbey where the figure is 18.5% and in Kings
Hedges the figure is 16.7%.
Ashley Godfrey Associates 21Cambridge City Council Outdoor Play Investment Strategy
Map 5.2: Child Poverty in Cambridge
Evidence suggests that particular types of household, such as lone parents, are
more likely to be on low incomes and therefore may be more likely to struggle with
the costs of bringing up children. Almost four out of five lone parent households in
the City claim housing benefit. 41% of the 798 lone parents in the city with dependent
children are not in employment. In Abbey, Castle and East Chesterton wards this
figure rises to 51.4%, 48.6% and 46.2% respectively. 21
21 Cambridge Anti-Poverty Strategy 2014-2017
Ashley Godfrey Associates 22Cambridge City Council Outdoor Play Investment Strategy
5.4 Access to Play Opportunities
Children have a right to play22 however; there is evidence that lower income families
are likely to have difficulties of access to play provision. A two-year assessment of
more than 200 communities found that those with higher poverty rates were
significantly less likely to have access to parks and play areas.23. In part this problem
can be addressed by providing spaces that are ‘close to home’ where children can
access safely and independently when they are able to. Consideration therefore
needs to be given to where the larger Type C spaces are located in the wards with
higher levels of child poverty.
22 UN Convention on the Rights of the Child Article 31 (Leisure, play and culture): Children have the right to relax
and play, and to join in a wide range of cultural, artistic and other recreational activities.
23 Powell L, Slater S, Chaloupka F. “The Relationship between Community Physical Activity Settings and Race,
Ethnicity and Socioeconomic Status.” Evidence-Based Preventive Medicine, 1(2): 135–144, 2004.
Ashley Godfrey Associates 23Cambridge City Council Outdoor Play Investment Strategy
6. Financial Considerations
6.1 Government Spending Plans
As with all local authorities, the City Council is continuing to face significant
budgetary pressures due to a reduction in Government funding associated with the
global economic downturn and public sector austerity agenda. Over the period 2010-
15, the Council has already delivered £11 million in annual revenue savings. In
October 2014, the Council published its Mid-year Financial Review which identified a
further budget requirement of ~£6 million in net revenue savings across the Council
up to 2020. This equates to a total net budget reduction across the Council of
around 30%. At the same time as the Council is experiencing financial pressures,
Cambridge is experiencing significant growth, with 33,000 new homes and 22,000
new jobs to be provided in and around the city by 2031. As a consequence of this
growth, the Council is adopting and taking on the management of additional public
realm assets whilst continuing to ensure it maintains the quality of its existing
infrastructure, including the city’s historic streets, parks and open spaces.
6.2 Capital Funding
The estimated average capital cost of refurbishment/replacement of play space, by
type, is shown in Table 6.1 below.
Table 6.1: Renewals/Replacement of Existing Equipment
Type of Play Current
Cost Total (£)
Space24 Provision
Type A £10,000 36 £360,000
Type B £30,000 41 £75,000
Type C £120,000 11 £1.3 million
The Council has a Capital Plan and manages bids to it, via an officer led capital
programme board.
6.3 Revenue Funding
Cambridge City Council currently manages 88 public play areas across 14 wards
with an annual revenue budget of approximately £84,000. This budget covers routine
maintenance, equipment and surfacing repair and minor replacements, painting and
topping up loose fill surfaces (bark & sand). In addition to the annual revenue budget
referred to above, a further £77,000 is allocated to undertake major repairs of
existing play equipment which is reaching the end of its product lifecycle (typically 11
years). There is also additional operational staff salary costs associated with daily
24 See Para 3.1 for definitions
Ashley Godfrey Associates 24Cambridge City Council Outdoor Play Investment Strategy
inspections, litter collection and cleaning. Based on these costs, it is estimated the
average annual maintenance cost for a play area is ~ c £1,800 not including
overheads at 26%.
6.4 S106 Agreements
The council has used planning obligations under Section 106 of the Town and
Country Planning Act 1990 (as amended), commonly known as s106 agreements to
mitigate the impact of development and make it acceptable in planning terms.
Contributions are used in line with the purposes set out in S106 agreements and in
line with the three statutory tests set out in CIL Regulations.
Off-site generic S106 contributions for play provision, which were secured via S106
agreements completed before 6 April 2015, have been used to provide or improve
play areas within the city. The same applies to the S106 informal open space
contributions (which can be used for play area landscaping, skateparks and BMX
tracks) and S106 outdoor sports contributions (which can be used for multi-use
games areas).
This funding will continue to be used in this way for as long as it remains
available, but it is important to note that these contributions (agreed before 6 April
2015) are running down and the receipt of new contributions (triggered by the
commencement of development) is tapering off.
The council has devolved to area committees decisions over the use of devolved
S106 contributions for play areas, informal open space and outdoor sports
(amongst other contribution types). The funding available to each area varies
significantly, depending on the level of development in that area and how much
S106 funding has previously been invested in the area’s play areas.
Meanwhile, executive councillors continue to set priorities over the use of such
contributions assigned to a strategic fund (eg, for play areas which serve play
areas with catchment areas that straddle area committee boundaries).
Since new S106 pooling constraints came into force on 6 April 2015, the council’s
focus is now on securing off-site S106 contributions for specific projects. The
updated audit of play area provision will help to identify where existing play area
provision is likely to be over-stretched by the impact of new development and, hence,
where S106 contributions for specific play areas is needed.
The council will be introducing a Community Infrastructure Levy once the draft Local
Plan and CIL charging schedule have been examined and adopted. However, play
area provision is not included on the draft R123 list (which sets out the types of
facilities for which CIL funding will be collected) so the need for S106 contributions
for specific play area projects is set to continue beyond the local implementation of
CIL.
6.5 External Funding
External resources of funding for outdoor play are limited. There may be
opportunities to apply for capital funding from Landfill Tax or Sport England
Ashley Godfrey Associates 25Cambridge City Council Outdoor Play Investment Strategy
programme sources, however these sources are unlikely to provide for any
associated ongoing revenue funding.
The Council will work with Friends Groups or other interested community groups who
will to become involved in the provision of outdoor play spaces. The Council already
supports a number of established and active Friends Groups who undertake a range
of different green space management support functions including conservation work,
organising community events and activities.
6.6 New Provision as part of Housing Developments
Where the play space is to be adopted by the City Council, the annual costs of
maintenance will be funded for the first twelve years. There after these costs,
together with any associated equipment/ facilities refurbishment and replacement
costs will fall in fill to the City Council.
The Council will work with developers and communities to review alternative play
space management arrangements, including management companies, and
community asset transfer.
Ashley Godfrey Associates 26Cambridge City Council Outdoor Play Investment Strategy
7. Auditing the Play Provision of Cambridge
The audit focused on categorising existing outdoor play spaces using the Play
England:
Type A: Doorstep Play Space,
Type B: Local Play Space,
Type C: Neighbourhood Play Space and assessed against the relevant
criteria for that type of space.
Adopting this approach does not mean that play is restricted to dedicated
‘reservations’; children and young people do not limit where they play or hang out to
dedicated equipped spaces, and will use a wide range of spaces including the street,
civic spaces, parks, playing fields and amenity greenspace. There are therefore
many other types of open space that will provide informal play opportunities.
7.1 Quantity
The scope of the audit was confined to outdoor play spaces catering for the needs of
children and young people.
Provision for older children (young people), included facilities such as skateboard
parks, basketball courts and ‘open access’ Multi Use Games Areas (MUGAs). These
facilities were included in the assessment of Type C spaces. Details of the play
spaces audited can be found in Appendix C.
There are currently 88 outdoor play spaces in Cambridge. Some sites comprise an
equipped play space and youth provision; others contain either an equipped playable
space or youth provision only. These sites are identified on Map 7.1
Ashley Godfrey Associates 27Cambridge City Council Outdoor Play Investment Strategy
Map 7.1: Location of Play Areas
Type A
KEY
Type B
Type C
Ashley Godfrey Associates 28Cambridge City Council Outdoor Play Investment Strategy
Table 7.1: Play space provision in each ward.
Children 0-15
Type of play Number of play Child Population
Ward years per play
area areas 0-15 years
area.
Abbey Type A 2 1,942 216
Type B 6
Type C 1
Arbury Type A 5 1,527 218
Type B 2
Type C 0
Castle Type A 1 711 356
Type B 0
Type C 1
Cherry Hinton Type A 2 1,718 286
Type B 2
Type C 2
Coleridge Type A 1 1,483 212
Type B 5
Type C 1
East Chesterton Type A 4 1.677 186
Type B 4
Type C 1
King's Hedges Type A 5 1,763 196
Type B 2
Type C 2
Market Type A 0 450 150
Type B 2
Type C 1
Newnham Type A 0 763 382
Type B 1
Type C 1
Petersfield Type A 7 1.047 81
Type B 6
Type C 0
Queen Edith's Type A 1 1,539 385
Type B 3
Type C 0
Romsey Type A 3 1,278 213
Type B 2
Type C 1
Trumpington Type A 4 1,435 159
Type B 5
Ashley Godfrey Associates 29Cambridge City Council Outdoor Play Investment Strategy
Children 0-15
Type of play Number of play Child Population
Ward years per play
area areas 0-15 years
area.
Type C 0
West Chesterton Type A 1 1,275 638
Type B 1
Type C 0
Cambridge Type A 36
Type B 41
Type C 11 20,470 233
The ward with the highest number of children aged 0-15 years (1,942) is the Abbey
Ward. This ward has 9 play areas and the number of children aged 0-15 years per
play area is 216. The wards with the lowest number of play areas are Castle,
Newnham and West Chesterton all of which have just two play areas. The ward with
the lowest number of children aged 0-15 years is Market Ward with 450 children
aged 0-15 years which has 3 play areas.
Table 7.2 compares provision in Cambridge with the corresponding local authorities.
The overall number of children per play area in Cambridge is 211 which is a better
level of provision than Southampton, Oxford and Kingston-upon-Thames. Only
Brighton & Hove has a better level of provision with 191 children per play area.
Ashley Godfrey Associates 30Cambridge City Council Outdoor Play Investment Strategy
Table 7.2: Comparison of Play Provision with ONS Corresponding Local Authorities
No of children 0-15
Local Authority No. of Play Areas Children per play area
years
Brighton and Hove 45 16,650 191
Cambridge 88 18,581 211
Southampton 45 20940 241
Oxford 87 24,990 287
Kingston-upon-Thames 28 32276 371
Bristol 153 81,800 940
7.3 Provision for Young People
Multi-use games areas (MUGAs) are intended primarily for ball games. The most
common dimension for a ‘one court’ facility for 5-a-side football, tennis, netball and
outdoor basketball is 37 metres by 17.5 metres.
There are MUGAs at Coleridge Recreation Ground, Nightingale Recreation Ground,
and Coldhams Common. In addition, there are skateboard/BMX facilities at
Petersfield and at Jesus Green. Also, there is a 2 skate ramp facility and MUGA at
Nuns Way.
Recent S106 Projects which have delivered teenage provision are:
Panna Goal at Cherry Hinton Recreation Ground;
Skate Ramp at Cherry Hinton Recreation Ground;
Skateboard/BMX facility at Browns Fields;
Scooter/Mini Wheels facility at Accordia;
Skateboard/BMX facility at Nunns Way; and
BMX Track in Browns Field
These spaces are all open access and available for play.
7.4 Provision for Children with Disabilities
Play equipment specifically designed to cater for the needs of children with
disabilities has been provided at a number of play areas. One example where
inclusive play facilities have been installed is at Jesus Green. All new and adapted
play areas now have disabled equipment incorporated into the overall play offer.
Ashley Godfrey Associates 31Cambridge City Council Outdoor Play Investment Strategy
8. Quality of Outdoor Play Spaces in Cambridge
Quality was assessed using the Playable Space Quality Assessment Tool advocated
by Play England25. The criteria used in this assessment can be found in Appendix D.
The assessment focuses on three major aspects of children’s outdoor play: the
location of play areas, their play value, and the level of care and maintenance.
Scores are obtained for the three aspects individually.
8.1 Location
Research26 shows that location is the single most important factor in how well
children use open spaces. In general, children like to play locally where they can be
seen, see others and meet others. Young people are able to roam further and can
therefore use neighbourhood play areas, although they too like to feel safe wherever
they are “hanging out”.
The scoring is designed to identify the suitability of the location of play areas and
spaces where children may play.
8.2 Play value
The assessment deliberately does not focus exclusively on the fixed equipment in
outdoor play spaces, but considers the different ways in which children can
experience sensations such as rocking, swinging and sliding – this is particularly true
for some disabled children whose impairments may mean they cannot, for example,
sit on traditional swings. It seeks to capture the variety of different opportunities
available to a child and the ways in which he or she can access different types of
play. Quiet, contemplative play is as important as boisterous, physical play and
although children will play in their own way in any given area, their play can be
enriched through creating appropriate and stimulating play environments.
Children need to take risks to learn about and understand their own capabilities.
Risk does not mean creating hazardous environments, but it does mean ensuring
opportunities for challenge are available through design.
8.3 Care and maintenance
All play areas should enable children to play free from hazards. This section aims to
assess the quality of care and maintenance.
The ranking of each dedicated children’s play area is determined by whether the
score achieved is above or below the median.27
25 http://www.playengland.org.uk/media/211694/quality-assessment-tool.pdf
26 Playable Space Quality Assessment Tool, Inspire for Play England, 2009; Child’s Play: facilitating play on
housing estates; Rob Wheway and Alison Millward, JRF 1997; Can Play Will Play, John A and Wheway R, Fields
in Trust, 2004.
27 The median of a population is the point that divides the distribution of scores in half. Numerically, half of the
scores in a population will have values that are equal to or larger than the median and half will have values that
Ashley Godfrey Associates 32Cambridge City Council Outdoor Play Investment Strategy
8.4 Quality Assessments
Table 8.1 below shows the rankings in terms of location, play value, care and
maintenance and overall for each ward. Those spaces that scored above the median
are ranked as high and those below are ranked as low.
Table 8.1: Ranking of quality scores in each sub-area
Ranking
Committee Play Care & Total Quality
to Location
Areas Value Maintenance Score
median
Above 13 12 14 16
North
Below 14 15 13 11
Above 12 11 11 10
South
Below 7 8 8 9
Above 17 16 16 15
East
Below 18 19 19 20
Above 4 5 4 6
West/Central
Below 3 2 3 1
Cambridge Above 46 44 45 47
Total Below 42 44 43 41
Table 8.1 indicates that there are some geographic differences in the quality of play
areas. The South ward has more spaces scoring on or above the median for all three
criteria in the quality assessment. A similar pattern can be seen for the West/Central
Area although the number of play spaces in this ward is much smaller. The East sub
area shows the opposite in that there are more spaces scoring below the median
than above for all three criteria although the differences are not great. The North sub
area has more spaces scoring below the median for Location and Play Value.
The median score for location is 80%. Two examples of sites scoring at the median
level are the play areas PL001 Ainsdale and PL049 Nightingale Avenue. One play
area that achieved the best score (94%) for location is PL096 Rustat Road and the
worst scoring site for location is PL033 Great Eastern St (34%. Overall, more spaces
scored at the level of the median or above (46) than below (42).
The median score for play value is 48%. There are no play areas with this score
although PL074 Whytford Close scored 49% and PL059 Scotland Rd Recreation
Ground scored 47% as did PL062 Sleaford St and PL0104 Anstey Place,
Trumpington Meadows. The best scoring site for Play Value is PL043 Jesus Green
which scored 98% and the lowest scoring sites for Play Value are PL033 Great
are equal to or smaller than the median. To work out the median:
a) Put the numbers in order.3 6 6 6 7 9 11 11 13
b) The number in the middle of the list is the median 7 is in the middle. So the median value is 7.
If there are two middle values, the median is halfway between them. For example, if the set of numbers were3 6
6 6 7 8 9 11 11 13 There are two middle values, 7 and 8. The median is halfway between 7 and 8. The median is
7.5.
Ashley Godfrey Associates 33Cambridge City Council Outdoor Play Investment Strategy
Eastern St, PL045 Molewood Close and PL038 Hazelwood Close 1 which all scored
20%.
The median score for care and maintenance is 73%. Several play areas scored 72%
including PL009 Beales Way, PL013 Cameron Way, PL039 Hazelwood Close 2 and
PL045 Molewood Close. The site with the highest score is PL070 Trumpington
Recreation Ground with 97% and the site with the lowest score of 37% was given to
PL005 Arbury Close.
The median for the total quality score is 66%. Four sites achieved this score and
these were PL007 Bateson Road, PL076 Neptune Close, PL042 Humphries Road
and PL053 Uphall Road/Nuttings Road. The play area with the highest overall quality
score of 92% is PL058 Romsey Recreation Ground. The lowest score overall was
35% for PL033 Great Eastern Street.
No play area had scores that were close to all three median figures. The closest
example is the Type A play space, PL074 Whytford Close, had scores of 80% for
Location, 49% for Play Value, 88% for Care and Maintenance and 71% overall.
The full results of the audit and quality assessments can be found at Appendix E.
8.5 Accessibility
The distances and classifications of playable spaces are specified in ‘Planning and
Design for Outdoor Sport and Play’28 which provides ‘Accessibility Benchmark
Standards for Children’s Playing Space’. This guidance sets out the maximum actual
walking and straight line distances29 from home (taking into account barriers to
movement) for different age groups. These are shown in Table 8.4 below.
The guidance explains that age ranges stated in the hierarchy are indicative. They
are inclusive and set out the broad age range of the main intended user group(s). It
should not be interpreted that users of other ages should be excluded.
28Planning and Design for Outdoor Sport and Play, Fields in Trust 2008.
29The distances specified are identical to those in the Cambridge Local Plan 2014: Submission document p358
Table I.2: Playspace typology.
Ashley Godfrey Associates 34Cambridge City Council Outdoor Play Investment Strategy
Table 8.4: Children’s Playing Space Accessibility Benchmark Standard
Distance Criteria (metres)
Type
Walking Distance Straight Line Distance
Local areas for play or `door-step’ spaces –
100 60
for play and informal recreation (Type A)
Local equipped, or local landscaped, areas
for play – for play and informal recreation 400 240
(Type B)
Neighbourhood equipped areas for play –
for play and informal recreation, and
1000 600
provision for young people; this also covers
youth space (Type C)
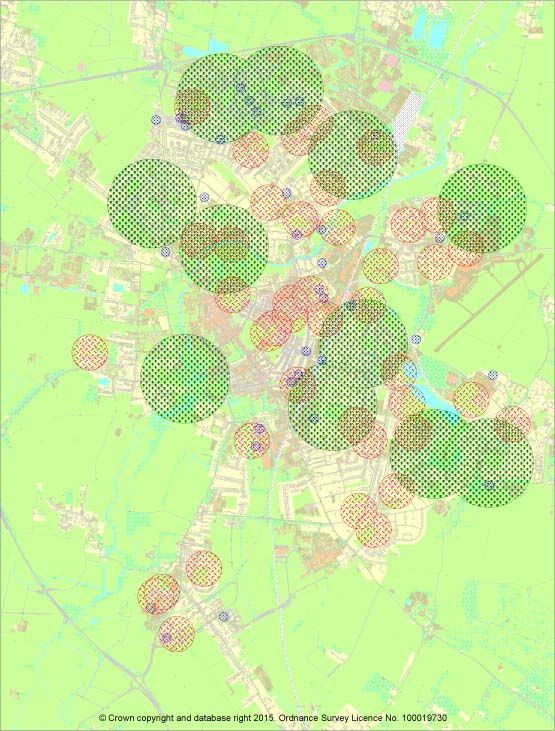
The distance criteria are applied to Cambridge playgrounds in Map 8.1. This shows
that there is a good distribution of play spaces across the city with only a few areas
of deficiency notably in parts of the Castle and Arbury wards in the north and Queen
Ediths and Trumpington wards in the south.
The map identifies areas where there is overlapping provision. This has probably
resulted mainly as a result of play space needs being considered purely in relation to
individual development applications, without a strategic view being taken of other
facilities within the catchment area.
Ashley Godfrey Associates 35Cambridge City Council Outdoor Play Investment Strategy Map 8.1: Distance Criteria applied to Cambridge Playgrounds. Ashley Godfrey Associates 36
Cambridge City Council Outdoor Play Investment Strategy
9. Key Issues
Through the audit, the following key strategic issues were identified as priorities for
attention through this strategy:
Financial constraints and the requirement to maintain equipped play spaces;
Type A play spaces with a very limited number and range of equipment;
Poor location of some outdoor play spaces;
Low play value of some outdoor play spaces;
Overlapping catchment areas of existing play provision;
Poor quality of some existing play provision in new housing developments; and
Council standards focused on quantitative rather than qualitative provision.
Ashley Godfrey Associates 3710. Key Actions
The review has highlighted a number of key strategic issues that need to be
addressed through this investment strategy.
In support of the implementation of the vision and aims and to address the key
strategic issues identified from the audit, the strategy recommends the following key
actions:
a) Prepare ward based profiles to inform the planning and decision making around
the allocation of Section 106 and other such investment opportunities on outdoor
play provision;
b) Use the ward profiles, to inform reviews of outdoor play spaces considered to be
low value/ low use, involving key stakeholders, including children, young people
and their families and local Ward councillors;
c) Prepare an investment plan for both local and strategic play provision, informed
by the strategy and ward profiles;
d) Use the investment plan to determine allocation of S106 funds project bids to the
Council’s capital plan and other external investment opportunities for both local
and strategic outdoor play provision; and
e) Develop a design guide to aid future planning and delivery of good quality/ high
value children’s and young people’s outdoor play provision.Cambridge City Council Outdoor Play Investment Strategy APPENDICES APPENDIX A: PROJECT BRIEF APPENDIX B: LOCAL STRATEGIC CONTEXT APPENDIX C: WARD LEVEL CHILD POPULATION PROJECTIONS APPENDIX D: PLAYABLE SPACE QUALITY ASSESSMENT TOOL APPENDIX E: QUALITY ASSESSMENT OF CAMBRIDGE OUTDOOR PLAY SPACES Ashley Godfrey Associates 39
Cambridge City Council Outdoor Play Investment Strategy
APPENDIX A: PROJECT BRIEF
1. THE REQUIREMENT
Cambridge City Council is seeking a review of play space provision in the City. In part, the
strategy should seek to progress the actions outlined in the Parks Strategy document
‘Cambridge Parks - Managing the City’s Asset 2010 to 2014’.
The objectives for the study are:
to examine current levels of provision of outdoor play against the current and future
population data;
to review and update the quantity and quality assessment carried out in 2010 for the
Parks Strategy30;
to review whether the ‘play offer’ should continue to develop and re-instate fixed
outdoor play facilities or whether there are alternative approaches to oudoor play
provision that can offer better value play opportunities;
to examine whether priority should be given to enhancing the quality of existing
children’s play areas or to addressing issues of deficiencies in overall provision;
to develop and apply a hierarchy of play provision in the City;
to consider whether existing play spaces are ‘well located’ and ‘well used’.
to consider whether existing play provision is fit for purpose, in terms of design,
accessibility and meeting community play needs
to examine whether priority should be given to existing outdoor play areas that
achieve a higher score for value;
to provide guidelines on the use of new European Standards (EN 1176 and EN
1177) which indicate changes in the overall height of equipment, equipment
separation and surfacing areas;
to identify future savings and investment priorities in the context of csignificant
ongoing budgetary pressures;
to establish clear criteria for future investments in play assets, incl s106 and Council
capital programmes;
to examine opportunities for external funding for existing and proposed play spaces;
to identify the key strategic play infrastructure for inclusion in the Council’s
Infrastructure Delivery Plan.
to use a systematic approach to preparing an investment strategy for children’s play
provision that will deliver high quality, high value, well used attractive play
opportunities;
to consider how children’s play can contribute to the Council’s wider environmental,
economic and social objectives.
30 Cambridge Parks - Managing the City’s Asset 2010 to 2014.
Ashley Godfrey Associates 40You can also read