North Coast and Upstate Fuel Cell Vehicle Readiness Project
←
→
Page content transcription
If your browser does not render page correctly, please read the page content below
California Energy Commission
CONSULTANT REPORT

North Coast and Upstate
Fuel Cell Vehicle
Readiness Project
Task 2.4 Site Readiness Report

Prepared for: Redwood Coast Energy Authority
Prepared by: Schatz Energy Research Center

California Energy Commission
Edmund G. Brown Jr., Governor

April, 2018 | CEC-XXX-XXXX-XXX

California Energy Commission
      Primary Author(s):
           Greg Chapman
           Jerome Carman

      Schatz Energy Research Center
      1 Harpst Street
      Arcata, CA 95521
      (707) 826-4345
      www.schatzcenter.org

      Contract Number: ARV-14-055

      Prepared for:
      California Energy Commission

      Sebastian Serrato
      Contract Manager

      Elizabeth John
      Project Manager

      John Kato
      Office Manager
      Emerging Fuels and Technology Office

      Drew Bohan
      Deputy Director
      Fuels and Transportation Division

      Robert P. Oglesby
      Executive Director

                                              DISCLAIMER
This report was prepared as the result of work sponsored by the California Energy Commission. It does not
necessarily represent the views of the Energy Commission, its employees, or the State of California. The Energy
Commission, the State of California, its employees, contractors, and subcontractors make no warrant, express
or implied, and assume no legal liability for the information in this report; nor does any party represent that
the uses of this information will not infringe upon privately owned rights. This report has not been approved
or disapproved by the California Energy Commission nor has the California Energy Commission passed upon
the accuracy or adequacy of the information in this report.
PREFACE
Assembly Bill (AB) 118 (Nüñez, Chapter 750, Statutes of 2007), created the Alternative
and Renewable Fuel and Vehicle Technology Program (ARFVTP). The statute authorizes
the California Energy Commission (Energy Commission) to develop and deploy
alternative and renewable fuels and advanced transportation technologies to help attain
the state’s climate change policies. AB 8 (Perea, Chapter 401, Statutes of 2013) re-
authorizes the ARFVTP through January 1, 2024, and specifies that the Energy
Commission allocate up to $20 million per year (or up to 20 percent of each fiscal year’s
funds) in funding for hydrogen station development until at least 100 stations are
operational. The Energy Commission has an annual program budget of approximately
$100 million and provides financial support for projects that:
• Develop and improve alternative and renewable low-carbon fuels;
• Optimize alternative and renewable fuels for existing and developing engine
technologies;
• Produce alternative and renewable low-carbon fuels in California;
• Decrease, on a full fuel cycle basis, the overall impact and carbon footprint of
alternative and renewable fuels and increase sustainability;
• Expand fuel infrastructure, fueling stations, and equipment;
• Improve light-, medium-, and heavy-duty vehicle technologies;
• Retrofit medium- and heavy-duty on-road and non-road vehicle fleets;
• Expand infrastructure connected with existing fleets, public transit, and
transportation corridors; and
• Establish workforce training programs, conduct public education and promotion, and
create technology centers.

The California Energy Commission (Energy Commission) issued solicitation PON-14-607
to fund Zero Emission Vehicle (ZEV) Readiness activities. To be eligible for funding
under PON- 14-607, the projects must also be consistent with the Energy Commission's
ARFVT Investment Plan updated annually. In response to PON-14-607, the Redwood
Coast Energy Authority (Recipient) submitted application number 11, which was
proposed for funding in the Energy Commission's Notice of Proposed Awards on March
17th, 2015, and the agreement was executed as ARV-14-055 on May 8th, 2015.

Please use the following citation for this report:

Chapman, Greg and Jerome Carman. Schatz Energy Research Center, 2018. North Coast
and Upstate Fuel Cell Vehicle Readiness Project – Task 2.4 Site Readiness Report.
California Energy Commission. Publication Number: CEC-XXX-XXXX-XXX.

                                              i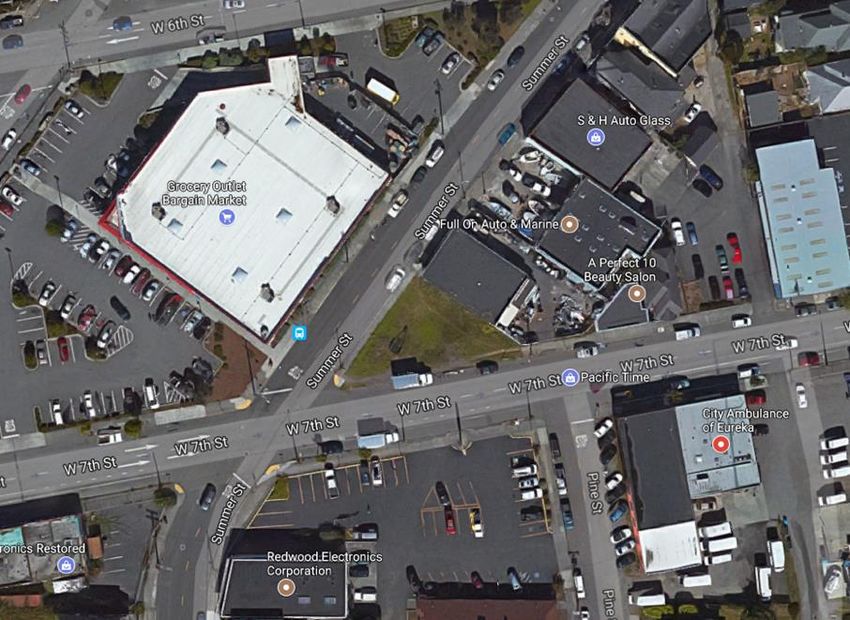
ABSTRACT
This report presents the results of micrositing work conducted for the North Coast and
Upstate Fuel Cell Vehicle Readiness Plan Project. Micrositing work involves developing
preliminary hydrogen fueling station designs, and identifying specific potential
locations for hydrogen fueling stations. The micrositing work conducted for this report
focuses on the greater Eureka and Redding areas. This report provides an overview of
the state of the art of hydrogen fueling station design and current code and safety
requirements, station design recommendations specifically for the focus areas, and a
list of recommended potential locations for the installation of hydrogen fueling
infrastructure based on specific criteria.

Keywords: hydrogen, fuel, cell, vehicle, FCEV, station, micrositing, hydrogen fueling
infrastructure, planning, ARFVTP, AB 8, AB 118, NFPA 2, North Coast, Upstate, Eureka,
Redding

                                             ii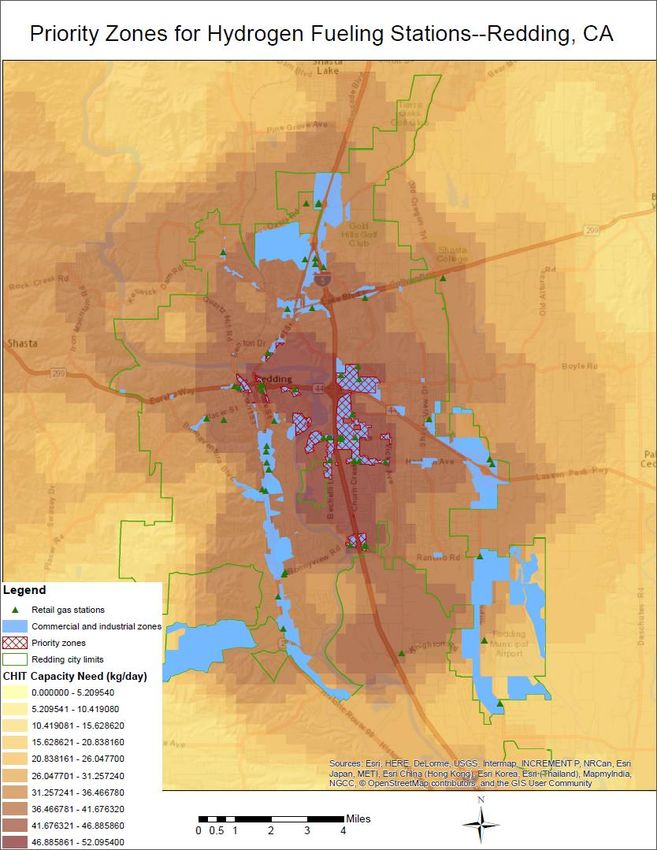
TABLE OF CONTENTS
Page
Preface .................................................................................................................................................... i
Abstract ................................................................................................................................................. ii
Table of Contents ...............................................................................................................................iii
List of Figures ..................................................................................................................................... iv
List of Tables ........................................................................................................................................ v
Executive Summary............................................................................................................................. 1
CHAPTER 1: Background ................................................................................................................... 3
CHAPTER 2: Analysis of State of the Art Station Design and Associated Costs ................... 4
Reference Stations – Designs and Costs .................................................................................... 4
Summary of Reference Station Results ........................................................................................................ 5
Retail Stations – Designs and Costs ............................................................................................ 7
CHAPTER 3: Review of Safety Code Requirements ................................................................... 11
Station Design – Safety and Hazard Mitigation Features..................................................... 11
Code Separation Distances for Gaseous Hydrogen Stations .............................................. 12
CHAPTER 4: Analysis of Required Station Footprint ............................................................... 14
Station Footprint Analysis Studies ........................................................................................... 14
Design and Footprint Assessment of Retail Hydrogen Stations ........................................ 16
CHAPTER 5: Recommended Station Design Options ............................................................... 22
Station Design Options - Eureka ............................................................................................... 22
Station Design Options - Redding............................................................................................. 23
Estimated Costs for Design Options ........................................................................................ 23
Key Footprint Dimensions of Design Options ....................................................................... 24
Layout Drawings of Design Options ........................................................................................ 24
Design Option 1: Modular Station with Gas Delivery ............................................................................ 25
Design Option 2: On-Site Hydrogen Generation Using Electrolysis .................................................. 25
CHAPTER 6: Site Screening Evaluations ...................................................................................... 28
Site Screening Criteria ................................................................................................................. 28
Site Evaluations - Eureka............................................................................................................. 29
Site Evaluations - Redding .......................................................................................................... 33
Example Station Design Options at Two Candidate Sites ................................................... 36
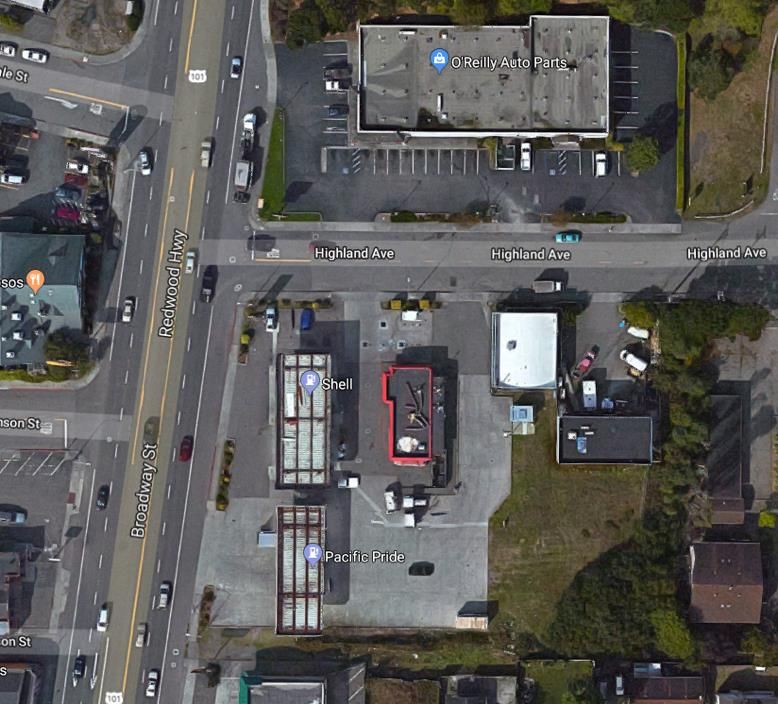
Myrtle Shell Station – Modular System with Gas Delivery ................................................................... 36
Humboldt Plaza Parking Lot – On-Site Generation Using Electrolysis ............................................. 37
iii
REFERENCES ...................................................................................................................................... 39

APPENDIX A: Details Regarding Sites Considered in Eureka .................................................. 40
   Eureka – Prescreening of Retail Gas Stations ......................................................................... 40
   Eureka - Site Assessment of Possible Hydrogen Station Locations ................................... 41
   Eureka - Potential Site List .......................................................................................................... 52
   Eureka - Site Evaluation Rubric ................................................................................................. 53

APPENDIX B: Details Regarding Sites Considered in Redding ................................................ 55
   Redding – Prescreening of Retail Gas Stations ...................................................................... 55
   Redding - Site Assessment of Possible Hydrogen Station Locations ................................ 56
   Redding - Potential Site List ....................................................................................................... 61
   Redding - Site Evaluation Rubric ............................................................................................... 62

                                                       LIST OF FIGURES
                                                                                                                                                       Page

Figure 1: Financial Scorecard for an On-Site Electrolysis System ............................................. 9

Figure 2: Financial Scorecard for a Delivered Gaseous Hydrogen Station ........................... 10

Figure 3: Gaseous Hydrogen Reference Station. ........................................................................ 15

Figure 4: Hydrogen Station Equipment Footprints ................................................................... 16

Figure 5: Street View of a True Zero Station at a South San Francisco Shell Station. ....... 17

Figure 6: Overhead View of a True Zero Station at a South San Francisco Shell Station. 17

Figure 7: Street View of a True Zero Station at a Valero station in Fremont. ..................... 18

Figure 8: Overhead View of a True Zero Station at a Valero station in Fremont. .............. 18

Figure 9: Street View of an Air Products Hydrogen Fueling Station at a Chevron in
Fairfax. ................................................................................................................................................ 19

Figure 10: Overhead View of Air Products Hydrogen Fueling Station at a Chevron in
Fairfax. ................................................................................................................................................ 19

Figure 11: Overhead View of 76 Station in Ontario That Includes an On-Site Electrolyzer.
............................................................................................................................................................. 20

Figure 12: Design Option 1 - Modular Station with Gas Delivery .......................................... 26

Figure 13: Design Option 2 - On-Site Hydrogen Generation Using Electrolysis ................. 27

Figure 14: Eureka Priority Zones................................................................................................... 31

Figure 15: Redding Priority Zones ................................................................................................ 34

                                                                              iv
Figure 16: Dimensionalized Layout of a Gas-delivered Station at Myrtle Shell .................. 36

Figure 17: Station Layout Adjustment at Myrtle Shell ............................................................. 37

Figure 18: Dimensionalized Layout of an On-Site Generation Station at Humboldt Plaza
............................................................................................................................................................. 38

                                                        LIST OF TABLES
                                                                                                                                                       Page

Table 1: Installed Cost and Hydrogen Cost for Modular Stations ............................................ 7

Table 2: Total Costs for the Four Retail Systems ......................................................................... 8

Table 3: NFPA Minimum Separation Distances for Outdoor Gaseous Hydrogen Systems13

Table 4: Estimated Dimensions (ft) and Footprints (ft2) for Recent Installations .............. 21

Table 5: Station Design Cost Data ................................................................................................ 24

Table 6: Top Candidate Sites for Eureka ..................................................................................... 32

Table 7:Top Candidate Sites Within the Priority Zone for Redding ...................................... 35

Table 8: List of Prescreened Retail Gas Stations in Eureka Provided By RCEA ................... 40

Table 9: Potential Site List for Eureka Area ................................................................................ 52

Table 10: Eureka Area – Evaluation Rubric................................................................................. 53

Table 11: List of Prescreened Retail Gas Stations in Redding ................................................ 55

Table 12: Potential Site List for Redding ..................................................................................... 61

Table 13: Redding – Evaluation Rubric ........................................................................................ 62

                                                                              v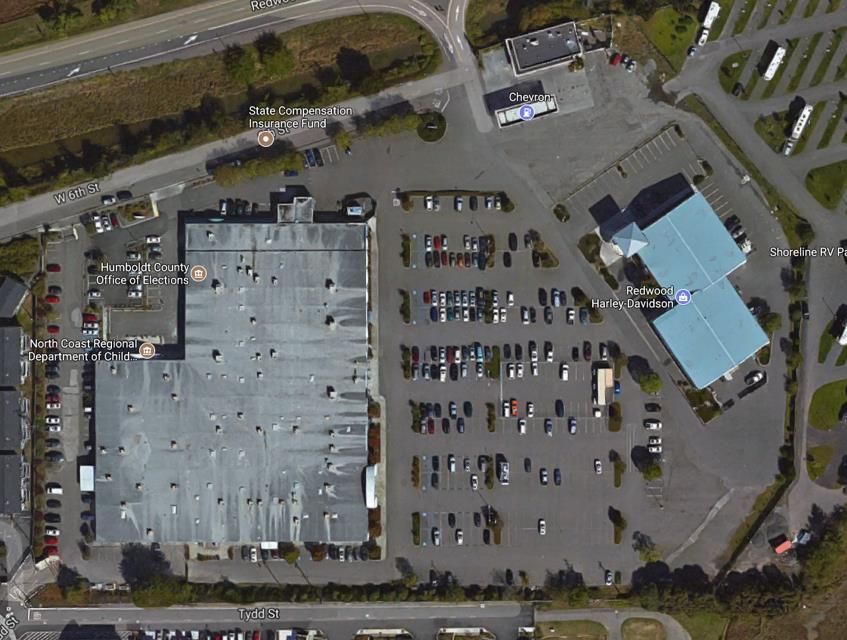
vi
EXECUTIVE SUMMARY
While the roughly 3,300 FCEVs currently on the road in California 1 are concentrated in
urban centers, hydrogen refueling opportunities in rural, destination communities will
be critical to sustained FCEV adoption. The North Coast and Upstate FCEV Fuel Cell
Electric Vehicle (FCEV) Readiness Plan aims to prepare eight of California’s
northernmost counties for the introduction of FCEVs. The counties of Del Norte,
Siskiyou, Humboldt, Trinity, Shasta, Mendocino, Tehama, and Glenn were included in the
planning effort. Lake and Colusa Counties were initially included as project partners,
but were subsequently unable to participate. As a result, the project covered a region of
eight rather than nine counties.
A primary goal of this planning effort was to identify three phases of geographic
locations for hydrogen infrastructure buildout in the study region. The first phase
focused on establishing “anchor sites” that will catalyze a hydrogen market in the
region, while the second and third phases build out and connect these anchor sites to
urban areas hosting established fueling infrastructure.
The first task of this planning effort identified key regional hydrogen hotspots to
geographically identify where anchor sites should be located. These hotspots were
identified by comparing the five census-designated micro- or metropolitan statistical
areas within the project region to a set of qualitative criteria. Statistical areas were
evaluated based on proximity to major corridors, distance from existing FCEV markets,
consistency with the Federal Highway Administration’s Alternative Fuel Corridor
designation, and level of future hydrogen demand identified through the California
Hydrogen Infrastructure Tool (CHIT) model2. The Redding-Red Bluff and Eureka-Arcata-
Fortuna census-designated areas were identified as focus regions for these anchor sites.
This Site Readiness Report is a first step in identifying potential locations for installing
a hydrogen fueling station anchor site in the two focus regions. Particular emphasis was
given to the cities of Eureka and Redding. Included in this report are:
A detailed review of the current state of the art of commercial public hydrogen
fueling stations in California;
A review of the National Fire Protection Association Hydrogen Technologies
Code, 2016 Edition;
1 Estimate of the number of FCEVs obtained from the Clean Vehicle Rebate Project, last update April 11 th,
2018.
2 More information on the California Hydrogen Infrastructure Tool (CHIT) can be found on the California Air
Resources Board website.
1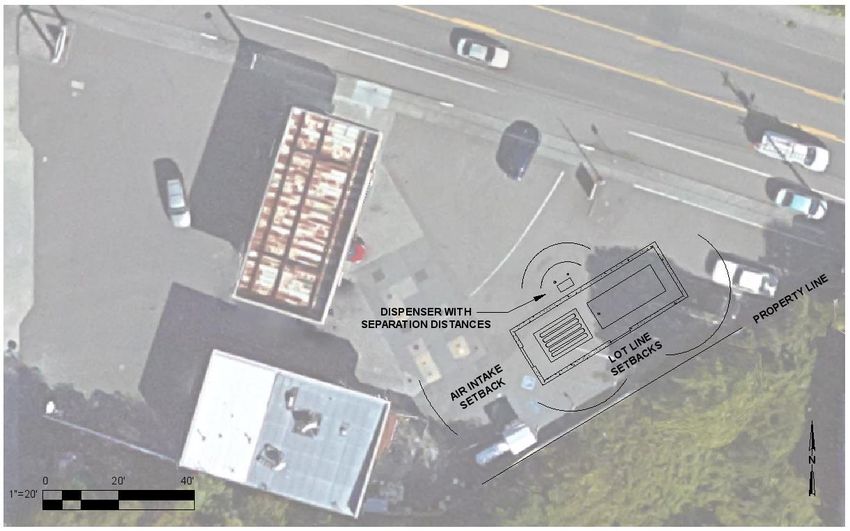
Recommended station designs and features that consider anticipated regional
demand and hydrogen sourcing constraints, and associated space and setback
requirements; and
A list of pre-screened potential locations that could host a station.
The information in this report is intended to reduce the amount of initial groundwork to
identify viable development projects in the region and help attract private and/or public
investment. It is also intended to inform key stakeholders such as permitting officials
and fire marshals to streamline early station development discussions with the relevant
agencies holding jurisdiction.
2CHAPTER 1:
Background
One of the goals of the North Coast and Upstate Fuel Cell Vehicle Readiness Project
(Project) is to provide guidance for the implementation of fueling infrastructure to
support fuel cell electric vehicles (FCEVs) in the North Coast and Upstate regions.
Guidance is developed in a two-step process.
The first step, termed “macrositing”, provides high-level regional insight into where to
focus fueling infrastructure development efforts for first-phase critical anchor sites that
will kick-start the regional fuel supply. Furthermore, recommendations on key second
and third phase connector sites are provided that will solidify a fueling network to
support a robust early market. The macrositing work was completed by the Redwood
Coast Energy Authority and the Local Government Commission, and combines local
knowledge with state-level modeling results provided by the CARB-funded CHIT-CHAT
model3. The results of this step are found in the Regional Hydrogen Infrastructure Plan
developed for this Project under Task 2.1.
The second step, termed “micrositing”, translates the macrositing results into on-the-
ground locations and designs that address the many nuanced variables that impact the
feasibility of station development. This report discusses the micrositing analysis work
completed under Task 2.4 of the Project.
The micrositing effort is further split into two steps. The first step involves site
screening and evaluation for potential fuel station locations within the critical anchor
site regions identified in the macrositing process. These regions are the City of Redding
and the City of Eureka. This Site Readiness Report documents the results of this step.
The second micrositing step involves using this Site Readiness Report to reach out to
two key stakeholder groups:
Fuel suppliers, to communicate the status of station designs and costs, and to gauge
their interest in considering investment in hydrogen fueling infrastructure.
City planning and permitting officials, to communicate the results of this report, the
status of station designs and related codes, and to obtain feedback on additional
information that they could use.
The results of the second step in the micrositing process are documented in the
Micrositing Analysis Results Summary Report, which is the second deliverable under
Task 2.4 of this Project.
3 https://www.arb.ca.gov/msprog/zevprog/hydrogen/h2fueling.htm
3CHAPTER 2:
Analysis of State of the Art Station Design
and Associated Costs
There has been an extensive amount of work accomplished by state and federal
governments, national laboratories, hydrogen advocacy groups and public-private
partnerships over the past five years to promote and accelerate the deployment of
hydrogen fueling stations throughout the state of California. Four main resources offer
invaluable design and cost information for reference and retail stations and were heavily
relied on for this site readiness report. The first two resources, (Pratt et al., 2015) and
(Hecht and Pratt, 2017) developed by Sandia National Laboratory, are used to develop
reference station designs which are discussed in the first section below. The last two
resources, (Baronas and Achtelik, 2017a) and (Baronas and Achtelik, 2017b) developed
jointly by the California Energy Commission (CEC) and the California Air Resources
Board (CARB), are used to analyze retail station designs that have been funded by the
CEC. These are discussed in the second section below.
Reference Stations – Designs and Costs
The first resource is the Hydrogen Fueling Infrastructure Research and Station
Technology Project (H2FIRST). Funded by the U.S. Department of Energy, H2FIRST was
established to address key challenges of hydrogen infrastructure. In the first phase of
the project (Reference Station Design Task), team members from Sandia National
Laboratories, National Renewable Energy Laboratory and Argonne National Laboratory
along with input from H2USA Hydrogen Fueling Station Working Group, California Fuel
Cell Partnership, and the California Air Resources Board screened over 160 different
station design permutations using the H2A Refueling Station Analysis Model (HRSAM).
The model performed an economic analysis using information on design capacity, peak
performance, number of hoses, fill configuration and hydrogen delivery method for
each station. Based on the preliminary economic results, fifteen station concepts were
selected. (Pratt et al., 2015)
In addition to the economic results, fueling market needs were investigated. Given the
early stages of infrastructure development, the accepted method for rollout was a
“cluster strategy”, where stations are centered in areas where early FCEV adopters
reside. In a 2014 report by the CARB, station classifications were developed based on
different needs (low or high use commuter, and low intermittent) and were matched
with screened station concepts. (California Air Resources Board, 2014)
(Pratt et al., 2015) provided publicly-available detailed station designs including piping
and instrumentation diagrams and bills of materials. Several site-specific layouts for
various target markets were analyzed using setbacks required by the National Fire
4Protection Association Hydrogen Technologies Code (NFPA 2, 2011) and setbacks that
significantly affected the ability to site a hydrogen station on greenfield and brownfield
(existing gasoline stations) sites. (Pratt et al., 2015)
In Phase 2 of H2FIRST, Sandia National Labs expanded and updated the work performed
in the first phase by including designs and economic analyses of factory-built modular
stations and stations utilizing on-site generation. (Hecht and Pratt, 2017) The report
provides a summary of the hydrogen costs from various sources including a detailed
breakdown of costs of gas delivery of centrally-produced hydrogen to fueling stations.
Summary of Reference Station Results
There are three potential sources for providing hydrogen to the fueling station: centrally
produced hydrogen and delivery, on-site production via steam methane reforming and
on-site production via electrolysis. Each of these methods are described below and
factors that impact the overall cost to supply fuel are identified. (Hecht and Pratt, 2017)
Centrally produced hydrogen and delivery
The overall cost for delivered hydrogen includes the cost of the produced hydrogen, the
delivery of a tube-trailer, and the cost to lease the tube-trailer while sited at the station.
With an approximate capacity of 300 kg, the time to consume a tube trailer and the
frequency of deliveries can be calculated based on the station use. As station utilization
increases, the number of deliveries will increase. The delivery cost is associated with the
distance travelled and therefore distance between the production facility and station
location will be a factor in the total cost of supplied hydrogen.
On-site production via Steam Methane Reforming (SMR)
Hydrogen production from on-site reformers require additional capital costs and
ongoing operational and maintenance costs. Estimated capital costs as provided by
manufacturers are $1.15M, $2.04M and $2.46M for 100, 200 and 300 kg/day units,
respectively. Operating costs are estimated to be 3.9 kWh/kgH2 for electricity, 96
lH2O/kgH2 of water, and 3.5 kg NG/kg H2 of natural gas. Due to their high operating
temperatures, startup and shutdown cycles should be limited to prevent loss of unit
efficiency. This lack of flexible operation makes SMR more suitable for larger and
mature stations where continuous operation is required.
On-site production via Electrolysis
As with SMR, there are additional capital costs and on-going operational and
maintenance costs associated with hydrogen production via electrolysis. Capital costs
for electrolyzers are estimated to be $800k, $1.2M, and $1.5M for the 100, 200, and 300
kg/day stations. These capital costs are lower than on-site reformers; however,
electrolysis is energy intensive (approximately 62.4 kWh/kgH2) and the electrical
operating cost will have a big impact on the cost of hydrogen production.
(Hecht and Pratt, 2017) analyzed five updated “reference station” designs that offer
baseline concepts to assist in the development of site-specific station designs. The
updated reference station designs are:
5 Conventional station with delivered hydrogen
Conventional station with on-site production from steam methane reforming
Conventional station with on-site production through electrolysis
Modular station with delivered hydrogen
Modular station with on-site production through electrolysis
For each of these designs, 100, 200, and 300 kg/day stations were analyzed to estimate
all project costs. These costs include the construction and operating costs and the costs
for producing hydrogen on-site or having hydrogen produced at a centralized facility
and delivered.
Some of the model inputs and assumptions used by (Hecht and Pratt, 2017) include:
the cost of land procurement is neglected,
installation cost is assumed to be 35% of capital cost for conventional stations
and a flat cost of $60,000 for modular stations, and
a flat $300,000 is assumed for site preparation, engineering & design, project
contingency, and upfront permitting costs.
Graphical tools are also available to the station designer to correct for any differences in
capital or installation costs in order to get a better estimate of hydrogen cost. Refer to
(Hecht and Pratt, 2017) for additional model details and economic analysis.
There are two types of stations that are being constructed at present; conventional and
modular. Conventional stations consist of on-site assembly of the equipment while
modular stations are pre-assembled units where the equipment is mounted on a skid,
trailer, or within a container at a factory and then shipped to the site. The equipment for
either type is similar. The majority of fueling stations currently being installed are
modular stations. These stations or “compressor modules” are assembled at a factory
and consist of the complete hydrogen system and most auxiliary systems mounted to a
skid or housed in a container. The equipment costs are similar to that of conventional
station, however, the factory assembly allows for system operational and leak checking
of the system prior to shipping to the site thus reducing installation labor costs.
The economic results for the module reference station designs for the 100 kg/day and
200 kg/day capacities are shown in Table 1 below. The higher capacity stations estimate
a lower hydrogen cost than the lower capacity stations (as expected) and delivered
hydrogen from a central production facility is less expensive than on-site production.
The installed costs shown include the site preparation, engineering & design, permitting
costs (assumed as a flat $300k), installation (assumed to be 35% of capital costs for the
conventional stations and a flat $60k for the modular units) and the capital costs for the
equipment and materials previously presented.
6Table 1: Installed Cost and Hydrogen Cost for Modular Stations
Station Type 100 kg/day 200 kg/day
installed ($) H2 ($/kg) installed ($) H2 ($/kg)
Delivered H2 $1.86M $33.90 $1.86M $19.16
Electrolysis H2 $2.74M $43.03 $3.14M $27.30
Credit: (Hecht and Pratt, 2017)
The estimated hydrogen costs are based on results of the economic analysis that used
the installed costs and revenue based on a station utilization profile. The profile
estimates 5% of station capacity will be utilized in 2017, and ramps up to a maximum of
80% in 2026. A 200 mile, gas delivery distance was used and the resulting hydrogen
costs assumed to break even on investments in 7 years (Hecht and Pratt, 2017).
Retail Stations – Designs and Costs
The other main resource for current design and cost information is the annual joint
agency staff report, Assessment of Time and Cost Needed to Attain 100 Hydrogen
Refueling Stations in California, prepared by the California Energy Commission and
California Air Resources Board. The assessment is updated annually, the last two
updates of which are discussed here. It provides an update on the status of hydrogen
fueling station design and the hydrogen infrastructure fleet in the State of California.
In the 2016 report (Baronas and Achtelik, 2017a), information was provided on the
development of the hydrogen refueling station network, vehicle deployment rate and
need for fuel, and required time for a station to become operational from permitting to
construction and commissioning. In addition to these annual reporting topics, the
Energy Commission and partners identified and analyzed the following retail station
types from the various designs submitted to the Alternative and Renewable Fuel and
Vehicle Technology Program:
System 1: 180 kg per day delivered gaseous
System 2: 350 kg per day delivered liquid
System 3: 130 kg per day electrolysis
System 4: 180 kg per day delivered gaseous (this differs from System 1 by increased
CEC funding of capital costs in order to increase the projected profitability)
Costs for the site engineering and design, permitting, construction, commissioning,
project management and overhead costs along with total equipment costs are shown in
Table 2.
7Table 2: Total Costs for the Four Retail Systems
Activity System 1 System 2 System 3 System 4
Site Engineering and Design $55,800 $50,000 $50,000 $161,333
Permitting $42,400 $31,000 $52,000 $55,684
Construction $624,000 $599,000 $370,000 $507,312
Commissioning $35,700 $76,000 $133,000 $28,751
Management and Overhead $41,100 $117,000 $223,000 $100,000
Activity Subtotal $799,000 $873,000 $828,000 $853,080
Total Equipment $1,607,000 $1,930,000 $2,092,000 $1,552,146
Total Installed Cost $2,406,000 $2,803,000 $2,920,000 $2,405,226
Credit: (Baronas and Achtelik, 2017a) – reprint of Table F-10.
For each system, a financial assessment was performed by the National Renewable
Energy Laboratory (NREL) using the Hydrogen Financial Analysis Scenario Tool
(H2FAST). Model input information was provided by station developers, CEC agreement
files, invoices, and the NREL Data Collection Tool. The results from the model provided
station capital costs, station O&M costs, upfront financing by source and other financing
parameters and performance results in the form of scorecards. (Baronas and Achtelik,
2017a)
The scorecard for the On-Site Electrolysis – System 3 is shown below in Figure 1. The
estimated total hydrogen station cost is $2,920,000 and the break-even hydrogen price
is $19.78 per kg, with a retail price of hydrogen at $9.74 per kg. The high break-even
point is due to the high cost of electricity and its large contribution ($10.62 per kg) to
the cost of fuel. The break-even time horizon is 20 years.
8Figure 1: Financial Scorecard for an On-Site Electrolysis System
Credit: (Baronas and Achtelik, 2017a) - reprint of Figure F-3.
In the more recent 2017 report (Baronas and Achtelik, 2017b), additional financial
evaluations were conducted using more detailed cost data than the previous work.
Scorecards were developed for two station types, one with gaseous hydrogen storage
and one with liquid hydrogen storage. Each station was analyzed at two different
utilization growth rates (a slow seven-year growth and a fast three-year growth) and
with two different capacities (180 kg/day and 350 kg/day). It should be noted that an
on-site hydrogen production station was not evaluated.
The scorecard for the 180 kg/day gaseous truck delivery station experiencing slow
growth is shown below.
9Figure 2: Financial Scorecard for a Delivered Gaseous Hydrogen Station
Credit: (Baronas and Achtelik, 2017b) - reprint of Figure B-1
The total capital cost, which includes grant funding, developer match funding and debt
financing is $2,400,000 with an additional $300,000 in O&M funding. Assuming station
utilization reaches 80% in seven years, the results show a levelized retail price of
hydrogen $10.65 per kilogram. Other details of the models’ input and descriptions of
the expenses can be found in Appendix B of the joint report. (Baronas and Achtelik,
2017b)
In comparison with a 180 kg/day Gaseous Delivered Hydrogen – System 1 scorecard
presented in the 2016 report, the updated scorecard does not identify a specific station
developer, nor does it provide information on the distance for the hydrogen delivery.
The previous evaluation listed FirstElement Fuels Inc. as the developer and gave a round
trip delivery distance of 95 miles for a 250 kg capacity tube trailer to a specific site. The
results were similar with an estimated total hydrogen station cost of $2,406,000 and the
break-even price of hydrogen would be $9.46 per kg.
10CHAPTER 3:
Review of Safety Code Requirements
This section reviews and summarizes some of the important safety code requirements.
It reviews the latest edition of NFPA 2 Hydrogen Technologies Code.
Station Design – Safety and Hazard Mitigation Features
Stations are designed to meet all applicable building and fire safety codes, especially
those dealing with the generation, compression, storage and dispensing of hydrogen as
a vehicular fuel. The main reference code for designing a safe hydrogen fueling station
is NFPA 2 Hydrogen Technologies Code 2016 Edition (National Fire Protection
Association, 2016). Other important codes include the most recent versions of the
California Fire Code, California Electrical and Mechanical Codes, and other international
codes.
Chapter 10 Compressed Gaseous Hydrogen (GH2) Vehicle Fueling Facilities of NFPA 2 has
detailed code requirements that provide the basis for the safe design, installation and
operation of a hydrogen fueling station. Some of the code-required and/or prudent
design features for the various sections of a modular station are listed below.
Compressor Module:
Walls are constructed of non-combustible materials with a minimal number of
openings
Designed with forced ventilation to prevent trapped gases
Classified as a Class 1, Division 2 hazardous electrical area with all electrical
equipment meeting proper standards to ensure that they cannot serve as an ignition
source if a combustible gas mixture is present
Equipped with safety devices that may include: flame detectors, smoke detectors,
combustible gas detectors, vibration sensor, and emergency shutdown devices
Designed for earthquake safety by ensuring plumbing between various components
has strain relief that will allow components to move independently of one another
without a resulting breach in the hydrogen plumbing
Equipped with a vent stack to discharge hydrogen vent gas from automatic valves or
relief valves at an elevated height to meet minimum separation distance from
compressor module ventilation intake duct, and to prevent the vent outlets classified
area from extending to ground level beyond the enclosure area
11Storage Module:
Tank array and plumbing designed for earthquake safety by ensuring plumbing has
strain relief that will allow components to move independently of one another
without a resulting breach in the hydrogen plumbing
Vent gas from tank relief valves are directed to an individual vent stack or connected
to a common vent stack with the compressor module
Enclosure or Structure
Walls meant as fire barriers void of openings or penetrations unless protected with
firestops
Constructed with non-combustible materials with 2-hour fire resistance rating
Designed for natural or forced ventilation depending on design to prevent
accumulation of combustible gas mixtures
Enclosure secured to prohibit unauthorized access to the equipment
Buffer area between equipment and enclosure walls for safety and access purposes
Dispenser and Dispensing Area
Electrical components within the dispenser enclosure are designed to meet Class 1,
Division 1 hazardous area requirements
Dispenser equipped with a combustible gas detector and vibration sensor that
triggers an automatic shutdown when activated by an earthquake or vehicle collision
Vent gas from automatic valves or relief valves directed subgrade back to enclosure
area vent stack
Dispensing area equipped with a hydrogen flame detector that watches over the
dispensing area and initiates a system shutdown if a hydrogen flame is detected
Dispenser protected by safety bollards
Code Separation Distances for Gaseous Hydrogen
Stations
One of the main challenges in siting a hydrogen fueling station is meeting the
separation distances requirements of NFPA 2. Understanding these requirements and
other applicable codes is necessary in order to properly and safely install a hydrogen
fueling station.
The critical setbacks for gaseous hydrogen systems are based on the connecting line
size and pressure of the hydrogen storage system. Table 3 below lists the minimum
separation distances for various exposures as listed in Chapter 7 Gaseous Hydrogen of
NFPA 2 (2016 edition). These distances are based on a minimum pipe size of 7.16 mm
internal diameter and a pressure greater than 7500 and less than or equal to 15000
psig. The most critical distances are the lot lines, air intakes and parked cars (shown in
bold). With the exception of air intakes, NFPA states setbacks can be reduced by one-half
12if an appropriately designed 2-hour firewall is constructed between the pressurized gas
and the exposure.
Table 3: NFPA Minimum Separation Distances for Outdoor Gaseous Hydrogen Systems
Minimum Reduced Minimum
Exposures
Distance (ft) Distance (ft)
Group I
Lot lines 34 17
Air intakes (HVAC, compressors, other) 34 34
Operable openings in buildings and
34 17
structures
Ignition sources (open flames, welding) 34 17
Group 2
Exposed persons other than those servicing
16 8
system
Parked cars 16 8
Group 3
Buildings of noncombustible non-fire-rated
14 14
construction
Buildings of combustible construction 14 14
Flammable gas storage systems above or
14 14
below ground
Encroachment by overhead utilities 14 14
Additional exposures, see table in code 14 14
Credit:(National Fire Protection Association, 2016)
In addition to the above separation distances between the outdoor bulk gaseous
hydrogen (GH2) systems and various exposures, Chapter 7 of NFPA 2 shows the
distances for outdoor gaseous hydrogen dispensing systems. The required separation
between the dispensing equipment and the nearest important building, property line
that can be built upon, ignition source, public street, or sidewalk is 10’.
It is extremely important for station owners and developers to work closely with zoning
and permitting agencies to implement a safe design when integrating hydrogen into
existing gasoline retail stations. The construction and installation of compressor and
storage module enclosures has provided many benefits towards this effort. These
enclosures have been designed to provide protection for the hydrogen equipment from
vehicular damage, secure the equipment from the general public, and most importantly,
reduce the risk of an accidental hydrogen release from reaching the exposures listed in
the NFPA table. Based on the locations of the compressor and storage enclosures as
seen in the images of the recent installations (Figure 5 through Figure 11), it appears
that station developers have been able to work with the Authority Having Jurisdiction
(AHJ) and demonstrate that these enclosures can safely be sited along lot lines adjacent
to non-occupied lots or low-traffic areas (alleys). This approach may be necessary for
promising locations that are space constrained.
13CHAPTER 4: Analysis of Required Station
Footprint
When considering whether hydrogen can be integrated into an existing site, it is
important to have a good understanding of the space or “station footprint” that is
needed to not only fit the hydrogen equipment, but also meet the local, state and
federal safety code requirements. The following sections review the available hydrogen
station planning work and take a close look at the designs and layouts of current
hydrogen retail stations. This information is used to determine the required space to
install different types of stations.
Station Footprint Analysis Studies
This section summarizes the station footprint analysis work reported by Sandia
National Labs and the California Energy Commission over the past few years. This work
shows the progress made by station developers, equipment manufacturers and
permitting agencies to reduce the size of the equipment footprints, thus improving the
chances of integrating hydrogen at more retail gas stations.
In a 2014 study, researchers at Sandia National Labs defined a new metric to
characterize the impact and success in the development of codes relevant for hydrogen
refueling stations as the “number of (gasoline) fueling stations that can readily accept
hydrogen”. As noted in the study, a site can readily accept hydrogen when no statutory,
regulatory or local ordinance barriers exist, and a viable business case can be made.
(Harris et al., 2014)
Using the required safety separation distances listed in the 2011 edition of NFPA, the
team developed two code-compliant reference hydrogen systems, a gaseous hydrogen
system and liquid hydrogen system. The gaseous station had a 100 kg/day capacity with
dimensions of 68’ x 78’ (including offset distances), which included an equipment
footprint of 2,650 square feet and a total footprint of about 5,500 square feet with the
addition of separation distances (Figure 3). The liquid station required significantly
more space due to the restrictive safety separations distances for liquid hydrogen.
Liquid stations are not considered in this report since the projected demand for
hydrogen for the study area is relatively low and does not warrant the need for liquid
hydrogen storage. Therefore, this reference station is not discussed here.
14Figure 3: Gaseous Hydrogen Reference Station.
Separation Distances per NFPA 2 (2011). Credit: Reprint of Figure 1 in (Harris et al., 2014)
These reference station footprints were used to evaluate 70 retail gasoline stations in
California’s targeted market to determine if enough space was present to satisfy the
code requirements to allow a hydrogen refueling station to the site. The process
developed in this study is used in the micrositing analysis here as it provides a quick
way to determine if a hydrogen station can be installed at an existing retail gasoline
station. (Harris et al., 2014)
In 2016, the California Energy Commission staff collected footprint information
provided by applicants for 38 stations proposed across three grant solicitations. As
shown in Figure 4, the hydrogen refueling equipment footprint sizes ranged from 660
square feet to 4,300 square feet. Unlike the work in (Harris et al., 2014), this study did
not include NFPA 2 setbacks.
15Figure 4: Hydrogen Station Equipment Footprints
Image is comprised from a sampling of CEC proposals. Distances do NOT include NFPA 2 setbacks. Credit:
(Baronas and Achtelik, 2017a) – reprint of Figure E-2.
The Energy Commission continued the station footprint analysis work in 2017 for the
proposals submitted under GFO-15-605: Light Duty Vehicle Hydrogen Refueling
Infrastructure. In general, they found that these recent designs moved the lower range
bound to a size smaller than previous stations with sizes ranging from 300 square feet
to just over 2,000 square feet. Some applicants included “project” footprints (remote
dispenser) or “excavation” footprints (construction and trenching impacts) that moved
the range from 500 to 2,500 square feet. A closer look at the two types of station
designs funded through this solicitation show that one had an estimated footprint size
of 670 square feet and the other 825 square feet, indicating that the higher scored
designs had a relatively compact design. (Baronas and Achtelik, 2017b)
Design and Footprint Assessment of Retail Hydrogen
Stations
Given that hydrogen equipment layouts can change from the proposal stage to the final
installation, this report examines a few of the recently installed stations to understand
the various layouts, footprints and mitigation measures implemented to address code
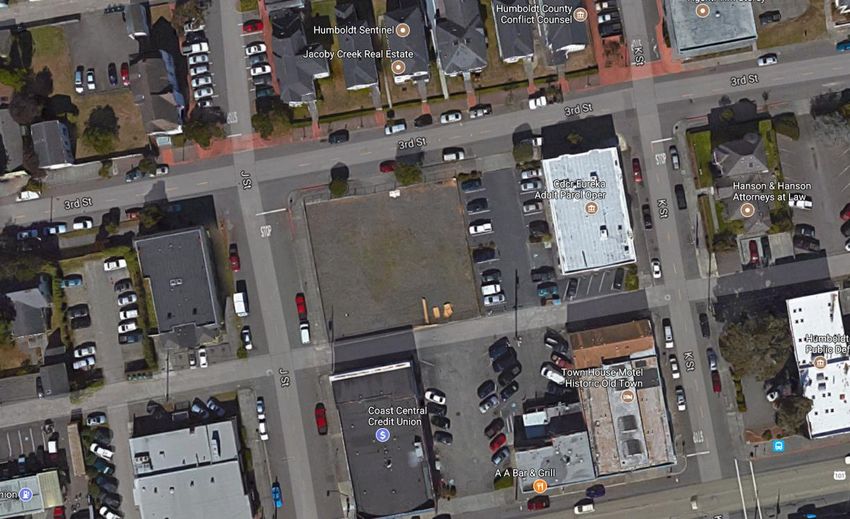
separation distances from critical exposures. Figure 5 through Figure 11 provide
overhead and street view images of four recent retail stations that show the station
layout and the major hydrogen components: electrolyzer module (if applicable),
compressor module, storage module, dispenser, and electrical equipment. Not all
components are visible in each figure.
16Figure 5: Street View of a True Zero Station at a South San Francisco Shell Station.
This shows the compact layout with the dispenser sited in front of the compressor and storage enclosure, and
the electrical panel (far left) just outside the electrical classified area. Credit: Google 2018. Image capture August
2017.
Figure 6: Overhead View of a True Zero Station at a South San Francisco Shell Station.
The image illustrates the linear station design that has an overall complete station footprint, including dispenser
and electrical equipment, of 1,071 square feet. Credit: Google 2018.
17Figure 7: Street View of a True Zero Station at a Valero station in Fremont.
The image illustrates a dispersed layout with compressor / storage area (white module) in back center, dispenser
(dark blue) under canopy, and electrical panel (gray cabinet with white bollards) on the right. Credit: Google 2018.
Image capture August 2017.
Figure 8: Overhead View of a True Zero Station at a Valero station in Fremont.
This image shows the compressor container and storage module in a side-by-side configuration. Credit: Google
2018.
18Figure 9: Street View of an Air Products Hydrogen Fueling Station at a Chevron in Fairfax.
This image shows the secured hydrogen equipment enclosure with the dispenser and electrical panels at the far
left. Credit: Google 2018. Image capture February 2017.
Figure 10: Overhead View of Air Products Hydrogen Fueling Station at a Chevron in
Fairfax.
The perspective shows a linear design with an overall complete station footprint, including dispenser and
electrical equipment, of 1,020 square feet. Credit: Google 2018. Image capture February 2017.
19Figure 11: Overhead View of 76 Station in Ontario That Includes an On-Site Electrolyzer.
The image shows the electrolyzer module with roof-top cooling fans (center) and the gas storage area (left). The
proposed location for the dispenser is under canopy. Credit: Google 2018.
The above images illustrate the various station layout options that are possible
depending on the source of hydrogen (delivered or on-site generation) and the amount
of available space. The main differences are the configuration of the compressor and
storage modules (installed either in a side-by-side or an end-to-end configuration) and
the location of the dispenser (installed adjacent to the equipment or located remotely).
At the gas delivery stations, the compressor and storage modules are surrounded by an
enclosure that provides safety and code benefits that allow the equipment to be
installed within the constraints of the existing infrastructure. For the on-site generation
station (Figure 11), the electrolyzer system is packaged in a modular, containerized
system that is not completely enclosed by a perimeter structure, but has a (2-hour) fire
wall along the side(s) where potential exposures may be an issue.
Google Earth was used to estimate the dimensions for some of the individual hydrogen
equipment, and the associated stations that the dimensions were pulled from:
electrolyzer module (height unknown) 10’ x 40’ (Ontario)
compressor module (standard container size) 8’ x 20’ (True Zero-Fremont)
storage module, nominally 9’ x 13’ (True Zero-Fremont)
storage area 19’ x 35’ (Ontario)
dispenser and dispensing area 15’ x 15’ (True Zero-San Francisco)
electrical service panels 10’ x 10’ (True Zero-San Francisco)
20At stations where the dispenser is installed remotely, the open area required to site a
station is dependent on the footprint of the hydrogen equipment enclosure. These
enclosures house the compressor and storage modules and for safety and maintenance
purposes have a buffer between the modules and the enclosure wall. The enclosure
footprint plus the footprint of the remote dispenser and electrical utility panel result in
the overall station footprint.
Table 4 lists the dimensions and footprints for the enclosure, dispenser and utility
panel, and the total station for these hydrogen stations.
Table 4: Estimated Dimensions (ft) and Footprints (ft2) for Recent Installations
Enclosure Dispenser/Utility Station
Station Fuel Remote
Dimensions Dimensions Dimensions
Location Source Dispenser
(Footprint) (Footprint) (Footprint)
True Zero 17 x 45 17 x 18 17 x 63
South San delivered no
(765) (306) (1,071)
Francisco
True Zero 29 x 31 25 x 25 *
delivered yes
Fremont (899) (325) (1,224)
Air Products 15 x 45 15 x 23 15 x 68
delivered no
Fairfax/LA (675) (345) (1,020)
76 19 x 75 25 x 25 *
electrolysis yes
Ontario (1,425) (325) (1,750)
* For remote dispenser stations, the station dimensions are not shown. NFPA setbacks not included. Credit:
SERC, 2018.
The hydrogen equipment footprints for the three delivered hydrogen stations in Table 4
range from 675 to 899 square feet and are in the same size range as the footprints (670
and 825 square feet) identified in the California Energy Commission sampling of GFO-
15-605 proposals. However, when the additional space needed for the dispenser and
electrical equipment is considered, the overall station footprints range between 1,020 to
1,224 square feet.
The above observations show that it is best to screen potential fueling sites without
incorporating the NFPA minimum code separation distances. This approach prevents
potential site candidates from being prematurely screened out before station developers
can communicate with the Authority Having Jurisdiction (AHJ) about potential
mitigation measures that can address identified issues.
21CHAPTER 5:
Recommended Station Design Options
In this section, the reference and retail station design information will be used to
develop station designs for Eureka and Redding. Given the rapidly evolving station
designs and the potential changes in available hydrogen sources in the State, it will be
difficult to determine what the “best” station design will be in the coming years. As
stated in the CARB/CEC joint report, “identifying which stations are the right stations is
not a static pursuit. The characteristics of the right station are not necessarily the same
in every community, and they evolve with the growing market and new technologies.”
(Baronas and Achtelik, 2017b)
The following steps are recommended to identify the most appropriate station designs
for Eureka and Redding:
1. Determine the station classification and identify the capacity and performance
capabilities as recommended by CARB.
2. Determine the most appropriate source(s) of hydrogen given the station location
relative to a hydrogen production facility.
3. Identify the station design options from the reference or retail station work that are
reasonable for the area.
Station Design Options - Eureka
According to the CARB station classifications, Eureka would be classified as an
intermittent destination station. Given its remoteness, relatively low population and
distance from the established fueling network, total utilization will be low until the
fueling network and vehicle penetration is well established. Capacity and performance
capabilities for an intermittent destination station per CARBs latest recommendations
are 200+ kg/day capacity and a single fueling position (California Air Resources Board,
2017).
One of the main challenges in designing a fueling station in Eureka is determining the
source of hydrogen. For the centrally produced and delivery option, the closest
hydrogen production facility is Air Products & Chemicals, Inc. located in Sacramento.
With a one-way driving distance of 300 miles, tube-trailer deliveries of hydrogen will be
time consuming and expensive.
In addition to the long driving distance, there is a concern of reliable access to Eureka.
Highway 101 and Highway 299 run through forested areas and sections of unstable
hillsides that have a potential for wildfires in the summer months and landslides in the
rainy, winter months that may result in road closures. In addition to the unreliable road
conditions, there may be a concern with delivery truck size restrictions, although both
22routes have and are currently undergoing major road realignment to address this issue.
The long distance and access issues make centrally produced and delivered gas from
Sacramento a fuel reliability concern.
Given the delivery logistics and road access concerns for delivered hydrogen, on-site
hydrogen generation via electrolysis should be considered as a viable option for
sourcing hydrogen. It offers a more secure source of year-round fuel and as the market
matures and utilization increases, gas deliveries would most likely not be able to keep
up with local demand. On-site gas production is, however, more expensive both in
terms of capital costs and the on-going production costs that will result in a high price
per kg for fuel.
It is worth noting that some discussions have occurred regarding the use of inexpensive
Trinity County hydroelectric power to generate hydrogen via electrolysis. If there were
an industrial source of hydrogen in Redding this may make centrally produced and
delivered hydrogen more cost competitive. However, this does not solve the challenges
associated with road closures on Highway 299.
A review of the reference and retail station design options identified two current retail
station design options that are recommended for Eureka: a modular 180 kg/day
system with delivered gaseous system or a modular 130 kg/day system using on-site
hydrogen production via electrolysis. Although the capacity for each system is below
the minimum 200 kg/day as recommended by CARB, this is not expected to be an issue
for many years given the destination station classification and the anticipated low
utilization rate until the market matures.
Station Design Options - Redding
Given its relatively low population compared to the other core market areas, a station in
Redding would be classified as an intermittent destination station. Although there is no
current fueling network beyond state lines, it is an ideal location for a station to provide
travel to the north into Oregon.
Centrally produced and delivery of gaseous hydrogen is the obvious choice for fuel
supply to a station in Redding. Air Products & Chemicals, Inc., located in Sacramento, is
175 miles due south on Interstate 5, a driving time of a little over 3 hours.
Given its anticipated low utilization and somewhat close proximity to a gas supplier, a
modular 180 kg/day system with delivered gaseous system is the recommended
option for the first hydrogen refueling station in Redding.
Estimated Costs for Design Options
Total installed costs and the economic analyses results for the Sandia reference stations
and the NREL retail station design options are summarized in Table 5 below. The table
shows the levelized break-even fuel prices and analysis time horizon for each station
type. The NREL retail station performance results are based on retail station design
23You can also read