Space-filling and benthic competition on coral reefs - PeerJ
←
→
Page content transcription
If your browser does not render page correctly, please read the page content below
Space-filling and benthic competition on
                                    coral reefs
                                    Emma E. George1 ,2 ,* , James A. Mullinix3 ,4 ,5 ,* , Fanwei Meng3 , Barbara A. Bailey3 ,5 ,
                                    Clinton Edwards6 , Ben Felts3 ,5 , Andreas F. Haas7 , Aaron C. Hartmann1 ,8 ,13 ,
                                    Benjamin Mueller9 ,10 , Ty N.F. Roach1 ,5 ,11 , Peter Salamon3 ,5 , Cynthia Silveira1 ,5 ,12 ,
                                    Mark J.A. Vermeij9 ,10 , Forest Rohwer1 ,5 and Antoni Luque3 ,4 ,5
                                1
                                   Department of Biology, San Diego State University, San Diego, CA, United States of America
                                2
                                   Department of Botany, University of British Columbia, Vancouver, British Columbia, Canada
                                 3
                                   Department of Mathematics and Statistics, San Diego State University, San Diego, CA,
                                   United States of America
                                 4
                                   Computational Science Research Center, San Diego State University, San Diego, CA,
                                   United States of America
                                 5
                                   Viral Information Institute, San Diego State University, San Diego, CA, United States of America
                                 6
                                   Scripps Institution of Oceanography, University of California, San Diego, La Jolla, CA,
                                   United States of America
                                 7
                                   NIOZ Royal Netherlands Institute for Sea Research and Utrecht University, Texel, Netherlands
                                 8
                                   Smithsonian National Museum of Natural History, Washington, DC, United States of America
                                 9
                                   CARMABI Foundation, Willemstad, Curaçao
                                10
                                   Department of Freshwater and Marine Ecology/Institute for Biodiversity and Ecosystem Dynamics,
                                   University of Amsterdam, Amsterdam, Netherlands
                                11
                                   Hawai’i Institute of Marine Biology, University of Hawai’i at Mãnoa, Kãne’ohe, HI, United States of America
                                12
                                   Department of Biology, University of Miami, Coral Gables, FL, United States of America
                                13
                                   Organismic and Evolutionary Biology, Harvard University, Cambridge, MA, United States of America
                                 *
                                   These authors contributed equally to this work.

                                        ABSTRACT
                                        Reef-building corals are ecosystem engineers that compete with other benthic or-
                                        ganisms for space and resources. Corals harvest energy through their surface by
                                        photosynthesis and heterotrophic feeding, and they divert part of this energy to defend
                                        their outer colony perimeter against competitors. Here, we hypothesized that corals
                                        with a larger space-filling surface and smaller perimeters increase energy gain while
Submitted 4 September 2020
Accepted 15 March 2021                  reducing the exposure to competitors. This predicted an association between these
Published 29 June 2021                  two geometric properties of corals and the competitive outcome against other benthic
Corresponding author                    organisms. To test the prediction, fifty coral colonies from the Caribbean island of
Antoni Luque, aluque@sdsu.edu           Curaçao were rendered using digital 3D and 2D reconstructions. The surface areas,
Academic editor                         perimeters, box-counting dimensions (as a proxy of surface and perimeter space-
Pei-Yuan Qian                           filling), and other geometric properties were extracted and analyzed with respect to the
Additional Information and              percentage of the perimeter losing or winning against competitors based on the coral
Declarations can be found on            tissue apparent growth or damage. The increase in surface space-filling dimension was
page 19                                 the only significant single indicator of coral winning outcomes, but the combination of
DOI 10.7717/peerj.11213                 surface space-filling dimension with perimeter length increased the statistical prediction
                                        of coral competition outcomes. Corals with larger surface space-filling dimensions (Ds
    Copyright
2021 George et al.
                                        > 2) and smaller perimeters displayed more winning outcomes, confirming the initial
                                        hypothesis. We propose that the space-filling property of coral surfaces complemented
Distributed under                       with other proxies of coral competitiveness, such as life history traits, will provide a
Creative Commons CC-BY 4.0
                                        more accurate quantitative characterization of coral competition outcomes on coral
OPEN ACCESS

                                    How to cite this article George EE, Mullinix JA, Meng F, Bailey BA, Edwards C, Felts B, Haas AF, Hartmann AC, Mueller B, Roach
                                    TNF, Salamon P, Silveira C, Vermeij MJA, Rohwer F, Luque A. 2021. Space-filling and benthic competition on coral reefs. PeerJ 9:e11213
                                    http://doi.org/10.7717/peerj.11213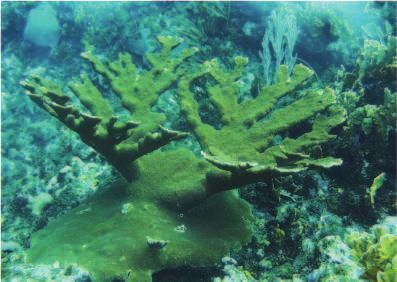
reefs. This framework also applies to other organisms or ecological systems that rely on
complex surfaces to obtain energy for competition.
Subjects Marine Biology, Mathematical Biology
Keywords Coral geometry, Coral competition, Coral ecology, Photogrammetry, 3D modelling
INTRODUCTION
Coral holobionts derive energy from photosynthesis—carried out by endosymbiotic
algae—and heterotrophic feeding to build and maintain their calcium carbonate skeletons
(Porter, 1976; Okie, 2013; Madl & Witzany, 2014). The construction of the skeleton leads
to the overall structure of the coral colony, which yields specific geometric properties
(e.g., surface area, perimeter, volume), and, thereby, shapes the geometry of coral reefs
from cellular to ecosystem scales. Corals also compete with organisms for limited reef
space (Jackson, 1977; Meesters, Pauchli & Bak, 1997), and these battles are fought along
the border or perimeter of a coral colony at relatively small scales (µm–cm). Now, with
modern 3D photogrammetry methods and 2D image merging software, the question of
how coral morphology and its associated geometric properties relate to coral competition
can be explored at high resolution (Gracias & Santos-Victor, 2001; Burns et al., 2015; Leon
et al., 2015; Young et al., 2017; Ferrari et al., 2017; Hatcher et al., 2020; Little et al., 2021).
Competitive interactions generally occur along the coral’s perimeter where polyps
interact with benthic organisms such as fleshy algae, calcifying algae, sponges and other
corals (Jackson, 1977; Jackson, 1979; Buss & Jackson, 1979; Meesters, Wesseling & Bak, 1996).
At these interaction zones, a coral will either overgrow (win), be overgrown (lose), or
display an apparent neutral interaction with the competitor species despite being in direct
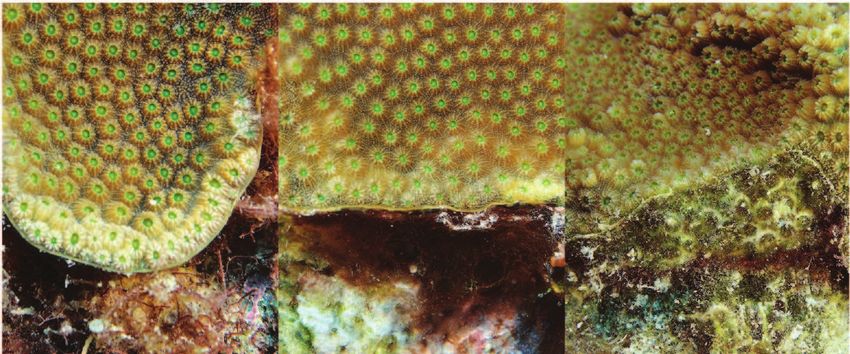
contact (Figs. 1A–1C) (Jackson & Winston, 1982; Barott et al., 2012b; Swierts & Vermeij,
2016). Loss of coral tissue also occurs due to disease and grazing (De Bakker et al., 2016;
Rempel, Bodwin & Ruttenberg, 2020). Corals use several strategies to compete with benthic
organisms including overgrowth (McCook, Jompa & Diaz-Pulido, 2001), the extension
of sweeper tentacles and/or mesenterial filaments (Chornesky & Williams, 1983; Nugues,
Delvoye & Bak, 2004; Galtier d’Auriac et al., 2018), and the use of microbial/chemical
warfare (Barott & Rohwer, 2012; Roach et al., 2017; Roach et al., 2020). Therefore, a longer
coral perimeter increases the number of competitive interactions which requires increased
defenses compared to a shorter perimeter. The energy and resources required to defend
a perimeter are obtained via photosynthesis and heterotrophic feeding across the entire
surface area of a coral colony (Porter, 1976), and then distributed throughout the colony
via the coenosarc tissue (Rinkevich & Loya, 1983; Oren, Rinkevich & Loya, 1997; Henry &
Hart, 2005; Schweinsberg et al., 2015). As the surface area of a colony increases so does the
number of polyps and the potential for energy acquisition and distribution (Jackson, 1979;
Oren et al., 2001; Okie, 2013). Therefore, the relationship between perimeter length (i.e.,
energy needed for defense) and surface area (i.e., potential energy for defense and growth)
may influence the result of the competition (e.g., win, lose or remain neutral).
George et al. (2021), PeerJ, DOI 10.7717/peerj.11213 2/25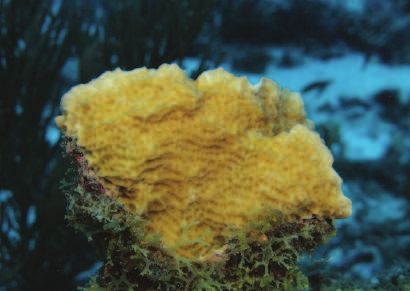
A B C M On reef imaging
Winning Neutral Losing
D E F N 2D perimeter from stitched images O 3D photogrammetry
Curaçao coral models
N
G H I Competition outcome analysis Non-coral mesh removed
Lo
sin
al
3D coral surface analyses
tr
eu
g
Winning
N
Multi-scale perimeter length and
J K L space-filling analysis
3D surface and perimeter
space-filling analyses
+
1 mm 3D surface area, perimeter
1 cm
1m length, & volume analyses
Figure 1 Coral competition outcomes and coral geometry methods. The three possible outcomes of
the coral competition are illustrated for the coral species Orbicella faveolata: (A) winning, the coral over-
grows the algae; (B) neutral, neither coral nor algae is overgrowing one another; or (C) losing, algae are
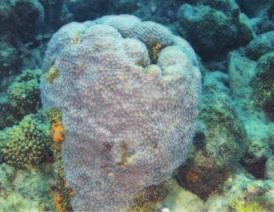
overgrowing the coral and coral skeleton is visible under the algae. (D) Curaçao site locations. The coral
species studied include (E) Acropora palmata, (F) Agaricia agaricites, (G) Colpophyllia natans, (H) Diplo-
ria labyrinthiformis, (I) Montastraea cavernosa, (J) Orbicella faveolata, (K) Pseudodiploria strigosa, and (L)
Siderastrea siderea. (M) Coral colonies were photographed in situ. (N) Close-range, overlapping pictures
were stitched together to generate high-resolution 2D perimeter models. Outlines of the 2D coral perime-
ters were used to calculate the percentage of perimeter winning, losing and remaining neutral to competi-
tors and to calculate the perimeter length and space-filling dimension over a 0.1 mm to 1 m scale range.
(O) Photogrammetry methods were used to create 3D coral models, and non-coral mesh was removed to
measure coral surface and perimeter space-filling dimension, surface area, perimeter length and volume.
Full-size DOI: 10.7717/peerj.11213/fig-1
Many coral geometric properties are dependent on coral morphology and life history.
Massive corals with smaller perimeter-to-surface area ratios demonstrate greater resilience
to algal overgrowth compared to encrusting corals with larger perimeter-to-surface area
ratios (Hughes, 1989; Tanner, 1995; Lirman, 2001). Corals belonging to both morphological
groups invest energy in defense and may be aggressive competitors against other benthic
organisms (Fig. 1) (Swierts & Vermeij, 2016). In contrast, corals with branching and pillar-
like morphologies have minimized their perimeters at the base of the colony and invest
energy in vertical growth following the ‘‘escape in height’’ strategy (Meesters, Wesseling
& Bak, 1996). Colony size has also been suggested to affect the outcome of coral-algal
competition (Sebens, 1982; Ferrari, Gonzalez-Rivero & Mumby, 2012). However, some
studies found that small and large corals were more effective at competing against algae
than medium sized corals (40–80 cm) (Barott et al., 2012a), while others found that medium
size corals were better competitors (Swierts & Vermeij, 2016). Additional studies are thus
needed to determine the effect of coral morphology on coral competition outcomes.
George et al. (2021), PeerJ, DOI 10.7717/peerj.11213 3/25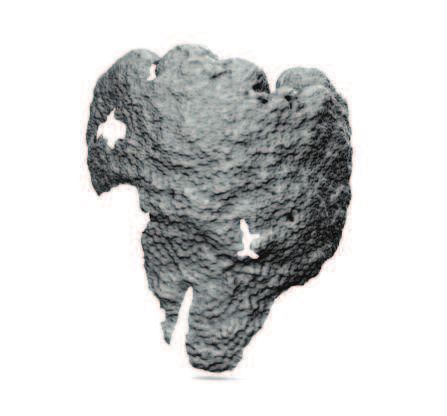
A key factor that has been overlooked when assessing coral competition outcomes is the
                                   variation in the coral morphology and geometry across multiple structural levels (Zawada,
                                   Dornelas & Madin, 2019). Coral colonies with vastly different morphologies can display
                                   similar geometric properties, such as surface area or perimeter length, based on how corals
                                   fill a specific space. For example, a small branching coral may have the same surface area as
                                   a large mounding coral due to the space-filling nature of the branching coral. Maximizing
                                   surface area within a defined space is common in biological systems that seek to increase
                                   energy transfer or biochemical activity such as the inner mitochondrial membrane (Faitg
                                   et al., 2020) and the intestinal villi in animals (Helander & Fändriks, 2014). The opposite
                                   effect is expected for the coral perimeter where a decrease in space-filling would decrease
                                   the number of competitive interactions. Coral geometric properties are also dependent on
                                   the scale they are measured: surface area and perimeter length measured at the polyp-scale
                                   (mm) may be larger than at the colony-scale (m) due to the small-scale polyp features
                                   (Holmes, 2008). Therefore, how much space a coral surface and perimeter fills at a defined
                                   scale will have important biological implications.
                                       The space-filling properties of surfaces and perimeters are assessed using fractal
                                   dimension metrics, which determine how the volume, surface, and perimeter of an
                                   object fill a space across multiple scales (Mandelbrot, 1983; Murray, 2002; Falconer, 2003;
                                   Reichert et al., 2017). Fractal dimensions have been used to analyze the geometry of natural
                                   systems from clouds and forests to plants, corals, and human organs (Mandelbrot, 1983;
                                   Basillais, 1997; Reichert et al., 2017). A physical property of an object—such as its volume,
                                   surface, or perimeter—is fractal if it satisfies two conditions (Halley et al., 2004). First,
                                   the fractal dimension of the measured property is different than its Euclidean dimension,
                                   that is, 2D for a surface or 1D for a perimeter. If the fractal dimension is larger than the
                                   Euclidean dimension, then the property increases exponentially at smaller scales, and
                                   if it is smaller, the property decreases exponentially as one magnifies the object (Peitgen,
                                   Jürgens & Saupe, 1992; Cross et al., 1993; Falconer, 2003; Martin-Garin et al., 2007). Second,
                                   the property must be self-similar or statistically similar across scales. The analysis of this
                                   second condition is more challenging, and many natural objects do not satisfy it (Panico &
                                   Sterling, 1995). Studies often use the term fractal when the first condition is met, even if the
                                   second condition is not confirmed or tested (Murray, 2002; Halley et al., 2004). To avoid
                                   abusing the term fractal and misleading interpretations, the term space-filling dimension
                                   will be used here instead of fractal dimension.
                                       Space-filling studies on corals have analyzed the texture and complexity of coral
                                   structures at small and large scales (Fukunaga et al., 2019; Zawada, Dornelas & Madin,
                                   2019; Sous et al., 2020). At the smallest scale, a box-counting method found that corallites
                                   (
that the surface space-filling dimension was Ds = 2.28–2.61; this large value was associated
                                   to the rich texture of the reef (Zawada & Brock, 2009). The different levels of complexity
                                   is consistent with the space-filling dimension of the 2D perimeter (Dp ) analyzed for large
                                   coral colonies (10–100 m, DP ∼1.2) and coral reefs (1 km, DP ∼1.6), both displaying
                                   larger values than the Euclidean dimension of a curve, D = 1 (Bradbury & Reichelt, 1983;
                                   Mark, 1984; Purkis, Riegl & Dodge, 2006). However, space-filling dimension studies on
                                   coral surfaces and perimeters at the colony level (millimeter to meter scales) have not been
                                   examined in the context of coral competition.
                                       This study explored how Euclidean geometric properties and space-filling dimension
                                   of coral colonies were associated with coral competition outcomes (Figs. 1A–1C). We
                                   hypothesized that corals with larger surface space-filling properties and shorter perimeters
                                   would have more winning interactions than corals with smaller surface space-filling
                                   dimensions and longer perimeters. To test this hypothesis, the space-filling dimensions
                                   and Euclidean geometric properties of 50 coral colonies from the Caribbean island of
                                   Curaçao were obtained using 3D photogrammetry (Figs. 1D and 1M) and analyzed using
                                   simple and multiple regression methods. The results confirmed the hypothesis and showed
                                   significant relationships between coral geometric properties, including surface space-filling
                                   dimension and the competition outcome against benthic organisms.

                                   MATERIALS & METHODS
                                   Field sampling
                                   Fifty coral colonies were randomly sampled from fifteen sites on the island of Curaçao
                                   (Fig. 1D) using the CARMABI field permit (2012/48584). This included four sites in the
                                   eastern (9 colonies), four sites in the central (37 colonies), and three sites in the western (4
                                   colonies) regions of the island. The samples from the central region were more numerous
                                   due to favorable diving conditions, and corals were selected based on observations in the
                                   field. The coral species included Acropora palmata (n = 2), Agaricia agaricites (n = 2),
                                   Colpophyllia natans (n = 5), Diploria labyrinthiformis (n = 4), Pseudodiploria strigosa
                                   (n = 8), Montastraea cavernosa (n = 10), Orbicella faveolata (n = 12), and Siderastrea siderea
                                   (n = 8) (Figs. 1E–1L). The samples were skewed toward massive/boulder morphologies,
                                   reflecting coral species common in Curaçao (De Bakker et al., 2016), and the number of
                                   colonies per species reflected their relative abundance in the field. The depth ranged from
                                   3.5 to 19 m, but the sampling was not designed to capture stratification. The 50 coral
                                   colonies were selected to reflect a range of sizes and interactions including fleshy algae,
                                   calcifying algae, sponges, other corals and/or no competitors (overhangs and sediment).
                                   The 50 colonies were photographed by SCUBA diving using a Canon Rebel T4i with a
                                   35-mm lens and two Keldan 800 lumen video lights to illuminate the corals uniformly.
                                   An in-reef ruler was photographed with the corals to set the scale for the digital models,
                                   placing the ruler along the perimeter of the coral colonies.

                                   2D perimeter models and competition outcomes
                                   The 2D perimeter models were generated by photographing sections of the coral perimeter
                                   at close-range (Figs. 1A–1C). Multiple, overlapping pictures of the entire perimeter were

George et al. (2021), PeerJ, DOI 10.7717/peerj.11213                                                                          5/25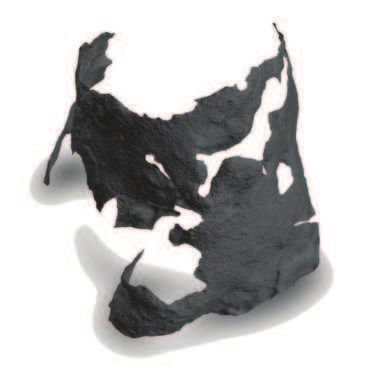
taken as close to the perimeter as possible (Fig. 1M). The high-resolution (mm) overlapping
                                   images of coral perimeters were stitched together to build each coral’s 2D perimeter model
                                   (Fig. 1N) using Globalmatch and Guimosrenderer software, which was developed at Scripps
                                   Institution of Oceanography using methods from Gracias & Santos-Victor (2000), Gracias
                                   & Santos-Victor (2001); the software was accessed with permission through the Sandin
                                   Lab, Scripps Institution of Oceanography. All zones of the perimeter were considered an
                                   interaction zone, even the overhangs and sediment interactions, because corals growing on
                                   or near sediment were interacting with sediment-dwelling organisms (e.g., anemones) and
                                   fleshy algae and/or sponges were present on the underside of overhanging corals. Winning
                                   interactions were determined by coral tissue overgrowing or damaging the competitor,
                                   losing interactions were designated by apparent coral tissue damage or overgrowth by
                                   the competitor, and neutral interactions were identified if neither the competitor nor
                                   the coral showed signs of damage or overgrowth (Figs. 1A–1C). The interaction between
                                   corals and other competing organisms was outlined using a one-pixel pen tool in Adobe R
                                   Photoshop R CC 2014 at the edge of the coral tissue (Fig. 1N). The one-pixel wide outline
                                   was colored in separate RGB channels to designate competition outcomes: red (coral
                                   losing), green (coral winning), and blue (neutral). The fraction of red, green, and blue
                                   pixels was used, respectively, to obtain the percentage of losing (%L), winning (%W), and
                                   neutral (%N) interactions around a coral perimeter.

                                   3D coral models and coral space-filling dimensions
                                   Structure-from-Motion (SfM) photogrammetry was used to create 3D coral models.
                                   Autodesk R ReMake R , 2016 was utilized for 3D construction of coral models (Burns et
                                   al., 2015; Leon et al., 2015) (Fig. 1O) and measurement of geometric properties of corals
                                   such as perimeter, surface area, and volume (Naumann et al., 2009; Lavy et al., 2015). The
                                   initial coral renderings were investigated visually to identify patches of dead coral in the
                                   surface (Fig. S1) and patches without coral tissue were removed from the 3D models. The
                                   resolution of the final 3D models ranged from 1.4 ×10⁻⁴ mm2 to 0.75 mm2 with an average
                                   of 0.070 mm2 , given as the median area of the triangles in the mesh of the 3D models.
                                       Coral space-filling dimension was calculated using a box counting method (Falconer,
                                   2003). The algorithm developed was generalized to multidimensional objects. The boxes
                                   corresponded to rectangles in 2D images and parallelepipeds in 3D images, and the initial
                                   box corresponded to the smallest axis-aligned bounding box containing the point cloud for
                                   each coral model. The logarithm of the number of boxes was plotted against the logarithm
                                   of the box size, and the space-filling dimension D was extracted from the slope of the
                                   linear regression (Eq. S1, Fig. S2). The algorithm was validated against known fractal
                                   objects (Peitgen, Jürgens & Saupe, 1992; Cross et al., 1993; Falconer, 2003). These fractals
                                   were generated using seven recursion levels, and the box-counting used at least seven
                                   bisections (Table S1). The algorithm displayed an error smaller than 3%, and this error
                                   value was used as an upper theoretical error for the estimated space-filling dimension. The
                                   perimeter space-filling dimension (DP ) was calculated from the 2D models by applying
                                   the generalized box-counting algorithm using rectangular boxes. The 2D models were
                                   used due to their higher resolution with respect to the 3D model. The 2D models allowed

George et al. (2021), PeerJ, DOI 10.7717/peerj.11213                                                                      6/25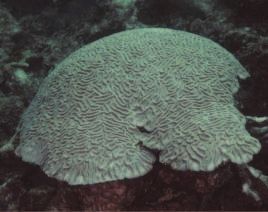
a minimum of ten bisections in the algorithm (smaller than 1 mm resolution), that is, a
                                   space-filling analysis across scales encompassing three orders of magnitude (210 = 1,024).
                                   The surface space-filling dimension (DS ) was calculated from the 3D models by applying
                                   the generalized box-counting algorithm using parallelepiped boxes. A minimum of five
                                   bisections in the algorithm was used. Nonparametric bootstrap resampling was used to
                                   construct 95% bias-corrected and accelerated (BCa) confidence intervals on the slope (D)
                                   of the coral models (Efron & Tibshirani, 1994). Self-similarity over multiple scales was not
                                   tested and therefore, the fractality of the coral surface and perimeter was not determined.
                                   See Supplementary Material for additional details.

                                   Coral geometric properties: perimeter, surface area, volume, polyp
                                   size, and patch area
                                   Coral perimeters were measured from the high-resolution 2D reconstructions as well as the
                                   3D models. Both measurements were used because they had complementary advantages
                                   and disadvantages. The 2D reconstructions displayed higher-resolution at finer scales but
                                   distorted the overall shape of the perimeter due to the reconstructions. The 3D models
                                   captured the perimeter shape more accurately but the resolution at finer scales was lower,
                                   limiting the multiscale analysis. The perimeter length in the 2D reconstructions were
                                   obtained from the Richardson algorithm with a ruler size of 1 mm (Mandelbrot, 1982;
                                   Falconer, 2003). For volume calculations, the fill tool in Autodesk R Remake R was used to
                                   create a mesh that closed the area outlined by the perimeter of the 3D coral model, and
                                   then the volume of the 3D model was measured. Patches of dead tissue within the coral
                                   colonies were removed from 18 coral models to calculate total coral surface area and dead
                                   tissue patch area. Perimeter, surface area, and volume of the 3D models were calculated
                                   with the mesh report tool in Autodesk R Remake R , 2016. Polyp diameters were measured
                                   from the high-resolution perimeter images using ImageJ 1.47v, and 10 polyp diameters per
                                   colony were averaged. Additional details are provided in Supplementary Material, and the
                                   measurements for each variable are available in Data S1.

                                   Correlation with single variables
                                   A least-squares linear regression was used to compare the percentages of losing (%L) and
                                   winning (%W) perimeter with respect to thirteen coral variables: depth (d), polyp diameter
                                   (Pd ), volume (V), surface area (SA), volume-to-surface area (V/SA), surface area-to-polyp
                                   area ratio (SApolyp ), perimeter space-filing dimension (DP ), surface space-filling dimension
                                   (DS ), 2D perimeter length obtained from Richardson’s algorithm (PR ), perimeter length
                                   obtained from 3D models (P3D ), 3D perimeter-to-polyp size ratio (Ppolyp ), 2D perimeter-
                                   to-surface area ratio (PR /SA), and 3D perimeter-to-surface area ratio (P3D /SA). These
                                   variables included absolute values of each coral colony as well as relative values with respect
                                   to polyp size since the energy and nutrient harvesting in the colony is obtained through
                                   polyps. The neutral interactions were a small fraction and were not studied in detail
                                   (Fig. 2). Nonparametric bootstrap resampling was used to construct 95% bias-corrected
                                   and accelerated (BCa) confidence intervals to validate the statistical significance of the slope
                                   p-values (Efron & Tibshirani, 1994). The outputs of the statistical analysis are available in
                                   Data S2.

George et al. (2021), PeerJ, DOI 10.7717/peerj.11213                                                                          7/25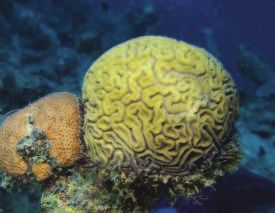
A                                          %L           20%                   46%                                                           75%                      92%

                                                                   2D perimeter
                                                                    projection

                                                                 3D Coral
                                                               Surface Model

                                    B                                                                               C
                                    Competition Outcome Percentage (%)

                                                                                                                        Competition Outcome Percentage (%)
                                                                         100

                                                                                                                                                                         % Losing         % Winning           % Neutral
                                                                                                                                                             100
                                                                         80

                                                                                                                                                              75
                                                                         60

                                                                                                                                                              50
                                                                         40

                                                                                                                                                              25
                                                                         20

                                                                                                                                                               0
                                                                         0

                                                                                                                                                                    Orbicella    Montastraea Pseudodiploria    Siderastrea
                                                                                                                                                                   favaeolata     cavernosa     strigosa         siderea
                                                                               % Losing   % Neutral   % Winning                                                      (n = 12)      (n = 10)      (n = 8)         (n = 7)

                                               Figure 2 Coral models and statistics for competitive outcomes. (A) 2D coral perimeter models and 3D
                                               coral models with different percentages of losing perimeter (%L). Losing regions along the 2D perime-
                                               ter projections are highlighted in red. (B) Box plots of the three perimeter outcomes: losing (%L), neutral
                                               (%N), and winning (%W) (Table S2). The middle line corresponds to the median, the range of the box
                                               contains the 25th to the 75th percentile, and each whisker is the minimum (in absolute value) between the
                                               150% interquartile range (IQR) and the value of the most extreme point on that side of median. The black
                                               dots represent outliers exceeding the whiskers. (C) Bar chart of competitive outcomes for species with n ≥
                                               5. Bars show the average percentage of losing perimeter (black), winning perimeter (dark grey), and neu-
                                               tral perimeter (light grey).
                                                                                                                 Full-size DOI: 10.7717/peerj.11213/fig-2

                                   Multivariate regression using random forests
                                   A multivariate regression analysis of the competitive outcomes as a function of the measured
                                   variables was performed applying the statistical learning method random forests using the
                                   R package randomForest (Liaw & Wiener, 2002). Random forests is a non-parametric
                                   approach, that is, it does not assume linear or non-linear relationships between variables,
                                   and the existence of correlations between input variables does not impact the output
                                   of random forests. Such variables are implicitly grouped with one dominating variable
                                   and the other variables as surrogates (James et al., 2000). Two independent approaches
                                   were used with random forests. First, all measured variables were incorporated in the
                                   initial model. The replication of the analysis using 100,000 random forests trials, however,
                                   indicated that the selection of significant variables and percentage explained variance was
                                   not robust. This was due to relatively small dataset (50 independent coral competitive
                                   outcome measurements) compared to the number of variables (14 in total: the 13 variables
                                   used in the univariate analysis plus the categorical species variable). Second, a bottom-up

George et al. (2021), PeerJ, DOI 10.7717/peerj.11213                                                                                                                                                                         8/25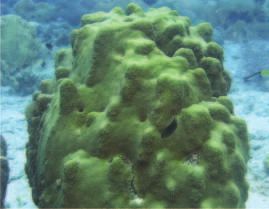
alternative approach was followed. The statistical model for each response (%L and %W)
                                   was constructed by first selecting the variable with the highest univariate correlation and
                                   creating a random forests (RF) model. The remaining variables were added to the model
                                   using the following procedure. A variable was chosen from the unselected variables and
                                   added to the RF model, and the percent explained variance for this model was calculated.
                                   The variable was then removed from the model, and the next variable was added. This was
                                   repeated for all unselected variables, and the variable with the largest percent explained
                                   variance was marked as selected. The model was reset, and the entire procedure was repeated
                                   until 10,000 iterations were completed. The likelihood of variable selection was calculated
                                   as (# times selected)/(10,000). The variable with the highest likelihood of selection was
                                   added to the model, and the total number of variables in the model was increased. This
                                   procedure was repeated until the RF model contained all variables. Codes for all analyses
                                   are available on GitHub (https://github.com/luquelab/George_Mullinix_etal_2021).

                                   RESULTS
                                   Coral competition outcomes
                                   The percentage of losing perimeter of sampled coral colonies ranged from 8% (A.
                                   palmataCUR29 ) to 100% (S. sidereaCUR20 ). Figure 2A provides examples of coral 2D
                                   perimeters and 3D models displaying small (20%) to large (92%) percentage of losing
                                   perimeter. Corals displayed an average of 60% losing, 29% winning, and 11% neutral
                                   interactions along the perimeter (Fig. 2B and Table S2). Among species sampled in five
                                   or more colonies, S. siderea displayed the largest percentage of losing perimeter (81%),
                                   followed by P. strigosa (69%), M. cavernosa (58%), and O. faveolata (56%) (Fig. 2C).
                                   An inverse trend was found regarding the percentage of winning perimeter: O. faveolata
                                   (33%), M. cavernosa (23%), P. strigosa (19%), and S. siderea (12%). The percentage of
                                   neutral perimeter was considerably smaller and followed a different trend: M. cavernosa
                                   (19%), P. strigosa (12%), O. faveolata (11%), and S. siderea (8%). Overall, corals were
                                   losing a major fraction of their perimeters, and the neutral regions represented the smallest
                                   fraction among the three competitive outcomes. On average, S. siderea was the most
                                   vulnerable species, while O. faveolata was the most successful competitor.

                                   Space-filling dimensions of the coral perimeter and coral surface
                                   The space-filling dimension, defined as the box-counting dimension, was interpreted with
                                   respect to the Euclidean dimension (ED) of the property measured, that is, EDS = 2 for
                                   the surface and EDP = 1 for the perimeter. If the surface space-filling dimension (DS )
                                   of a coral was equivalent to the Euclidean dimension (EDS = 2), then the surface would
                                   not strongly depend on the resolution of measurement, and the coral would be studied
                                   as a classical Euclidean object. If a coral instead had a surface space-filling dimension
                                   larger than two (DS > 2), then the surface would be more complex, displaying additional
                                   features at higher resolutions. In this case, the total surface of the coral measured at 1
                                   mm scale would be larger than at 1 m scale. Finally, if a coral had a surface space-filling
                                   dimension smaller than two (DS < 2), it would lose features as the resolution increased
                                   due to the presence of patches devoid of coral polyps (Fig. S1), and the total surface area

George et al. (2021), PeerJ, DOI 10.7717/peerj.11213                                                                       9/25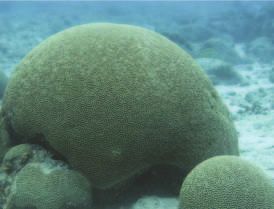
would be smaller at higher resolutions. This concept also applies to the perimeter where
                                   the Euclidean dimension is EDP = 1.
                                       The perimeter space-filling dimensions (DP ) measured from the 2D perimeter
                                   reconstructions of the 50 corals were close to the Euclidean value DP ∼1, which was
                                   contained within the 95% confidence interval for all corals except for three colonies
                                   (Fig. 3A). Incorporating the theoretical error from the space-filling algorithm (3%) placed
                                   the three colonies within the Euclidean value: O. faveolataCUR34 (DP = 1.00 ± 0.03), S.
                                   sidereaCUR54 , (DP = 0.99 ± 0.03), and A. palmataCSA142 (DP = 0.99 ± 0.03). The average
                                   space-filling dimension combining all corals was = 1.00 ± 0.03 (SE), and the mean
                                   values of individual corals ranged from 0.97 (−2.65%) to 1.01 (+1.17%) with respect to the
                                   average perimeter space-filling dimension (1.00). Coral perimeters with high (DP = 1.01
                                   ± 0.03), medium (DP = 1.00 ± 0.01), and low (DP = 0.99 ± 0.01) space-filling dimension
                                   did not display any different salient geometric features (Fig. 3B). Thus, the apparently
                                   convoluted perimeters of coral colonies had a space-filling dimension consistent with
                                   the Euclidean dimension, and small differences in the space-filling dimension were not
                                   geometrically relevant.
                                       The surface space-filling dimensions (DS ) for the 50 coral colonies were also close to
                                   the Euclidean value DS ∼2, which was contained within the 95% confidence interval for
                                   all corals except four: O. faveolataCSA017 (1.94 −1.98 CI), O. faveolataCUR34 (1.94 −1.95
                                   CI), M. cavernosaCUR40_2 (1.90 −1.94 CI), and O. faveolataCUR9 (1.84 −1.88 CI). When
                                   considering the error of the space-filling algorithm (∼3%), O. faveolataCSA017 (DS = 1.94
                                   ± 0.06) and O. faveolataCUR34 (DS = 1.94 ± 0.06) were statistically compatible with the
                                   Euclidean value, while M. cavernosaCUR40_2 (DS = 1.90 ± 0.06) and O. faveolata CUR9
                                   (DS = 1.86 ± 0.06) remained lower. The average space-filling dimension combining
                                   all corals was < Ds > = 2.00 ± 0.06. The mean value of individual corals ranged from
                                   1.84 (−8.01%) to 2.13 (+6.32%) with respect the average surface space-filling dimension.
                                   Corals colonies displayed significant geometrical differences as illustrated in Fig. 3C for
                                   corals with high (2.08 ± 0.04), medium (2.01 ± 0.04), and low (1.90 ± 0.03) surface
                                   space-filling dimensions. Corals with high surface space-filling dimensions had little to no
                                   patches of missing coral tissue and displayed a more texturized surface. Coral colonies with
                                   low space-filling dimensions instead displayed patches of missing coral tissue (Fig. S1),
                                   peninsula-like perimeters, and/or smoother/flatter surfaces (Fig. 3). Thus, the surface of
                                   coral colonies had space-filling dimensions near the Euclidean value, but they displayed
                                   a much larger relative variance with respect to the perimeter space-filling dimension and
                                   several contained salient geometric features between low and high surface space-filling
                                   dimensions.

                                   Relationship between competitive outcomes and individual geomet-
                                   ric variables
                                   The percentage of losing (%L) and winning (%W) perimeter was studied as a function of the
                                   14 geometric and biological variables using linear regression analysis (Data S2). The surface
                                   space-filling dimension was the only variable that displayed a strong significant correlation
                                   with %L or %W (Figs. 4A and 4B). Percentage of losing perimeter (%L) correlated

George et al. (2021), PeerJ, DOI 10.7717/peerj.11213                                                                      10/25
A
2.4
= 2.00 ± 0.06
Space-Filling Dimension (D)
2.2 Surface CVS = 3%
2.0
1.8
1.6
CSA147-2
CUR20-1
CUR41-2
CUR41-1
CUR24-2
CUR24-1
CUR40-3
CUR40-2
CSA025
CSA142
CSA150
CSA035
CSA031
CSA195
CSA017
CUR1-2
CUR10
CUR36
CUR61
CUR60
CUR29
CUR58
CUR32
CUR22
CUR13
CUR71
CUR37
CUR56
CUR69
CUR11
CUR52
CUR27
CUR70
CUR23
CUR28
CUR25
CUR40
CUR53
CUR54
CUR59
CUR46
CUR38
CUR39
CUR34
CUR8
CUR4
CUR3
CUR1
CUR6
CUR9
1.4
1.2 = 1.00 ± 0.03
Perimeter CVP = 3%
1.0
0.8
= 1.01 ± 0.02 = 0.999 ± 0.005 = 0.988 ± 0.008
B (CUR1-2) (CUR40) (CSA142)
C = 2.08 ± 0.04
(CSA035)
= 2.01 ± 0.04
(CUR41_1)
= 1.90 ± 0.03
(CUR40_2)
Figure 3 Coral surface and perimeter space-filling dimensions. (A) Plot of coral surface (top) and
perimeter (bottom) space-filling dimensions with the means (black dots), 5–95% confidence intervals
(whiskers), and labels associated with each coral sample. The solid line provides a reference for the
Euclidean dimensions: EDp = 1 (perimeter) and EDs = 2 (surface). The mean values for the space-filling
dimension of the perimeter (Dp ) and the surface (Ds ) (± standard deviation) and their respective
coefficients of variation (CV = standard deviation/mean * 100) are also included. (B) Two-dimensional
coral perimeter models displaying space-filling dimensions below the Euclidean dimension. (C) Three-
dimensional coral models associated with high, medium, and low space-filling dimensions for the coral
surface. Empty spaces or holes in the 3D models show loss of coral tissue where the polyps have died or are
overgrown by competing organisms.
Full-size DOI: 10.7717/peerj.11213/fig-3
George et al. (2021), PeerJ, DOI 10.7717/peerj.11213 11/25% Losing % Winning
100
A B slope = 144 ± 45
80
R2 = 0.18
80
p-value = 0.0023**
60
%W
60
%L
40
40
20
20
slope = -145 ± 45
R2 = 0.18
p-value = 0.0021**
0
0
1.85 1.90 1.95 2.00 2.05 2.10 1.85 1.90 1.95 2.00 2.05 2.10
Ds Ds
C 25
D 35
%Explained Variance
+ PR/SA
+S
%Explained Variance
+V
+d
+ P3D/SA
30
+d
+S
20
+ V/SA
+ SA
+ Ppolyp
+ DP
25
DS + P3D
+ P3D/SA
+ SApolyp
15 + V/SA
+ Pd
+V
+ Pd
+ PR
20
+ PR/SA
+ SA
10
+ SApolyp
DS + P3D
+ Ppolyp
15
+ PR
5
+ DP
10
2 3 4 5 6 7 8 9 10 11 12 13 14 2 3 4 5 6 7 8 9 10 11 12 13 14
# Variables # Variables
E 14 Frequencies
F 14 Frequencies
13 100 13 100
12 12
50 50
11 11
10 0 10 0
# Variables
# Variables
9 9
8 8
7 7
6 6
5 5
4 4
3 3
2 2
1 1
d
Pd
S A p o ly p
P p o ly p
DS
S
P 3 D /S A
V /S A
V
P R /S A
SA
DP
P3D
PR
d
P p o ly p
S A p o ly p
Pd
DS
P 3 D /S A
V /S A
SA
P R /S A
V
S
DP
P3D
PR
Selected Variables Selected Variables
Figure 4 Relationships between coral geometry and coral competition outcomes: univariate and mul-
tivariate analyses. The left panel of graphs relate to the percentage of losing perimeter (%L) and the right
panel of graphs relate to the percentage of winning perimeter (%W). (A) and (B) Coral competition out-
come as a function of the surface space-filling dimension with a linear regression fitted using the least-
squares method. Coral surface space-filling dimension is the best single indicator of coral competition
outcomes. (C) and (D) Bottom-up random forest model construction of coral geometric variables with
the explained variance plotted as each variable is added. The solid black line corresponds to the average
variance explained (%), and the grey area represents the 95% confidence interval. (E) and (F) Variable se-
lection likelihood maps where the frequency (%) of the selected variable is shown. Frequencies range from
0% (white) to 100% (black). Variables include surface space-filling dimension (DS ), perimeter from 3D
models (P3D ), species (S), 3D perimeter-to-surface area ratio (P3D /SA), depth (d), volume-to-surface area
(V/SA), polyp diameter (Pd ), volume (V), 2D perimeter-to-surface area ratio (PR /SA), surface area (SA),
surface area-to-polyp area ratio (SApolyp ), 3D perimeter-to-polyp size ratio (Ppolyp ), perimeter from 2D
models (PR ), and perimeter space-filing dimension (DP ).
Full-size DOI: 10.7717/peerj.11213/fig-4
George et al. (2021), PeerJ, DOI 10.7717/peerj.11213 12/25negatively with surface space-filling dimension (slope = −145 ± 45, R2 = 0.18,p-value =
0.0021∗∗ ), while percentage of winning perimeter (%W) correlated positively with surface
space-filling dimension (slope = 144 ± 45, R2 = 0.18,p-value = 0.0023∗∗ ). This was
consistent with %W being negatively correlated with %L (slope = −0.9 ± 0.1, R2 = 0.8,p-
value = 2. 2×10⁻¹⁶ ∗∗∗ ) (Fig. S3). The surface area was the only other variable that came
close to being significant, but it displayed a much weaker correlation with the competitive
outcomes (%L: R2 = 0.09,p-value = 0.05; %W: R2 = 0.08, p-value = 0.05) (Fig. S4). Thus,
the mean values of the surface space-filling dimension displayed the strongest correlation
with competitive outcomes, capturing 18% of the variance (Figs. 4A and 4B, R2 = 0.18).
Coral competitive outcomes and geometric variables were also analyzed separately
for species represented by more than five sampled colonies: Orbicella faveolata (n = 12),
Montastraea cavernosa (n = 10), Pseudodiploria strigosa (n = 8), and Siderastrea siderea
(n = 7). All species displayed a decrease in the percentage of losing perimeter (%L)
as surface space-filling dimension increased (Fig. S5). However, the relationship was
statistically significant only for S. siderea, and the variance in the other species was too large
with respect to the sample size. No other variables significantly correlated with %L or %W
in the species-specific analysis.
Importance of combined geometric variables in coral
competition outcomes
The bottom-up random forests (RF) model approach yielded a robust, repeatable
construction of the non-parametric statistical model. For the percentage losing perimeter
(%L), the addition of perimeter (P3D ) and species (S) to the surface space-filling dimension
(Ds ) sharply increased the percentage explained variance in the model to 23 ± 1% (Fig. 4C).
Adding more variables, however, decreased the percentage of variance explained in the
model due to the limited dataset size (n = 50). The selection of perimeter (P3D ) and
species (S) as the second and third most important variables, respectively, was very robust
with a frequency close to 100% (Fig. 4E). For the percentage winning perimeter (%W),
the addition of perimeter (P3D ) and perimeter-to-surface area (P3D /SA) to the surface
space-filling dimension (Ds ) sharply increased the percentage explained variance in the
model to 25 ± 2% (Fig. 4D). The addition of variables involving coral volume-to-surface
area (V/SA), surface area (SA), sampling depth (d), and projected perimeter-to-surface
area (PR /SA) led to a maximum percentage explained variance of 32 ± 1%. The addition
of more variables decreased the percentage variance explained due to the limited size of
the dataset (n = 50). The selection of the perimeter (P3D ) as the second most important
variable had a frequency of 100% (Fig. 4F). The subsequent variables were not always
selected in the same order of importance. However, in both analyses (%L and %W),
the frequency of the least important variables selected were robust (Figs. 4E and 4F). In
particular, the perimeter space-filling dimension was selected as the least relevant variable
in predicting coral competitive outcomes. This is consistent with the fact that no apparent
geometric features were observed in the initial space-filling analysis of the perimeter (Fig.
3). The results for the percentage losing and winning perimeters therefore indicated that
George et al. (2021), PeerJ, DOI 10.7717/peerj.11213 13/25the surface space-filling dimension and perimeter length were the most important variables
associated to the coral competition outcomes.
Hierarchical analysis of coral competitive outcomes and coral
geometry
When analyzing the hierarchy of the most relevant geometric variables for the percent
of losing perimeter (%L) and winning perimeter (%W), the primary node corresponded
to the surface space-filling dimension, and the secondary node was the perimeter from
3D models (Fig. 5). For the percent losing tree (Fig. 5A), corals with DS ≥ 2 had the
smallest %L, and among those, corals with P3D < 91 cm formed the group with the smallest
percentage of losing perimeter (24%). A similar trend was found for the percent winning
tree (Fig. 5B): corals with DS ≥ 2 and P3D < 91 cm had largest percentage of winning
perimeter (84%). For corals with DS < 2, smaller perimeters related to increased %L and
decreased %W compared to corals with DS < 2 and larger perimeters. The fact that small
perimeters can have opposite effects depending on the surface space-filling dimension
may explain why the perimeter length did not display a correlation in the single variable
analysis. Overall, these results suggest that corals with a surface space-filling dimension DS
≥ 2 and relatively small perimeters have better competition outcomes (i.e., less losing and
more winning outcomes).
DISCUSSION
Hypothesis: surface space-filling dimension and coral
competitive edge
This study hypothesized that an increase in surface space-filling dimension and a reduction
in perimeter would be associated with successful coral competitive outcomes. The
rational was that the complexity added by the surface space-filling dimension would
increase the potential for energy harvesting without necessarily leading to a larger coral
colony and exposing more perimeter to benthic competitors. The univariate, statistical
analysis indicated that the surface space-filling dimension was the most important variable
associated to the percentage of winning and losing perimeter, and the multivariate analysis
confirmed that the perimeter was the second most important variable (Fig. 4). The selection
of these variables and their associated trends with coral competitive outcomes supported
the initial hypothesis (Fig. 5). Therefore, this study indicates a potential causality of higher
surface space-filling dimensions in the resilience and health of corals, and longitudinal
studies that assess changes in competitive outcomes over time will be necessary to confirm
this prediction.
Relationship between coral geometry and coral interaction outcomes
The optimal combination of coral geometric properties explained 23 ± 2% to 32 ± 1%
of the coral interaction outcomes, where the surface space-filling dimension was the best
single indicator for the percentage of losing or winning perimeter (Fig. 4). The space-filling
dimension or complexity of a coral surface likely reflects the ability to harvest energy
through heterotrophic feeding of individual polyps and photosynthesis carried out by the
George et al. (2021), PeerJ, DOI 10.7717/peerj.11213 14/25A Losing perimeter (%L) B Winning perimeter (%W)
%L=60 %W=29
100%
Ds < 2 100%
DS ≥ 2 DS ≥ 2
Ds < 2
%L=71 %L=49
%W=24 %W=52
51% 49%
82% 18%
P3D < 541cm P18%3D ≥ 91cm
P3D < 103cm P3D ≥ 103cm P3D < 91cm
P3D ≥ 91cm P3D ≥ 541cm P3D < 91cm
%L=96 %L=68 %L=52 %L=24 %W=19 %W=34 %W=42 %W=84
4% 47% 43% 6% 55% 27% 14% 14%
Figure 5 Interdependence of optimal variables in the predictions of outcomes. Average regression trees
generated for the percentage of (A) losing perimeter (%L) and (B) winning perimeter (%W) including the
selected variables in the refined random forests analysis (Fig. 4). Each cluster displays the average outcome
and the value below the box indicates the percentage of data contained in the cluster. The intensity of blue
is proportional to %L and the intensity of green is proportional to %W. Variables include the perimeter
length from 3D models (P3D ) and the coral surface space-filling dimension (Ds ).
Full-size DOI: 10.7717/peerj.11213/fig-5
endosymbiotic Symbiodiniaceae (Bachar et al., 2007). Losing corals had surface space-filling
dimensions below the Euclidean dimension (DS < 2), and some of the reduced complexity
was associated with patches (absence of coral tissue) and small, smooth colony surfaces
(Fig. 3C, Fig. S1). The patches of missing coral tissue reduce the network of polyps, thus
impeding the allocation of resources. However, patch area alone failed to correlate with
either competitive outcomes or space-filling dimension (Fig. S6), and significant trends
between competitive outcomes and space-filling dimension were also observed in corals
without patches (Fig. S7). Therefore, the patches of dead tissue are only one of multiple
features relevant to coral competitive outcomes measured by the space-filling dimension
metric.
The perimeters of coral colonies with low space-filling dimensions also displayed large
peninsula-like shapes that increase the perimeter length along with the potential number
of competitive interactions (Fig. S1). The two features, dead tissue patches and perimeter
peninsulas, may elucidate the low surface space-filling dimension of corals with larger
percentages of dead or overgrown tissue along the perimeter. Conversely, winning corals
had surface space-filling dimensions larger than the Euclidean dimension (DS > 2) which
translated into large surface areas with more complex surface features and no patches (Fig.
3C). This implies a denser network of polyps to feed and harvest energy, thus explaining the
larger percentage of positive competitive outcomes for coral colonies with larger surface
space-filling dimensions.
In addition to surface space-filling dimension, the perimeter length was another
significant geometric variable in coral competition outcomes (Fig. 4). Corals with larger
surface space-filling dimensions and smaller perimeters displayed increased %W and
decreased %L (Fig. 5). This supports the hypothesis that more energy is required to defend
George et al. (2021), PeerJ, DOI 10.7717/peerj.11213 15/25a longer perimeter, and that corals with complex surfaces may provide additional resources
for defense compared to corals with less complex surfaces. However, smaller perimeters
appeared unfavorable to corals with surface space-filling dimensions smaller than two (Fig.
5). This is a surprising result, but the corals in these categories had the highest %L (96%)
and lowest %W (19%). The corals also displayed relatively smooth perimeters with no
peninsula-like features compared to corals with DS < 2 and longer perimeters. The loss
of perimeter features potentially correspond to significant coral tissue damage around the
perimeter, and despite the reduced perimeters, the corals may have lost too much surface
complexity, thus reaching an unavoidable trajectory to be overgrown by competitors.
However, the dynamics of coral competitive outcomes need further investigation to
determine how these coral geometrical properties relate to the resilience of corals over
time.
Surface area had significant correlations with competition outcomes (Fig. S4), but the
relationship was weaker than the surface space-filling dimension. This suggests that the
increase in surface area per cm2 captured by the space-filling dimension provides a more
accurate account for coral competitiveness than surface area alone, and that a larger surface
area also does not necessarily correspond to a higher space-filling dimension. For example,
Orbicella faveolataCUR36 displayed a higher space-filling dimension than Orbicella faveolata
CUR08 and also had a greater percentage of winning perimeter despite its smaller surface
area (smaller colony). The information regarding the relative increase in effective surface
area per cm2 captured by the space-filling dimension justifies the higher explained variance
obtained by this metric compared with surface area alone.
Species-specific life traits also played a role in competition outcomes since coral
species was a relevant variable in the multivariate analysis for the percentage of losing
perimeter (Fig. 4). Several of the species studied had similar mounding morphologies
(Figs. 1G–1L), although they differ in photosynthesis rates, growth rates and defense
strategies (McCook, Jompa & Diaz-Pulido, 2001; Roth, 2014). Orbicella faveolata has higher
maximum photosynthesis rates, photochemical efficiency and symbiont density compared
to other species such as M. cavernosa, P. strigosa and S. siderea (Muthiga & Szmant, 1987;
Warner, Fitt & Schmidt, 1996; Castillo et al., 2014; Scheufen, Iglesias-Prieto & Enríquez,
2017). Out of these species, O. faveolata displayed the largest average surface space-filling
dimension, suggesting that the space-filling property of O. faveolata is maximized for
photosynthesis. The greater photosynthetic capabilities of O. faveolata may also explain the
competitive outcome results, where O. faveloata had the greatest percentage of winning
interactions compared to the other three species. The two species, P. strigosa and S.
siderea, are considered weedy coral species, and they had the greatest percentage of losing
perimeter (Toth et al., 2019). On the other hand, Montastraea cavernosa is a slow growing
species (Manzello et al., 2015) that had few losing interactions, suggesting that slower
growing corals invest more resources in protecting their perimeters, as observed in the
increased sweeper tentacles near interaction zones of M. cavernosa colonies (Chornesky
& Williams, 1983). The energy tradeoff between growth and defense directly affects the
competition outcomes along the perimeter of a coral (Swierts & Vermeij, 2016), and
different coral species have evolved various strategies to balance this tradeoff. Our study
George et al. (2021), PeerJ, DOI 10.7717/peerj.11213 16/25focused on mounding morphologies (Figs. 1E–1L), and additional data for species with
other morphologies and life traits will be necessary to confirm the relationship between
geometric properties and coral competitive outcomes.
The combination of surface space-filling dimension, perimeter, and additional geometric
properties were able to explain up to 30% of the variance in the coral competition
outcomes. Methodologies that improve the 3D coral model reconstruction and increase
the signal-to-noise ratio may lead to geometric analyses with higher explained variances.
Additionally, other factors are known to be relevant in determining the outcomes of
coral space competition with other sessile organisms. Physiological factors display strong
codependences with the geometry (Jackson, 1979; Merks et al., 2004; Zawada, Dornelas
& Madin, 2019), but another factor that may be orthogonal and complementary to the
geometry is the assembly of microbes associated with the coral and its competitors. Microbes
and their associated metabolites are important in mediating the ecological interaction of
corals with other benthic organisms (Haas et al., 2016; Silveira et al., 2019; Roach et al.,
2020), along with coral disease (De Bakker et al., 2016). The combination of geometry,
species-specific life traits, and microbial properties will improve the prediction of coral
competition outcomes in future studies.
Coral space-filling dimensions over multiple scales
The space-filling dimensions of the coral colonies obtained from this study were also
compared to prior space-filling or fractal studies encompassing smaller (coral septa
or polyp) and larger (reef) scales (Fig. 6). The qualitative analysis indicated that the
space-filling dimension of corals increased from millimeter to kilometer scales, where
the space-filling dimensions were closer to the Euclidean dimensions at the colony scale
investigated here. This is a potential consequence of different physical factors and biometric
allometry across scales. Water moves via diffusion in small-scale (µm to mm) boundary
layers close to coral surfaces, and moves by advection at larger scales (m) due to wave
motion and currents passing over reefs (Barott & Rohwer, 2012). A change in mechanisms
from small to large scales likely leads to scale-dependent evolution of calcium carbonate
structural architecture that resists water movement (e.g., a single corallite compared to an
entire coral reef). In fact, the space-filling dimensions at the coral reef scale displayed similar
values to seagrass beds and hard ground patches (Zawada & Brock, 2009), suggesting that
the topography of the underlying substrate is responsible for the increased space-filling
dimension at these larger scales. However, these calculations were constrained by the
models’ resolution, and future methods that implement a continuum of mm to km scales
will help identify changes in reef space-filling properties over spatial scales.
The surface space-filling analysis and coral competition outcomes also extend to the
reef level where large-scale interactions between coral reefs, sand flats and algae-dominated
patches occur. The methods presented here also provide a framework for the study of other
marine or even terrestrial systems. For example, crustose coralline algae are important
reef calcifying phototrophs that rely on surface area to obtain energy and compete with
other benthic organisms including coral. These methods are also applicable to terrestrial
systems like forests where trees acquire energy through photosynthesis and obtain nutrients
George et al. (2021), PeerJ, DOI 10.7717/peerj.11213 17/252.6
Surface
Zawada
2.4 Perimeter et al., 2009
2.2
Current
2 Study
Dimension
1.8
Purkis et al., 2006
1.6
Martin-Garin
1.4 et al., 2007
1.2 Bradbury & Reichelt, 1983; Mark, 1984
1 Current Study
Martin-Garin
0.8 et al., 2007
-4 -3 -2 -1 0 1 2 3 4
10 10 10 10 10 10 10 10 10
Scale (meters)
Figure 6 Coral space-filling dimension from corallite to reef scales. The plot shows the range of
space-filling dimensions measured across various scales from different coral studies. The space-filling
dimensions are grouped in two categories: Surface space-filling dimension (dark grey) and perimeter
space-filling dimension (light grey). For the perimeter, the ranges correspond to coral colonies (current
study—box-counting method), larger coral colonies (Bradbury & Reichelt, 1983; Mark, 1984)—step-
counting method), and coral reefs (Purkis, Riegl & Dodge, 2006—box-counting method). For the surface,
the ranges correspond to corallite texture (Martin-Garin et al., 2007)—box-counting method), corallite
structure (Martin-Garin et al., 2007)—box-counting method), coral colonies (current study—box-
counting method), and coral reefs (Zawada & Brock, 2009—variation method).
Full-size DOI: 10.7717/peerj.11213/fig-6
through their roots, which display space-filling properties, while also shunting resources
to other trees through mycorrhizal networks (Simard et al., 1997). Therefore, this work is
pertinent to organisms or ecological systems that rely on surfaces for energy acquisition
and share resources through biological networks.
CONCLUSIONS
This study found a significant association between coral geometry and coral competition
outcomes, explaining up to 32% of the variance in a diverse dataset. Corals with losing
outcomes had low surface space-filling dimensions (DS < 2) and displayed patches with
no polyps and large peninsulas, while winning corals (DS > 2) were more compact and
displayed more complex and rugose surfaces with smaller perimeters. These findings
support the hypothesis that larger surface space-filling dimensions favor energy harvesting,
and smaller perimeters reduce the invasion of benthic competitors, providing a competitive
edge to corals with these properties. This approach also provides a framework to study
coral space-filling and benthic competitions at large reef scales along with the study of
other organisms or ecological systems that rely on complex surfaces to obtain energy for
competition.
George et al. (2021), PeerJ, DOI 10.7717/peerj.11213 18/25You can also read