Characterization of aerosol number size distributions and their effect on cloud properties at Syowa Station, Antarctica
←
→
Page content transcription
If your browser does not render page correctly, please read the page content below
Atmos. Chem. Phys., 21, 12155–12172, 2021
https://doi.org/10.5194/acp-21-12155-2021
© Author(s) 2021. This work is distributed under
the Creative Commons Attribution 4.0 License.

Characterization of aerosol number size distributions and their
effect on cloud properties at Syowa Station, Antarctica
Keiichiro Hara1 , Chiharu Nishita-Hara2 , Kazuo Osada3 , Masanori Yabuki4 , and Takashi Yamanouchi5
1 Department  of Earth System Science, Faculty of Science, Fukuoka University, Fukuoka, 814-0180, Japan
2 Fukuoka  Institute for Atmospheric Environment and Health, Fukuoka University, Fukuoka, 814-0180, Japan
3 Graduate School of Environmental Studies, Nagoya University, Nagoya, 464-8601, Japan
4 Research Institute for Sustainable Humanosphere, Kyoto University, Kyoto, 611-0011, Japan
5 National Institute of Polar Research, Tokyo, 190-0014, Japan

Correspondence: Keiichiro Hara (harakei@fukuoka-u.ac.jp)

Received: 12 January 2021 – Discussion started: 26 January 2021
Revised: 8 July 2021 – Accepted: 9 July 2021 – Published: 13 August 2021

Abstract. We took aerosol measurements at Syowa Station,         tion of aerosol properties such as number concentrations and
Antarctica, to characterize the aerosol number–size distribu-    size distributions in the Antarctic troposphere during sum-
tion and other aerosol physicochemical properties in 2004–       mer. Here, we assess the hypothesis that UV enhancement in
2006. Four modal structures (i.e., mono-, bi-, tri-, and quad-   the upper troposphere by the Antarctic ozone hole modifies
modal) were identified in aerosol size distributions during      the aerosol population, aerosol size distribution, cloud con-
measurements. Particularly, tri-modal and quad-modal struc-      densation nuclei capabilities, and cloud properties in Antarc-
tures were associated closely with new particle formation        tic regions during summer.
(NPF). To elucidate where NPF proceeds in the Antarctic,
we compared the aerosol size distributions and modal struc-
tures to air mass origins computed using backward trajec-
tory analysis. Results of this comparison imply that aerosol     1   Introduction
size distributions involved with fresh NPF (quad-modal dis-
tributions) were observed in coastal and continental free tro-   The Antarctic is isolated from human activities occurring in
posphere (FT; 12 % of days) areas and marine and coastal         the mid latitudes. In spite of the slight amount of human ac-
boundary layers (1 %) during September–October and March         tivity in the Antarctic, such as research activities at each sta-
and in coastal and continental FT (3 %) areas and marine and     tion and tourism mostly in the Antarctic Peninsula during
coastal boundary layers (8 %) during December–February.          summer, the source strength of anthropogenic species (e.g.,
Photochemical gaseous products, coupled with ultraviolet         black carbon from combustion processes) is negligible in
(UV) radiation, play an important role in NPF, even in the       the Antarctic circle at the moment (e.g., Weller et al., 2013;
Antarctic troposphere. With the existence of the ozone hole      Hara et al., 2019). Consequently, aerosol measurements in
in the Antarctic stratosphere, more UV radiation can enhance     the Antarctic have been taken to ascertain aerosol physico-
atmospheric chemistry, even near the surface in the Antarctic.   chemical properties, atmospheric chemistry, and their effects
However, linkage among tropospheric aerosols in the Antarc-      on climate change under Earth’s background conditions (i.e.,
tic, ozone hole, and UV enhancement is unknown. Results          cleanest and pristine conditions).
demonstrated that NPF started in the Antarctic FT already at        Despite the cleanest conditions prevailing in the Antarc-
the end of August–early September by UV enhancement re-          tic, concentrations of condensation nuclei (CN) show clear
sulting from the ozone hole. Then, aerosol particles supplied    seasonal variations with a maximum in summer and a mini-
from NPF during periods when the ozone hole appeared to          mum in winter (Gras et al., 1993; Hara et al., 2011a; Weller
grow gradually by vapor condensation, suggesting modifica-       et al., 2011). This seasonal variation relates to supply and de-
                                                                 position processes. In addition to primary aerosol emissions

Published by Copernicus Publications on behalf of the European Geosciences Union.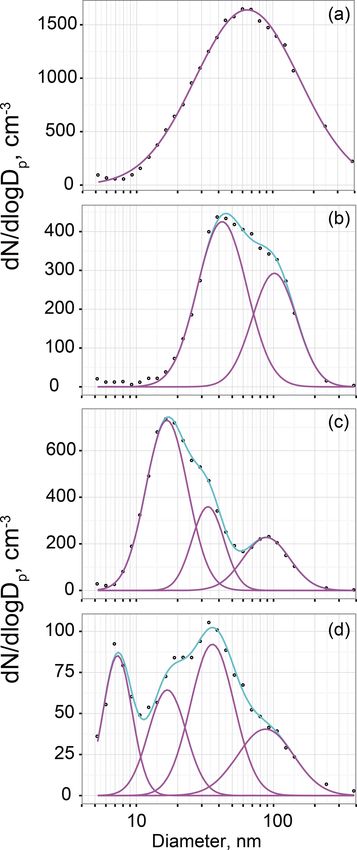
12156                                                               K. Hara et al.: Aerosol size distributions in the Antarctic

such as sea-salt aerosols from sea-surface and sea-ice regions      nen et al., 2013; Kim et al., 2019) have emphasized that NPF
(e.g., Hara et al., 2020), atmospheric aerosol formation (i.e.,     occurs as early as September in the Antarctic.
new particle formation, NPF) is important to supply atmo-              Knowledge and discussion of condensable vapors (i.e.,
spheric aerosols (Kulmala et al., 2013; Kerminen et al., 2018)      aerosol precursors) is fundamentally important to elucidate
and to affect climate through indirect processes (Asmi et al.,      microphysical processes such as NPF and growth and lo-
2010; Dall’Osto et al., 2017). Measurements of aerosol size         cations at which NPF occurs. Earlier works have empha-
distributions were taken continuously to elucidate and dis-         sized examination of the following condensable vapors (i.e.,
cuss (1) NPF, (2) particle growth, (3) volatility as indirect in-   aerosol precursors) for NPF and particle growth: H2 SO4 ,
formation of aerosol constituents, and (4) hygroscopicity and       CH3 SO3 H, HIO3 , NH3 , amines, and other organics with low
ability of cloud condensation nuclei (CCN) using a scanning         vapor pressure (Yu et al., 2012; Kulmala et al., 2013; Kyrö
mobility particle sizer (SMPS) in the Antarctic (Koponen et         et al., 2013; Weller et al., 2015; Sipilä et al., 2016; Jen et
al., 2003; Virkkula et al., 2007; Asmi et al., 2010; Hara et        al., 2016; Jokinen et al., 2018; Shen et al., 2019; Burrell
al., 2011b; Kyrö et al., 2013; Järvinen et al., 2013; Weller        et al., 2019). Gaseous H2 SO4 has been regarded as an im-
et al., 2015; Jokinen et al., 2018; Kim et al., 2019; Jang et       portant aerosol precursor (e.g., Kulmala et al., 2013; Kermi-
al., 2019; Lachlan-Cope et al., 2020) and a similar instru-         nen et al., 2018). Actually, H2 SO4 in the Antarctic is con-
ment (Ito, 1993). Seasonal features of aerosol number con-          verted dominantly via photochemical oxidation of dimethyl
centrations are associated with primary emissions of sea-salt       sulfide (DMS) released from biogenic activity in the ocean
aerosols, NPF, emissions of aerosol precursors from oceanic         and SO2 derived from DMS oxidation (e.g., Minikin et al.,
bioactivity, and photochemical processes (e.g., Koponen et          1998; Weller et al., 2015; Enami et al., 2016; Jang et al.,
al., 2003; Virkkula et al., 2007; Asmi et al., 2010; Hara et        2019). Indeed, high DMS concentrations in the Antarctic
al., 2011a, b, 2020; Kyrö et al., 2013; Järvinen et al., 2013;      were found in the sea-ice margin and marine boundary layer
Fiebig et al., 2014; Weller et al., 2015; Humphries et al.,         during summer (Koga et al., 2014). Concentrations of H2 SO4
2016; Jang et al., 2019; Frey et al., 2020). Aerosol volatility     and CH3 SO3 H showed diurnal change with a maximum in
measurements revealed high abundance of less volatile par-          daytime at Palmer Station (Jefferson et al., 1998a, b). Ad-
ticles because of dominance of sea-salt particles, even in ul-      ditionally, NPF often occurred in daytime at Neumayer and
trafine mode (smaller than 100 nm diameter) during winter–          Aboa during summer (Asmi et al., 2010; Weller et al., 2015;
early spring, whereas volatile particles such as H2 SO4 and         Jokinen et al., 2018). Measurements of aerosol hygroscopic-
organics were found to be dominant during spring–summer             ity at Aboa indicated an important role of organic vapors in
(Asmi et al., 2010; Hara et al., 2011b; Weller et al., 2011).       the growth of freshly nucleated particles (Asmi et al., 2010).
In polar regions during winter–early spring, sea-salt particles     Recently, simultaneous measurements of aerosol precursors
in ultrafine–coarse modes were released from snow and sea-          and aerosol size distributions showed that H2 SO4 and NH3
ice surfaces via wind blowing and sublimation (e.g., Hara et        made important contributions to NPF and growth at Aboa in
al., 2012, 2017, 2020; Frey et al., 2020). In addition to pri-      air masses from the marine boundary layer (Jokinen et al.,
mary emission of sea-salt aerosols in colder seasons, NPF           2018). Condensable vapors other than H2 SO4 and NH3 , for
was observed along the Antarctic coasts during summer at            example, iodine compounds such as HIO3 and organics, are
the boundary layer (Koponen et al., 2003; Virkkula et al.,          associated with atmospheric and snowpack chemistry (e.g.,
2007; Asmi et al., 2010; Kyrö et al., 2013; Weller et al.,          Saiz-Lopez et al., 2008; Atkinson et al., 2012; Roscoe et al.,
2015; Jokinen et al., 2018; Kim et al., 2019; Jang et al., 2019;    2015; Sipilä et al., 2016; Hara et al., 2020) and oceanic bioac-
Lachlan-Cope et al., 2020) and in the free troposphere (FT;         tivity (Dall’Osto et al., 2019). Contributions of the condens-
Hara et al., 2011a; Humphries et al., 2016; Lachlan-Cope et         able vapors to NPF and growth have been discussed, but this
al., 2020). Particularly, NPF events at Neumayer, Aboa, and         topic has remained unclear for the Antarctic.
King Sejong during summer were observed in air masses                  Some condensable vapors for NPF and growth are formed
transported from the marine boundary layer with lower or            through photochemical reactions with atmospheric oxidants
no sea-ice density (Weller et al., 2015; Jokinen et al., 2018;      such as OH, O3 , and BrO (Read et al., 2008). They relate to
Kim et al., 2019). In addition to NPF in the marine bound-          UV radiation (Matsumi et al., 2002; Matsumi and Kawasaki,
ary layer, NPF and high CN concentrations were identified in        2003). Appearance of the ozone hole in the Antarctic strato-
the FT and the air masses transported from FT (Hara et al.,         sphere during September–November (Hoppel et al., 2005) is
2011a; Humphries et al., 2016; Lachlan-Cope et al., 2020).          expected to enhance UV radiation and atmospheric oxidation
Moreover, NPF occurred around melt ponds on the Antarctic           potential in the troposphere (Jones et al., 2003). Neverthe-
continent during summer (Kyrö et al., 2013). Although most          less, effects on aerosols in the Antarctic troposphere have not
earlier works have specifically examined summer NPF in the          been elucidated sufficiently. Because of low aerosol number
Antarctic (Koponen et al., 2003; Virkkula et al., 2007; Asmi        concentrations, direct effects of aerosol radiative forcing are
et al., 2010; Kyrö et al., 2013; Weller et al., 2015; Jokinen       negligible in the Antarctic (Bodhaine, 1995). After aerosol
et al., 2018), some investigations (Hara et al., 2011a; Järvi-      activation to cloud condensation nuclei (CCN), indirect ef-
                                                                    fects might affect the atmospheric radiation budget and cli-

Atmos. Chem. Phys., 21, 12155–12172, 2021                                           https://doi.org/10.5194/acp-21-12155-2021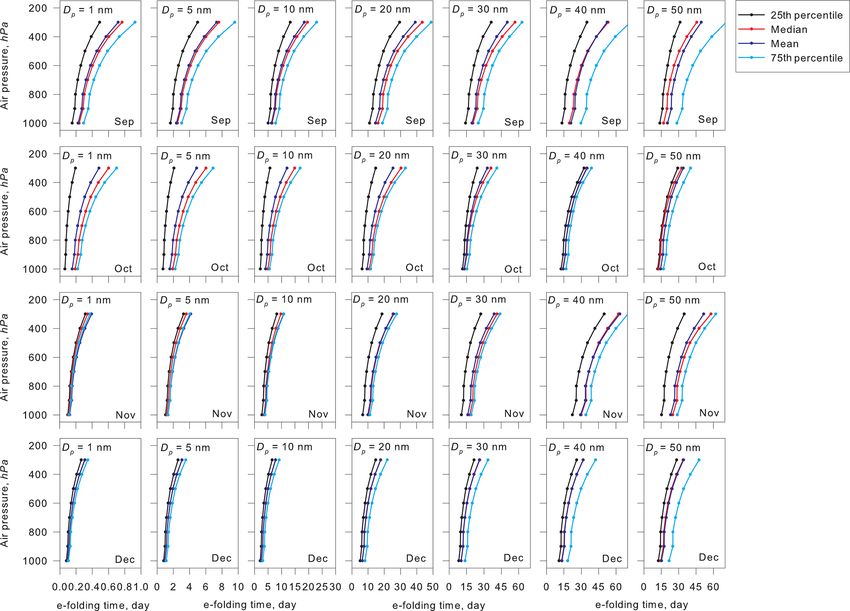
K. Hara et al.: Aerosol size distributions in the Antarctic                                                                  12157

mate (Bromwich et al., 2012). With the present study, we are       2.2     Data analysis
striving to understand the occurrence of NPF in the Antarc-
tic, linkage among NPF, the ozone hole, and cloud properties       2.2.1    Estimation of coagulation sink and condensation
in the Antarctic coast (around Syowa Station).                              sink

                                                                   Nano-size aerosol particles are removed rapidly through co-
2     Experiments and analysis                                     agulation. To elucidate the speed of removal by coagulation,
                                                                   coagulation sink (Coag.S) was calculated using the following
2.1    Aerosol measurements at Syowa Station,                      equation (Kulmala et al., 2001).
       Antarctica
                                                                                 X
Aerosol measurements were taken during the 45th–47th               Coag.S =       Kij Nj                                       (1)
                                                                                 j
Japanese Antarctic Research Expedition (2004–2006) at
Syowa Station, Antarctica (69.0◦ S, 39.0◦ E), located on East
                                                                   Therein, Kij and Nj , respectively, represent the coagulation
Ongul Island in Lützow Holm Bay. Size distributions of ul-
                                                                   coefficient in the transitional regime and the number concen-
trafine particles (diameter (Dp ): 5–168 nm) were measured
                                                                   trations of the size bin of j .
using SMPS (3936-N-25; TSI Inc.) during February 2004–
                                                                      Condensation sink (Cond.S) was calculated to elucidate
December 2006. A condensation particle counter (CPC) was
                                                                   the rate of condensable vapor removal by condensation on
used (3025 A; TSI Inc.) to take SMPS measurements. Each
                                                                   aerosol particles using the following equation (Kulmala et
scan for SMPS measurements took 5 min. CN concentrations
                                                                   al., 2001).
(Dp > 10 nm) were monitored using CPC 3010 (TSI Inc.)
and were recorded every minute. In addition, an optical parti-                        Z    ∞                     X
cle counter (OPC: KC22B; Rion Co. Ltd.) was used for mea-          Cond.S = 4π D               rβM (r)n(r)dr =    βM ri Ni     (2)
surements of size distributions of aerosols with sizes of Dp >                         0                          i
0.08, > 0.1, > 0.2, 0.3, and > 0.5 µm during January 2005–
December 2006. In OPC measurements, number concentra-              Therein, r and βM , respectively, denote the particle radius
tions were recorded every minute. SMPS, CPC, and OPC               and the transitional correction factor given by the following
were operated at room temperature of ca. 20 ◦ C in the clean       equation.
air observatory located at the windward side ca. 400 m distant
from the main area of the station, where a diesel generator                                     Kn + 1
                                                                   βM =                                                        (3)
was operated. When winds came from the main area, local                    0.377Kn + 1 + 34 α −1 Kn2 + 43 α −1 Kn
contamination might have occurred. Before analysis and dis-
cussion, locally contaminated data were screened using con-        In that equation, Kn and α, respectively, represent the Knud-
densation nuclei concentrations (measured as aerosol mon-          sen number and the sticking coefficient. The value of α is
itoring at Syowa Station) and wind data (provided by the           assumed to be unity. Also, Kn is expressed as
Japan Meteorological Agency). Data screening procedures
and criteria were identical to those described in earlier re-              λ
                                                                   Kn =      .                                                 (4)
ports (Hara et al., 2011b, 2019). After screening of locally               r
contaminated data, daily mean aerosol number concentra-
tions and size distributions were calculated for data analysis.    In Eq. (4), λ denotes the mean free path. Details of calcula-
Because of lower aerosol number concentrations during win-         tion procedures were presented in an earlier report (Kulmala
ter through early spring, data quality of hourly mean aerosol      et al., 2001).
size distributions was insufficient to identify NPF and to an-
alyze growth rate after NPF through the year. Consequently,        2.2.2    Estimation of the nucleation rate of aerosol
daily mean aerosol size distribution was analyzed and dis-                  particles
cussed in this study. Details of the respective NPF events
during the periods with higher aerosol concentrations will         The nucleation rate of aerosol particles (Dp = 5 nm: J5 ) was
be discussed elsewhere. Aerosol sampling for chemical anal-        estimated as elucidating NPF and particle growth in the
ysis was made using a two-stage mid-volume impactor and            Antarctic troposphere. Number concentrations (N) of nano-
a back-up filter. Water-soluble aerosol constituents such as       size aerosol particles in each size bin depend on (1) growth
Na+ , SO4 2− , and CH3 SO3 − were determined using ion chro-       from the smaller size by vapor condensation, (2) coagulation
matography. Details of aerosol sampling and chemical anal-         loss, and (3) growth to larger size by condensation. To cal-
ysis were presented in reports of our earlier work (Hara et al.,   culate J5 , three size bins based on particles were used: Dp
2004, 2018).                                                       1–5, 5–10, and 10–20 nm (Fig. 1). The change in the number
                                                                   concentrations for each size bin can be given by the follow-
                                                                   ing equation using Coag.S and the condensation growth rate

https://doi.org/10.5194/acp-21-12155-2021                                            Atmos. Chem. Phys., 21, 12155–12172, 2021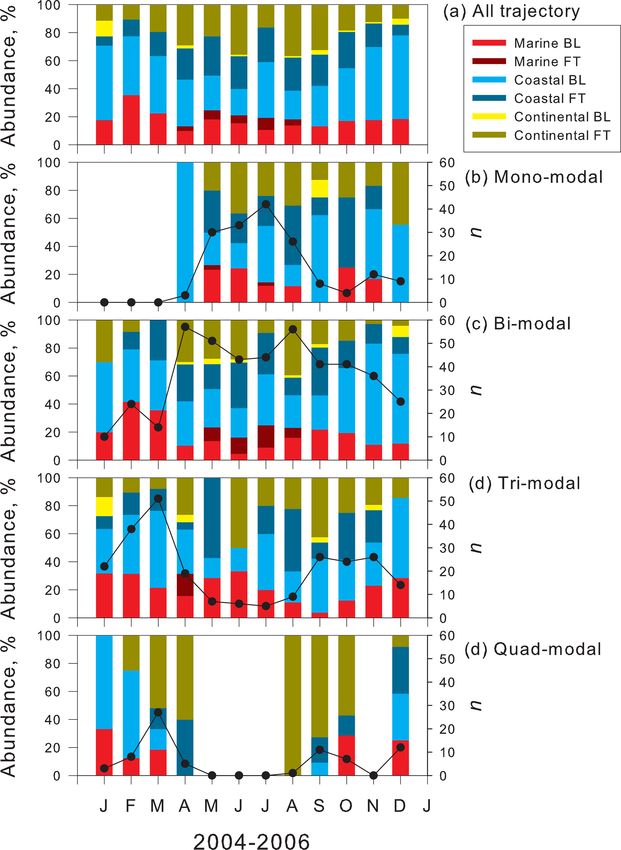
12158                                                                  K. Hara et al.: Aerosol size distributions in the Antarctic

                                                                       2.2.3    Lognormal fitting of aerosol size distributions

                                                                       Multi-modal fitting analysis of aerosol size distributions is
                                                                       used commonly to understand and discuss microphysical
                                                                       processes in the atmosphere. In this study, daily mean aerosol
                                                                       size distributions were approximated by a lognormal func-
                                                                       tion, which is given by the following equation.
                                                                                 n
                                                                          dN     X    Ni            (log Dp − log Dp,i )
                                                                               =   √          exp −                                 (9)
                                                                       d log Dp i=1 2π log σi             2log2 σi

                                                                       In Eq. (9), Dp , n, Dp,i , σi , and Ni , respectively, denote the
                                                                       particle diameter, mode number (n = 1–4), modal size in
                                                                       mode i (i.e., mean diameter of the mode in aerosol number
                                                                       size distributions), modal standard deviation in mode i, and
                                                                       aerosol number concentrations in mode i. Lognormal fitting
Figure 1. Schematic figure showing procedures used for the nucle-      was performed using the nls.lm function of the minpack.lm
ation rate of aerosol particles with a size of Dp = 5 nm (J5 ). Ni ,   library of R (R interface to the Levenberg–Marquardt nonlin-
Coag.Si , and Ji , respectively, indicate the number concentrations,   ear least-squares algorithm found in MINPACK). To avoid
coagulation sink, and growth (or formation) rate for each size bin.
                                                                       unrealistic lognormal fitting, we set the following restric-
                                                                       tions: (1) Ni > 1 % of total particle concentrations, (2) 1.2 ≤
(Cond) in accordance with Dal Maso et al. (2002).                      σi ≤ 2.2, and (3) 1.3Dp,i < Dp,i+1 . The daily mean aerosol
                                                                       size distributions (Dp = 5–168 nm: SMPS only) were ap-
dN1–5                                                                  proximated by lognormal functions in 2004. The size distri-
       = J1 − Coag.S1–5 N1–5 − Cond1–5 N1–5                     (5)    butions (Dp = 5–300 nm: SMPS + OPC) were analyzed us-
 dt
dN5–10                                                                 ing lognormal fitting in 2005–2006. For this study, we de-
        = J5 − Coag.S5–10 N5–10 − Cond5–10 N5–10                (6)    fined each mode based on the particle size range as follows:
  dt
dN10–20                                                                fresh-nucleation mode (Dp < 10 nm), aged-nucleation mode
        = J10 − Coag.S10–20 N10–20 − Cond10–20 N10–20           (7)    (Dp = 10–25 nm), first Aitken mode (Dp = 25–50 nm), sec-
  dt
                                                                       ond Aitken mode (Dp = 50–100 nm), and accumulation
In this procedure, the flux of condensation growth to the next         mode (Dp > 100 nm).
size bin (Condi Ni ) in the i bin corresponds to Ji+1 . From
Eqs. (5)–(7), J5 gives the following equations, assuming that          2.3     Backward trajectory analysis
Cond10–20 N10–20 was negligible to estimate J5 .
                                                                       The 120 h (5 d) backward trajectory was computed using the
     (Coag.S5–10 + Cond5–10 )                                          NOAA-HYSPLIT model (Stein et al., 2015; https://www.
J5 =
            Cond5–10                                                   ready.noaa.gov, last access: 6 August 2021) with the NCEP
                                                                       meteorological dataset (reanalysis) in model vertical velocity

         1N10–20
     ×           + Coag.S10–20 N10–20                           (8)    mode. The initial point was at 500 m above ground level over
          1t
                                                                       Syowa Station, Antarctica, because the trajectory at lower al-
In this study, growth rate after NPF was not estimated in re-          titudes has high uncertainty as a result of topographic effects
spective NPF events, as described above. Here, the growth              and turbulence. According to tethered balloon measurements
rate (0.01–1 nm h−1 ) and 1N10–20 = 0 were assumed to esti-            at Syowa Station (Hara et al., 2011a), the top of the bound-
mate J5 . Therefore, J5 is obtainable from Coag.S5–10 N5–10 ,          ary layer over Syowa was identified at 1400 m above ground
Cond5–10 , and Coag.S10–20 N10–20 . Details of procedures for          level and lower (annual mean, 840 m). For this study, we use
estimation of Cond5–10 were described by Dal Maso et                   the following criteria to divide each air mass origin: marine,
al. (2002). It is noteworthy that primary emissions of ultra-          < 66◦ S; coastal, 66–75◦ S; Antarctic-continental, > 75◦ S;
fine aerosol particles can engender false estimation of J5 .           boundary layer (BL), < 1500 m; and FT, > 1500 m. Then,
Sea-salt particles with less volatility were dominant even             the time passing in each area, such as marine BL (MBL),
among ultrafine aerosol particles with sizes of Dp > 10 nm             coastal BL, continental BL, continental FT, coastal FT, and
under storm conditions that prevailed during winter–spring             marine FT (MFT), was counted for each backward trajectory.
at Syowa Station (Hara et al., 2011b). Indeed, a high value            Areas with air masses staying for the longest times in the 5 d
of J5 was identified occasionally in the high contribution of          backward trajectory were classified into their respective air
sea-salt particles during winter.                                      mass origins.

Atmos. Chem. Phys., 21, 12155–12172, 2021                                               https://doi.org/10.5194/acp-21-12155-2021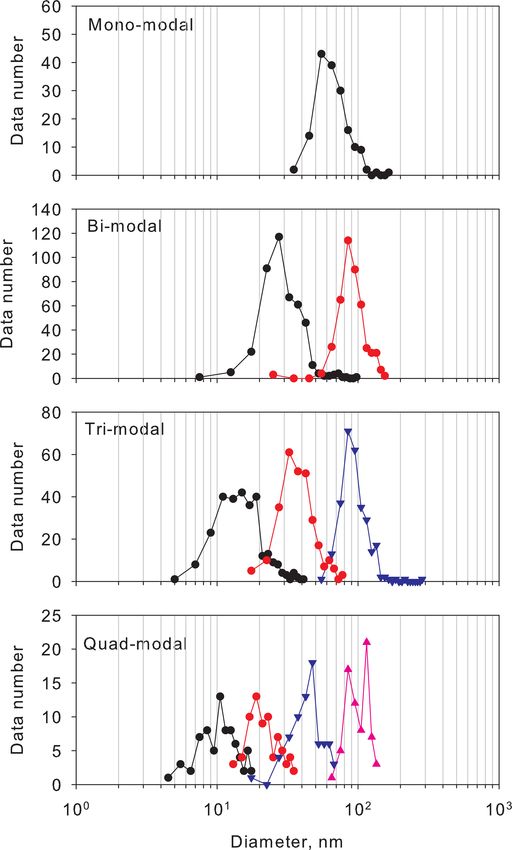
K. Hara et al.: Aerosol size distributions in the Antarctic 12159
3 Results and discussion
3.1 Aerosol size distributions
Figure 2 presents examples of number–size distributions of
aerosol particles observed at Syowa Station. Our measure-
ments show size distributions of ultrafine aerosol particles
with mono-, bi-, tri-, and quad-modal structures. In earlier
studies (Järvinen et al., 2013; Weller et al., 2015), multi-
modal aerosol size distributions with mono-modal, bi-modal,
and tri-modal structures were identified in the Antarctic. Al-
though quad-modal structures were observed clearly for this
study, they were not described in reports of earlier works.
To characterize the aerosol size distributions, we compare
the modal size in each mode (Fig. 3). In mono-modal struc-
tures, the modal size ranged mostly from 40 to 105 nm. In
the bi-modal structure, the modal sizes in the first and sec-
ond modes were in the ranges of 20–40 nm and 60–135 nm.
In the tri-modal structure, the modal sizes in the first to third
modes were, respectively, in the ranges of 8–20, 20–63, and
65–135 nm. In the quad-modal structure, the modal sizes in
the first to fourth modes were, respectively, in the ranges of
7–13, 14–30, 30–65, and 70–140 nm. The mono-modal struc-
ture was observed often under storm and strong wind condi-
tions with blowing snow during winter–early spring (Hara
et al., 2011b, 2020). In these conditions, sea-salt particles in
ultrafine to coarse modes were released from snow and sea-
ice surface in polar regions (Hara et al., 2011b, 2014; 2017,
2020; Frey et al., 2020). In the bi-modal structure, modal
sizes in the modes of the smallest modal size were greater
than those in tri-modal and quad-modal structures, so that the
bi-modal structure was well aged relative to tri-modal and
quad-modal structures. In tri-modal and quad-modal struc-
tures, modal sizes in the smallest mode appeared mostly for
diameters smaller than 20 nm. As demonstrated by Asmi et
al. (2010), Kyrö et al. (2013), Järvinen et al. (2013), Weller Figure 2. Examples of aerosol size distributions with (a) mono-
et al. (2015), Jokinen et al. (2018), and Kim et al. (2019), modal (3 May 2005), (b) bi-modal (4 March 2005), (c) tri-modal (14
aerosol particles were grown to a few tens of nanometers af- February 2005), and (d) quad-modal (8 September 2006) structures.
Circles, pink lines, and cyan lines in (a)–(d), respectively, show the
ter NPF, even in the Antarctic troposphere during summer.
observed data by SMPS, the number concentrations in each mode
Because the smallest mode appeared with a diameter smaller
approximated by lognormal fitting, and total concentrations of the
than 20 nm, occasionally smaller than 10 nm, in tri-modal respective modes.
and quad-modal structures, aerosol size distributions with tri-
modal and quad-modal structures might be associated with
NPF and growth by vapor condensation. In bi-, tri-, and quad-
modal structures, the modal sizes with the modes with the salt aerosols released from sea-ice areas were dominant dur-
largest modal sizes had a similar diameter larger than 50 nm, ing winter–early spring at the Antarctic coasts (e.g., Hara et
which corresponded to a critical diameter for CCN activation al., 2012, 2013, 2020; Frey et al., 2020). Although bi-modal
in the Antarctic (Asmi et al., 2010). structures were observed throughout the year, abundance of
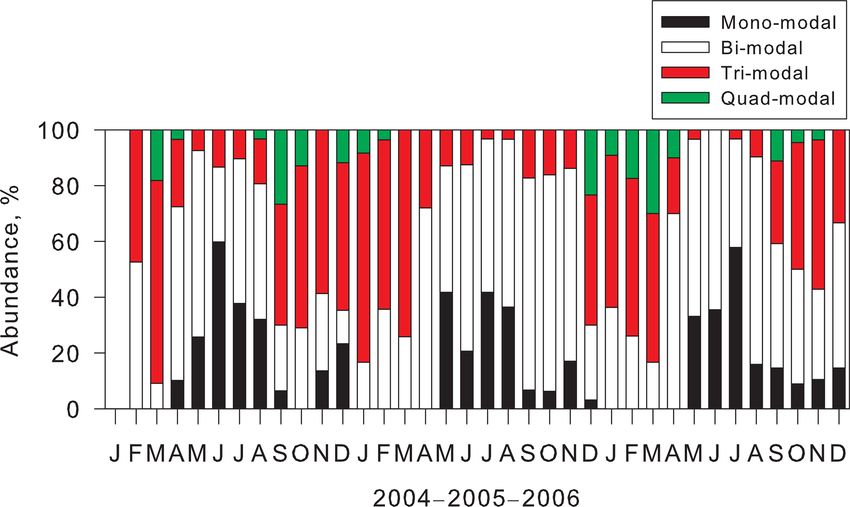
Figure 4 shows the seasonal variation of abundance of bi-modal structures occurred as 23 %–76 % (mean, 56 %) in
modal structures at Syowa Station during our measurements. April–September and 9 %–52 % (mean, 26 %) in December–
Mono-modal structure was identified mostly during May– March. Particularly, abundance of mono-modal and bi-modal
August. Abundance of mono-modal structures was found for structures was dominant (more than 90 %) during May–
16 %–60 % of days (mean, 37 %) during winter. As described August. High abundance of tri-modal structures (14 %–
above, mono-modal structures during winter–early spring 75 %, mean 45 %) was observed in September–April. Par-
were associated with sea-salt aerosol emissions. Indeed, sea- ticularly, abundance of tri-modal structures exceeded 50 %
https://doi.org/10.5194/acp-21-12155-2021 Atmos. Chem. Phys., 21, 12155–12172, 2021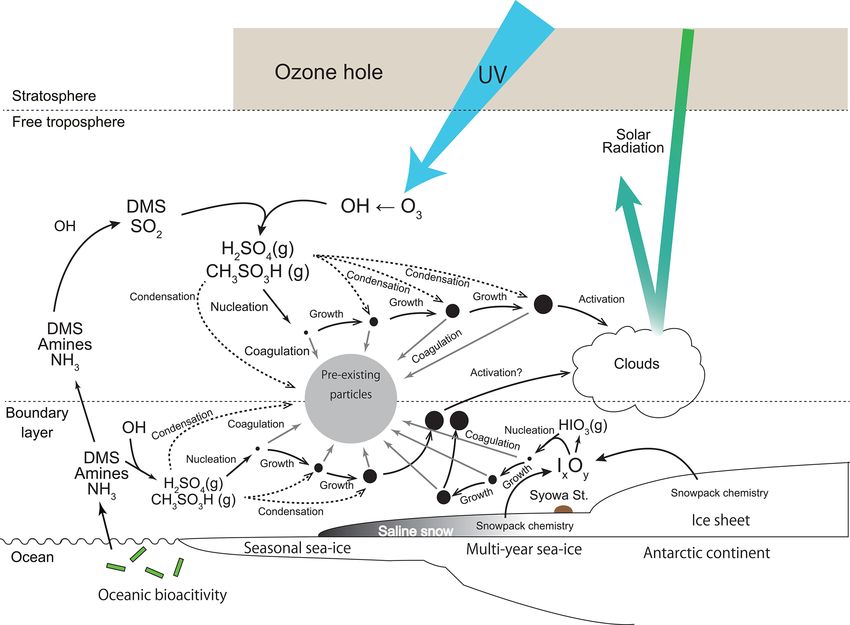
12160                                                                 K. Hara et al.: Aerosol size distributions in the Antarctic

                                                                      Figure 4. Seasonal features of abundance of modal structures ob-
                                                                      served at Syowa Station, Antarctica.

                                                                      3.2   Relation between modal structures and air mass
                                                                            history

                                                                      Annual cycles of air mass origins in each modal structure
                                                                      using 120 h backward trajectory analysis are shown in Fig. 5
                                                                      for comparison between the modal structure and air mass his-
                                                                      tory. Regarding general features of air mass origins in Febru-
                                                                      ary 2004–December 2006, coastal BL was dominant in sum-
                                                                      mer (Fig. 5a), whereas abundance of air masses from con-
                                                                      tinental FT increased during winter. Seasonal cycles of air
                                                                      mass origins in 2004–2006 showed good agreement with re-
                                                                      sults of long-term analysis of air mass origins at Syowa dur-
                                                                      ing 2005–2016 (Hara et al., 2019).
                                                                         Seasonal features of air mass origins in mono-modal struc-
                                                                      tures (Fig. 5b) resembled the general features (Fig. 5a), al-
                                                                      though the abundance of air masses from coastal FT was
                                                                      slightly higher in August and October. Considering that
Figure 3. Histogram of modal sizes in each modal structure. Sym-      mono-modal structures corresponded mostly to storm con-
bols and lines of black, red, blue, and magenta show histograms of
                                                                      ditions and strong winds during winter–spring (Hara et al.,
the first, second, third, and fourth modes in each modal structure.
                                                                      2010, 2011b, 2020), the appearance of mono-modal struc-
                                                                      tures was associated with primary emissions of sea-salt
in January–March. Surprisingly, tri-modal structures were             aerosols from the snow surface on sea ice by strong winds
identified even under dusk and polar night conditions during          rather than air mass history (i.e., transport pathway), as pre-
May–August. Modal sizes in the smallest mode of tri-modal             sented by Hara et al. (2012, 2013, 2020).
structure were greater in winter than in spring–summer (de-              Similarly, seasonal features of air mass origins in bi-modal
tails are presented in a later section). It is noteworthy that        structure (Fig. 5c) resembled the general features. In gen-
the quad-modal structure was found not only in December–              eral, bi-modal structures were recognized as well-aged dis-
February, but also in August–November and March–April.                tributions by condensation growth, coagulation, and cloud
Considering the modal size in the smallest mode of quad-              processes. Therefore, the appearance of bi-modal structures
modal distributions, NPF might proceed in August–April in             might be compared only slightly to air mass origins classified
the Antarctic. Indeed, CN concentrations started to increase          by 120 h backward trajectory analysis.
in August, with high concentrations in October–February at               Regarding tri-modal structures (Fig. 5d), the abundance of
coastal stations (e.g., Hara et al., 2011a, Weller et al., 2011;      air masses from continental FT and coastal FT increased in
Asmi et al., 2013).                                                   spring, compared to general features (Fig. 5a). Similarly to
                                                                      bi-modal structures, the appearance of some tri-modal struc-
                                                                      tures, particularly with larger modal sizes (e.g., Dp > 20 nm),
                                                                      in the smallest mode needed aging processes for a longer
                                                                      time. Consequently, seasonal variations of air mass origins

Atmos. Chem. Phys., 21, 12155–12172, 2021                                             https://doi.org/10.5194/acp-21-12155-2021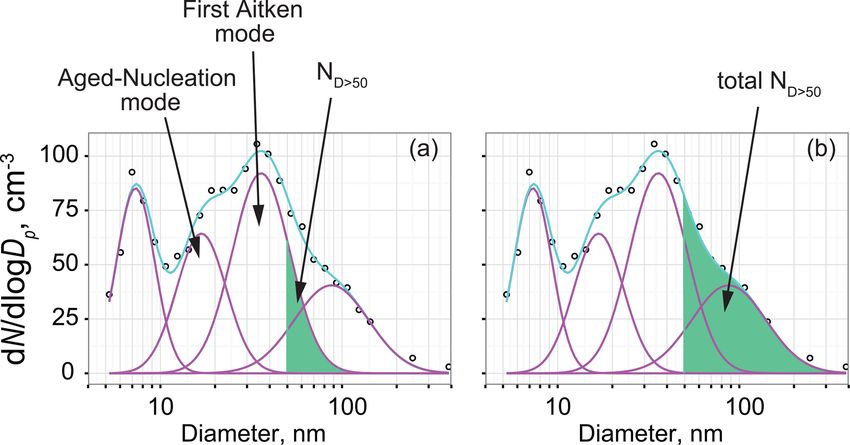
K. Hara et al.: Aerosol size distributions in the Antarctic                                                                         12161

                                                                        Figure 6. Seasonal features of abundance of tri-modal and quad-
                                                                        modal structures and air mass origins at Syowa Station, Antarctica,
                                                                        in 2004–2006.

                                                                        summer, as reported from results of earlier works (Weller et
                                                                        al., 2011; Asmi et al., 2013; Lachlan-Cope et al., 2020).
                                                                           Based on aspects of location where NPFs occur in the
                                                                        Antarctic troposphere, seasonal features of abundance of tri-
Figure 5. Seasonal feature of air mass origins of (a) all trajec-       modal and quad-modal structures and their air mass origins
tory, (b) mono-modal structure, (c) bi-modal structure, (d) tri-modal   are presented for comparison in Fig. 6. The abundance of tri-
structure, and (e) quad-modal structure at Syowa Station, Antarc-       modal and quad-modal structures reflects the frequency of
tica. Black line, black circles, and “n” represent the number of the    NPF in the Antarctic troposphere, although the appearance
appearance of each modal structure.
                                                                        of tri-modal and quad-modal structures does not necessarily
                                                                        mean fresh or local NPF events near Syowa in this study.
                                                                        The abundance of tri-modal and quad-modal structures was
                                                                        less than 10 % of days during May–August. In September–
in tri-modal structures were similar to general features, al-           January, the abundance of tri-modal and quad-modal struc-
though the sum of abundance of air masses from continental              tures was 40 %–48 % (mean, 44 %). By contrast, abundance
FT and coastal FT exceeded 50 %–60 % in August–October.                 reached 60 % and 84 % in February and March. Seasonal fea-
This abundance was slightly higher than that of general fea-            tures of NPF occurrence with highs in spring–summer and
tures.                                                                  minima in winter were observed at Concordia (Järvinen et
   Unlike the features in mono-modal, bi-modal, and tri-                al., 2013) and King Sejong (Kim et al., 2019). The monthly
modal structures, continental FT and coastal FT were the                occurrence (frequency) of the NPF, however, varied greatly
most abundant air mass origins in quad-modal structures dur-            at Syowa, Concordia and King Sejong. Differences in the
ing spring and fall (Fig. 5e). In general, features of air mass         abundance of NPF occurrence among Syowa, Concordia, and
origins (Fig. 5a), MBL, and coastal BL showed an impor-                 King Sejong might derive from different atmospheric condi-
tant contribution during spring and fall. Nevertheless, quad-           tions such as the concentrations of aerosols and precursors
modal structures in spring and fall were identified only in             and different criteria for identification of NPF-growth events.
the air masses from continental FT and coastal FT. This fea-               Abundance of tri-modal and quad-modal distributions
ture implies strongly that NPF proceeded in FT during spring            with air mass origins of coastal FT and continental FT
and fall in the Antarctic. In contrast to the high contribu-            (Fig. 6) ranged from 14 % to 27 % of days (mean, 22 %) dur-
tions of air masses from continental FT and coastal FT during           ing September–November, from 8 % to 16 % (mean, 11 %)
spring and fall, quad-modal structures were observed also in            during December–February, and from 11 % to 32 % (mean,
air masses from MBL and coastal BL during summer. There-                22 %) during March–April. Particularly, fresh NPF (quad-
fore, NPF might occur also in MBL and coastal BL during                 modal structures) was identified in FT (12 % of days) dur-

https://doi.org/10.5194/acp-21-12155-2021                                              Atmos. Chem. Phys., 21, 12155–12172, 2021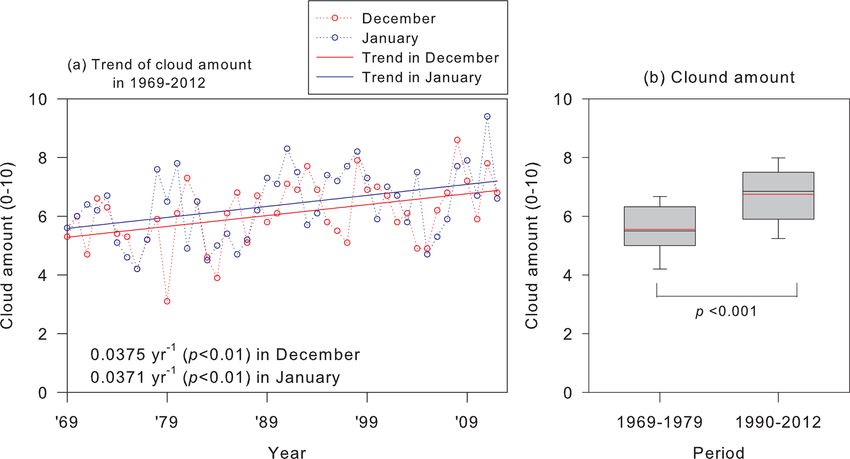
12162 K. Hara et al.: Aerosol size distributions in the Antarctic
ing September–October and March, in contrast to 1 % in in summer. During winter, CN concentrations increased oc-
BL. Abundance of quad-modal structures decreased to 3 % casionally under storm and strong wind conditions. Increase
in FT during December–February. Considering high abun- in CN concentration from the winter minimum started at the
dance of the quad-modal structures in the air masses from end of August–early September at Syowa. CN concentrations
FT in September–October (Fig. 5e), spring NPF might oc- and seasonal variations were similar to those measured at
cur dominantly in FT. However, abundance of tri-modal and other coastal stations (e.g., Weller et al., 2011; Fiebig et al.,
quad-modal structures with air masses of MBL and coastal 2014).
BL increased (27 %–52 %, mean 41 %) during December– Our measurements show size distributions of ultrafine
March. Abundance of quad-modal structures in BL increased aerosol particles with mono-, bi-, tri-, and quad-modal struc-
to 7 % in BL (3 % in FT) during December–February. In tures (Fig. 2). The presence of tri-modal and quad-modal
addition to NPF in FT, the high abundance in BL during structures during spring–fall suggests a frequent occur-
December–March implies that more NPF proceeded in the rence of NPF and growth in the atmosphere. Indeed, fresh-
BL during summer, as reported from earlier works (Koponen nucleation and aged-nucleation modes (Dp : < 10 nm and 10–
et al., 2003; Virkkula et al., 2007; Asmi et al., 2010; Kyrö et 25 nm) appeared often in spring–summer (Fig. 7c). Particu-
al., 2013; Weller et al., 2015; Jokinen et al., 2018; Kim et al., larly, the fresh-nucleation mode appeared most frequently at
2019; Jang et al., 2019; Lachlan-Cope et al., 2020). It is note- the end of August–early October and February–March. Fur-
worthy that the abundance of air masses from continental FT thermore, the modal sizes increased gradually from fresh-
and coastal FT during summer decreased remarkably, even nucleation mode to the first Aitken mode (Dp = 25–50 nm)
in general features (Fig. 5a). Furthermore, the quad-modal during September–December. Such a gradual size shift im-
structure was observed in air masses from continental FT and plies that aerosol particles derived from NPF grew by the
coastal FT in December (summer). CN enhancement by NPF condensation of condensable vapors such as H2 SO4 .
and growth was observed in the lower FT over Syowa Station Aerosol number concentrations of Dp = 5–10 nm (N5–10 )
during summer (Hara et al., 2011a). Therefore, the difference show three maxima in September–October, December, and
of contributable air mass origins in quad-modal structures February–March (Fig. 7d), when tri-modal and quad-modal
between spring–fall and summer might reflect not only the structures appeared frequently. These periods, respectively,
locations of NPF occurrence, but also seasonal features of correspond to the existence of the ozone hole (September–
general air mass origins (Fig. 5a). Consequently, NPF might October marked by grey-shaded bands), the maximum of
occur dominantly in FT and partly in BL during spring and solar radiation (summer solstice marked by blue-shaded
fall and in BL and FT during summer. bands), and the minimum of the sea-ice extent (February–
March marked by green-shaded bands). In general, N5–10
3.3 Seasonal variations of aerosol physicochemical was controlled by (1) NPF and growth from smaller size (ca.
properties 1 nm), (2) coagulation loss, and (3) particle growth to larger
sizes by vapor condensation. Additionally, J5 showed three
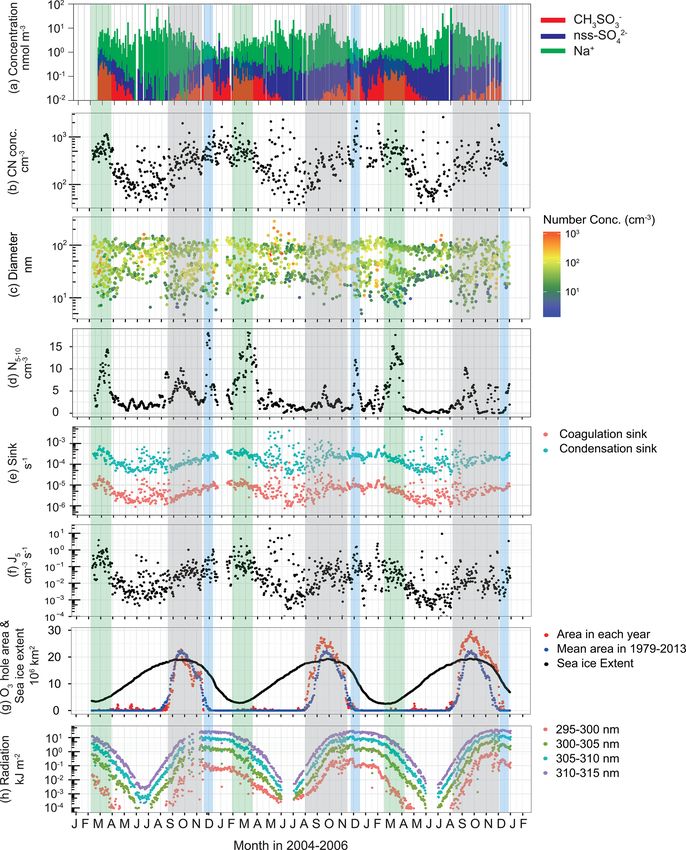
Figure 7 depicts seasonal variations of all of the follow- maxima similar to N5–10 variation (Fig. 7f). The estimated
ing: (a) concentrations of major aerosol constituents in Dp < J5 values from this study are comparable to the formation
200 nm; (b) CN concentrations; (c) modal sizes and number rates measured and estimated at Aboa (Kyrö et al., 2013),
concentrations of each mode; (d) aerosol number concen- Neumayer (Weller et al., 2015), and Concordia (Järvinen et
trations of fresh-nucleation mode (Dp = 5–10 nm); (e) co- al., 2013), although a high formation rate was obtained in
agulation sinks and condensation sinks; (f) nucleation rates the Antarctic Peninsula (Kim et al., 2019). During this study,
of aerosol particles with Dp = 5 nm (J5 ); (g) extent of the high values of J5 were observed often during May–August.
Antarctic ozone hole; and (h) UV radiation near the surface The high J5 values corresponded to high CN concentrations
at Syowa Station. Major water-soluble aerosol constituents and storm conditions during winter. Aerosol volatility mea-
of less than Dp = 200 nm are CH3 SO3 − and non-sea-salt surements showed clearly that less volatile particles (i.e., sea-
(nss) SO4 2− in summer and sea salt (e.g., Na+ ) in winter salt particles) were distributed in size ranges of Dp > 10 nm
(Fig. 7a). The CH3 SO3 − concentrations, which start increas- at Syowa during winter (Hara et al., 2011b). Indeed, sea-salt
ing at the end of August–September, show maximum con- aerosols in ultrafine mode can be formed through sublimation
centrations in February–March at Syowa Station. Seasonal of saline snow particles released from sea-ice areas (Yang et
variation of CH3 SO3 − concentrations implies that oceanic al., 2019). High values of J5 during winter might derive from
bioactivity and atmospheric photochemistry contribute to the dispersion of sea-salt aerosols from sea-ice areas by strong
maintenance of aerosol systems in September–early April winds (Hara et al., 2011b). Therefore, high J5 in the spring
because precursors of CH3 SO3 − (e.g., DMS) derive from and summer are expected to be related to NPF.
oceanic bioactivity (e.g., Minikin et al., 1998; Enami et al., The high values of J5 and N5–10 in December and
2016). February–March are explainable by photochemical reactions
Variations of CN concentrations (Fig. 7b) exhibited clear that form condensable vapors and by the source strength of
seasonal features with a minimum in winter and a maximum aerosol precursors released from oceanic bioactivity near the
Atmos. Chem. Phys., 21, 12155–12172, 2021 https://doi.org/10.5194/acp-21-12155-2021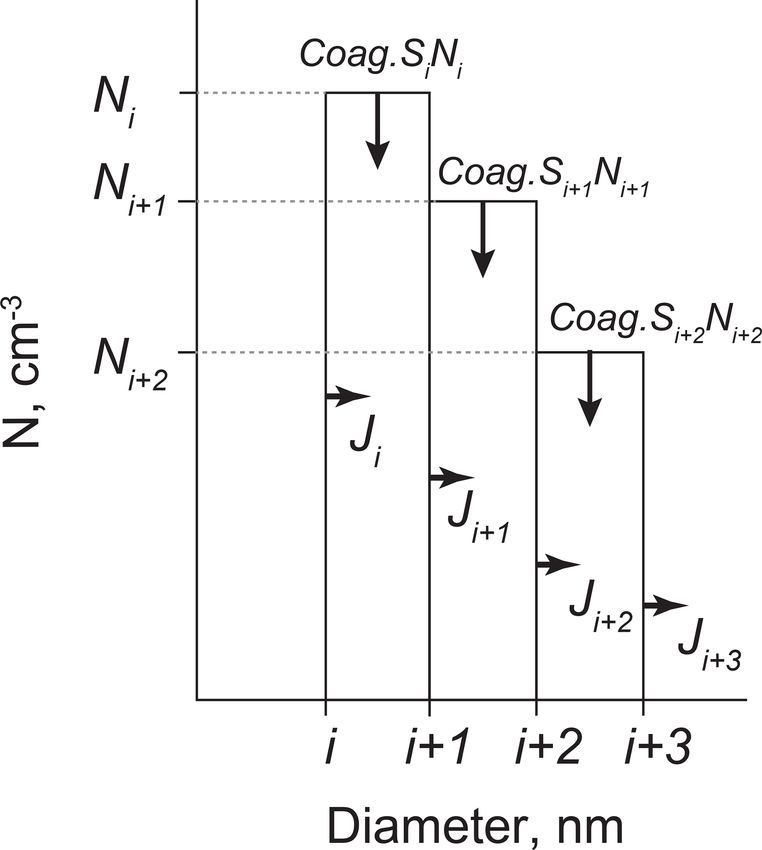
K. Hara et al.: Aerosol size distributions in the Antarctic                                                                        12163

Figure 7. Seasonal variations of (a) the concentrations of CH3 SO3 − , non-sea-salt (nss) SO4 2− and Na+ in Dp < 200 nm, (b) CN con-
centrations (Dp > 10 nm), (c) modal sizes and number concentrations in each mode, (d) 30 d running mean aerosol number concentrations
of fresh-nucleation mode (Dp = 5–10 nm), (e) coagulation sink of aerosol particles (Dp = 5 nm) and condensation sink, (f) nucleation rate
of aerosol particles with Dp = 5 nm (J5 ), (g) extent of the Antarctic ozone hole, and (h) UV radiation near the surface at Syowa Station,
Antarctica, during January 2004–December 2006. Green-shaded, grey-shaded and blue-shaded bands, respectively, represent periods of the
minimum of sea-ice extent and high CH3 SO3 − concentrations, ozone hole appearance and summer solstice. Concentrations of nss-SO2−     4
were calculated using Na+ concentrations and molar ratios in seawater (SO4 2− /Na+ = 0.0602; Millero et al., 2008) during November–
March and ratios in sea salts (SO4 2− /Na+ = 0.01; Hara et al., 2012, 2018) in April–October because the SO4 2− /Na+ ratio is changed
by sea-salt fractionation on sea ice during April–October (Hara et al., 2012, 2018). The ozone hole extent and sea-ice extent data were
provided, respectively, by NASA (https://ozonewatch.gsfc.nasa.gov/, last access: 6 August 2021) and the National Snow and Ice Data Cen-
ter (https://nsidc.org/data/seaice_index, last access: 6 August 2021). Daily mean UV data at Syowa Station were monitored by the Japan
Meteorological Agency (http://www.jma.go.jp/jma/index.html, last access: 6 August 2021) using a Brewer spectrophotometer.

https://doi.org/10.5194/acp-21-12155-2021                                             Atmos. Chem. Phys., 21, 12155–12172, 2021
12164                                                               K. Hara et al.: Aerosol size distributions in the Antarctic

sea-ice margin. Indeed, high concentrations of DMS released         (2014) showed that significant injection of sea-salt aerosols
from oceanic bioactivity were observed near sea-ice margins         originated from sea-ice areas into FT by cyclone activity. In
(Koga et al., 2014). By contrast, the sea-ice extent showed a       addition, sea-salt aerosols originated from sea-ice area were
maximum value in spring (September–November, Fig. 7g).              distributed widely in ultrafine–coarse particles at Syowa dur-
Consequently, other factors affecting the likelihood of high        ing winter–spring (Hara et al., 2011b, 2013, 2020). Consid-
J5 and N5–10 in spring should be considered. To elucidate           ering that sea salts in snow and frost flowers on seasonal sea
the presence of fresh-nucleation mode in spring, the location       ice had iodine enrichment by sea-salt fractionation (Hara et
at which NPF occurred in the Antarctic region must be dis-          al., 2017), the rapid vertical mixing of sea-salt particles as
cussed. Air masses with quad-modal structures with fresh-           shown by Hara et al. (2014) plays an important role in sup-
nucleation mode originated mostly from the upper FT over            plying iodine (mostly iodide) in aerosols to FT. Heteroge-
the Antarctic continent (Fig. S1 in the Supplement). Coag.S         neous reactions on sea-salt particles containing iodine during
of Dp = 5 nm aerosol particles increased gradually from             transport can engender Ix Oy release and formation of the io-
2 × 10⁻⁶ to 10−5 s−1 during September–December (Fig. 7e).           dine condensable vapors such as HIO3 . High concentrations
From Coag.S, we estimated the e-folding time of the parti-          of sea-salt particles, however, might prevent NPF by the io-
cles (Dp = 5 nm) by coagulation loss as 3.9–5.8 d in early          dine condensable vapors in FT because of efficient conden-
September and 1.2–1.4 d in December (Fig. S2 in the Sup-            sation losses of vapors onto sea-salt aerosols.
plement). This finding implies that the particles in the fresh-        DMS measurements taken at Concordia suggest that DMS
nucleation mode observed at Syowa had too short a lifetime          was transported from coastal areas (or oceans) to the in-
to be supplied by long-range transport from the mid latitudes       land station via FT (Preunkert et al., 2008). Therefore, pho-
via the FT. Therefore, NPF can be expected to start in the          tochemical reactions with DMS, H2 SO4 , and CH3 SO3 H
Antarctic FT already by the end of August.                          might occur in the FT over the Antarctic continent. Suf-
   Generally speaking, NPF is more likely to occur under            ficient photochemical oxidants such as OH and UV radi-
conditions with (1) lower number concentrations of preex-           ation are necessary for the conversion of condensable va-
isting particles, (2) higher concentrations of condensable va-      pors such as DMS and SO2 . Appearance of the O3 hole in
pors, and (3) presence of sufficient photochemical oxidants         the Antarctic stratosphere can engender UV enhancement
such as OH. Because of low aerosol number concentrations            with wavelengths shorter than 310 nm, even in the Antarctic
in the Antarctic FT (Hara et al., 2011a), NPF can proceed           troposphere during September–November. Therefore, atmo-
preferentially in the FT if condensable vapor is present. Ear-      spheric OH in the Antarctic troposphere is producible by UV
lier studies presented that the following condensable vapors        radiation (λ ≤ 310 nm) (Matsumi et al., 2002; Matsumi and
participate in tropospheric NPF: H2 SO4 , CH3 SO3 H, NH3 ,          Kawasaki, 2003).
iodine species such as HIO3 , and amines (Yu et al., 2012;             Polar sunrise in the upper FT occurs earlier than it does
Kulmala et al., 2013; Kyrö et al., 2013; Weller et al., 2015;       near the surface. Additionally, the existence of the ozone
Sipilä et al., 2016; Jen et al., 2016; Jokinen et al., 2018; Shen   hole enhances UV radiation, even in the troposphere, during
et al., 2019; Burrell et al., 2019). Actually, these vapors were    September–November (Fig. 7g–h). More noteworthy is the
identified along the Antarctic coasts and the Southern Ocean        higher UV of wavelengths shorter than 305 nm in October–
(Jefferson et al., 1998a, b; Sipilä et al., 2016; Jokinen et al.,   November than in December near the surface at Syowa. For
2018; Dall’Osto et al., 2019). High contributions of photo-         example, the monthly mean amounts of UV radiation of
chemical processes in the atmosphere were required for an           300–305 nm at Syowa were, respectively, 0.080, 0.098, and
important relation among J5 , aerosol size distributions, and       0.068 kJ m−2 in October, November, and December, respec-
CN concentrations. In addition, condensable vapors can be           tively. In general, light intensity including UV radiation is
removed by condensation onto pre-existing particles. There-         greater at higher altitudes because of atmospheric scattering
fore, the condensable vapors must be formed in FT if NPF            and absorption. Considering the greater amount of UV radi-
occurs in FT. Particularly, H2 SO4 , CH3 SO3 H, and iodine          ation in the upper troposphere during September–November,
species such as HIO3 are converted from precursors via pho-         the existence of the ozone hole might enhance the forma-
tochemical reactions (e.g., Enami et al., 2016; Saiz-Lopez et       tion of photochemical oxidants (e.g., OH) and condensable
al., 2008, 2011, 2014, 2016). Direct measurements of these          vapors, which then engender NPF in the upper troposphere
vapors and their precursors in the Antarctic FT have never          (Fig. 7c–d).
been reported.
   Atmospheric iodine cycles are related closely to snow-           3.4   Vertical variations of aerosol e-folding time by
pack chemistry in the Antarctic (e.g., Atkinson et al., 2012;             coagulation loss
Roscoe et al., 2015; Saiz-Lopez et al., 2015; Hara et al.,
2020). Because of fast reactions of reactive iodine species         After NPF, aerosol particles in fresh-nucleation mode are
(Ix Oy ; Saiz-Lopez et al., 2008; Atkinson et al., 2012; Roscoe     grown mainly by condensation of condensable vapors. They
et al., 2015), atmospheric chemical processes of Ix Oy pro-         are coagulated efficiently onto pre-existing particles. For a
ceed dominantly near the surface (below 100 m). Hara et al.         better understanding of the aerosol life cycle including mi-

Atmos. Chem. Phys., 21, 12155–12172, 2021                                           https://doi.org/10.5194/acp-21-12155-2021
K. Hara et al.: Aerosol size distributions in the Antarctic                                                                  12165

crophysical processes in the Antarctic troposphere, aerosol         high growth rate (i.e., high concentrations of condensable va-
lifetime must be discussed before discussion of the relation        pors) was necessary for particle growth for shorter periods
between NPF and CCN ability. Williams et al. (2002) re-             (within the e-folding time) in BL. For example, under con-
ported that aerosol particles of Dp < 60 nm were removed            ditions with growth rates of 0.05, 0.1, 0.2, and 0.5 nm h−1 , it
dominantly by coagulation in FT. Therefore, vertical varia-         takes approximately 3.3, 1.7, 0.8, and 0.33 d, respectively, for
tions of e-folding time were estimated as aerosol lifetime in       initial growth from Dp = 1 to 5 nm. Under the slow growth
the Antarctic FT from Coag.S in each size (Figs. 7e and S2).        conditions, the time for initial growth exceeded the e-folding
Aerosol size distributions in Dp < 100 nm remain unknown            time of Dp = 1 and 5 nm in BL. In FT, however, aerosol par-
in the Antarctic FT through the year. Here, the e-folding time      ticles can continue to exist for a longer time under condi-
in FT was estimated, assuming that aerosol mixing ratio of          tions with slower particle growth (lower concentrations of
aerosol number in respective size bins in FT was equal to           condensable vapors) than those in BL. Consequently, aerosol
that measured at the surface. Aerosol size distributions in the     particles can be grown gradually through condensation of
air masses from coastal FT and continental FT and monthly           condensable vapors in the Antarctic troposphere once new
mean vertical profiles of air temperature measured by the           particles grow to the aged-nucleated particles (Dp > 10 nm).
Japan Meteorological Agency (URL: http://www.jma.go.jp/             Finally, UV enhancement in the upper troposphere by the
jma/indexe.html, last access: 6 August 2021) were used for          ozone hole during the end of August through November
this estimation.                                                    might modify the aerosol population and size distributions
   Figure 8 depicts vertical variations of the e-folding time of    in the Antarctic troposphere during spring–summer. There-
aerosol particles with sizes of Dp = 1–50 nm in September–          fore, aerosol properties in the Antarctic troposphere dur-
December. In general, smaller aerosol particles have a greater      ing spring–summer are not “pristine” under Anthropocene
diffusion coefficient, so that the e-folding time was shorter,      conditions, although the Antarctic troposphere remains the
particularly at Dp < 10 nm. In other words, aerosol particles       cleanest on Earth.
larger than Dp = 20 nm had a longer e-folding time. Because
of lower air temperature at higher altitudes, the estimated e-      3.5   CCN potential and cloud amounts during summer
folding time tended to increase at higher altitudes for all sizes
and months. The e-folding time at the upper troposphere             Gradual change in modal sizes in fresh-nucleation mode
(ca. 8.3 km, 300 hPa) was 3–4 times longer than that at the         and first Aitken mode were observed during spring–summer
surface. When aerosol particles were grown to sizes larger          (Fig. 7c). When aerosol particles derived from NPF during
than Dp = 20–30 nm, the e-folding time reached > 30 d in            periods with the existence of an O3 hole grow to a critical
the middle and upper FT. In estimation of aerosol lifetime          diameter, the aerosol particles can act as CCN. Here, aerosol
by Williams et al. (2002), the aerosol lifetime was approx-         particles grown after NPF during periods with O3 holes were
imately 35 d in the upper FT and approximately 15 d in the          specifically examined to elucidate their relation to CCN abil-
middle FT in the INDONEX campaign. It must be noticed               ity and CCN properties during summer. As shown in Fig. 7c,
that these lifetimes were calculated by Williams et al. (2002)      modal sizes increased gradually in aged-nucleation mode and
from aerosol concentrations higher than those at the surface        first Aitken mode from the end of August through Decem-
of Syowa and that the e-folding time in Fig. 8 was estimated        ber. This gradual feature of the modal sizes was likely to be
based on a constant mixing ratio and based on aerosol size          associated with particle growth after NPF. Measurements of
distributions measured at the surface. Tethered balloon mea-        aerosol hygroscopicity at Aboa showed the critical diame-
surements at Syowa Station (Hara et al., 2011) presented a          ter to be approximately ca. 50 nm during summer (Asmi et
vertical gradient of CN concentrations that was lower in FT         al., 2010). Considering gradual particle growth in the aged-
(up to ca. 2500 m) except for an aerosol-enhanced layer in          nucleation and first Aitken modes (Fig. 7c), NPF during the
the lower FT. Additionally, aerosol number concentrations of        periods with O3 hole and growth are expected to be linked to
particles with Dp > 300 nm in the upper FT over Syowa were          cloud properties during summer. Therefore, we attempt to es-
1–2 orders lower than those at the surface (Kizu et al., 2010).     timate the contributions of aerosols derived from NPF during
With a vertical gradient of the number concentrations of pre-       periods with the O3 hole to act as CCN in November–January
existing particles, the e-folding time of 1–2 months might          based on the following assumptions: aerosol particles sup-
be available and realistic for aerosol particles with sizes of      plied from spring NPF were grown to aged-nucleation and
Dp > 20–30 nm in the Antarctic FT.                                  first Aitken modes. For this estimation, the contribution to
   In contrast to the longer e-folding time in FT, the e-folding    CCN (RCCN ) was defined as the ratio of the aerosol number
time was shorter in BL (below 850 hPa) because of efficient         concentrations of Dp > 50 nm in aged-nucleation and first
coagulation loss. Particularly, the e-folding time at the sur-      Aitken modes (ND>50 ) to the total aerosol number concen-
face was shorter in air masses originating from MBL and             trations in Dp > 50 nm (total ND>50 , Fig. 9). The value of
coastal BL than that in FT (not shown) because of high con-         RCCN was estimated using the following equation.
centrations by primary emission of sea-salt aerosols in strong                      ND>50
winds and NPF in MBL and coastal BL. In other words, a              RCCN (%) =               × 100                             (10)
                                                                                 total ND>50

https://doi.org/10.5194/acp-21-12155-2021                                         Atmos. Chem. Phys., 21, 12155–12172, 2021
12166 K. Hara et al.: Aerosol size distributions in the Antarctic Figure 8. Vertical variations of aerosol e-folding time of coagulation loss in respective sizes in the troposphere over Syowa Station, Antarc- tica, during September–December. Figure 10 depicts RCCN in the continental FT and coastal BL Trends of cloud amounts at Syowa Station were examined in November–January. Results obtained using an ANOVA to assess the effects of spring NPF enhanced by the existence test indicated a significant difference (p = 0.0125) between of the O3 hole on CCN ability and cloud properties during the values of RCCN obtained in the continental FT and coastal summer. Figure 11 depicts variations of cloud amounts in BL. Differences in aerosol size distributions are regarded December and January that have been recorded since 1969. as indicating RCCN in the continental FT and coastal BL. No increasing trend was found for air temperature or wa- As shown in Fig. S3 in the Supplement, the modal size in ter vapor concentrations related to the cloud amount, but a the smallest mode was smaller in BL than those in FT in marked increasing trend with p values lower than 0.01 was December–January, although the modal size was not sig- found. Nevertheless, it was found only for December and nificantly different in November. Aerosol particles of Dp < January during 1969–2012. Particularly, cloud amounts at 30 nm were supplied by NPF and growth, as described above. Syowa Station were significantly greater during the existence Therefore, NPF in the BL in December–January might en- of an O3 hole (Figs. 11b and S4 in the Supplement). Conse- gender a difference in modal sizes in the smallest mode. The quently, the cloud amount trend during summer might result modal size in the smallest mode in BL was smaller than the from spring NPF enhanced by O3 hole existence. Because critical diameter. Therefore, aerosol particles supplied from of the conformable relation between the cloud amount and summer NPF in the BL were not grown sufficiently to the radiative fluxes (Yamanouchi et al., 2007), UV enhancement critical diameter by condensation. We infer that aerosol en- by the O3 hole can affect atmospheric radiation budgets by hancement by NPF during periods with the existence of an aerosol and cloud properties in the Antarctic during summer. O3 hole might modify not only aerosol size distributions, but Our hypothesis can be summarized as shown in the also CCN ability and cloud properties in summer. schematic figure (Fig. 12). In polar sunrise, solar radiation re- Atmos. Chem. Phys., 21, 12155–12172, 2021 https://doi.org/10.5194/acp-21-12155-2021
K. Hara et al.: Aerosol size distributions in the Antarctic                                                                      12167

Figure 9. Schematic figure showing procedures used for RCCN estimation. Circles, pink lines, and cyan lines, respectively, show the data
observed using SMPS, the number concentrations in each mode approximated by lognormal fitting, and total concentrations of each mode.
Number concentrations of aerosols with a size of Dp > 50 nm in aged-nucleation mode and first Aitken mode (ND>50 ) are given as shown
for (a). Similarly, the total number concentrations of aerosols with a size of Dp > 50 nm (total-ND>50 ) are given as shown for (b).

                                                                       August in the upper troposphere. As a consequence, NPF
                                                                       is enhanced in FT under UV enhancement by the O3 hole
                                                                       during spring (end of August–November). Aerosol particles
                                                                       in fresh-nucleation mode grow gradually by the condensa-
                                                                       tion of condensable vapors in the FT. Some aerosol particles
                                                                       in fresh- and aged-nucleation modes are transported to the
                                                                       lower troposphere on the Antarctic coasts. With condensa-
                                                                       tion growth, some aerosol particles originating from spring
                                                                       NPF in the FT can be grown to sizes greater than the crit-
                                                                       ical diameter (ca. 50 nm) in the summer. Results show that
                                                                       NPF proceeds even in coastal BL and MBL from the end of
                                                                       spring–summer. In contrast to FT, H2 SO4 , CH3 SO3 H, and
Figure 10. Comparison of RCCN in the continental free tropo-           other condensable vapors such as HIO3 , NH3 , and amines
sphere (FT) and those in the coastal boundary layer (BL) during        can engender NPF and growth in BL. Aerosol particles orig-
November–January in 2004–2006. p denotes the p value of the            inating from NPF in BL are removed efficiently by coagula-
ANOVA variance test. Degrees of freedom for the ANOVA variance         tion under conditions with higher aerosol concentrations of
test were 155. Box plots show values of 90 %, 75 %, 50 % (median),     pre-existing particles than those of FT, except under high
25 %, and 10 %, denoted, respectively, by the top bar, top box line,   growth rate conditions. Consequently, lesser aerosol parti-
black middle box line, bottom box line, and bottom bar. Red lines      cles derived from summer NPF in the boundary layer grow
show mean values.
                                                                       up to the critical diameter than from spring NPF in the FT.
                                                                       Our results demonstrate that spring NPF plays an important
                                                                       role in aerosol populations and cloud properties in the sum-
covers earlier in the stratosphere and the upper troposphere.          mer under conditions that include the existence of an Antarc-
Then, ozone depletion by catalytic reactions of chlorine cy-           tic ozone hole. Knowledge of the following issues will be
cle starts in the Antarctic stratosphere. The ozone hole ap-           necessary for future investigations to test our hypothesis: (1)
pears in the Antarctic stratosphere from the end of August             aerosol size distributions of particles smaller than 100 nm in
until the end of November. Appearance of the ozone hole                the FT, (2) chemical forms of condensable vapors and their
engenders UV enhancement and then production of atmo-                  concentrations in the FT and BL, and (3) their vertical and
spheric oxidants such as OH in the troposphere. Atmospheric            seasonal variations in the Antarctic.
oxidants such as OH are likely to be formed in the up-
per troposphere by UV enhancement. Condensable vapors
(i.e., aerosol precursors with lower vapor pressure) are pro-          4   Conclusions
ducible by photochemical oxidation. H2 SO4 and CH3 SO3 H
are important condensable vapors for NPF and growth in the             Aerosol measurements were taken using SMPS and OPC at
Antarctic FT. In addition, NPF occurs already by the end of            Syowa Station, Antarctica, in 2004–2006. Aerosol size distri-

https://doi.org/10.5194/acp-21-12155-2021                                            Atmos. Chem. Phys., 21, 12155–12172, 2021
You can also read