High turbidity levels alter coral reef fish movement in a foraging task
←
→
Page content transcription
If your browser does not render page correctly, please read the page content below
www.nature.com/scientificreports
OPEN High turbidity levels alter coral reef
fish movement in a foraging task
Cait Newport*, Oliver Padget & Theresa Burt de Perera
Sensory systems allow animals to detect and respond to stimuli in their environment and underlie
all behaviour. However, human induced pollution is increasingly interfering with the functioning of
these systems. Increased suspended sediment, or turbidity, in aquatic habitats reduces the reactive
distance to visual signals and may therefore alter movement behaviour. Using a foraging task in which
fish (Rhinecanthus aculeatus) had to find six food sites in an aquarium, we tested the impact of high
turbidity (40–68 NTU; 154 mg/L) on foraging efficiency using a detailed and novel analysis of individual
movements. High turbidity led to a significant decrease in task efficacy as fish took longer to begin
searching and find food, and they travelled further whilst searching. Trajectory analyses revealed that
routes were less efficient and that fish in high turbidity conditions were more likely to cover the same
ground and search at a slower speed. These results were observed despite the experimental protocol
allowing for the use of alternate sensory systems (e.g. olfaction, lateral line). Given that movement
underlies fundamental behaviours including foraging, mating, and predator avoidance, a reduction in
movement efficiency is likely to have a significant impact on the health and population dynamics of
visually-guided fish species.
Animals process physical and chemical stimuli using a range of sensory systems, which are finely tuned to the
signals that they have evolved to detect. Increasingly, anthropogenic activities are causing ‘sensory pollution’
which can mask or alter stimuli, and lead to changes in the detection and interpretation of sensory information,
damage to the sensory systems themselves, or attentional d eficits1–10. The use of other sensory modalities may
help animals compensate, however in some cases, sensory pollution impacts multiple sensory systems4 or the
sensory information gained by an alternate system is not equal to that of the primary system. The impacts of
sensory pollution on fish is a relatively new field but there is already evidence that a uditory1–3,11,12, olfactory5–8,
and chemical9,13,14 impairment can have an impact on animal behaviours such as c ommunication10,15, predator
avoidance2, stress levels16, and orientation17. Here, we aim to describe the effects of visual sensory pollution (via
increased turbidity) on the movement of fish during foraging. As successful foraging underpins survival and
success, it is crucial to understand factors which may reduce its efficacy.
Particulate matter in water causes visual pollution by increasing the scattering of light and reducing visibility.
The altered optical properties of water can affect the distance from which visual information can be detected
and also the spectral quality. Many aquatic ecosystems naturally face a high degree of variability to their visual
environment which can occur over short, medium, and long-time scales. For example, tidal changes can increase
turbidity over the course of hours, seasonal variations can occur over several months, and stochastic events such
as storms and cyclones can be infrequent but develop and dissipate relatively rapidly. Increasingly, systematic rises
in turbidity are being caused by anthropogenic p erturbation18 in habitats where fish may not be accustomed to
such a high degree of variation and therefore likely to be negatively impacted19. This may be particularly problem-
atic in shallow coastal habitats, including coral reefs20, where vision is a significant and important sensory system
that guides a wide range of b ehaviours21–23. It is estimated that > 60% of the world’s reefs are currently directly
threatened by local sources including coastal development, watershed-based pollution and structural damage18.
The potential impacts of increased sediment suspension to photosynthetic species have been considered e.g.24–27
but there is increasing evidence that fish are also negatively impacted.
Increasing turbidity has been shown to affect the development of visual systems and the behavioural ecol-
ogy of fish from a wide range of habitats. Freshwater cichlids (Aequidens pulcher) exposed to variation in light
during development possess altered photoreceptor composition28 and spectral sensitivity, resulting in changes
ehaviour29,30. Guppies (Poecilia reticulata) have been found to be less active and more often solitary in
to visual b
high turbidity, potentially making them more vulnerable to predation31,32. For species of planktivorous reef fish,
turbidity can cause increased attack rates but decreased attack success33. Other behavioural effects of turbidity
include changes to anti-predator behaviour34–38 and predation rates39–41, reaction distance to visual stimuli38,42–44,
Department of Zoology, University of Oxford, Zoology Research and Administration Building, Mansfield Road,
Oxford OX1 3SZ, UK. *email: caitlin.newport@zoo.ox.ac.uk
Scientific Reports | (2021) 11:5976 | https://doi.org/10.1038/s41598-021-84814-5 1
Vol.:(0123456789)
www.nature.com/scientificreports/
response to sensory information e.g.45, foraging s uccess33,38,46–50, and juvenile settlement and development6,50.
However, some species can adapt or acclimate to changing visual conditions. For example, guppies raised in
turbid water displayed a shift in spectral sensitivity and an increase in activity51, and several other fish species
shift prey target s pecies52–54.
Effective and efficient movement underpins a wide range of essential fish behaviours including foraging,
navigation, mating, shelter use and territoriality, and predator avoidance. Visually guided movement, and more
broadly navigation, is likely to be particularly sensitive to changes in visibility caused by turbidity as it will
decrease the distance at which orientation cues can be detected. There is increasing research interest in the
mechanisms of fish navigation and its sensory basis across unfamiliar or large spatial-scales (e.g. polarised light,
sound, smell, magnetic compass). However, there has been comparatively little research on fish movement within
small spatial scales. Thus far, at least eight species of f reshwater55,56 and m
arine57–61 fish are known to use visual
cues for spatial orientation, but the crucial question of how this behaviour is affected by changes in visibility
conditions remains unanswered. In this study we have conducted for the first time, a detailed analysis of the
movement of fish in changing turbidity conditions during a foraging task, as well as developed a novel method
to measure and characterise differences in trajectories.
Picasso triggerfish (Rhinecanthus aculeatus) typically forage within a territory and frequently return to a
small coral shelter. Time spent foraging and eventual success rate is likely reliant on their readiness to leave their
shelter as well as their ability to detect food to return to their shelter. Using a task in which fish have to leave a
shelter and search for food pots located at fixed positions in an open area, we tested how turbidity altered the
time taken to leave the refuge, as well as the movement efficiency during foraging. Fish were tested in high (40–68
Nephelometric Turbidity Units (NTU)/ 154 mg/L) and low (0.4–1.4 NTU/ 0 mg/L) turbidity conditions. Typical
turbidity levels can vary by site but low levels range from about 0.5–5 NTU, while higher levels are 10–100 times
that e.g.62,63. While a meta-analysis found that many visual behaviours can be altered by even low turbidity levels
(3–5 NTU)64, particularly in coral reef species e.g.33,36,65 other species and behaviours were altered at higher levels
(> 30 NTU) e.g.6,44,47,51,52,66,67. The turbidity range we chose has been previously measured on the Great Barrier
Reef where our study species has been found62.
Materials and methods
Subjects. All experimental protocols and husbandry were approved by a Local Ethical Review Committee
of the University of Oxford’s Department of Zoology, and methods were carried out in accordance with relevant
regulations and the code of practice for the care and use of animals for scientific purposes. A total of seven
Picasso triggerfish (Rhinecanthus aculeatus) were used in this experiment, however the data from only four fish
were used in the analysis as three fish showed signs of stress and did not participate in experiments. Fish were
purchased from local suppliers and were wild caught. Fish were housed in individual aquaria (36 × 104 cm) in a
flow through marine aquarium system and fed a mixed diet of pellets (Ocean Nutrition, Formula One Marine
Pellet), fish, krill and cockles. All fish had live rock and a commercially available fish shelter in each tank. All fish
were experimentally naïve prior to this experiment.
Prior to experimentation, fish were given five acclimation sessions on consecutive days in the experimental
tank. Fish were transferred from their home tank and placed in the experimental tank for one hour. They were
then given a break of one or two days before experiments began. Four of the fish were categorized as small
(total length: Fish 31P = 93 mm, Fish 32G = 92 mm, Fish 37K = 96 mm) and four were large (total length: Fish
38I = 165 mm, Fish 39J = 155 mm, Fish 40M = 130 mm, Fish 41N = 126 mm).
Experimental tank. Experiments were run in a separate experimental tank (Supp Fig. 1). The overall tank
size was 600 × 1000 mm, and was divided into three sections with acrylic boards. Water was pumped around the
tank (Eheim Compact 2000) to maintain flow and aeration. The first Sect. (600 mm × 215 mm) was considered a
refuge for the fish and had two shelters that were identical to those found in home tanks. Two water inlet hoses
were fed into this section. An opaque white wall with a guillotine door divided the refuge from the main test-
ing area. This wall had two perforated sections to allow water to flow through the tank. The main testing area
(600 mm × 740 mm) had an acrylic board on the bottom with hook and loop dots (Velcro Brand, 19 mm coins)
which were used to hold six food pots in place (see below for food pot details). There were six possible positions
for the food pots (A–F). The first three (A–C) were arranged in a row 19 cm from the entrance door. The second
row (D–F) were 38 cm back from the first row. A final Sect. (600 mm × 40 mm) was partitioned with a perforated
grey board and contained an outlet hose.
Food pots were small plastic petri dishes (diameter: 35 mm, depth: 10 mm) filled with agar agar jelly that held
a single food pellet in the centre. Food pots were made by mixing 3 g of agar agar powder (Special Ingredients
Ltd) with 225 mL of reversed osmosis filtered (RO) water and following package instructions. Approximately
one teaspoon of mixture was added to each petri dish with a single pellet, and the mixture was allowed to set.
Fresh pots were made daily. All fish were given opportunities to explore these pots in their home tank prior to
the experiment, and all subjects were able to find and remove the food pellet from within.
The water in the experimental tank was removed at the end of every day and refilled from the main flow
through system every morning to ensure that the water in the home tanks and the experimental one had the
same temperature and chemistry, thereby reducing possible fish stress.
Experimental procedure. At the beginning of every trial, a fish was caught with a net and a bucket and
moved from its home tank to the holding area of the testing tank with the guillotine door down. A video camera
(GoPro Hero 5. Resolution: 1080p, frames per second: 60, field of view: linear) placed above the tank was turned
on and a turbidity measurement was made (Hach 2100Q portable turbidity meter). The fish was given five min-
Scientific Reports | (2021) 11:5976 | https://doi.org/10.1038/s41598-021-84814-5 2
Vol:.(1234567890)www.nature.com/scientificreports/
utes to acclimate to the new tank after which a second turbidity sample was taken. The door was then opened
(trial start time), allowing the fish to enter the main tank. The time at which the fish first entered the main tank
was recorded (latency). The time and order of the food dishes the fish ate were recorded by an observer. When
the final pellet was consumed, a third turbidity sample was taken (actual time). The fish were given a full 30 min,
including acclimation time, in the tank and their overall time spent in the refuge and main tank areas were
recorded. At the end of the 30 min, a final turbidity sample was taken.
The water for turbidity samples were taken from the middle of the water column in the middle of the tank.
Vials were rinsed in RO water between uses and the exteriors were dried and polished. For each sample, three
measurements were taken. The first two were identical repeated measures, but the vial was inverted once before
the third measurement was read. The mean of the three measurements was used as the turbidity level for an
individual sample.
Two testing conditions were run: (1) low, and (2) high turbidity. Each fish completed 10 trials for each con-
dition. Low turbidity trials had nothing added to the water taken from the main flow through systems. High
turbidity trials had 12.5 g of calcium carbonate (Intra Laboratories Ltd) added to 81L of water. This was added
before fish were introduced to the experimental tank. Other materials such as Kaolin31,34 and Bentonite clay32,33
have been used in similar experiments with fish. All three materials have small particles which are easily sus-
pended in water. Calcium carbonate was chosen for this experiment because it is naturally present in marine
environments and can be safely added to marine aquarium systems. There is no evidence that high levels will
cause harm or undue stress to the fish.
A single trial was run per day to standardize satiation levels, and trials were run every weekday where the
treatments alternated (e.g. day 1: high, day 2: low, day 3: high, etc.). Therefore fish were only exposed to high
turbidity for 30 min every second day during weekdays. Half the fish started with a low turbidity trial, while the
other half started with high turbidity. Low turbidity trials were between 0.4 and 1.4 NTU and high turbidity was
between 40 and 68 NTU. In the high turbidity trials, over the 30 min testing period, the levels would decrease,
even with flow driven by a pump running through the tank. We found turbidity decreased by approximately
27% (sd: 5.25) throughout an entire 30 min trial (Supp. Fig. 2), but even the lowest levels measured were still
40 times higher than the low turbidity condition. The mean turbidity in high turbidity trials when the door was
opened (trial start) was 50.95 NTU (sd: 3.78). The mean turbidity when all food had been eaten was 49.67 NTU
(sd: 4.23). Given the relatively small difference in turbidity during this period, which is the focus of our analysis,
changing turbidity was not included as a factor in data analyses.
For the smaller fish, the six possible pellets are adequate for daily feeding, but the larger fish were given sup-
plemental pieces of fish or krill at the end of every day. On weekends, small fish were given pellets and fish pieces
on one day only and not fed on the second day. The larger fish were also given pellets and fish pieces on the first
day and a large cockle in the shell on the second day.
Foraging efficiency. Each trial was recorded on video and also observed by the experimenter. For each
trial, the experimenter recorded the turbidity levels, latency to consuming each pellet, the sequence of pellet
consumption, the number of times the fish went in and out of the acclimation area, and whether the fish went
into the shelter at all while in the acclimation area. The video covered the main testing area of the tank, and was
used to confirm the experimenter’s observations. A custom written program (Matlab) was used to track and
analyse the fish movement trajectories in each trial. Through a background subtraction method, the entire body
of the fish was identified and the centroid of this collection of pixels was recorded. The fish was tracked at a rate
of two frames per second. All videos with the points tracked were watched by the experimenter to detect and fix
any errors in tracking. Even in the high turbidity conditions, any error rate associated with detecting the fish will
come from differences in the outer edge of the fish. As the point measured was the centroid of the fish, potential
differences in overall area detection do not have a meaningful impact to the analysis and the fish was detected in
all frames. Six test parameters were identified: (1) exploration latency (time fish left the refuge), (2) total forag-
ing time (time fish finished last pellet), (3) actual foraging time (time fish finished the last pellet—exploration
latency), (4) total distance travelled (measured from when fish left refuge for the first time to when the final pel-
let was eaten), (5) travel efficiency (total distance travelled during foraging/actual foraging time), and (6) Emax
which is the maximum expected displacement of a trajectory as a function of the number of steps68,69. Time was
measured based on video analysis to the nearest half second (two frames per second). Distance measurements
were calculated based on changes in calibrated pixel values. The maximum expected displacement was calcu-
lated using the Emax function in the R:trajr package; larger values (approaching ∞) indicate straighter paths69.
Differences between treatments for each test parameter were analysed using linear mixed effects models
(‘lme4′ package in R70). The turbidity level (high vs low) were included in the model as fixed effects and individual
fish ID was included as a random (intercept-only) effect to account for repeated measures from the same fish.
Trial number was also included as a fixed effect (an ordered, quasi-numeric variable) to account for the possibility
of learning over the course of the experiment.
Test parameter ∼ Turbidity level + Trial number + (1| Fish ID)
The ‘jtools’ package in R 71 was used to calculate the fixed effect regression estimate and 95% confidence
interval of the model (the model estimate of the difference between treatment means). A likelihood ratio test
was used to test whether a model with and without turbidity treatment as a fixed effect better explained the
variation in each response variable.
Movement analysis. There are a range of methods that can be used to characterize movement trajectories
(e.g. tortuosity, similarity to the beeline, sinuosity), but these generally assume that subjects have freedom of
Scientific Reports | (2021) 11:5976 | https://doi.org/10.1038/s41598-021-84814-5 3
Vol.:(0123456789)www.nature.com/scientificreports/
movement, or that their movement is directed towards a single goal. In our experiments, subjects were limited
by the relatively small area of the tank and there were six possible reward locations causing the fish to frequently
change directions. To deal with this, we analysed how rapidly new areas were explored by the fish, and as a meas-
ure of movement efficiency, we analysed how this metric increased per unit of distance travelled. To do this, a
minimum convex polygon (MCP) was drawn around the fish track at each half-second time point, and the area
was recorded. To disentangle the spatial and temporal components of space exploration (i.e. were differences just
caused by fish in one treatment performing the same search movement faster), we divided the measured MCP
by the distance travelled by the fish up to that point. This gave us a measure of area explored per unit distance
travelled, and identified if a more convoluted path was taken to explore a given area between two points. See
Supp. Video 1, for a visual example of how a trajectory results in MCP values. This described how movement of
the fish was translated into exploration in new parts of the tank throughout the trial. These measures allow us to
assess whether fish alter their exploration strategy in turbid conditions, and whether this manifests as differences
in exploration efficiency.
The distances travelled by fish between each sampling time point (two frames per second) were calculated and,
since the frame rate remained constant, this was a measure of relative mean speed between relocations. Linear
mixed effects models were used to test for an effect of treatment on speed, with turbidity level as a predictor, trial
number as a fixed effect, and fish ID as a random (intercept only) effect.
We employed linear mixed effects models to test for an effect of treatment on MCP and MCP per unit dis-
tance as response variables. Predictor variables were the interaction between treatment and time elapsed, trial
number as a fixed effect, and fish ID as a random (intercept only) effect to account for repeated measures. This
model was compared with a null model, containing only additive effects of treatment and time to look for an
effect of treatment on the rate of increase in the response variable over the course of the experiment. So that all
trials were comparable, the minimum time taken by any fish was used, therefore only the first 19 s were analysed.
A final analysis was conducted to determine whether fish encountered food more often than would be
expected by chance given their movement parameters (speed and turning angle). The idea is that spatially coher-
ent movement, aided by sensory inputs, could improve fishes’ ability to locate food pots. Whether encounters
with food pots is more likely than chance should be indicative of whether fish in low and high turbidity water
were able to direct movement and use senses to encounter food better than random searching. To measure this,
we compared real fish trajectories with pseudo-random trajectories where distances travelled and turning angles
were identical to real fish but turning direction (clockwise or counter clockwise), and the start direction (when
leaving the refuge area) was randomized. Where pseudo-random fish movement would take them out of the
tank area, a turning angle was randomly drawn until the resulting trajectory remained within the tank area. This
allowed the correlation between step length and turning angle to be retained from the real fish. Food encounter
rate was measured as the number of occasions that trajectories came within 30 mm of a food pot per time step
spent away from pots (time spent feeding was not counted). This encounter rate was then compared between
treatments and between real and simulated fish. Each fish trajectory was randomized, giving a pseudorandom fish
for each trial in each treatment. Generalized Linear mixed effects models (with binomial error structure) were
used to estimate encounter rates and their confidence intervals for pseudorandom fish from both treatments,
taking account of repeated measures from individual fish.
Results
The smaller fish all exhibited stress by never eating in a trial (32G), refusing to leave the refuge (31P), or showing
other behaviours associated with stress (such as rapidly and repeatedly swimming along the wall of the aquarium)
(37 K; 38I, trials 2–3). Hence the small fish were excluded from the experiment, and only the four larger fish were
included in the final analysis. In a limited number of these trials (n = 3), the subject did not leave the refuge area
(Fish 41N, trial 4, high turbidity) or eat all the food pellets (Fish 41N, trials 2, 4, high turbidity; Fish 38I, trial 1,
high turbidity). The missing data from these trials were not included in the analyses.
Foraging efficiency. The results of the four large fish indicate that turbidity can have a significant impact
on foraging and activity levels (Fig. 1). In all response variables measured, models with the turbidity treat-
ment predicted our response variables significantly better than null models. Estimates from the full model were
thus retained. For these, the time taken and distance travelled were all greater in the high turbidity treatment:
exploration latency (p = 0.002) was 26.78 (95% CI: 10.49–43.07) seconds longer; total foraging time (p < 0.0001)
was 111.52 (95% CI: 80.49–142.55) seconds longer; actual foraging time (p < 0.0001) was 85.40 (95% CI: 58.78–
112.02) seconds longer; total distance travelled (p < 0.0001) was 3.50 m (95% CI: 2.49–4.51) greater in the high
turbidity treatment. Travel efficiency (p < 0.0001) decreased by 0.016 (95% CI: 0.01—0.02) meters/second; and
finally Emax (p < 0.0001) was 20.70 (95% CI: 14.61—26.79). Thus, in the high turbidity treatment, fish were slower,
gained food less efficiently and travelled further, with a more tortuous trajectory.
Movement analysis. Our analysis clearly shows that trajectories are longer and more tortuous in high
turbidity conditions. A more detailed analysis of the trajectories (See Supp. Fig. 3) using the minimum convex
polygon measure, indicated that there was also a significant difference in how space was explored between the
two treatments. For the first 19 s of the trial, the minimum convex polygon increased significantly faster in the
low turbidity treatment (Fig. 2a: Likelihood ratio test between full model and model with treatment*time inter-
action dropped: X2 = 295.28, p < 0.00001), and did so even when accounting for distance travelled (Fig. 2b). At
the beginning of the experiment, new areas were explored quickly, which is indicated by a high cumulative rate
of exploration. As the experiment progresses, there were fewer new areas to explore, and hence rates of explo-
ration reached an asymptote, and fall when divided by time. From the MCP analysis, we can see that the fish
Scientific Reports | (2021) 11:5976 | https://doi.org/10.1038/s41598-021-84814-5 4
Vol:.(1234567890)www.nature.com/scientificreports/
Figure 1. The panel shows the mean results across the six test parameters used to describe movement
behaviour during foraging. Bars indicate 95% confidence intervals calculated from a linear mixed effects model.
To make the visual representation of the data more intuitive, the y-axis estimates for the variable of interest is
shown for the mean effect of trial rather than the intercept. (a) Exploration latency: the time from when the
door to the refuge area is opened, and when the fish enters the test area. (b) Actual foraging time: the time from
when the fish enters the test area to when it has eaten all six pellets. (c) Total foraging time: the time from when
the door is opened to when the fish has eaten all six pellets (exploration latency + actual foraging time). (d) Total
distance travelled: the distance travelled from when the fish enters the test area to when all pellets are consumed.
(e) Travel efficiency: the total distance travelled divided by the actual foraging time. (f) Emax: The maximum
expected displacement where greater values indicate a straighter trajectory.
in high turbidity spent time exploring areas either that they had already been to, or been close to, than the low
turbidity group. These results indicate that fish in the high turbidity treatment spent more energy searching areas
that they had visited already (Likelihood ratio test between full model and model with treatment*time interac-
tion dropped: X2 = 131.76, p < 0.00001). They also moved 3.2 cm less per half second interval throughout the trial
than fish in clear water (Fig. 2c: Likelihood ratio test between full model and model with treatment dropped: X2
40.79 = , p < 0.00001).
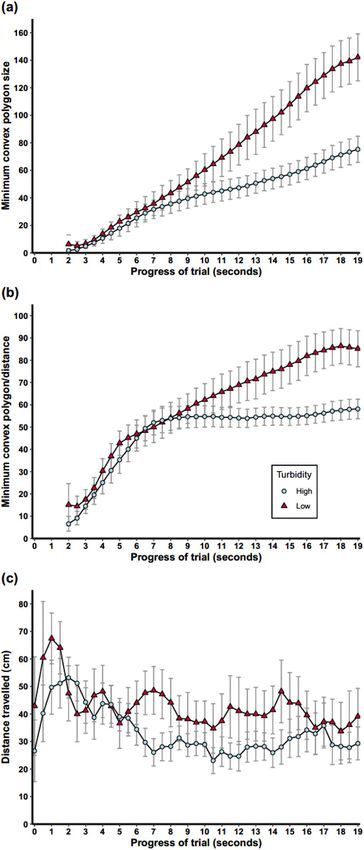
Comparison of the movement trajectories of fish to the simulated fish showed that in both treatments, fish
encounter food far more often than is predicted by chance. Food encounter rate in simulated fish, estimated from
our binomial GLMMs (accounting for repeated measures from individuals), was 0.016 (95% CI: 0.010—0.025)
and 0.007 (95% CI: 0.003—0.018) encounters per time step in the high and low turbidity treatments respectively,
whereas for real fish trajectories it was 0.113 (95% CI: 0.091—0.140) and 0.161 (95% CI: 0.140—0.183) encounters
per time step (Fig. 3). Hence, even in high turbidity, fish movement was sufficiently organised to find food much
better than by random searching.
Discussion
Our results indicate that turbidity has a considerable impact on the movement of a coral reef fish species while
foraging, in terms of distance travelled, time taken to find all food, and the efficiency with which fish cover space
to access a resource. It not only took fish in high turbidity longer to find food, but they also spent more energy
searching as routes were longer and less direct, and fish were more likely to search the same area again. We also
observed that it took longer for fish to leave the shelter area and enter the more open test area. For some species
of juvenile fish increased turbidity can be beneficial as it likely reduces their predation risk, allowing the fish
to use shelter less 35,72 and increase time spent in open water 37. However, the fact that fish are away from their
Scientific Reports | (2021) 11:5976 | https://doi.org/10.1038/s41598-021-84814-5 5
Vol.:(0123456789)www.nature.com/scientificreports/
Figure 2. Plots show the increase in the minimum convex polygon made by the fishes’ cumulative movement
up to each time point in high turbidity (blue circles) and low turbidity (red triangles) treatments, both as a
raw area in m2 (a), and as the area divided by the distance that the fish had travelled to that point in m
2 per cm
travelled (b), to give a measure of how fish were converting movement into new areas explored in the tank. (c)
The mean distance travelled (cm) measured at half second intervals, throughout the first 19 s of the experiment.
Error bars indicate 95% confidence intervals.
shelter longer may also lead to indirect costs such as increased predation risk and loss of territory 64,73. Our results
suggest that turbidity has a negative impact on adult R. aculeatus as they are likely to be slower to leave their
shelter and require more energy to locate the same number of food items. This may be particularly problematic
given that an increase in energy consumption during foraging can directly lead to decreased growth rates in
Scientific Reports | (2021) 11:5976 | https://doi.org/10.1038/s41598-021-84814-5 6
Vol:.(1234567890)www.nature.com/scientificreports/
Figure 3. Expected food encounter frequency of simulated fish and real food encounter rate. Simulated fish
were created by pseudo-randomizing the turning direction and starting direction of real fish trajectories. 95%
confidence intervals, calculated from the standard error of estimates from our binomial mixed effects model are
shown.
some species of fi sh54. We also found that the differences in mean foraging time (both total and actual) and
distance travelled across treatments are quite large (total foraging time: 1.8 min; actual foraging time: 1.4 min;
total distance travelled: 3.48 m) given the relatively small scale of the testing aquarium. Under real conditions,
the distances over which this species is travelling while foraging is much greater (~ 10 m2, CN personal observa-
tion at Lizard Island, Australia). As a result, it seems reasonable to expect the consequences of turbidity on wild
populations to be considerably greater.
As previously discussed, the foraging efficiency of fish in high turbidity decreased as they travelled farther
and took longer to complete the task. To understand more about the underlying mechanisms of these differ-
ences, we analysed the characteristics of the trajectories. Changes in efficiency could have been achieved two
ways, either fish could swim faster, or they could swim more directly to targets. We found that not only was the
route longer for fish in high turbidity, but the Emax was higher for fish in high turbidity indicating that their paths
were generally straighter. While this would typically indicate a more efficient route, in our foraging task, food
sources were lined up close to each other and collecting all of the food required travelling short distances and
frequent turning. Therefore, the straighter paths of fish in high turbidity reflects that they were spending more
time searching areas without finding food. In addition, the fish in high turbidity were more likely to search the
same area more than once, which again decreases efficiency. Rather than increasing their speed to make up for
this searching redundancy, the fish in high turbidity actually swam slower throughout the trial.
The changes in behaviour that we observed are particularly compelling because non-visual cues could have
been used to guide foraging behaviour. For example, extra-visual spatial cues combined with visual or mechanical
cues (e.g. tank walls) from within and outside the tank could be used for orientation to at least the general area
of the food rewards. As long as fish could generally orient to the correct area, once one pellet was found, one
might expect finding all six pellets to be relatively straightforward. Other sensory information could also have
acted as orientation cues as both o lfaction74 and a udition17 are involved in fish navigation, particularly over long
distances. Zebrafish have been shown to change their preference for visual stimuli to olfactory stimuli after six
weeks in turbid water45, suggesting that this is possible for fish, although the timescale of exposure between this
experiment and that with zebrafish are not comparable. As the food pellets were in the water, olfactory cues were
available and could be used to navigate directly to the pellets, depending on the olfactory sensitivity of the fish.
Auditory and flow (from pumps) cues could also have provided less direct orientation cues. It is highly likely
that the fish did use some of these cues, or others that we have not thought of, to locate the food. Comparisons
of our real trajectories to simulated ones based on random movement, showed that in both treatments, fish
encountered food at a much higher rate than simulated fish would. Therefore, even in high turbidity, the fish were
still directing movement towards finding food, they were simply much less efficient. This suggests that while the
detection distance of targets was decreased, either vision (at a reduced distance), or some other sensory system
was still able to provide some location information, providing considerable improvement from random search.
However, it is clear that alternate sensory systems do not provide a complete solution to the problem of sensory
pollution in the visual system and it should not be assumed that they can fully compensate for the loss of visual
important information.
The Picasso triggerfish may be particularly reliant on visual information, and it is possible that visual pollu-
tion would have less of an effect on other species. However, on clear shallow coral reefs where transmission of
visual signals is generally reliable22, many species use vision to guide a wide range of behaviours (e.g. individual
recognition75, signalling76, spatial l earning61). It therefore seems reasonable to assume that other species will be
Scientific Reports | (2021) 11:5976 | https://doi.org/10.1038/s41598-021-84814-5 7
Vol.:(0123456789)www.nature.com/scientificreports/
affected by turbidity, even if the effect size is variable. This will be particularly true for behaviours in which vision
has primacy. To unravel the impacts of turbidity on fish, we need to understand the role of multimodal sensory
perception in dealing with shifts in the visual environment. However, our results indicate that it is unlikely that
fish can simply use another sensory system when visual signals become unreliable and maintain the same levels
of efficiency.
Initially eight fish were used for this experiment, however four small fish were excluded as they never accli-
mated to the experimental setup. It is tempting to ignore the behaviour of the small fish given that we have no
data to analyse, however, it is worth noting this effect. We speculate that body size could influence individual
behaviour such as boldness and willingness to explore, in this species. There is some evidence that body size can
impact these characteristics in fish77, although results showed that larger fish were slower to emerge from cover
in the particular species (Brachyraphis episcopi) and context tested. If body size does have a consistent effect on
movement in R. aculeatus, there may be multiple strategies within the same species for dealing with changes to
the available sensory information; but this is just conjecture and requires further experimentation. The emer-
gence of two groups within our experiment, fish that participated and those that didn’t, calls into question the
generalisability of our results at the population level. However, this suggests that a response to turbidity is that
fish may not leave shelter to forage. This is consistent with our overall conclusion that increases in turbidity can
lead to a decrease in foraging efficiency.
The levels of turbidity used in our experiment were based on what has been measured under normal condi-
tions within the habitat range of our model species. The fact that these levels were enough to produce a stark
behavioural change provides more evidence that high, but realistic, levels of turbidity might constitute a signifi-
cant pollutant for fish, affecting many aspects of their life history. While fluctuations in turbidity are natural,
animals may not be adapted to the more extreme and persistent turbidity caused by human activities. Given the
number of threats already experienced by reef inhabitants, including ocean warming, acidification, coral bleach-
ing and loss of habitat, it is imperative that the frequency of other possible stressors is r educed78. It is therefore
both important and urgent to further explore the role turbidity, and particularly human-induced turbidity, on
the behaviour of coral reef animals. Understanding the extent of the impact of turbidity on wild populations,
whether animals possess mechanisms to cope at least for certain behaviours, and how more extreme turbidity
will impact animals, will improve our understanding of how changes to sensory system input impacts behaviour.
It will also provide much needed data to help scientists model and assess the impacts of turbidity on coral reef
ecosystems20. Future studies on the effects of turbidity and the levels that can be tolerated could be crucial to
conservation efforts.
Received: 15 October 2020; Accepted: 9 February 2021
References
1. Scholik, A. R. & Yan, H. Y. Effects of boat engine noise on the auditory sensitivity of the fathead minnow, Pimephales promelas. .
Environ. Biol. Fish. 63, 203–209. https://doi.org/10.1023/A:1014266531390 (2002).
2. Simpson, S. D. et al. Anthropogenic noise increases fish mortality by predation. Nat. Commun. 7, 10544. https://doi.org/10.1038/
ncomms10544 (2016).
3. Slabbekoorn, H. et al. A noisy spring: the impact of globally rising underwater sound levels on fish. Trends. Ecol. Evol. 25, 419–427.
https://doi.org/10.1016/j.tree.2010.04.005 (2010).
4. Halfwerk, W. & Slabbekoorn, H. Pollution going multimodal: the complex impact of the human-altered sensory environment on
animal perception and performance. Biol. Lett. 11, 20141051. https://doi.org/10.1098/rsbl.2014.1051 (2015).
5. Baker, C. F. & Montgomery, J. C. Sensory deficits induced by cadmium in banded kokopu, Galaxias fasciatus, juveniles. Environ.
Biol. Fish. 62, 455–464. https://doi.org/10.1023/A:1012290912326 (2001).
6. O’Connor, J. J. et al. Sediment pollution impacts sensory ability and performance of settling coral-reef fish. Oecologia 180, 11–21.
https://doi.org/10.1007/s00442-015-3367-6 (2016).
7. Tierney, K. B., Sampson, J. L., Ross, P. S., Sekela, M. A. & Kennedy, C. J. Salmon olfaction is impaired by an environmentally realistic
pesticide mixture. Environ. Sci. Tech. 42, 4996–5001. https://doi.org/10.1021/es800240u (2008).
8. Ward Ashley, J. W., Duff Alison, J., Horsfall Jennifer, S. & Currie, S. Scents and scents-ability: pollution disrupts chemical social
recognition and shoaling in fish. Proc. R Soc. B Biol. Sci. 275, 101–105. https://doi.org/10.1098/rspb.2007.1283 (2008).
9. Besson, M. et al. Exposure to agricultural pesticide impairs visual lateralization in a larval coral reef fish. Sci. Rep. 7, 9165. https://
doi.org/10.1038/s41598-017-09381-0 (2017).
10. Vasconcelos, R. O., Amorim, M. C. P. & Ladich, F. Effects of ship noise on the detectability of communication signals in the Lusi-
tanian toadfish. J. Exp. Biol. 210, 2104–2112. https://doi.org/10.1242/jeb.004317 (2007).
11. Bruintjes, R. et al. Rapid recovery following short-term acoustic disturbance in two fish species. R. Soc. Open Sci. 3, 150686. https
://doi.org/10.1098/rsos.150686 (2016).
12. Radford, A. N., Lèbre, L., Lecaillon, G., Nedelec, S. L. & Simpson, S. D. Repeated exposure reduces the response to impulsive noise
in European seabass. Glob. Chang. Biol. 22, 3349–3360. https://doi.org/10.1111/gcb.13352 (2016).
13. Briffa, M., de la Haye, K. & Munday, P. L. High CO2 and marine animal behaviour: Potential mechanisms and ecological conse-
quences. Mar. Pollut. Bull. 64, 1519–1528. https://doi.org/10.1016/j.marpolbul.2012.05.032 (2012).
14. Simpson, S. D. et al. Ocean acidification erodes crucial auditory behaviour in a marine fish. Biol. Lett. https://doi.org/10.1098/
rsbl.2011.0293 (2011).
15. van der Sluijs, I. et al. Communication in troubled waters: responses of fish communication systems to changing environments.
Evol. Ecol. 25, 623–640. https://doi.org/10.1007/s10682-010-9450-x (2011).
16. Wysocki, L. E., Dittami, J. P. & Ladich, F. Ship noise and cortisol secretion in European freshwater fishes. Biol. Conserv. 128,
501–508. https://doi.org/10.1016/j.biocon.2005.10.020 (2006).
17. Montgomery, J. C., Jeffs, A., Simpson, S. D., Meekan, M. & Tindle, C. Sound as an orientation cue for the pelagic larvae of reef
fishes and decapod crustaceans. Adv. Mar. Biol. 51, 143–196. https://doi.org/10.1016/S0065-2881(06)51003-X (2006).
18. Burke, L., Reytar, K., Spalding, M. & Perry, A. Reefs at risk revisited. 130, 1 (2011).
19. Collin, S. P. & Hart, N. S. Vision and photoentrainment in fishes: The effects of natural and anthropogenic perturbation. Integr.
Zool. 10, 15–28. https://doi.org/10.1111/1749-4877.12093 (2015).
Scientific Reports | (2021) 11:5976 | https://doi.org/10.1038/s41598-021-84814-5 8
Vol:.(1234567890)www.nature.com/scientificreports/
20. Brodie, J. E. et al. Terrestrial pollutant runoff to the Great Barrier Reef: An update of issues, priorities and management responses.
Mar Pollut Bull 65, 81–100. https://doi.org/10.1016/j.marpolbul.2011.12.012 (2012).
21. Marshall, N. J. in Animal Signals. Signalling and signal design in animal communication (eds Y. Espmark, Y. Amundsen, & G.
Rosenqvist) 83–120 (Tapir Academic Press, 2000).
22. Marshall, J. Vision and lack of vision in the ocean. Curr. Biol. 27, R494–R502. https://doi.org/10.1016/j.cub.2017.03.012 (2017).
23. Cortesi, F. et al. Visual system diversity in coral reef fishes. Semin. Cell Dev. Biol. 106, 31–42. https://doi.org/10.1016/j.semcd
b.2020.06.007 (2020).
24. Collier, C., Waycott, M. & Ospina, A. G. Responses of four Indo-West Pacific seagrass species to shading. Mar. Pollut. Bull. 65,
342–354. https://doi.org/10.1016/j.marpolbul.2011.06.017 (2012).
25. De’ath, G. & Fabricius, K. Water quality as a regional driver of coral biodiversity and macroalgae on the Great Barrier Reef. Ecol.
Appl. 20, 840–850. https://doi.org/10.1890/08-2023.1 (2010).
26. Fabricius, K. E. Effects of terrestrial runoff on the ecology of corals and coral reefs: review and synthesis. Mar. Pollut. Bull. 50,
125–146. https://doi.org/10.1016/j.marpolbul.2004.11.028 (2005).
27. Morgan, K. M., Perry, C. T., Johnson, J. A. & Smithers, S. G. Nearshore turbid-zone corals exhibit high bleaching tolerance on the
Great Barrier Reef following the 2016 ocean warming event. Front. Mar. Sci. 4, 1–13. https://doi.org/10.3389/fmars.2017.00224
(2017).
28. Schartau, J. M., Sjögreen, B., Gagnon, Y. L. & Kröger, R. H. H. Optical plasticity in the crystalline lenses of the cichlid fish Aequidens
pulcher. Curr. Biol. 19, 122–126. https://doi.org/10.1016/j.cub.2008.11.062 (2009).
29. Kröger, R. H. H., Braun, S. C. & Wagner, H.-J. Rearing in different photic and chromatic environments modifies spectral responses
of cone horizontal cells in adult fish retina. Vis. Neuro Sci. 18, 857–864. https://doi.org/10.1017/S0952523801186025 (2001).
30. Kröger, R. H. H., Knoblauch, B. & Wagner, H.-J. Rearing in different photic and spectral environments changes the optomotor
response to chromatic stimuli in the cichlid fish Aequidens pulcher. J. Exp. Biol. 206, 1643–1648. https://doi.org/10.1242/jeb.00337
(2003).
31. Borner, K. K. et al. Turbidity affects social dynamics in Trinidadian guppies. Behav. Ecol. Sociobiol. 69, 645–651. https://doi.
org/10.1007/s00265-015-1875-3 (2015).
32. Kimbell, H. S. & Morrell, L. J. Turbidity influences individual and group level responses to predation in guppies Poecilia reticulata.
. Anim. Behav. 103, 179–185. https://doi.org/10.1016/j.anbehav.2015.02.027 (2015).
33. Johansen, J. L. & Jones, G. P. Sediment-induced turbidity impairs foraging performance and prey choice of planktivorous coral
reef fishes. Ecol. Appl. 23, 1504–1517. https://doi.org/10.1890/12-0704.1 (2013).
34. Chamberlain, A. C. & Ioannou, C. C. Turbidity increases risk perception but constrains collective behaviour during foraging by
fish shoals. Anim. Behav. 156, 129–138. https://doi.org/10.1016/j.anbehav.2019.08.012 (2019).
35. Gregory, R. S. Effect of turbidity on the predator avoidance behaviour of juvenile Chinook salmon (Oncorhynchus tshawytscha).
Can. J. Fish. Aquat. Sci. 50, 241–246. https://doi.org/10.1139/f93-027 (1993).
36. Hess, S. et al. Enhanced fast-start performance and anti-predator behaviour in a coral reef fish in response to suspended sediment
exposure. Coral Reefs 38, 103–108. https://doi.org/10.1007/s00338-018-01757-6 (2019).
37. Miner, J. G. & Stein, R. A. Detection of predators and habitat choice by small Bluegills: Effects of turbidity and alternative prey. T
Am. Fish. Soc. 125, 97–103. https://doi.org/10.1577/1548-8659(1996)125%3c0097:DOPAHC%3e2.3.CO;2 (1996).
38. Utne-Palm, A. C. Visual feeding of fish in a turbid environment: Physical and behavioural aspects. Mar. Freshw. Behav. Phys. 35,
111–128. https://doi.org/10.1080/10236240290025644 (2002).
39. Fiksen, Ø., Aksnes, D., Flyum, H. & M. & Giske, J. ,. The influence of turbidity on growth and survival of fish larvae: A numerical
analysis. Hydrobiologia 484, 49–59. https://doi.org/10.1023/A:1021396719733 (2002).
40. Gregory, R. S. & Levings, C. D. The effects of turbidity and vegetation on the risk of juvenile salmonids, Oncorhynchus spp, to
predation by adult cutthroat trout, O. clarkii. Environ Biol Fish 47, 279–288. https://doi.org/10.1007/BF00000500 (1996).
41. Wenger, A. S., McCormick, M. I., McLeod, I. M. & Jones, G. P. Suspended sediment alters predator–prey interactions between two
coral reef fishes. Coral Reefs 32, 369–374. https://doi.org/10.1007/s00338-012-0991-z (2013).
42. Asaeda, T., Kyung Park, B. & Manatunge, J. Characteristics of reaction field and the reactive distance of a planktivore, Pseudorasbora
parva (Cyprinidae), in various environmental conditions. Hydrobiologia 489, 29–43. https://doi.org/10.1023/A:1023298823106
(2002).
43. Barrett, J. C., Grossman, G. D. & Rosenfeld, J. Turbidity-induced changes in reactive distance of rainbow trout. Trans. Am. Fish.
Soc. 121, 437–443. https://doi.org/10.1577/1548-8659(1992)121%3c0437:TICIRD%3e2.3.CO;2 (1992).
44. Sweka, J. A. & Hartman, K. J. Reduction of reactive distance and foraging success in smallmouth bass, Micropterus dolomieu,
exposed to elevated turbidity levels. Environ. Biol. Fish. 67, 341–347. https://doi.org/10.1023/A:1025835031366 (2003).
45. Suriyampola, P. S., Cacéres, J. & Martins, E. P. Effects of short-term turbidity on sensory preference and behaviour of adult fish.
Anim. Behav. 146, 105–111. https://doi.org/10.1016/j.anbehav.2018.10.014 (2018).
46. De Robertis, A., Ryer, C. H., Veloza, A. & Brodeur, R. D. Differential effects of turbidity on prey consumption of piscivorous and
planktivorous fish. Can. J. Fish. Aquat. Sci. 60, 1517–1526. https://doi.org/10.1139/f03-123 (2003).
47. Huenemann, T. W., Dibble, E. D. & Fleming, J. P. Influence of turbidity on the foraging of largemouth bass. Trans. Am. Fish. Soc.
141, 107–111. https://doi.org/10.1080/00028487.2011.651554 (2012).
48. Sekhar, M. A., Singh, R., Bhat, A. & Jain, M. Feeding in murky waters: acclimatization and landmarks improve foraging efficiency
of zebrafish (Danio rerio) in turbid waters. Biol. Lett. 15, 20190289. https://doi.org/10.1098/rsbl.2019.0289 (2019).
49. Wenger, A. S., Johansen, J. L. & Jones, G. P. Increasing suspended sediment reduces foraging, growth and condition of a plank-
tivorous damselfish. J. Exp. Mar. Biol. Ecol. 428, 43–48. https://doi.org/10.1016/j.jembe.2012.06.004 (2012).
50. Wenger, A. S. et al. Suspended sediment prolongs larval development in a coral reef fish. J. Exp. Biol. 217, 1122–1128. https://doi.
org/10.1242/jeb.094409 (2014).
51. Ehlman, S. M., Sandkam, B. A., Breden, F. & Sih, A. Developmental plasticity in vision and behavior may help guppies overcome
increased turbidity. J. Comput. Physiol. 201, 1125–1135. https://doi.org/10.1007/s00359-015-1041-4 (2015).
52. Hazelton, P. D. & Grossman, G. D. Turbidity, velocity and interspecific interactions affect foraging behaviour of rosyside dace
(Clinostomus funduloides) and yellowfin shiners (Notropis lutippinis). Ecol. Freshw. Fish 18, 427–436. https://doi.org/10.111
1/j.1600-0633.2009.00359.x (2009).
53. Hecht, T. & van der Lingen, C. D. Turbidity-induced changes in feeding strategies of fish in estuaries. S. Afr. J. Zool. 27, 95–107.
https://doi.org/10.1080/02541858.1992.11448269 (1992).
54. Sweka, J. A. & Hartman, K. J. Effects of turbidity on prey consumption and growth in brook trout and implications for bioenergetics
modeling. Can. J. Fish. Aquat. Sci. 58, 386–393. https://doi.org/10.1139/f00-260 (2001).
55. Burt de Perera, T. & Macías Garcia, C. Amarillo fish (Girardinichthys multiradiatus) use visual landmarks to orient in space. Ethol-
ogy 109, 341–350. https://doi.org/10.1046/j.1439-0310.2003.00876.x (2003).
56. Warburton, K. The use of local landmarks by foraging goldfish. Anim. Behav. 40, 500–505. https://doi.org/10.1016/s0003
-3472(05)80530-5 (1990).
57. Burt de Perera, T. & Guilford, T. C. Rapid learning of shelter position in an intertidal fish, the shanny Lipophrys pholis L. J. Fish.
Biol. 72, 1386–1392. https://doi.org/10.1111/j.1095-8649.2008.01804.x (2008).
58. Hughes, R. N. & Blight, C. M. Two intertidal fish species use visual association learning to track the status of food patches in a
radial maze. Anim. Behav. 59, 613–621. https://doi.org/10.1006/anbe.1999.1351 (2000).
Scientific Reports | (2021) 11:5976 | https://doi.org/10.1038/s41598-021-84814-5 9
Vol.:(0123456789)www.nature.com/scientificreports/
59. Huntingford, F. A. & Wright, P. J. How sticklebacks learn to avoid dangerous feeding patches. Behav. Process. 19, 181–189. https
://doi.org/10.1016/0376-6357(89)90040-5 (1989).
60. Reese, E. Orientation behavior of butterflyfishes (family Chaetodontidae) on coral reefs: spatial learning of route specific landmarks
and cognitive maps. Environ. Biol. Fish. 25, 79–86. https://doi.org/10.1007/bf00002202 (1989).
61. Silveira, M. M., Oliveira, J. J. & Luchiari, A. C. Dusky damselfish Stegastes fuscus relational learning: evidences from associative
and spatial tasks. J. Fish. Biol. 86, 1109–1120. https://doi.org/10.1111/jfb.12618 (2015).
62. Cyrus, D. P. & Blaber, S. J. M. Turbidity and salinity in a tropical northern Australian estuary and their influence on fish distribu-
tion. Estuar. Coast Shelf. S 35, 545–563. https://doi.org/10.1016/S0272-7714(05)80038-1 (1992).
63. Macdonald, R. K., Ridd, P. V., Whinney, J. C., Larcombe, P. & Neil, D. T. Towards environmental management of water turbidity
within open coastal waters of the Great Barrier Reef. Mar. Pollut. Bull. 74, 82–94. https://doi.org/10.1016/j.marpolbul.2013.07.026
(2013).
64. Wenger, A. S. et al. A critical analysis of the direct effects of dredging on fish. Fish Fish 18, 967–985. https://doi.org/10.1111/
faf.12218(2017).
65. Wenger, A. S. & McCormick, M. I. Determining trigger values of suspended sediment for behavioral changes in a coral reef fish.
Mar. Pollut. Bull. 70, 73–80. https://doi.org/10.1016/j.marpolbul.2013.02.014 (2013).
66. Gardner, M. B. Mechanisms of size selectivity by planktivorous fish: a test of hypotheses. Ecology 62, 571–578. https://doi.
org/10.2307/1937723 (1981).
67. Shoup, D. E. & Wahl, D. H. The effects of turbidity on prey selection by piscivorous largemouth bass. Trans. Am. Fish. Soc. 138,
1018–1027. https://doi.org/10.1577/T09-015.1 (2009).
68. Cheung, A., Zhang, S., Stricker, C. & Srinivasan, M. V. Animal navigation: the difficulty of moving in a straight line. Biol. Cybern.
97, 47–61. https://doi.org/10.1007/s00422-007-0158-0 (2007).
69. McLean, D. J. & Skowron Volpani, M. A. trajr: An R package for characterisation of animal trajectories. Ethology 124, 40–448.
https://doi.org/10.1111/eth.12739 (2018).
70. Bates, D., Mächler, M., Bolker, B. & Walker, S. Fitting linear mixed-effects models using lme4. J. Stat. Softw. 67, 1–48. https://doi.
org/10.18637/jss.v067.i01 (2015).
71. jtools: Analysis and presentation of social scientific data v. R package version 2.0.1 (2019).
72. Gradall, K. S. & Swenson, W. A. Responses of brook trout and creek chubs to turbidity. Trans. Am. Fish. Soc. 111, 392–395. https
://doi.org/10.1577/1548-8659(1982)111%3c392:ROBTAC%3e2.0.CO;2 (1982).
73. Berg, L. & Northcote, T. G. Changes in territorial, gill-flaring, and feeding behavior in juvenile Coho salmon (Oncorhynchus kisutch)
following short-term pulses of suspended sediment. Can. J. Fish. Aquat. Sci. 42, 1410–1417. https: //doi.org/10.1139/f85-176 (1985).
74. Paris, C. B. et al. Reef odor: A wake up call for navigation in reef fish larvae. PLoS ONE 8, e72808. https://doi.org/10.1371/journ
al.pone.0072808 (2013).
75. Siebeck, U. E., Parker, A. N., Sprenger, D., Mathger, L. M. & Wallis, G. A species of reef fish that uses ultraviolet patterns for covert
face recognition. Curr. Biol. 20, 407–410. https://doi.org/10.1016/j.cub.2009.12.047 (2010).
76. Cheney, K. L., Grutter, A. S., Blomberg, S. P. & Marshall, N. J. Blue and yellow signal cleaning behavior in Coral Reef Fishes. Curr.
Biol. 19, 1283–1287. https://doi.org/10.1016/j.cub.2009.06.028 (2009).
77. Brown, C. & Braithwaite, V. A. Size matters: a test of boldness in eight populations of the poeciliid Brachyraphis episcopi. Anim.
Behav. 68, 1325–1329. https://doi.org/10.1016/j.anbehav.2004.04.004 (2004).
78. Harborne, A. R., Rogers, A., Bozec, Y.-M. & Mumby, P. J. Multiple stressors and the functioning of coral reefs. Annu. Rev. Mar. Sci.
9, 445–468. https://doi.org/10.1146/annurev-marine-010816-060551 (2017).
Acknowledgements
We thank Yarema Reshitnyk for video analysis advice and Christine Soper for animal husbandry support.
Author contributions
C.N. and T.B.P. conceived this study. C.N. designed the study, carried out experimental work, pre-processed the
data, and drafted the manuscript. C.N. and O.P. conducted data and statistical analyses. O.P. and T.B.P critically
revised the manuscript.
Competing interests
The authors declare no competing interests.
Additional information
Supplementary Information The online version contains supplementary material available at https://doi.
org/10.1038/s41598-021-84814-5.
Correspondence and requests for materials should be addressed to C.N.
Reprints and permissions information is available at www.nature.com/reprints.
Publisher’s note Springer Nature remains neutral with regard to jurisdictional claims in published maps and
institutional affiliations.
Open Access This article is licensed under a Creative Commons Attribution 4.0 International
License, which permits use, sharing, adaptation, distribution and reproduction in any medium or
format, as long as you give appropriate credit to the original author(s) and the source, provide a link to the
Creative Commons licence, and indicate if changes were made. The images or other third party material in this
article are included in the article’s Creative Commons licence, unless indicated otherwise in a credit line to the
material. If material is not included in the article’s Creative Commons licence and your intended use is not
permitted by statutory regulation or exceeds the permitted use, you will need to obtain permission directly from
the copyright holder. To view a copy of this licence, visit http://creativecommons.org/licenses/by/4.0/.
© The Author(s) 2021
Scientific Reports | (2021) 11:5976 | https://doi.org/10.1038/s41598-021-84814-5 10
Vol:.(1234567890)You can also read