Technical note: Fundamental aspects of ice nucleation via pore condensation and freezing including Laplace pressure and growth into macroscopic ...
←
→
Page content transcription
If your browser does not render page correctly, please read the page content below
Atmos. Chem. Phys., 20, 3209–3230, 2020
https://doi.org/10.5194/acp-20-3209-2020
© Author(s) 2020. This work is distributed under
the Creative Commons Attribution 4.0 License.

Technical note: Fundamental aspects of ice nucleation via pore
condensation and freezing including Laplace pressure
and growth into macroscopic ice
Claudia Marcolli
Institute for Atmospheric and Climate Science, ETH, Zurich, Switzerland

Correspondence: Claudia Marcolli (claudia.marcolli@env.ethz.ch)

Received: 23 October 2019 – Discussion started: 8 November 2019
Revised: 7 February 2020 – Accepted: 10 February 2020 – Published: 17 March 2020

Abstract. Pore condensation and freezing (PCF) is an ice nu-        tical thickness and vertical extent depending on the atmo-
cleation mechanism that explains ice formation at low ice su-       spheric conditions and their formation mechanism (Kärcher,
persaturation. It assumes that liquid water condenses in pores      2017; Kienast-Sjögren et al., 2016). Cirrus may form as out-
of solid aerosol particles below water saturation, as described     flow from convective or frontal clouds or in situ when ris-
by the Kelvin equation, followed by homogeneous ice nucle-          ing air parcels humidify while cooling (Krämer et al., 2016;
ation when temperatures are below about 235 K or immer-             Hartmann et al., 2018). Below the homogeneous ice nucle-
sion freezing at higher temperatures, in case the pores contain     ation threshold (HNT) at about 235 K, they can form through
active sites that induce ice nucleation. Porewater is under ten-    homogeneous ice nucleation (IN) in diluting liquid aerosol
sion (negative pressure) below water saturation as described        particles at relatively high ice supersaturation along the ho-
by the Young–Laplace equation. This negative pressure af-           mogeneous freezing line of solution droplets (Koop et al.,
fects the ice nucleation rates and the stability of the pore ice.   2000) or heterogeneously at lower ice supersaturation aided
Here, pressure-dependent parameterizations of classical nu-         by ice nucleating particles (INPs), which may induce freez-
cleation theory are developed to quantify the increase in ho-       ing through immersion nucleation when coated with water-
mogeneous ice nucleation rates as a function of tension and         soluble material (Kärcher and Lohmann, 2003; Kuebbeler et
to assess the critical diameter of pores that is required to ac-    al., 2014). Marcolli (2014) proposed that, in the absence of
commodate ice at negative pressures. Growth of ice out of the       a coating, the prevailing mechanism of ice formation below
pore into a macroscopic ice crystal requires ice supersatura-       water saturation is pore condensation and freezing (PCF). In
tion. This supersaturation as a function of the pore opening        PCF water that condensed in porous features of solid parti-
width is derived, assuming that the ice phase first grows as        cles freezes and grows out of pores to form ice crystals. In-
a spherical cap on top of the pore opening before it starts to      deed, most solid aerosol particles exhibit irregular surfaces
expand laterally on the particle surface into a macroscopic         with porous features such as cavities, slits, trenches, steps,
ice crystal.                                                        and interstices between aggregated particles where liquid wa-
                                                                    ter can condense by capillary condensation below water satu-
                                                                    ration as described by the Kelvin equation. For temperatures
                                                                    below the HNT, porewater freezes homogeneously and may
1   Introduction                                                    evolve into a macroscopic ice crystal by depositional growth.
                                                                    An indication for PCF is a distinct, almost step-like increase
Cirrus are high-altitude ice clouds that influence the Earth’s      in the ice fraction below water saturation for temperatures
climate by reflecting incoming solar short-wave radiation and       below the HNT as compared to temperatures above it (Welti
regulating long-wave emissions to space, resulting in a net         et al., 2014; Marcolli, 2014, 2017a). Such a jump in IN activ-
warming effect (Stephens et al., 1990; Lohmann et al., 2008;        ity cannot be explained by applying classical nucleation the-
Kärcher, 2017; Matus and l’Ecuyer, 2017). They vary in op-          ory (CNT) to deposition nucleation, assuming ice nucleation

Published by Copernicus Publications on behalf of the European Geosciences Union.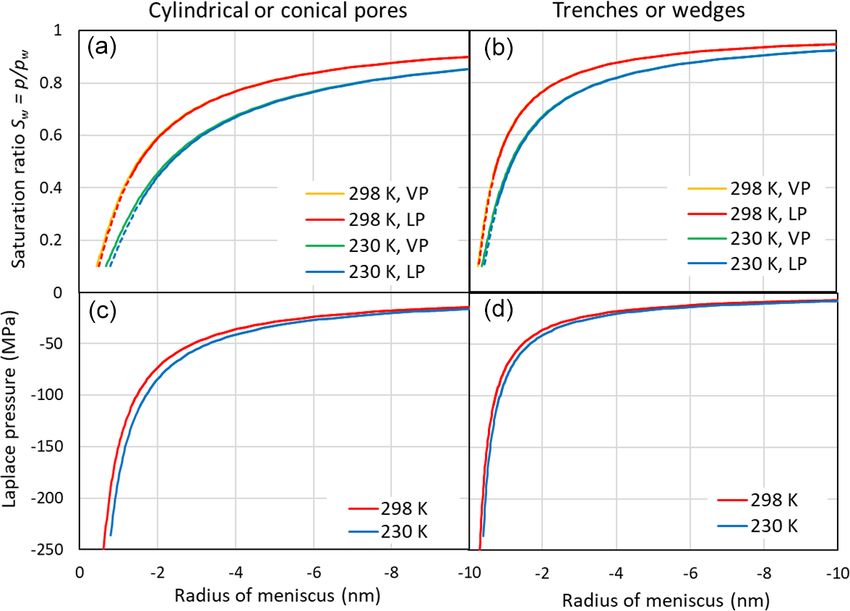
3210                                                                C. Marcolli: Fundamental aspects of ice nucleation via PCF

by deposition of water vapour with no liquid phase involved           tion, with a wide pore opening enabling ice growth out of the
(Welti et al., 2014; David et al., 2019a). A distinct increase in     pore as soon as ice saturation is exceeded.
ice fraction below the HNT has been observed for different                As an illustration of PCF in conical or wedge-shaped
particle types with inherent porosity. These include clay min-        pores, Fig. 1 depicts the atmospheric scenario of continu-
erals with slits and trenches at particle edges (Marcolli et al.,     ously increasing RH due to lifting of an air parcel. The pore
2014, 2017a; Wagner et al., 2016; Wang et al., 2016; David et         surface is supposed to be wettable by liquid water but ex-
al., 2019a), mesoporous silica particles and zeolites (Wagner         hibits no ice nucleation activity. At low RH, a water layer
et al., 2016; David et al., 2019a, b), soot particles consisting      forms on the pore surface and some liquid water condenses
of aggregated primary particles (Wagner et al., 2016; Mahrt           at the bottom of the pore (step 1 in Fig. 1). The porewater
et al., 2018, 2020; Nichman et al., 2019), porous glassy and          remains liquid as its volume is too small to host a critical ice
crystallized particles (Wagner et al., 2012, 2014; Adler et al.,      embryo. When RH increases, more water condenses (2) until
2013), and coal fly ash particles (Umo et al., 2019).                 the water volume becomes large enough to freeze. Because
   The role of pores for ice formation below water saturation         the water is under high tension, ice nucleation is expected
has further been confirmed in microscopy studies of ice nu-           to occur readily once the volume suffices to host the criti-
cleation as ice crystals always formed at steps and imperfec-         cal embryo (3). Ice nucleation is immediately followed by
tions where water may condense (Zettlemoyer et al., 1961;             ice growth from the vapour phase (4), because at the same
Wang et al., 2016; Kiselev et al., 2016; Pach and Verda-              RH, ice is able to fill wider pores than water. As RH further
guer, 2019). Moreover, PCF has been directly observed for             increases, ice fills the pore more and more. Pores with nar-
organic and water vapour condensing in wedge-shaped pock-             row openings are completely filled well below ice saturation,
ets on mica surfaces followed by crystallization and growth           while at ice saturation, pores of any widths are completely
out of the confinement (Christenson, 2001, 2013; Kovács               filled (5). Once ice saturation is exceeded, a spherical cap
and Christenson, 2012; Kovács et al., 2012; Campbell et al.,          starts to grow on top of the pore opening (6), and, when the
2017; Campbell and Christenson, 2018).                                angle of the cap has reached the critical value, further ice
   The theoretical basis for PCF was established already by           growth is unrestricted (7) and the typical ice habit develops
Fukuta (1966), however, without the experimental data avail-          (8). In the following, each of these steps will be analysed in
able to constrain the relevant conditions. Here, the different        detail and parameterizations to calculate pore filling, ice nu-
steps involved in PCF are analysed, drawing from experi-              cleation, and ice growth out of the pores will be given.
mental data that have become available in the meantime. The
conditions for pore filling, the stability of pore ice depend-
ing on temperature and pore width, and ice nucleation rates           3   Capillary condensation in pores
are derived, taking the effect of tension within pores into ac-
                                                                      In the atmosphere, pores of aerosol particles fill and empty
count. In addition to the energy barrier associated with ice
                                                                      in response to changes in ambient RH as the air cools
nucleation, previous studies have invoked a second energy
                                                                      and warms. The Kelvin equation describes the equilibrium
barrier for ice growth out of pores (Page and Sear, 2006;
                                                                      vapour pressure over curved surfaces and can be used to cal-
Campbell and Christenson, 2018; Koop, 2017). Here, the
                                                                      culate RH of pore filling by capillary condensation. It re-
conditions for an energy-barrier-free ice growth out of pores
                                                                      lies on the Young–Laplace equation that quantifies the pres-
as a function of pore opening diameter and ice supersatura-
                                                                      sure in liquids with curved surfaces (see Appendix A2 for a
tion are derived. While the focus of most studies so far has
                                                                      derivation of the Kelvin equation). Capillary condensed wa-
been on cylindrical pores, this technical note broadens the
                                                                      ter forms a meniscus within pores as illustrated in Fig. 2c–e.
scope to trenches, wedges, and conical pores.
                                                                      Solving the Kelvin equation for the radius of the meniscus of
                                                                      a cylindrical or conical pore, rm (T ), yields
2   Atmospheric scenario of PCF                                                   2γvw (T )vw (T , P0 )
                                                                      rm (T ) =                         .                             (1)
                                                                                    kT ln pw(Tp,P )
                                                                                                  0
PCF can occur in pores of different geometries. Cylindrical
pores and trenches fill completely at the relative humidity           Here, γvw (T ) is the surface tension of the vapour–water in-
(RH) of pore filling. In the case of pores with diameters of          terface, vw (T , P0 ) is the molecular volume of liquid wa-
only a few nanometres, filling and freezing even occur below          ter at standard pressure (P0 = 0.1 MPa), k is the Boltzmann
ice saturation. David et al. (2019a) have shown that growth           constant, and T is the absolute temperature. Finally, Sw =
                                                                          p
of ice out of such narrow pores requires high ice supersatura-        pw(T ,P0 ) denotes the saturation ratio, with pw (T , P0 ) being the
tion when they are isolated. However, when they are closely           equilibrium vapour pressure above the flat water surface and
spaced, bridging of ice caps growing out of the pores greatly         p the one above the curved surface. From Eq. (1) it becomes
reduces the barrier for macroscopic ice growth. Conversely,           clear that the meniscus curvature increases with decreasing
conical and wedge-shaped pores combine the narrow bot-                RH. Moreover, the radius rm (T ) takes negative values for
tom for water condensation and freezing below ice satura-             Sw < 1, indicating a concave curvature of the meniscus.

Atmos. Chem. Phys., 20, 3209–3230, 2020                                                   www.atmos-chem-phys.net/20/3209/2020/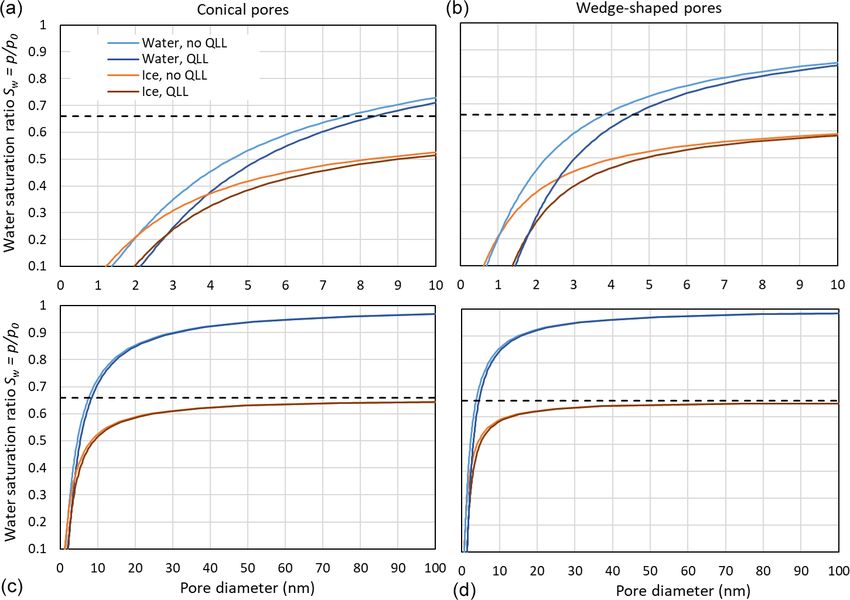
C. Marcolli: Fundamental aspects of ice nucleation via PCF                                                                                3211

Figure 1. Pore condensation and freezing in conical or wedge-shaped pores (brown) assuming continuously increasing RH (red line). The
pore is assumed to be covered with a quasi-liquid layer (QLL) of width t (darker blue) already at low RH. Free water (lighter blue) collects
in pores and freezes to ice (white) that further grows within the pore. At ice saturation (dashed black horizontal line), the pore is completely
filled with ice.

                                                                          Here τ = 1 − T /Tc is the dimensionless distance from the
                                                                          critical temperature Tc = 647.096 K, µ = 1.256 is a univer-
                                                                          sal critical exponent, coefficients B and b have values of
                                                                          0.2358 Nm−1 and −0.625, respectively, and γvw (T ) is given
                                                                          in units of J m−2 .
                                                                             The dependence of the surface tension on curvature and
                                                                          pressure as described by the Tolman length, δ, is believed
                                                                          to become relevant for strong curvatures (Schmelzer et al.,
                                                                          1996; Kalová and Mareš, 2015). However, the Tolman length
Figure 2. Illustration of pore shapes and pore filling: panel (a)         for water and its temperature dependence are still debated.
shows an empty conical pore with diameter Dp and panel (b) an             Recently, Kim et al. (2018) determined experimentally the
empty wedge-shaped pore with a width D1 and a length D2 = ∞.              Tolman length to be δ = 0.21 ± 0.05 nm, suggesting that the
Panels (c) to (e) show pore condensation with increasing radius           curvature dependence of the surface tension becomes rel-
of the meniscus for a conical or wedge-shaped pore assuming               evant for pore diameters below 3 nm. However, modelling
complete wetting (θws = 0◦ ). The radius of meniscus in a coni-           studies yield large discrepancies in its magnitude and sign
cal or cylindrical pore is denoted rm and the radius of meniscus          (Malek et al., 2019), and so it is not implemented in a param-
in a wedge-shaped pore or trench is denoted r1 = D1 /2, while
                                                                          eterization here.
r2 = D2 = ∞ (not shown).
                                                                             The molecular volume of water depends on temperature
                                                                          and pressure. However, the Kelvin equation in its classical
   For wedge-shaped pores or trenches, the pressure differ-               form makes the simplification to neglect the pressure depen-
ence across the interface between the vapour and the liq-                 dence (see Appendix A2). For consistency, the parameteri-
uid phase is described by the Young–Laplace equation in                   zation of the molecular volume for use in Eq. (1) includes
its general form (Eq. A7) with two principal axes of cur-                 temperature dependence at standard pressure (P0 = 0.1 MPa)
vatures, r1 and r2 . As illustrated in Fig. 2b, r2 , the radius           and does not include a pressure-dependent density:
of curvature along the trench or wedge is assumed infinite                                      Mw
(r2 = ∞). Therefore, the Kelvin effect just depends on the                vw (T , P0 ) =                   ,                                (4)
                                                                                           Na ρw (T , P0 )
radius of curvature r1 . As a function of the saturation ratio
Sw = p/pw (T , P0 ), it takes the form                                    where Mw is the molecular mass of water, Na is the Avo-
                                                                          gadro constant, and ρw (T , P0 ) is the temperature-dependent
            γvw (T )vw (T , P0 )                                          density at standard pressure as parameterized in Eq. (A1).
r1 (T ) =                        .                               (2)
             kT ln pw (Tp,P0 )                                              Conical pores are filled up to the diameter Dp (see Fig. 2),
                                                                          which equals
The temperature dependence of the surface tension of liq-
uid water can be calculated using the IAPWS (International                Dp = −2rm (T ) cos θws ,                                          (5)
Association for the Properties of Water and Steam) parame-
terization (Hrubý et al., 2014; Vinš et al., 2015):                       where θws is the contact angle of water on the pore sur-
                                                                          face, influencing the condensation of water and ultimately
γvw (T ) = Bτ µ (1 + bτ ) .                                      (3)      ice formation via PCF (Fukuta, 1966; David et al., 2019b).

www.atmos-chem-phys.net/20/3209/2020/                                                         Atmos. Chem. Phys., 20, 3209–3230, 2020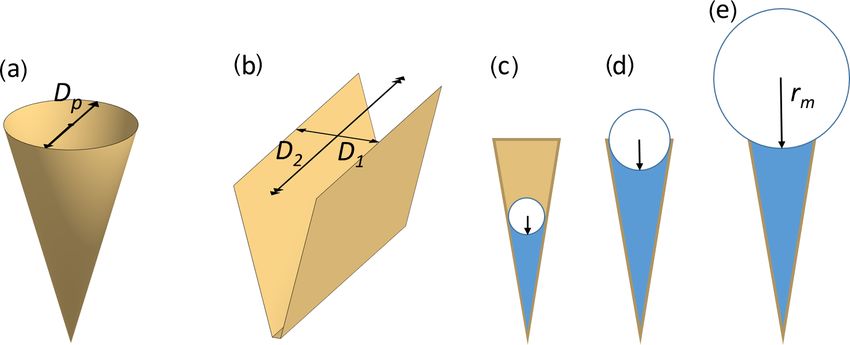
3212                                                               C. Marcolli: Fundamental aspects of ice nucleation via PCF

Cylindrical pores completely fill at the critical saturation ra-
tio Sc when Eq. (5) is fulfilled. In case of perfect wetting
(θws = 0◦ ), the pore radius corresponds to the radius of the
water meniscus. As the ambient humidity increases above
the value of complete pore filling, the curvature of the menis-
cus decreases (i.e. the curvature radius increases as shown in
Fig. 2, panels c–e) and reaches infinity at water saturation.
   According to the Young–Laplace equation, which de-
scribes the pressure difference 1P across the vapour–water
interface, a concave meniscus at the pore opening implies a
negative pressure of the water within the pore, yielding, for
conical or cylindrical pores,

                      2γvw (T )
1P = P − P0 =                   ,                           (6)
                       rm (T )
where P is the curvature-dependent pressure within the pore-         Figure 3. (a, b) Saturation ratio as a function of the meniscus radius
water and P0 is the standard pressure (0.1 MPa). For at-             of cylindrical or conical pores (rm , a, c) and trenches or wedges
mospheric applications, this pressure difference can be ex-          (r1 , b, d) at 298 and 230 K. Saturation ratios are given neglecting
pressed as a function of the water saturation ratio, Sw =            the effect of negative pressure on the molecular volume of water
p/pw (T , P0 ), as                                                   (indicated as VP in the legend and calculated using Eqs. 1 and 2)
                                                                     and accounting for the Laplace pressure exerted on the porewater
        kT ln pw(Tp,P                                                (indicated as LP and calculated using Eqs. 8 and 10). The dashed
                        0)                                           portions of the red and blue lines indicate the extrapolation of the
1P =                         .                              (7)
          vw (T , P )                                                molecular volume to strongly negative pressures as shown in the
                                                                     lower panels. (c, d) Laplace pressure as a function of the radius of
Thus, saturation ratios Sw < 1 yield negative pressure for wa-       the meniscus.
ter within the pore.
   The Kelvin equation given in Eq. (1) assumes that the
molecular volume of liquid water keeps the value at stan-            panels) for two temperatures. The pressure within the liq-
dard pressure (vw (T , P0 )), which implies incompressibility        uid is calculated using Eqs. (7) and (9) for cylindrical and
(i.e. κ(T ) = 0; see Appendix A2). Assuming constant com-            wedge-shaped pores, respectively. With increasing concave
pressibility of water instead, the pressure dependence of the        curvature (rm → 0), the porewater is under increasing ten-
molecular volume is taken into account, so that Eq. (1) be-          sion. Conical and wedge-shaped pores fill gradually with wa-
comes (reformulating Eq. A17 of Appendix A2)                         ter as Sw increases. In the case of cylindrical pores, capillary
                                                                     condensation occurs when the pore diameter equals Dp =
                γvw (T ) (vw (T , P ) + vw (T , P0 ))                −2rm (T , P ) cos θws . Similarly, in the case of trenches, pore
rm (T , P ) =                                         .     (8)
                           kT ln pw(Tp,P )                           filling occurs when the slit width equals −r1 (T , P ) cos θws .
                                        0
                                                                     At the RH of pore filling, the tension within the porewater is
A parameterization of the pressure-dependent molecular vol-          at its critical value for bubble nucleation (Blander and Katz,
ume vw (T , P ) is given in Eqs. (A1)–(A5).                          1975; Marcolli, 2017b) and decreases when RH increases un-
  The Laplace pressure of water within wedges and trenches           til the tension vanishes at water saturation. Taking the pres-
can be formulated as                                                 sure dependence of the molecular volume into account (using
                                                                     Eqs. 8 and 10) results in a shift of the saturation ratio that is
        kT ln pw(Tp,P
                        0)                                           negligible given the uncertainties in the parameterization and
1P =                         .                              (9)
         2vw (T , P )                                                compared with the temperature dependence (see Fig. 3).

When including the pressure dependence of the molecular
volume for the curvature of the meniscus in trenches and             4     Freezing of porewater
wedges, Eq. (2) becomes
                                                                     4.1    Homogeneous ice nucleation in bulk water
                γvw (T ) (vw (T , P ) + vw (T , P0 ))
r1 (T , P ) =                                         .    (10)
                          2kT ln pw(Tp,P )                           CNT formulates the Gibbs free energy to create ice from wa-
                                         0
                                                                     ter as the sum of a volume term, accounting for the energy re-
Figure 3 illustrates the saturation ratio, Sw , above concave        leased when a water molecule becomes part of the ice phase,
water surfaces (top panels) and the Laplace pressure within          and a surface term, accounting for the energy needed to build
the liquid as a function of the meniscus curvature (bottom           up the interface between ice and water. To compensate the

Atmos. Chem. Phys., 20, 3209–3230, 2020                                                 www.atmos-chem-phys.net/20/3209/2020/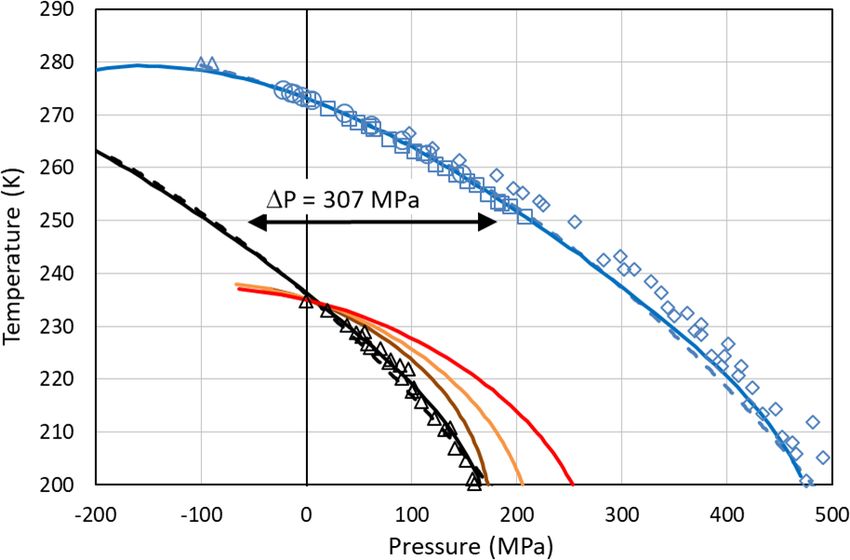
C. Marcolli: Fundamental aspects of ice nucleation via PCF                                                                      3213

energy invested in the buildup of the interface, an ice em-         Thus, the change in Gibbs free energy upon freezing can be
bryo needs a critical size to become stable (e.g. Lohmann           formulated as a function of the equilibrium vapour pressures
et al., 2016). Since the surface-to-volume ratio is least for a     of water and ice, yielding at standard pressure
sphere, CNT assumes spherical morphology of the emerging
ice phase (Fukuta, 1966). While spherical morphology may            1G (T , P0 ) = 4π r 2 γiw (T , P0 )
seem inappropriate considering the distinct faces of ice crys-              4π r 3

                                                                                               pw (T , P0 )

tals representing the lattice symmetry, the spherical shape          −                kT ln                   .                  (17)
                                                                        3vi (T , P0 )          pi (T , P0 )
of ice embryos evolving in molecular dynamics simulations
supports this assumption (Zaragoza et al., 2015).                   Parameterizations of the equilibrium vapour pressures over a
   The Gibbs free energy to form a spherical ice cluster with       flat surface of water and ice at standard pressure are given in
radius r within the liquid phase depends on T and P :               Murphy and Koop (2005):

                                         4π r 3                                                 6763.22
1G(T , P ) = 4π r 2 γiw (T , P ) +                  1µiw .   (11)   ln(pw (T , P0 )) ≈ 54.842763 −        − 4.210 ln (T )
                                       3vi (T , P )                                                T
                                                                      + 0.000367T + tanh (0.0415 (T − 218.8))
Here, γiw (T , P ) is the interfacial tension between ice and wa-
                                                                                1331.22
ter, r is the radius of the emerging ice embryo, νi (T , P ) is       (53.878 −         − 9.44523 ln (T ) + 0.014025T ), (18)
the molecular volume of water in the ice phase, and 1µiw =                         T
µi (T , P ) − µw (T , P ) is the difference between the chemical    and
potentials of ice and liquid water, respectively.
   The critical radius rc (T , P ) of an ice embryo is reached                                    5723.265
                                                                    ln(pih (T , P0 )) = 9.550426 −
when growth and shrinkage both lead to a decrease in                                                 T
the Gibbs free energy and can be determined by setting                 + 3.53068 ln (T ) − 0.00728332T .                         (19)
δ1G/δr = 0:
                                                                    Equation (19) applies to hexagonal ice (for T > 110 K),
              2γiw (T , P )vi (T , P )                              which is the stable ice phase at standard pressure (Murphy
rc (T , P ) =                          .                     (12)
                    −1µiw                                           and Koop, 2005). However, there is evidence that at low tem-
                                                                    peratures metastable stacking disordered ice nucleates with
Accordingly, the Gibbs free energy barrier of homogeneous           stacking sequences representative of cubic (ABCABC) and
ice formation within the supercooled liquid water phase is          hexagonal ice (ABABAB) (Kuhs et al., 2012; Koop and Mur-
given by                                                            ray, 2016; Hudait and Molinero, 2016; Amaya et al., 2017).
                                                                    The transition from hexagonal to stacking disordered ice in-
                  16π γiw (T , P )3 vi (T , P )2                    volves an enthalpy increase of 1Gh→sd = 155 ± 30 J mol−1
1Gc (T , P ) =                                   .           (13)
                        3(−1µiw )2                                  between 180 and 190 K (Shilling et al., 2006). Using this
                                                                    value to obtain the equilibrium vapour pressure of stacking
4.1.1    Standard pressure
                                                                    disordered ice yields (Murray et al., 2010; Nĕmec, 2013;
                                                                    Laksmono et al., 2015; Koop and Murray, 2016)
At standard pressure, the chemical potentials of liquid water
and ice as a function of temperature are given as
                                                                                                        1Gh→sd

                                                                    psd (T , P0 ) = pih (T , P0 ) exp            .           (20)
µw (T , P0 ) = µw (T0 , P0 ) + kT ln(pw (T , P0 )),          (14)                                        RT

                                                                    The interfacial tension between supercooled liquid water and
and                                                                 the emerging ice phase (γiw (T , P0 )) is a key parameter in
                                                                    CNT but poorly constrained by experiments (Ickes et al.,
µi (T , P0 ) = µi (T0 , P0 ) + kT ln(pi (T , P0 )).          (15)
                                                                    2015). Experimental values are limited to 273.15 K when
                                                                    hexagonal ice and liquid water are in thermodynamic equi-
Here, pw (T , P0 ) and pi (T , P0 ) are the equilibrium vapour
                                                                    librium. Since water becomes more ice-like with decreasing
pressures of liquid water and ice, respectively. At standard
                                                                    temperature, γiw (T , P0 ) is expected to decrease. Parameteri-
pressure µi (T , P0 ) = µw (T , P0 ) when T0 = 273.15 K. For
                                                                    zations of CNT differ in the value of γiw (T , P0 ) at the melting
T < 273.15 K, the chemical potential decreases when ice
                                                                    temperature and its temperature dependence (see Ickes et al.,
forms:
                                                                    2015, and Appendix B).
1µiw = µi (T , P0 ) − µw (T , P0 )
                                                                    4.1.2   The role of pressure
   = kT ln(pi (T , P0 ) − kT ln(pw (T , P0 )

               pw (T , P0 )                                         The stability and nucleation rate of ice both depend on pres-
   = −kT ln                   .                              (16)   sure. Since water condensing within pores at Sw < 1 is under
               pi (T , P0 )

www.atmos-chem-phys.net/20/3209/2020/                                                 Atmos. Chem. Phys., 20, 3209–3230, 2020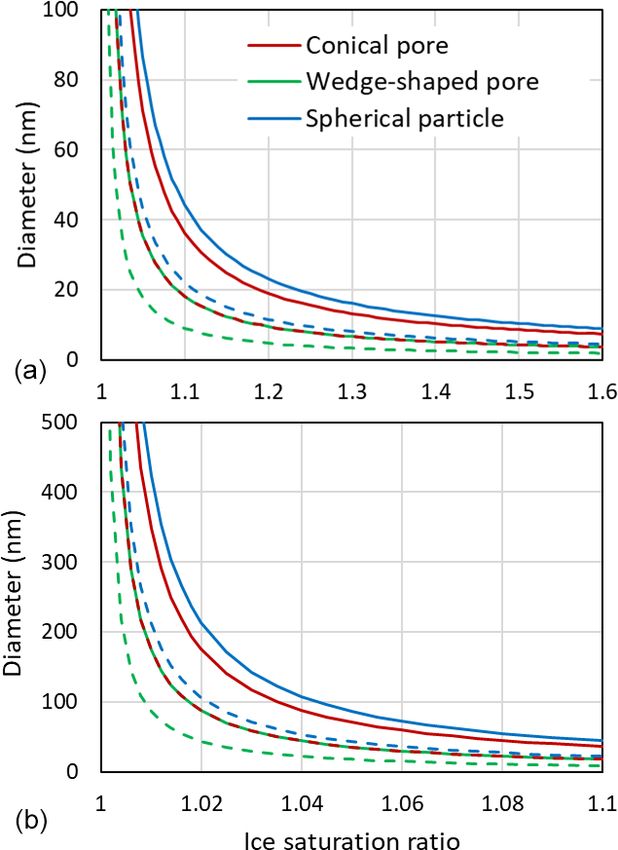
3214                                                                 C. Marcolli: Fundamental aspects of ice nucleation via PCF

tension (negative pressure), the impact of pressure needs to
be taken into account. Pressure affects the chemical poten-
tials of liquid water and ice. The chemical potential of liq-
uid water as a function of pressure P can be formulated as
(Nĕmec, 2013)
µw (T , P ) = µw (T , P0 )
                 vw (T , P ) + vw (T , P0 )
   + (P − P0 )                              ,                (21)
                             2
where µw (T , P0 ) is the chemical potential at standard pres-
sure. The parameterizations of the molecular volume of liq-
uid water at standard pressure, vw (T , P0 ), and including pres-
sure dependence, vw (T , P ), are given in Appendix A1 as
Eqs. (A1)–(A5).
   Since the volume of ice I , which includes hexagonal (Ih ),         Figure 4. Pressure dependence of melting (blue) and freezing
cubic (Ic ), and stacking-disordered ice (Isd ) hardly changes         (black) temperatures of ice I . Melting point measurements of ice I
under pressure, the pressure dependence of µi (T , P ) can be          are from Kanno et al. (1975) (blue squares), Mishima (1996) (blue
                                                                       diamonds), Henderson and Speedy (1987) (blue circles), and Roed-
formulated as (Nĕmec, 2013):
                                                                       der (1967) (blue triangles). For simplicity, melting data of other ice
µi (T , P ) = µi (T , P0 ) + (P − P0 ) vi (T , P0 ) .        (22)      polymorphs are not shown. The blue solid line is the melting curve
                                                                       calculated by setting Eq. (24) to zero. The dashed blue line is a fit to
Thus, the chemical potential difference between ice I and              the measured melting temperatures (blue symbols) using the equa-
water is given as                                                      tion given in Marcolli (2017b): T (K) = 557.2 − 273 exp((300 +
                                                                       P (MPa))2 /2 270 000). Freezing temperatures of ice I (black tri-
1µiw = µi (T , P ) − µw (T , P ) = µi (T , P0 )                        angles) are from Kanno et al. (1975). The black solid and dashed
   − µw (T , P0 ) + (P − P0 ) vi (T , P0 )                             lines represent a homogeneous ice nucleation rate of 108 cm−3 s−1
                                                                       obtained by shifting the blue curves by 1P = 307 MPa to lower
                vw (T , P ) + vw (T , P0 )                             values. Red line: Ick15 parameterization with pressure-dependent
   − (P − P0 )                             .                 (23)
                            2                                          chemical potential (1µiw of Eq. 24); all other parameters without
Inserting Eq. (16) yields                                              pressure dependence. Orange and brown lines: Mr10 parameteriza-
                                                                       tion with pressure-dependent chemical potential (1µiw of Eq. 24)
1µiw = (P − P0 ) vi (T , P0 ) − (P − P0 )                              with n = 0.3 (brown) and n = 0.97 (orange); all other parameters
                                                                     without pressure dependence. Fully pressure-dependent Ick15 and
 vw (T , P ) + vw (T , P0 )           pw (T , P0 )                     Mr10 parameterizations were optimized to overlay with the experi-
                            − kT ln                  .       (24)
             2                        pi (T , P0 )                     mental freezing data and are not shown here.
Inserting Eq. (24) into Eqs. (12) and (13) yields pressure-
dependent formulations of the critical radius and the Gibbs
free energy barrier, respectively, for homogeneous nucleation          the melting curve by 1P = 307 MPa to lower pressures as
of pore ice.                                                           shown in Fig. 4 (Koop et al. 2000; Marcolli, 2017b). To de-
   Setting the chemical potential difference in Eq. (24) to            scribe this freezing point depression using CNT, Eq. (24) is
zero (1µiw = 0) provides the condition for the pressure-               inserted into the parameterization of ice nucleation rates to
dependent melting curve of ice, which can be evaluated using           account for the dependence of the chemical potentials on ab-
the parameterizations of vi (T , P0 ) and vw (T , P ) given in Ap-     solute pressure. Since CNT parameterizations differ in their
pendix A1 and the equilibrium vapour pressure of hexagonal             formulation of ice nucleation rates, two different parame-
ice, pih (T , P0 ). The excellent agreement between this evalua-       terizations, namely the ones by Murray et al. (2010; here-
tion (solid blue line) and the measured melting point depres-          after referred to as the Mr10 parameterization) and Ickes et
sion of hexagonal ice (blue symbols) shown in Fig. 4 con-              al. (2015; hereafter referred to as the Ick15 parameteriza-
firms the validity of Eq. (24) and the parameterizations of the        tion), are used here (see Appendix B for their descriptions).
molecular volumes of ice and water given in Appendix A1.               Figure 4 shows that inserting the pressure-dependent formu-
Since the molecular volume of ice I is larger than the one             lation of 1µiw in these CNT parameterizations decreases
of liquid water, increasing pressure decreases the melting             the freezing temperatures with increasing pressure. However,
temperature and applying tension increases it. The calculated          the calculated decrease does not describe the experimental
melting temperature reaches a maximum for P ≈ −170 MPa                 data correctly. This is expected since the chemical poten-
with T ≈ 279 K.                                                        tials are not the only pressure-dependent quantities in the
   Along with the melting point depression, there is a freez-          parameterization of ice nucleation rates. To achieve agree-
ing point depression that can be described as a shift of               ment with the measured freezing temperatures, the pressure

Atmos. Chem. Phys., 20, 3209–3230, 2020                                                   www.atmos-chem-phys.net/20/3209/2020/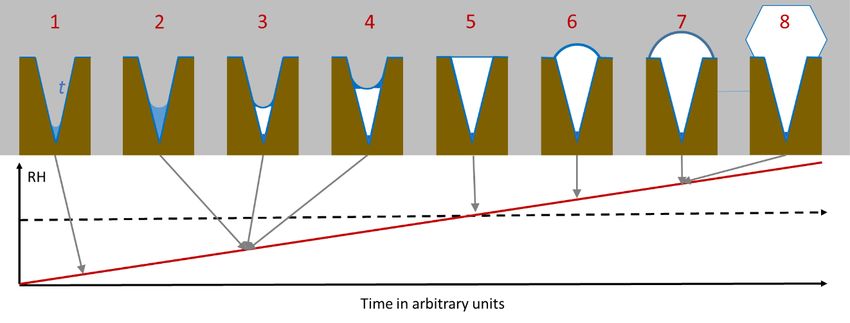
C. Marcolli: Fundamental aspects of ice nucleation via PCF                                                                 3215

dependence of the other parameters also needs to be consid-          In Fig. 6, 1G(T , P ) is shown as a function of a + r for
ered. Namely, in the Ick15 parameterization, the diffusion-       different pore widths using the Ick15 parameterization at
activation energy depends on water diffusivity, which is a        230 K and P0 = 0.1 MPa. The black dashed line indicates
pressure-sensitive parameter. Therefore, its parameterization     1G(230 K, P0 ) for the growth of a cylindrical ice embryo,
needs to be extended to include pressure dependence. More-        starting from a thin disk with rc = Dp /2 + t, for compari-
over, the pressure-dependent formulation of the interfacial       son. The constant positive value of 1.68×10⁻¹⁹ J arises from
tension is adjusted to obtain agreement with the experimental     the contribution of the two ends of the cylinder to the Gibbs
freezing data (see Appendix B1). For the Mr10 parameteri-         free energy. If these were neglected, the negative Gibbs en-
zation, the interfacial tension is extended to include pressure   ergy from the volume term would exactly compensate the
dependence and adjusted to obtain agreement with the ex-          positive contribution from the surface of the cylinder man-
perimental data, while the pressure dependence of all other       tle, resulting in 1G(T , P ) = 0 J. The black solid line rep-
parameters is neglected (see Appendix B2).                        resents ice nucleation in bulk water and is calculated as-
                                                                  suming growth as a sphere using Eq. (26) with a = 0. It
4.2   Stability of ice within pores                               shows a steep decrease in 1G(230 K, P0 ) once the energy
                                                                  barrier of 1.12 × 10⁻¹⁹ J at the critical embryo size of rc =
Freezing of porewater may occur when ice grows into the           1.095 nm is overcome and reaches 1G(230 K, P0 ) = 0 J for
pore from the outside or when ice nucleates within the pore.      rs = 1.643 nm. Thus, a spherical pore or cage needs to be
For ice to form in confinement, the dimensions need to be         clearly larger than the critical size to host ice permanently.
large enough to host the critical embryo. For mesoporous             When the width of a cylindrical pore is just sufficient to
silica, experiments have revealed the existence of a quasi-       host the critical embryo, i.e. r = rc = 1.095 nm, the red line
liquid layer (QLL) between ice and the pore surface with          in Fig. 6 is obtained by first increasing r until r = rc and
thickness t of 0.38 to 0.6 nm (Schreiber et al., 2001; Jähn-      then increasing a while keeping r = rc constant in Eq. (26).
ert et al., 2008; Marcolli, 2014; Morishige, 2018). In order      It shows a constant Gibbs free energy, which remains at the
to incorporate an embryo of critical radius, a cylindrical pore   critical value of 1G(230 K, P0 ) = 1.12 × 10⁻¹⁹ J, which is
therefore needs a diameter Dp = 2rc (T , P ) + 2t (see Fig. 5     well below the Gibbs free energy of an ice cylinder within the
for illustration). The presence of a QLL adjacent to the pore     pore, indicating that rounded caps are energetically favoured
wall provides an interface similar to bulk water such that the    compared with flat ends. If the pore is slightly wider than
interfacial tension between the QLL and the ice embryo can        the critical size, pore ice becomes stable. The green line de-
be assumed the same as between bulk water and ice.                scribes the case of an ice embryo that has a spherical shape
   An ice embryo of critical size is metastable since             of r = 1.1 nm when it reaches the QLL and then starts to
1G(T , P ) ≥ 0. To become stable, it needs to grow fur-           grow in length as a cylinder with half spheres at its ends.
ther until 1G(T , P ) ≤ 0. In the case of spherical growth,       The Gibbs free energy for this pore drops below zero at
1G(T , P ) = 0 is reached when the embryo has a radius rs         a + r = 152 nm, i.e. requiring a pore of at least 304 nm in
of                                                                length to become stable. The blue line describes ice growth
                3γiw (T , P )vi (T , P )                          within a slightly wider pore, such that the ice embryo has
rs (T , P ) =                            .                (25)    grown to a sphere of r = 1.2 nm when it reaches the QLL.
                      −1µiw
                                                                  Since for this pore width, the emerging ice embryo has over-
While ice is free to grow spherically in bulk water, growth       come the energy barrier clearly before it has reached the pore
in pores is constrained by the pore dimensions. In cylindrical    wall, 1G(230 K, P0 ) continuously decreases during further
pores, the ice embryo grows spherically until it has reached      growth and reaches negative values already for a +r = 8 nm.
the QLL adjacent to the pore wall. For further growth, the        Hence, given that the critical radius to host a stable ice
Gibbs free energy barrier is minimized when the ice embryo        phase within a cylindrical pore is only slightly larger than
continues to grow as a cylinder with spherical caps on both       the critical embryo size, it is a good approximation to take
ends (see Fig. 5 for illustration). The Gibbs free energy for     Dp = 2rc +2t as the pore diameter required to host ice stably
such growth is given as                                           within the pore. Note that a large uncertainty in this expres-
                                                                  sion stems from t, the thickness of the QLL, which is difficult
                                                                  to measure and depends on temperature (Webber and Dore,

1G (T , P ) = γiw (T , P ) 4π r 2 + 2π ar
                                                                  2004; Webber et al., 2007).

       1µiw                 4π 3                                     Molecular dynamics simulations have shown recently that
   +               π ar 2 +    r ,                       (26)     for r ≈ rc such that 1G(T , P ) > 0, liquid water and ice co-
      vi (T , p)             3
                                                                  exist in time through oscillations between all-liquid and all-
with r = Dp /2+t equaling the maximum dimension a spher-          crystalline states (Kastelowitz and Molinero, 2018). When r
ical ice embryo can reach within the pore and a+r represent-      is slightly larger such that 1G(T , P ) < 0, all bulk water is
ing the extension of the growing ice cylinder along the pore      frozen.
as depicted in Fig. 5.

www.atmos-chem-phys.net/20/3209/2020/                                              Atmos. Chem. Phys., 20, 3209–3230, 2020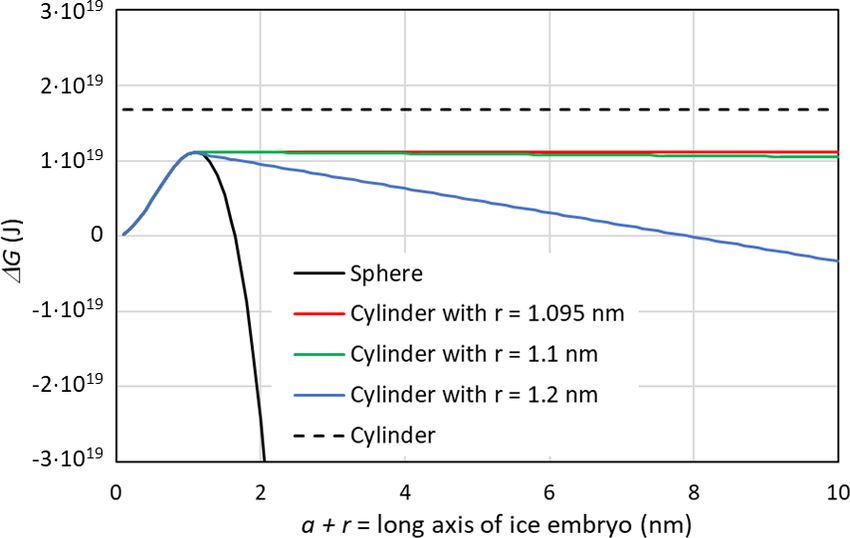
3216 C. Marcolli: Fundamental aspects of ice nucleation via PCF
Figure 5. Ice nucleation and growth within a cylindrical pore of diameter Dp = 2r + 2t, with a describing the growth along the pore axis, t
being the thickness of the QLL, and r being the maximum radius the embryo can reach perpendicular to the pore axis.
Figure 7. Dependence of the critical embryo radius on the water
Figure 6. Gibbs free energy of a growing ice embryo calculated saturation ratio at 230 K for ice nucleation within pores using Ick15
with CNT using the Ick15 parameterization for T = 230 K and (red) and Mr10 (orange: n = 0.97; brown: n = 0.3) parameteriza-
P0 = 0.1 MPa. The black solid line describes spherical growth of tions. Saturation with respect to bulk ice is indicated as the black
the ice embryo as expected in bulk water. The black dashed line dashed vertical line. The blue dashed line shows the negative pres-
gives 1G for the growth in length of a cylinder starting from a thin sure that builds up in porewater when the water saturation ratio de-
disk with radius rc = 1.095 nm. The coloured lines show 1G for creases.
growth in cylindrical pores with radii available for free water of
1.095 nm (critical value, red line), 1.1 nm (green line), and 1.2 nm
(blue line), respectively.
4.3 Homogeneous ice nucleation within porewater
Figure 7 shows that for the conditions used in Fig. 6 (Sw = Even if pores are large enough to host ice, porewater may re-
1; P = 0.1 MPa and T = 230 K), the Mr10 parameterization main liquid when ice nucleation rates are too low. Figure 8a
predicts slightly larger critical radii of 1.24 nm for n = 0.97 shows the pressure dependence of homogeneous nucleation
and rc = 1.26 nm for n = 0.3 compared to rc = 1.095 nm for rates for the Ick15 and Mr10 parameterizations (with n = 0.3
the Ick15 parameterization. This exemplifies the uncertainty and 0.97) at four different temperatures from 235 to 210 K. In
in critical radius depending on CNT parameterization. These panel (b), the nucleation rates are converted to times needed
critical sizes are applicable to ice formation within pores of to freeze a water volume corresponding to the critical em-
particles immersed in water (i.e. prepared as a slurry). The bryo size. All parameterizations predict a strong increase in
critical size for pore ice decreases with decreasing water sat- nucleation rates with negative pressure; however, they differ
uration as shown in Fig. 7. When porous particles are ex- in the degree of this increase.
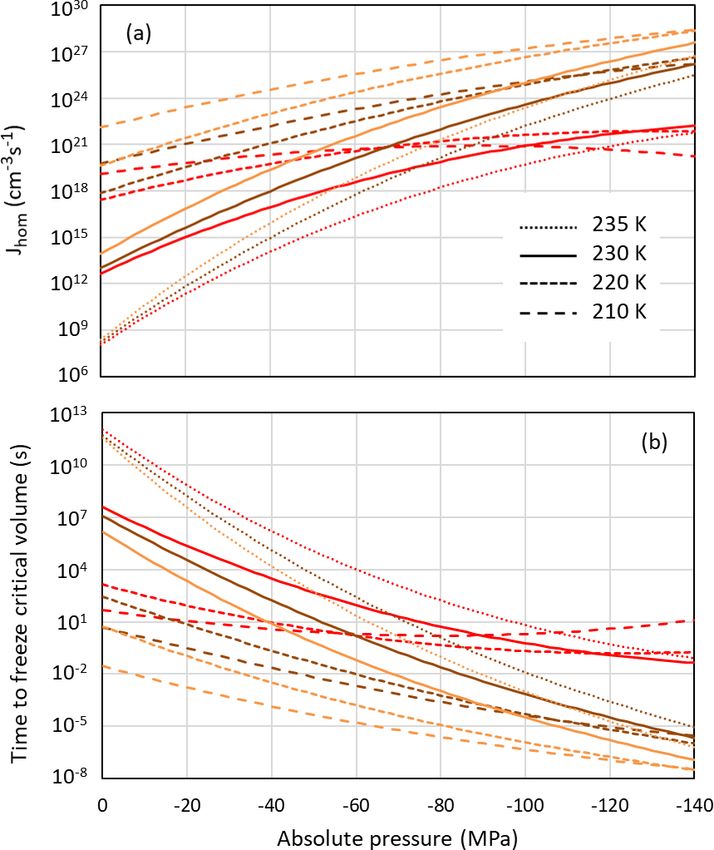
posed to air with Sw < 1, the water that condenses within the According to the Ick15 parameterization, the nucleation
pores is under negative pressure and the critical radius re- rate at 230 K at ice saturation (causing a tension of −42 MPa
quired to keep ice stable decreases. Thus, at Sw = 0.3, imply- within the porewater) is 1.34×1017 cm−3 s−1 . With this rate,
ing a pressure of −120 MPa within the porewater, the critical it takes about 0.5 h for a critical water volume to freeze. Con-
radius decreases to 0.73 nm for the Ick15 parameterization versely, in a cylindrical pore of 3.3 nm width and 500 nm
and to 0.84 nm for Mr10 with n = 0.97 and to 0.91 nm for length implying a radius r = 1.25 nm available for free water
Mr10 with n = 0.3. Thus, in very narrow pores, ice may be (assuming t ≈ 0.4 nm), freezing takes place within approx-
stable at low RH due to the negative pressure, but melts when imately 3 s. However, close to water saturation, when the
RH increases. porewater experiences ambient pressure, freezing of water
in such a pore takes almost a day, highlighting the strong
impact of pressure on ice nucleation. At 30 % RHw , which
corresponds to the pore filling RH for this pore width, the
Atmos. Chem. Phys., 20, 3209–3230, 2020 www.atmos-chem-phys.net/20/3209/2020/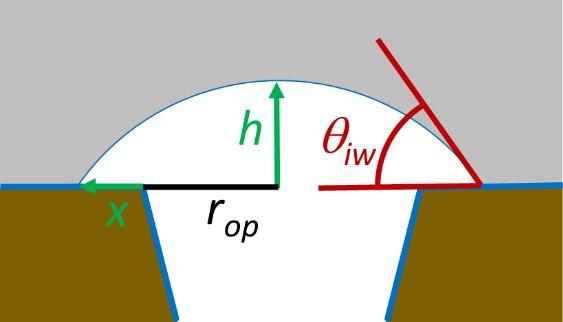
C. Marcolli: Fundamental aspects of ice nucleation via PCF                                                                           3217

                                                                        within atmospherically relevant timescales. This finding is
                                                                        indeed confirmed in freezing experiments performed with
                                                                        mesoporous silica particles with closely spaced cylindrical
                                                                        pores of 3.8 nm diameter, which grew into macroscopic ice
                                                                        crystals within about 10 s at 228 K but not at 233 K (David et
                                                                        al., 2019a). Moreover, all parameterizations predict increas-
                                                                        ing freezing rates with decreasing relative humidity, i.e. the
                                                                        higher the tension is within the porewater. Such a behaviour
                                                                        was actually observed for mesoporous silica particles with
                                                                        9.1 nm pore diameter, which manifested decreasing ice frac-
                                                                        tion with increasing RH at 233 K (David et al., 2019b).
                                                                           Above the HNT, homogeneous ice nucleation rates decline
                                                                        and nucleation sites on the pore wall are required to induce
                                                                        freezing of pore ice. Thus, freezing needs to occur in immer-
                                                                        sion mode.

                                                                        5     Ice growth from the vapour phase

                                                                        Once a critical embryo forms within a pore, freezing con-
                                                                        sumes all porewater almost instantly and further ice growth
                                                                        needs to occur by water vapour deposition. Since cylindrical
                                                                        pores and trenches completely fill with water once the RH
                                                                        of pore filling is reached, ice nucleation leads to pores com-
                                                                        pletely filled with ice. Conversely, conical pores and wedges
Figure 8. Pressure dependence of homogeneous nucleation rates (a)
                                                                        gradually fill with water such that pores are only partly filled
and the time to freeze the critical water volume for homogeneous        with ice at the instant of porewater freezing. Hence, in this
ice nucleation (b) at four different temperatures as indicated in the   case growth from the vapour phase starts already within the
legend. Ick15 is shown in red and Mr10 in orange for n = 0.97 and       pores.
in brown for n = 0.3.                                                      For growth out of the pore, the pore opening needs to be
                                                                        wide enough or pores need to be closely spaced (David et
                                                                        al., 2019a). In the following, the conditions for growth of ice
                                                                        within pores and out of pores are derived.
porewater, which is at −124 MPa, freezes within 6 × 10⁻⁵ s,
and even a critical water volume should freeze within ∼ 0.1 s.
                                                                        5.1    Ice growth within conical pores and wedges
   The Mr10 parameterization predicts similar trends, how-
ever, with a stronger increase in nucleation rates with de-             Assuming that the Kelvin effect also applies to ice, the pore
creasing temperature and increasing tension. Assuming ice               ice should form a concave meniscus at the ice–vapour in-
saturation at 230 K, a critical water volume freezes in no              terface to stabilize the ice phase with respect to evaporation
more than 2 min for the n = 0.3 parameterization and in 5 s             below ice saturation (Fukuta, 1966). Such a curvature can be
for n = 0.97, while the 500 nm long pore freezes within 0.3 s           realized through a curved QLL on top of the ice surface. Us-
(n = 0.3) and 0.01 s (n = 0.97). At water saturation, the pore-         ing the Kelvin equation to describe the equilibrium condition
water takes half a day (n = 0.3) and about an hour (n = 0.97)           of ice with respect to vapour yields the following diameter of
to freeze, while at 30 % RHw even a critical water volume               pore filling for conical pores:
should freeze immediately (within 2×10⁻⁵ s for n = 0.3 and
10−6 s for n = 0.97).                                                               −4γvi (T ) vi (T , P0 ) cos θis (T )
                                                                        Dp (T ) =                                        .            (27)
   At lower temperatures (220 and 210 K), the Ick15 param-                                  kT ln pi (Tp,P0 )
eterization predicts only a slight increase in nucleation rates
with decreasing pressure, while both Mr10 parameterizations             Here, γvi (T ) is the surface tension of ice, and θis (T ) is the
(with n = 0.3 and n = 0.97) predict higher rates than the               contact angle between ice and the pore surface. The ratio
Ick15 parameterization at ambient pressure and a stronger               p/pi (T , P0 ) yields Si , the supersaturation with respect to ice.
increase when water is under tension. These discrepancies                  In case of wedge-shaped pores, the diameter of pore filling
between parameterizations reflect that homogeneous ice nu-              is given as
cleation rates at standard pressure are not well constrained
for temperatures below 230 K. Despite these discrepancies,                          −2γvi (T ) vi (T , P0 ) cos θis (T )
                                                                        D1 (T ) =                                        .            (28)
all parameterizations agree that porewater is able to freeze                                kT ln pi (Tp,P0 )

www.atmos-chem-phys.net/20/3209/2020/                                                      Atmos. Chem. Phys., 20, 3209–3230, 2020
3218 C. Marcolli: Fundamental aspects of ice nucleation via PCF
The surface tension of ice is not well known. However, as-
suming that a QLL forms at the ice–vapour interface, an up- 2
per limit can be estimated as the sum of the surface tension 1Ggr (T , P ) = π rop + x + h2 − rop
2
γvi (T )
of water and the interfacial tension between water and ice: πh
γvi (T ) = γvw (T ) + γiw (T , P0 ) (David et al., 2019a). + π((rop + x)2 − rop
2
)γis (T ) −
6vi (T , P0 )
Assuming that surface wetting precedes capillary conden- 2 p
sation within the pore such that the whole pore surface is 3 rop + x + h2 kT ln . (30)
covered by adsorbed water when the porewater freezes, the pi (T , P0 )
contact angle θis (T ) in Eqs. (27) and (28) can be replaced Here, γis (T ) is the interfacial energy between ice and the
by the one between ice and water. Thus, the contact angle outer surface surrounding the pore, rop is the radius of the
between ice and the substrate can be substituted by the one pore opening, h is the height of the spherical cap, and x is
between ice and water: the radius increase in the base of the spherical cap to the
γvw (T ) − γiw (T , P0 ) outer surface as shown in Fig. 10. The first term on the right-
cos θiw (T ) = . (29) hand side of the equation describes the energy increase due
γvi (T )
to the increase in the ice–vapour interface, the second one
Figure 9 compares pore filling with ice and water at 230 K, is the energy increase due to the increase in the interfacial
assuming that the growing ice phase is hexagonal and us- area between ice and the outer particle surface, and the third
ing γiw (T ) from the Ick15 parameterization and γvw (T ) as is the energy decrease due to the increase in ice volume.
parameterized in Eq. (2). With these assumptions, a contact When RH exceeds ice saturation, a spherical cap forms on
angle of θiw (230 K) ≈ 55◦ results. Since Fig. 3 showed that top of the pore opening. With increasing ice supersaturation
using pressure-dependent molecular volumes has little im- Si = pih(Tp,P ) , it increases first in height h without any exten-
0
pact on pore filling; this effect is neglected here. Pore fill- sion of the cap base (x = 0) until the contact angle reaches
ing is calculated once with the assumption that the adsorbed the critical value for unlimited growth. For the assumption
water layer is involved in the curvature of the meniscus and that the outer surface is covered with an adsorbed water layer,
once assuming that it is not involved, such that its presence γis (T ) in Eq. (29) can be substituted by γiw (T , P0 ) and the
narrows the effective pore diameter by 2t. Note that the thick- contact angle for unlimited growth is given as the one be-
ness of the adsorbed water layer and the width of the QLL be- tween ice and water, θiw (T ).
tween the pore surface and ice do not need to coincide. How- The assumption that ice needs to grow to a spherical cap
ever, since both values are not well constrained, we assume with a contact angle θiw (T ) yields for cylindrical and conical
them to be the same. Figure 9 shows that for Sw > 0.25, ice is pores the following pore opening for free growth,
able to fill wider pores than liquid water. Moreover, the pore
filling extends to larger diameters for conical pores (panels a 4γvi (T ) vi (T ) sin θiw (T )
Dpfg (T ) = , (31)
and c) than for wedge-shaped pores (panels b and d), since kT ln pih (Tp,P0 )
conical pores are constrained in two dimensions and wedge-
shaped pores only in one. The width of the QLL is significant and for wedge-shaped pores and trenches,
for narrow pores (panels a and b) but loses its relevance for
2γvi (T ) vi (T ) sin θiw (T )
wide pores (panels c and d). At ice saturation, the pore diam- D1fg (T ) = . (32)
eter for filling with ice diverges to infinity, while pore filling kT ln pih (Tp,P0 )
with liquid water is still restricted to narrow pores. Thus, at
ice saturation, all pores fill with ice up to the pore opening, Figure 11 shows that large ice supersaturations are needed
while liquid water remains restricted to the narrow bottom of for growth out of a narrow pore. At Si = 1.1, conical pore
conical and wedge-shaped pores. openings need to be 36 nm in diameter to allow unrestricted
ice growth out of the pore, while for wedge-shaped pores
5.2 Ice growth out of a pore 18 nm suffice.
A pore filled with ice can be viewed as a perfect active site
For an energy-barrier-free ice growth out of a pore, the en- for deposition nucleation with a contact angle of 0◦ , such
ergy cost to build up additional surface needs to be balanced that there is no thermodynamic energy barrier for ice nu-
by the energy gain due to the increase in ice volume. To re- cleation, i.e. exp(1Gc θis /kT ) = 1 (see the CNT formulation
alize ice volume growth with minimal increase in ice surface for heterogeneous ice nucleation in e.g. Zobrist et al., 2007,
area, ice is assumed to grow as a spherical cap as illustrated in or Kaufmann et al., 2017). For contact angles larger than
Fig. 10. Assuming such growth, the energy balance is given zero, there is an energy barrier and the active site size for
as growth into an ice crystal needs to be larger. In other words,
deposition nucleation occurring on active sites requires IN-
active areas that are larger than pore openings for unrestricted
ice growth. Thus, the required area for deposition nucleation
Atmos. Chem. Phys., 20, 3209–3230, 2020 www.atmos-chem-phys.net/20/3209/2020/C. Marcolli: Fundamental aspects of ice nucleation via PCF 3219
Figure 9. Comparison of pore filling with water and ice for conical (a, c) and wedge-shaped (b, d) pores at 230 K. For water and ice, the
Kelvin effect is calculated without QLL, given as light blue and light brown lines, respectively, and assuming a QLL with width t = 0.38 nm,
given as dark blue and dark brown lines, respectively. The black, dashed horizontal line indicates ice saturation.
restricted ice growth arises from the high surface tension
of ice. In the atmosphere, surface tensions may be low-
ered due to adsorption of semivolatile organic vapours. The
dashed lines in Fig. 11, which were calculated with the in-
terfacial tension γiw (T ), and the surface tensions γvw (T ) and
γvi (T ), all halved, show that reduced interfacial tensions fa-
cilitate growth of ice. Trace amounts of semivolatile organic
vapours can be assumed omnipresent and should influence
PCF mainly by reducing surface tensions. The condensa-
tion of larger amounts of water-soluble organics in pores
influences PCF by lowering the water activity as discussed
Figure 10. Growth of ice out of the pore as a spherical cap with an in Marcolli (2017a). When solid particles have acquired a
increasing height h covering an increasing area π(rop + x)2 . thick coating, pores become irrelevant and freezing may oc-
cur through immersion freezing for particles with nucleation
sites or homogeneously along the homogeneous freezing line
of solution droplets.
occurring on a flat surface needs to be much larger than the
The supersaturation required for ice growth out of pores
one required for immersion freezing as determined e.g. in
in Fig. 11 applies to single isolated pores. Using CNT
Kaufmann et al. (2017). This makes it unlikely that immer-
and molecular dynamics simulations, David et al. (2019a)
sion freezing sites are sufficiently large to host a critical em-
showed that a network of closely spaced pores lowers the su-
bryo in deposition mode. Therefore, immersion-mode active
persaturation required for macroscopic ice-crystal growth out
sites present on the flat particle surface should be irrelevant
of narrow pore openings through bridging of ice caps grow-
for deposition nucleation.
ing out of adjacent pores.
The Kelvin equation can also be used to calculate the
diameter for unrestricted (energy-barrier-free) growth of a
hypothetical spherical ice particle. Using the same param- 6 Conclusions
eters as for growth of pore ice yields a diameter of 44 nm
at Si = 1.1 and T = 230 K (see Fig. 11). Smaller ice parti- The conditions derived for ice nucleation within pores and
cles shrink due to sublimation. This large diameter for un- growth of ice out of pores show that porous particles are able
www.atmos-chem-phys.net/20/3209/2020/ Atmos. Chem. Phys., 20, 3209–3230, 20203220 C. Marcolli: Fundamental aspects of ice nucleation via PCF
nucleation on the other hand is unlikely if one considers the
much larger IN active areas needed for deposition nucleation
than for immersion freezing.
However, the atmospheric relevance of PCF depends on
the coating of the aerosol particles. Trace amounts may in-
deed promote ice growth out of pores, if they reduce the sur-
face tension of ice. When solid particles have acquired a thick
coating, pores likely become irrelevant. In these cases, ice
formation may occur through immersion freezing for parti-
cles that act as INP or along the homogeneous freezing line
of solution droplets.
Figure 11. Diameters of pore openings allowing barrier-free ice
growth out of cylindrical or conical pores (red), wedges or trenches
(green), and spherical particles (blue) as a function of the ice
saturation ratio. Panel (b) is a zoomed in view of panel (a).
Solid lines are obtained for T = 230 K with γvi = γvw + γiw =
0.0811 J m−2 +0.0226 J m−2 = 0.1033 J m−2 , γiw from Ick15, and
θiw = 55◦ . Dashed lines are calculated by halving all involved in-
terfacial tensions to account for the presence of trace amounts of
organic substances that adsorb on surfaces and interfaces. Note that
the dashed red line overlays the green solid line.
to nucleate ice at low ice supersaturation and well below wa-
ter saturation. The focus of this technical note is on homo-
geneous ice nucleation within pores, which occurs below the
HNT. Above the HNT, ice nucleation needs to occur hetero-
geneously on nucleation sites within pores that are active in
immersion mode. Such nucleation sites are considered spe-
cific to each aerosol particle type. Even though porosity can
be considered a surface characteristic, PCF below the HNT
should not be viewed as a heterogeneous ice formation pro-
cess, but as homogeneous freezing because the formation of
the ice phase occurs within the volume of the supercooled
porewater and not on the pore surface.
Well suited for ice formation by PCF are particles with
conical and wedge-shaped pores or with narrow pores that
are closely spaced. Surface roughness ranging from the small
to large nanometre scale is suitable for water condensation,
freezing, and ice growth. This makes PCF the likely mecha-
nism for ice formation at low ice supersaturation. Deposition
Atmos. Chem. Phys., 20, 3209–3230, 2020 www.atmos-chem-phys.net/20/3209/2020/C. Marcolli: Fundamental aspects of ice nucleation via PCF 3221
Appendix A The temperature-dependent molecular volume at standard
pressure, vw (T , P0 ), is obtained by inserting Eq. (A1) into
A1 Temperature- and pressure-dependent densities of Eq. (A5). The density of ice I is only slightly pressure de-
supercooled liquid water and ice pendent. Neglecting this pressure dependence, it can be pa-
rameterized as (Zobrist et al., 2007)
The equation of state relates density to the state variables
temperature and pressure. Water shows a density maximum Mw
at 277.13 K at standard pressure that shifts to warmer temper- vi (T , P ) ≈ vi (T , P0 ) =
Na ρ 0
atures for negative pressures (Pallares et al., 2016) and van-
T − 273.15 K
ishes at high pressures (Mishima, 1996; Holten and Anisi- 1 − 0.05294
mov, 2012). Marcolli (2017a) proposed a parameterization of 273.15 K
T − 273.15 K 2
liquid water density at standard pressure (0.1 MPa) in units of
kg m−3 with a validity range from 50 to 393 K: −0.05637
273.15 K
!−1
ρw (T , P0 ) = 1864.3535 − 72.5821489 · T T − 273.15 K 3
−0.002913 . (A6)
+ 2.5194368 · T 2 − 0.049000203 · T 3 273.15 K
+ 5.860253 × 10⁻⁴ · T 4 − 4.5055151 × 10⁻⁶ · T 5
Using Eq. (A6), the molecular volume of hexagonal ice
+ 2.2616353 × 10⁻⁸ · T 6 − 7.3484974 × 10⁻¹¹ · T 7
is 3.264 × 10⁻²⁹ m3 at 273.15 K and decreases to 3.231 ×
+ 1.4862784 × 10⁻¹³ · T 8 − 1.6984748 × 10⁻¹⁶ · T 9 10−29 m3 at 200 K. The same density parameterization is
+ 8.3699379 × 10⁻²⁰ · T 10 . (A1) used for hexagonal, cubic, and stacking disordered ice be-
cause diffraction data showed that the densities of ice Ih and
To account for its pressure dependence, the density of liquid ice Ic are the same within experimental uncertainty (Murray
water can be formulated in terms of the compressibility κ(T ) et al., 2010; Dowell and Rinfret, 1960).
and its derivative ∂κ(T )/∂P :
A2 Derivation of the Kelvin equation
∂κ(T )
ρw (T , P ) = ρw (T , P0 ) + κ (T ) · P + · P 2. (A2)
∂P The Young–Laplace equation describes the pressure differ-
ence 1P across an interface with interfacial tension γ (T , P )
Density data, covering the pressure and temperature
as a function of the curvature of the surface. In its general
ranges from 0.1 to 399 MPa and 200–300 K, respectively
form, it is given as
(Hare and Sorensen; 1987; Mishima, 2010; Holten and
Anisimov, 2012), together with density data from Pallares
1 1
et al. (2016), covering the range from standard pressure to 1P = γ (T , P ) + , (A7)
−110 MPa and temperatures from 258.15 to 333.15 K, were r1 r2
used to parameterize κ(T ) in units of MPa−1 :
with r1 and r2 being the principal radii of curvature, which
κ (T ) = 0.487 − 0.004368 · (T − 273.15) are orthogonal to each other.
In the case of a curved water surface in contact with its
+ 0.00007235 · (T − 273.15)2 , (A3) vapour, the Young–Laplace equation becomes
and ∂κ(T )/∂P in units of MPa−2 : 1 1
1P = P − P0 = γvw (T , P ) + . (A8)
∂κ (T ) r1 r2
= −0.0003805 + 6.639 · 106
∂P
with P being the absolute pressure within the liquid and P0
· (T − 273.15) − 9.688 · 108 · (T − 273.15)2 . (A4) the pressure over the flat surface. For a sphere with r1 = r2 =
rm one obtains Eq. (6) of the main text.
Inserting Eqs. (A3) and (A4) into Eq. (A2) yields a parame-
Thus, underneath convex surfaces, such as spherical cloud
terization for the density of water in units of kg m−3 that is
droplets, pressure is increased, whereas underneath con-
valid from 203.15 to 333.15 K and −110 to 399 MPa, with a
cave surfaces, such as the meniscus of capillary conden-
standard deviation of 3 kg m−3 and maximum deviations of
sate/porewater, pressures are negative, which corresponds to
±10 kg m−3 .
a tension.
With this density, a temperature- and pressure-dependent
In thermodynamic equilibrium, the chemical potentials of
molecular volume of liquid water can be formulated as
water vapour and liquid water are equal:
Mw
vw (T , P ) = . (A5) µv (T , P ) = µw (T , P ) . (A9)
Na ρw (T , P )
www.atmos-chem-phys.net/20/3209/2020/ Atmos. Chem. Phys., 20, 3209–3230, 20203222 C. Marcolli: Fundamental aspects of ice nucleation via PCF
If additional pressure is exerted, the chemical potential of the Appendix B: Parameterizations of ice nucleation rates
liquid phase changes to
CNT describes ice nucleation as an activated process with
ZP a thermodynamic energy barrier and a pre-factor that often
vw T , P dP 0 .
0
µw (T , P ) = µw (T , P0 ) + (A10) includes an additional kinetic energy barrier. The main dif-
P0 ferences in parameterizations of ice nucleation rates concern
the way they parameterize the pre-factor and in their assump-
Integration yields tion of the solid phase that nucleates. While older parameter-
izations presume the nucleation of hexagonal ice (Ickes et
µw (T , P ) = µw (T , P0 ) al., 2015; Zobrist et al., 2007; Pruppacher and Klett, 1997),
vw (T , P ) + vw (T , P0) more recent ones assume the formation of stacking disor-
+ (P − P0 ) . (A11)
2 dered or cubic ice (Murray et al., 2010; Koop and Murray,
2016; Nĕmec, 2013; Laksmono et al., 2015), with conse-
Here, the temperature- and pressure-dependent formula-
quences for the equilibrium vapour pressure over ice.
tion of the molecular volume, vw (T , P ), as parameterized in
The pre-factor is usually parameterized in terms of viscos-
Appendix A1 can be used.
ity or the self-diffusion coefficient of liquid water. In both
Similarly, the pressure dependence of the chemical poten-
cases, the experimental data range needs to be extrapolated
tial of the vapour phase can be formulated as
to lower temperatures, usually applying the empirical Vogel–
ZP Fulcher–Tammann equation or a power law (Jenniskens and
Blake, 1996; Smith and Kay, 1999; Angell, 1995; Koop and
vv T , P 0 dP 0 .
µv (T , P ) = µv (T , P0 ) + (A12)
Murray, 2016; Murray et al., 2010).
P0 In order to reach agreement with experimentally observed
Using the ideal gas law, the molecular volume of the gas nucleation rates, the interfacial tension between ice and liq-
phase as a function of the vapour pressure p is given as uid water is generally used as the tuning parameter (Ickes
et al., 2015). While there is reasonable agreement between
kT measured nucleation rates for temperatures above 234 K,
vv (T , P ) = . (A13) there is large disagreement at lower temperatures. Nucle-
p
ation rates covering the temperature range from 238 to 234 K,
Insertion into Eq. (A12) and integration yield which are usually measured on micrometre-sized droplets,
p show discrepancies among each other of up to 2 orders of
µv (T , P ) = µv (T , P0 ) + kT ln . (A14) magnitude, most probably arising from uncertainties in ab-
pw (T , P0 )
solute temperature measurements (Ickes et al., 2015; Riech-
Inserting Eqs. (A11) and (A14) into Eq. (A9) yields ers et al., 2013). Measurements below 234 K, which require
drastically increased cooling rates and/or extremely small
p
µv (T , P0 ) + kT ln = µw (T , P0 ) sample volumes (Bartell and Chushak, 2005; Manka et al.,
pw (T , P0 ) 2012; Laksmono et al., 2015; Amaya and Wyslouzil, 2018;
vw (T , P ) + vw (T , P0 ) Kimmel et al., 2019), show systematic discrepancies between
+ (P − P0 ) . (A15)
2 each other, which are outside the error range of the differ-
ent techniques. Therefore, parameterizations need to choose
Since in thermodynamic equilibrium µv (T , P0 ) =
with which datasets they want to comply at low temperatures.
µw (T , P0 ), Eq. (15) simplifies to
Some parameterizations have a restricted application
p vw (T , P ) + vw (T , P0 ) range. Zobrist et al. (2007) and Pruppacher and Klett (1997)
kT ln = (P − P0 ) . (A16) are limited to T > 230 K. The parameterization by Koop and
pw (T , P0 ) 2
Murray (2016) claims to be well constrained by experiments,
Using the Young–Laplace equation as given in Eq. (6) to cal- yet it predicts critical radii rc < 0 nm for T < 220 K. Hence,
culate the pressure change (1P = P − P0 ) due to the curva- it is only applicable above 220 K. Given that for ice nucle-
ture of the water surface yields ation within pores, the temperature range below 230 K is
most relevant, these parameterizations cannot be used.
p 2γvw (T ) vw (T , P ) + vw (T , P0 ) To explore the range of predictions for the “no-man’s land
ln = . (A17)
pw (T , P0 ) rm kT 2 of ice nucleation”, two different parameterizations are com-
pared here, namely the ones by Ickes et al. (2015; Ick15)
The Kelvin equation results when the liquid phase is as-
and Murray et al. (2010; Mr10). Both parameterizations give
sumed incompressible (vw (T , P ) = vw (T , P0 )):
physically reasonable values over the whole atmospherically
p 2γvw (T )vw (T , P0 ) relevant temperature range down to 180 K. However, these
ln = . (A18) parameterizations differ in their assumption of the ice phase
pw (T , P0 ) rm kT
Atmos. Chem. Phys., 20, 3209–3230, 2020 www.atmos-chem-phys.net/20/3209/2020/You can also read


