RAINFALL AND WATER YIELD IN MACIZO DEL CAROIG, EASTERN IBERIAN PENINSULA. EVENT RUNOFF AT PLOT SCALE DURING A RARE FLASH FLOOD AT THE BARRANCO DE ...
←
→
Page content transcription
If your browser does not render page correctly, please read the page content below
Cuadernos de Investigación Geográfica
                                                                          2021       Nº 47       pp. 95-119         EISSN 1697-9540
 Geographical Research Letters

                       Copyright © 2021, The authors. This work is licensed under
                                                                                                         http://doi.org/10.18172/cig.4833
                       a Creative Commons Attribution 4.0 International License.

    RAINFALL AND WATER YIELD IN MACIZO DEL CAROIG,
 EASTERN IBERIAN PENINSULA. EVENT RUNOFF AT PLOT SCALE
     DURING A RARE FLASH FLOOD AT THE BARRANCO DE
                      BENACANCIL

    ARTEMI CERDÀ1*, AGATA NOVARA2, PAVEL DLAPA3, MANUEL LÓPEZ-VICENTE4,
       XAVIER ÚBEDA5, ZORICA POPOVIĆ6, MULATIE MEKONNEN7, ENRIC TEROL8,
      SAEID JANIZADEH9, SONIA MBARKI10,11, EDUARDO SALDANHA VOGELMANN12,
              SAJJAD HAZRATI13, SRIKANTA SANNIGRAHI14, MISAGH PARHIZKAR15
                                                ANTONIO GIMÉNEZ-MORERA16

                        1
                            Soil Erosion and Degradation Research Group, Department of Geography, Valencia University,
                                                                              Blasco Ibàñez, 28, 46010 Valencia, Spain.
                                                      Department of Agricultural, Food and Forest Sciences, University of Palermo,
                                                      2

                                                                                        Viale delle Scienze, 90128 Palermo, Italy.
                                                  3
                                                   Department of Soil Science, Faculty of Natural Sciences, Comenius University,
                                                                       Mlynská dolina, Ilkovičova 6, 84215 Bratislava, Slovakia.
                                                                4
                                                                 Team Soil, Water and Land Use, Wageningen Environmental Research,
                                                                            Droevendaalsesteeg 3, Wageningen, 6708RC, Netherlands.
                                                      5
                                                          GRAM Grup de Recerca Ambiental Mediterrània, Department of Geography,
                                                                         University of Barcelona, Montalegre 6, 08001 Barcelona.
         6
          Department of Ecology, Institute for Biological Research “Siniša Stanković” – National Institute of The
                                             Republic of Serbia, University of Belgrade, Belgrade 11000, Serbia.
         7
             College of Agriculture and Environmental Sciences, Department of Natural Resource Management and
                Geospatial Data and Technology Center, Bahir Dar University, Bahir Dar, P.O, Box 1188, Ethiopia.
                                                        Department of Cartographic Engineering, Geodesy, and Photogrammetry,
                                                            8

                                                 Universitat Politècnica de València, Camino de Vera, s/n, 46022 Valencia, Spain.
              9
                  Department of Watershed Management Engineering and Sciences, Faculty in Natural Resources and
                                            Marine Science, Tarbiat Modares University, Tehran, 14115-111, Iran.
                                            10
                                                 National Research Institute of Rural Engineering, Water and Forests (INRGREF),
                                                                                                   BP 10, Aryanah 2080, Tunisia.
                                 11
                                   Laboratory of Plant Extremophiles, Biotechnology Center at the Technopark of Borj-Cedria
                                                                               Tunisia, BP 901, Hammam Lif 2050, Tunisia.
                            12
                              Biological Sciences Institute, Federal University of Rio Grande, São Lourenço do Sul, Brazil.
                                             Department of Soil Science, Faculty of Agricultural Engineering and Technology,
                                            13

                                                                                                   University of Tehran, Iran.
                  14
                    School of Architecture, Planning and Environmental Policy, University College Dublin Richview,
                                                                            Clonskeagh, Dublin, D14 E099, Ireland.
                        Department of Soil Science, Faculty of Agricultural Sciences, University of Guilan, Rasht, Iran.
                       15

                                       16
                                         Departamento de Economía y Ciencias Sociales, Universitat Politècnica de València,
                                                                                Cami de Vera s/n, 46022 Valencia, Spain.

Cuadernos de Investigación Geográfica, 47 (1), 2021. pp. 95-119                                                                        95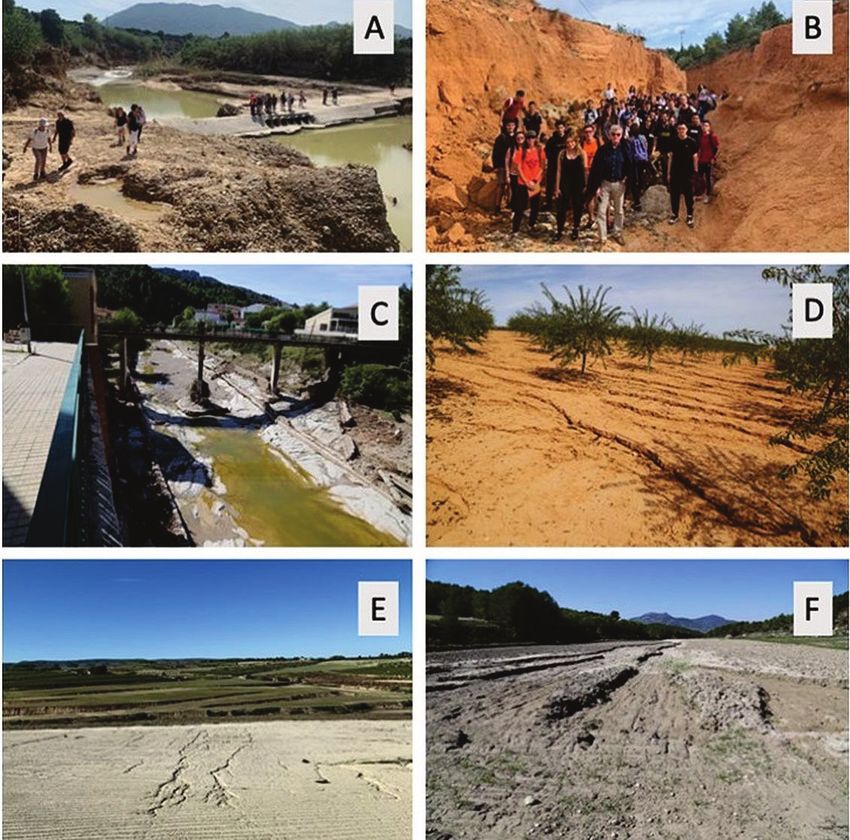
Cerdá et al.

ABSTRACT. Floods are a consequence of extreme rainfall events. Although surface runoff generation is the origin
of discharge, flood research usually focuses on lowlands where the impact is higher. Runoff and sediment delivery
at slope and pedon scale receiving much less attention in the effort to understand flood behaviour in time and space.
This is especially relevant in areas where, due to climatic and hydrogeological conditions, streams are ephemeral, so-
called dry rivers (“wadis”, "ramblas" or “barrancos”) that are widespread throughout the Mediterranean. This paper
researches the relationship between water delivery at pedon and slope scale with dry river floods in Macizo del Caroig,
Eastern Iberian Peninsula. Plots of 1x1, 1x2, 1x4, and 2x8 m located in the “El Teularet” Soil Erosion and Degradation
Research Station were monitored from 2004 to 2014 to measure soil and water delivery. Rainfall and flow at the dry
river Barranco de Benacancil were also monitored. Results show that runoff and sediment discharge were
concentrated in few events during the 11 years of research. A single flood event was registered in the channel on
September 28, 2009, however, the runoff was registered 160 times at the plots. Runoff discharge was dependent on
the size of the plots, with larger plots yielding lower runoff discharge per unit area, suggesting short runoff-travel
distance and duration. Three rainfall events contributed with 26% of the whole runoff discharge, and five achieved
56% of the runoff. We conclude that the runoff generated at the plot scale is disconnected from the main channel.
From a spatial point of view, there is a decrease in runoff coefficient along the slope. From a temporal point of view,
the runoff is concentrated in a few rainfall events. These results show that the runoff generated at plot and slope scale
does not contribute to the floods except for rainfall events with more than 100 mm day-1. The disconnection of the
runoff and sediment delivery is confirmed by the reduction in the runoff delivery at plot scale due to the control of
the length of the plot (slope) on the runoff and sediment delivery.

Precipitación y producción de agua en el Macizo del Caroig, Este de la Península Ibérica.
Evento de escorrentía a escala de parcela durante una crecida torrencial en el barranco de
Benacancil

RESUMEN. Las inundaciones son consecuencia de lluvias extremas. Aunque la generación de escorrentía superficial
es el origen de la descarga, la investigación de inundaciones generalmente se enfoca en las tierras bajas donde el
impacto es mayor. La escorrentía y la distribución de sedimentos a escala de pendiente y pedón reciben mucha menos
atención en la comprensión del comportamiento de las inundaciones en el tiempo y el espacio. Esto es especialmente
relevante en zonas donde, debido a las condiciones climáticas e hidrogeológicas, los cauces son efímeros. Son los
llamados ríos secos (“wadis”, “ramblas” o “barrancos”) muy extendidos por todo el Mediterráneo. Este artículo
investiga la relación entre el suministro de agua a escala de pedón y ladera con las crecidas de ríos secos en Macizo
del Caroig, este de la Península Ibérica. Las parcelas de 1x1, 1x2, 1x4 y 2x8 m localizadas en la Estación de
Investigación de Erosión y Degradación de Suelos “El Teularet” fueron monitoreadas de 2004 a 2014 para medir la
producción de suelo y agua. También se monitorearon las precipitaciones y el caudal en el río seco Barranco de
Benacancil. Los resultados muestran que la escorrentía y la descarga de sedimentos se concentraron en pocos eventos
durante los 11 años de investigación. Se registró un solo evento de inundación en el canal el 28 de septiembre de
2009, sin embargo, la escorrentía se registró 160 veces en las parcelas. La descarga de escorrentía dependió del
tamaño de las parcelas. Las parcelas más grandes produjeron una menor descarga de escorrentía por unidad de área,
lo que sugiere una corta distancia y duración del recorrido de escorrentía. Tres eventos de lluvia contribuyeron con
el 26% de la descarga total de la escorrentía y cinco lograron el 56% de la escorrentía. Se concluye que la escorrentía
generada a escala de la parcela está desconectada del canal principal. Desde un punto de vista espacial, hay una
disminución en el coeficiente de escorrentía a lo largo de la pendiente. Desde un punto de vista temporal, la escorrentía
se concentra en unos pocos eventos de lluvia. Estos resultados muestran que la escorrentía generada a escala de
parcela y pendiente no contribuyen a las inundaciones excepto para eventos de lluvia con más de 100 mm día-1. La
desconexión de la escorrentía y la entrega de sedimentos se confirma por la reducción de la escorrentía a escala de
parcela debido al control de la longitud (pendiente) sobre la escorrentía y la entrega de sedimentos.

Key words: Runoff, sediments, rainfall, extreme events, dry rivers, ephemeral floods.
Palabras clave: escorrentía, sedimentos, precipitación, eventos extremos, ríos secos, inundaciones efímeras.

                                                                                              Recibido: 3 August 2020
                                                                                         Aceptado: 11 December 2020

96                                                       Cuadernos de Investigación Geográfica, 47 (1), 2021. pp. 95-119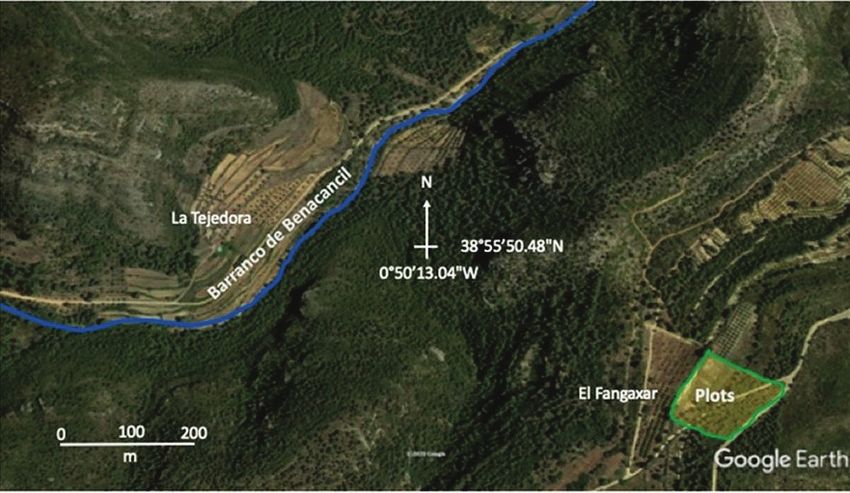
Runoff at plot scale during a rare flash flood

*Corresponding author: Artemi Cerdà, Soil Erosion and Degradation Research Group. Department of Geography,
Valencia University, Blasco Ibàñez, 28, 46010 Valencia, Spain. E-mail address: artemio.cerda@uv.es

1. Introduction
        Floods are a consequence of the interaction of nature and humans (Hamilton, 1987). Nature
determines that lowlands and other areas prone to be flooded along the catchments will be covered by
water during some periods due to extreme rainfall events (Downs and Thorne, 2000). Human activities
taking place in the floodplain, as well as wrong planning and land use mismanagement the upstream,
can increase the economic damage and casualties caused by floods.
         Within the factors that control flood events, extreme rainfall is the most relevant (Guhathakurta
et al., 2011). Extreme rainfall events, either in volume or intensity, result in extreme floods (Smith et
al., 2001). This has been documented at different scales, from large basins (Parida et al., 2017) to small
watersheds (Daliakopoulos and Tsanis, 2012). Most of the research carried out in areas affected by
floods focuses on the lowlands as they are the areas that suffer more and where the damages from a life
and property point of view are higher (Bauer et al., 2018). However, damages from floods in
mountainous terrain, from small creeks, are becoming more frequent (Wu et al., 2019). Moreover, the
lowlands are also very dynamic from the fluvial and geomorphological perspective (Keesstra, 2007;
Kalantari et al., 2018; Yousefi et al., 2018). Although most of the attention by policymakers, land-users,
and practitioners after a flood is located in the lowlands, from a geomorphological and hydrological
point of view, the runoff delivery from the upper mountainous areas is relevant to understand the
mechanism of the floods and to learn how to prevent them.
         It is accepted that the origin of the floods can be found in the runoff generated at pedon and
slope scale, although few papers focuss on this origin of the runoff discharge that can result in dramatic
events. In northern France, Martin (1999) researched the effect of agriculture practices (no-tillage,
moldboard plowing, mustard intercrops, and superficial plowing) on runoff production and soil loss and
found a positive effect of the use of cover crops to control floods. Hümann et al. (2011) in the forest
land of Southwest Germany found that forest land contributes to reducing the floods as runoff was higher
in the agricultural land. Similar findings in the Loess Plateau in China were measured by Zhang et al.
(2018) who analyzed 371 flood events (1963-2011) and demonstrated that floods accounted for 49.6%
to 91.8% of their mean annual totals of runoff. The reduction of surface runoff and associated sediment
yield in floods explained about 85.0% to 89.2% of the sediment yield.
         The connection between soil erosion and floods is a classic topic in soil erosion research that is
much less studied in recent years. Robinson and Blackman (1990) researched soil erosion of arable
farmland on the South Downs in East Sussex that used to cause episodic flooding and they demonstrated
that the on-farm costs of the erosion were smaller than the off-farm costs. Bannari et al. (2016) assessed
the flash-flood impact on soil redistribution in the foot of the western Anti-Atlas Mountains in the south
of Morocco. Wilkinson et al. (2010) show the impact of floods in the runoff in the Belford catchment
in Northumberland and Bronstert et al. (1995) in Germany and Saghafian et al. (2008) in the Golestan
region of Iran. The research of Poesen and Hooke (1997) in the Mediterranean updated the knowledge
on soil erosion and flood issues with a general overview. Other researchers contributed with regional
data to understand how runoff is generated and floods formed. The works of Romero-Diaz et al. (2010)
contributed key information to understand how the afforestation in semiarid land can result in higher
erosion rates. Ecosystems response to soil erosion and flood generation is complex such as the land
abandonment show (Romero-Díaz et al., 2017) along climatological gradients in Mediterranean
ecosystems (Ruiz-Sinoga and Díaz, 2010). Dry rivers (ephemeral rivers) are studied from different
perspectives in the Mediterranean region: flood events; channel changes; and mapping upon land-use
indicators (Yousefi et al., 2020)). But little research has been developed to link the runoff and sediment
detached at pedon and slope scale with the floods triggered on the talweg.

Cuadernos de Investigación Geográfica, 47 (1), 2021. pp. 95-119                                              97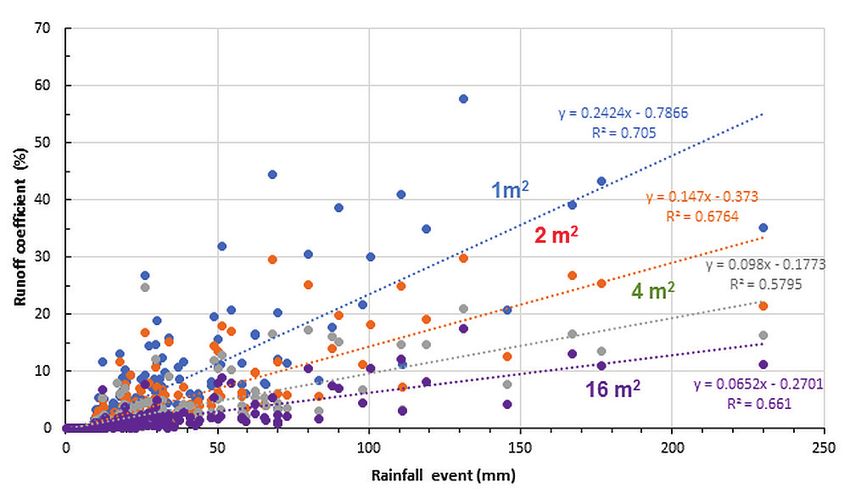
Cerdá et al.

         An example of the connection between the pedon and watershed-scale takes place during
extreme rainfall events such as the one on September 12, 2019, when 300 mm were registered in
Ontinyent, Spain, in one day (see Fig. 1). Similar examples can be found in the review of López-
Bermúdez (1993) when rainfall events of high magnitude – low frequency are analyzed. Then the
overland flow was extreme in the river Canyoles with a flash flood and evidence (rills and gullies) found
in the headwaters of the watershed. The key scientific question here is the frequency of these extreme
rainfall events. These events have also formed most of the geomorphologic features of the
Mediterranean Type-Ecosystems, and this is relevant as they determine also the landforms. To answer
this key scientific and development question, we need long-term measurements in the field and an
assessment of the floods. Long-term monitoring is the key contribution of this paper.

     Figure 1. Views of the impact of the DANA of 12 September 2019 at the study are of river Canyoles
  watershed. View of the river Canyoles talweg after the flood in Granja de la Costera, (A), gully formed as a
    consequence of the mismanagement of the railway flows at Font de la Figuera (B), talweg of the river
 Canyoles in Moixent with the removal of the sediments (C), almond plantation affected by rilling in Font de la
   Figuera (D), rill development in sunflower fields in Moixent (E), and barley field after tillage with wide
                                       gullies in Font de la Figuera (F).

         Previous research approached this topic at a single spatial scale. This was the conventional
approach. However, recently some authors applied different techniques to determine the runoff and soil
losses at different scales. To develop a better understanding of the floods in Japan and to determine how
the forest management practices determine the runoff generation, sediment transport, and soil erosion,
Onda et al. (2010) conducted field observations and monitored the discharge, water quality, and soil
erosion in forest plantations through catchments (> 4 ha), plots (0.1-4 ha), hillslope plots (0.5-2 m) and
splash cups. The effect of the scale is relevant such as was found by Bagarello et al. (2018) where plots of
different sizes resulted in runoff coefficients and soil erosion with different orders of magnitude. The larger

98                                                   Cuadernos de Investigación Geográfica, 47 (1), 2021. pp. 95-119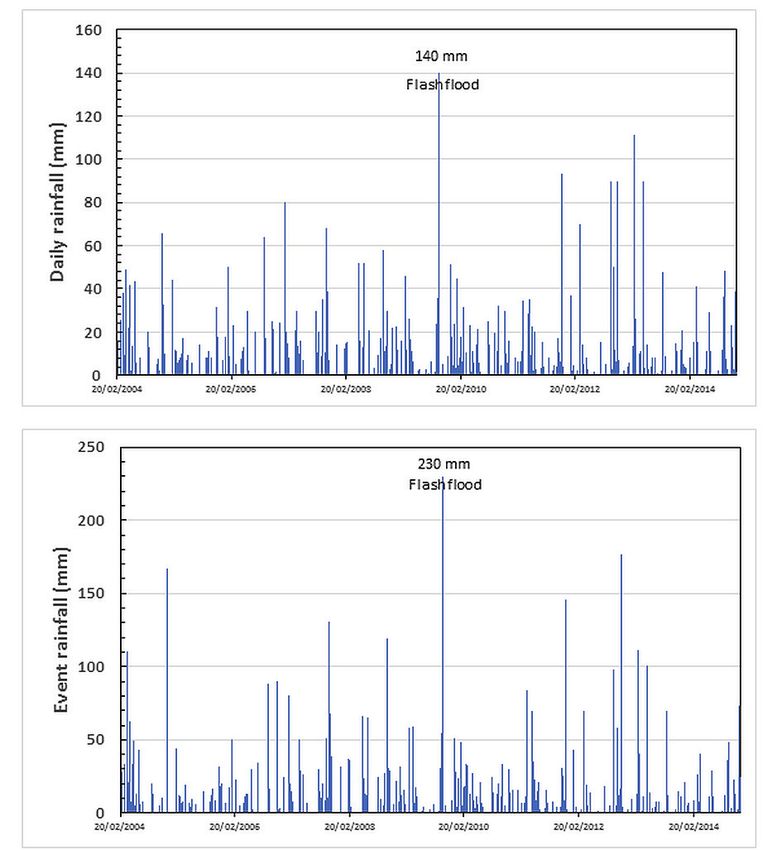
Runoff at plot scale during a rare flash flood

the plot, the lower the soil losses, which is due to the low degree of connectivity of the flows (Keesstra et
al., 2018). The importance of the plot size was also a key factor during the recovery of the plant cover after
land abandonment such as Cerdà et al. (2018) found in El Teularet research station. Floods are also
enhanced by human activities in the headwaters of the watersheds and basin. Deforestation has been one
of the main human impacts on the mountain terrains that enhanced floods and activated the erosional cycle
and result in fluvial adjustments (Begueria et al., 2006). Although other factors are relevant to understand
and foresee the runoff generation during floods, extreme rainfall events are the ones that trigger the runoff
initiation, sheet and rill flows, and finally the floods (Smith et al., 2011).
        Most of the research was carried out at a watershed scale to determine the runoff discharge and
sediment delivery. The contribution at slope and pedon scale is much less researched to understand flood
behavior in time and space, although the runoff generation at smaller scales is the origin of the large-
scale water discharge. This paper researches the role of low frequency-high magnitude events in the
water delivery at pedon and slope scale on flood generation in Mediterranean mountainous terrains.

2. Material and Methods
2.1. Study area
         Macizo del Caroig was selected to determine the soil erosion and water yield in a typical
Mediterranean mountainous area dominated by rainfed agriculture and rangelands. There, the
Department of Geography (University of Valencia) developed in 2002 the El Teularet Soil Erosion and
Degradation Research Station to monitor and assess the impact of land management and land uses on
soil erosion and runoff generation (Fig. 2). Climate is the typical Mediterranean with a mean annual
temperature of 12.7°C registered at the nearby Las Arenas Enguera meteorological station. January is
the coldest month (9.8°C) and August is the warmest (25.7°C). Rainfall is characterized by a mean
annual rainfall of 540 mm and a typical Mediterranean dry summer. The highest rainfall intensities were
recorded from September to December when some rainfall events with a 10-year return period can reach
100 mm day-1 (Cerdà, 2017). Four erosion plots were installed on a slope of marl parent materials which
used to be agricultural land. The overall landforms are characterized by a succession of plateaus and
deeply incised valleys. This is a consequence of the weathering (dissolution) of the Cretaceous carbonate
rocks which are the main parent material in the study area and Eastern Spain; on patches of marls in the
landscape, most of the (abandoned) agriculture fields can be found. Soils at the study site are classified
as Typic Xerorthents (Soil Survey Staff, 2014) (Cerdà et al., 2018).

  Figure 2. Location of the study sites. The main creek is Barranco de Benacancil located 706 m from the soil
                       erosion plots in the Macizo del Caroig, inland Valencia province.

Cuadernos de Investigación Geográfica, 47 (1), 2021. pp. 95-119                                                 99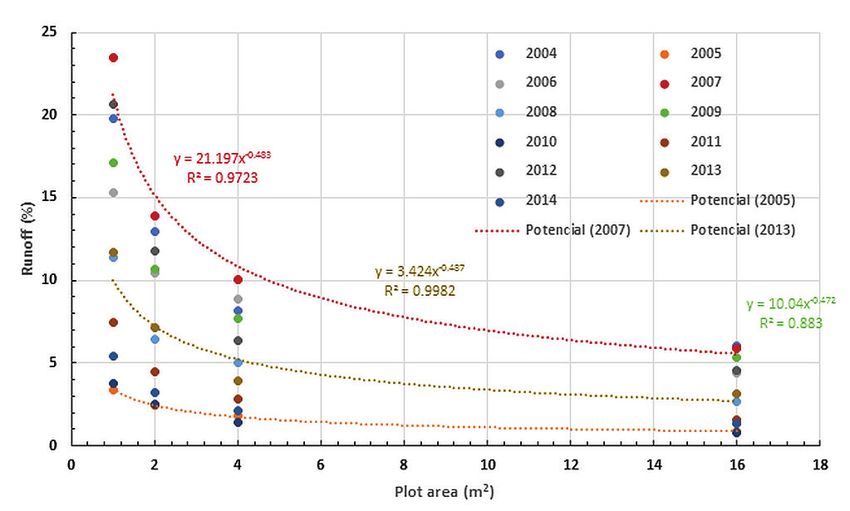
Cerdá et al.
2.2. Methods
A set of 4 plots was established in 2002. Plots were delineated with aluminium sheets, 1 mm
thick by 50 mm height, that prevented surface and subsurface flow to and from each catchment. Each
plot consisted of 1x1, 1x2, 1x4, and 2x8 m (width x length) (Fig. 3). The plots were tilled 4 times per
year (April, May, June, and August) to remove vegetation as traditionally done for soil management of
almond, fruit, olive, and vineyard crops in the region. The first measurements took place in January
2004. After each rainfall event, runoff discharge and runoff sediment concentration were measured, and
plots borders, drainage, collectors, pipes, and deposits were checked for damages.
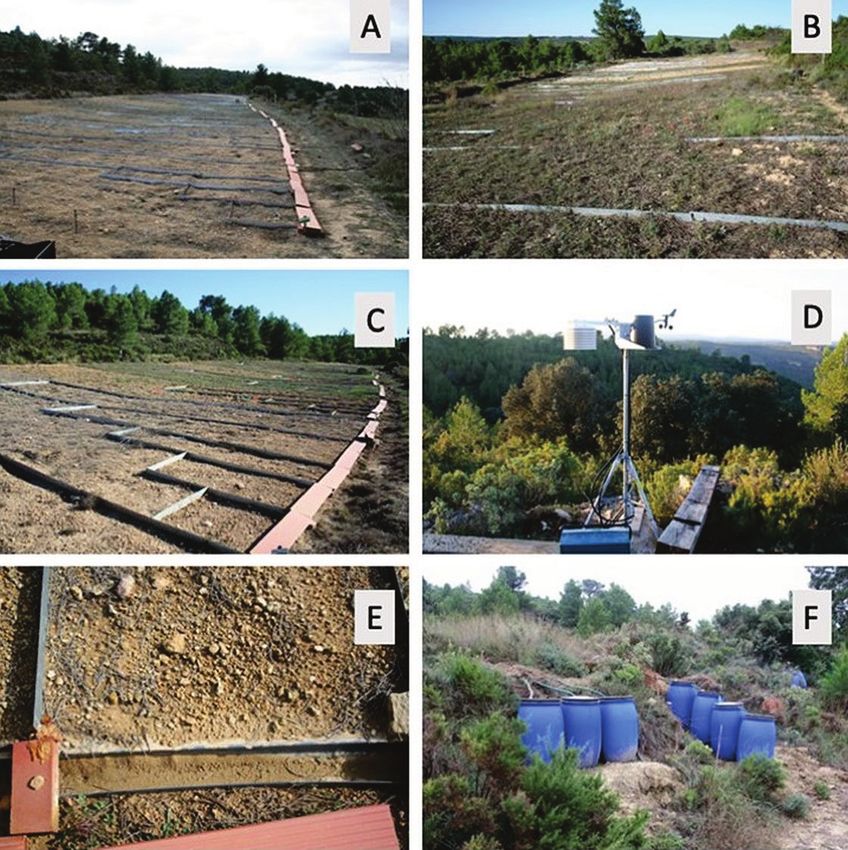
Figure 3. View of the plots in January 2006 (A), April 2007 (B), and May 2008 (C), meteorological station in
October 2005 (D), detail of one of the collectors in June 2007 (E) and runoff deposits in July 2008 (F).
Soil and vegetation descriptions and sampling were made in December 2003 before the
measurements were initiated and maintained during the experimental period. Rainfall (mm) was
measured in the nearby Las Arenas meteorological station located 5 km from the study site. More than
6 hours without rainfall was used as the threshold to determine the rainfall events. Runoff (l) was
collected from the plots using a collector (gutter) that was 0.15 x 1 m (2 m in the 16 m2 plots, 2 x 8 m2)
and 0.15 m depth. The collected runoff was drained into 125 and 250 l tanks connected to the collector
100 Cuadernos de Investigación Geográfica, 47 (1), 2021. pp. 95-119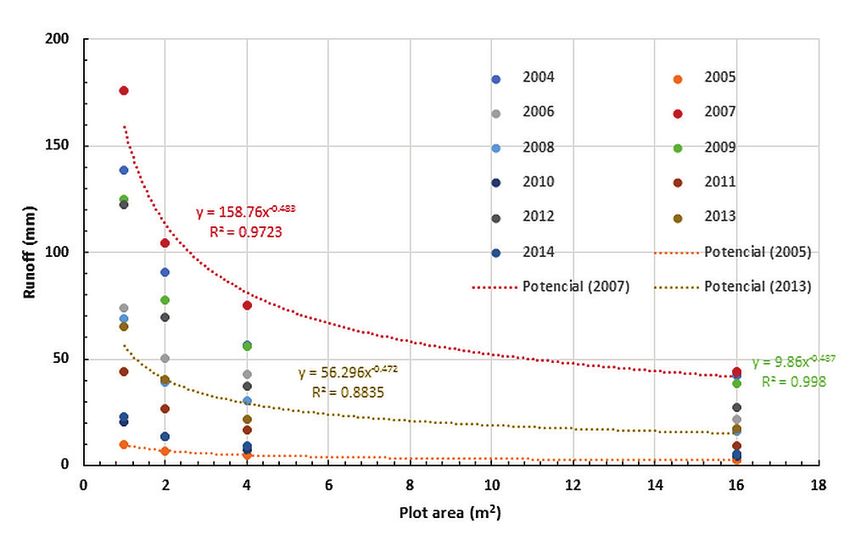
Runoff at plot scale during a rare flash flood

by a 0.4 m-diameter pipe. Total storage capacities were 125, 250, 375, and 600 l for the 1, 2, 4, and 16
m2 plots, respectively.

3. Results and Discussion
        The measurements carried out in El Teularet Soil Erosion and Degradation Research Station
during the 11 years of the study untangle the connectivity regime of the flows along the slope, and from
the slope to the stream Barranco de Benacancil.

3.1. Rainfall
          The total rainfall measured during the 11 years of research reached 6,280.8 mm. The rainfall
distribution per year shows that although the average rainfall was 571.0 mm for the eleven-year study
period, the variability was very high as it ranged from 288.0 mm in 2005 to 749.0 mm in 2007. The
seasonal distribution of rainfall was characterized by dry summers which are typical in the
Mediterranean ecosystems and last from July to August (Vicente-Serrano et al., 2004; López-Moreno
et al., 2009). The negative trend of the mean annual rainfall was not significant (y: -3.13x + 6,848.2; R2:
0.0058) but the period is too short to conclude that there is a trend. Although changes in the rainfall
trend in the Mediterranean have been observed, they are not registered in other Western Mediterranean
long-time series of data (Peña-Angulo et al., 2020). The decrease in annual rainfall found by other
authors is paradoxical with the increase in the mean daily rainfall (Alpert et al., 2020). Those changes
will affect the vegetation growth and then the soil and water yield in Mediterranean Ecosystems (Sarris
et al., 2007; Keesstra et al., 2009).
         The largest daily rainfall events at the El Teularet study site took place in 2009 (140.0 mm) and 2013
(111.0 mm). The largest rainfall events (consecutive rainy days) amounted to 230.0 mm in 2009, 176.8 mm
in 2012, and 167.0 mm in 2004 (Table 1). Daily rainfall has been increasing in the Mediterranean (Ribes et
al., 2019) although not in all the regions (Serrano-Notivoli et al., 2018) were found the same trend. The
highest rainfall events show a good correlation with the highest mean annual rainfall at the study area such
as has also been found in other research sites (Mathbout et al., 2018) (Fig. 4).

    Table 1. Rainfall distribution per year and for the 1st, 2nd, and 3rd largest daily rainfall and rainfall event.

                    Year        Total       Day       Day         Day     Event     Event      Event
                                            1st       2nd         3rd       1st      2nd        3rd
                                 mm         mm        mm          mm       mm        mm         mm
                   2004         699.8      66.0       49.0        43.5    167.0     110.5       62.5
                   2005         288.0      44.0       31.5        18.0     44.0      31.5       19.8
                   2006         485.0      64.0       50.0        30.0     89.9      88.0       50.0
                   2007         749.0      80.0       68.0        67.0    131.0      80.0       68.0
                   2008         609.4      58.0       52.0        52.0    119.0      66.0       65.5
                   2009         728.5      140.0      52.0        51.5    230.0      59.2       58.0
                   2010         554.2      45.0       32.3        31.5     48.2      33.5       33.4
                   2011         590.4      93.0       49.0        35.0    145.5      83.5       70.0
                   2012         593.7      90.0       90.0        70.0    176.8      98.0       70.0
                   2013         560.4      111.0      90.0        48.0    111.0     100.5       70.0
                   2014         422.4      48.1       41.0        38.6     72.9      48.1       41.0
                  Average       571.0      76.3       55.0        44.1    121.4      72.6       55.3
                   Max          749.0      140.0      90.0        70.0    230.0     110.5       70.0
                   Min          288.0      44.0       31.5        18.0     44.0      31.5       19.8

Cuadernos de Investigación Geográfica, 47 (1), 2021. pp. 95-119                                                        101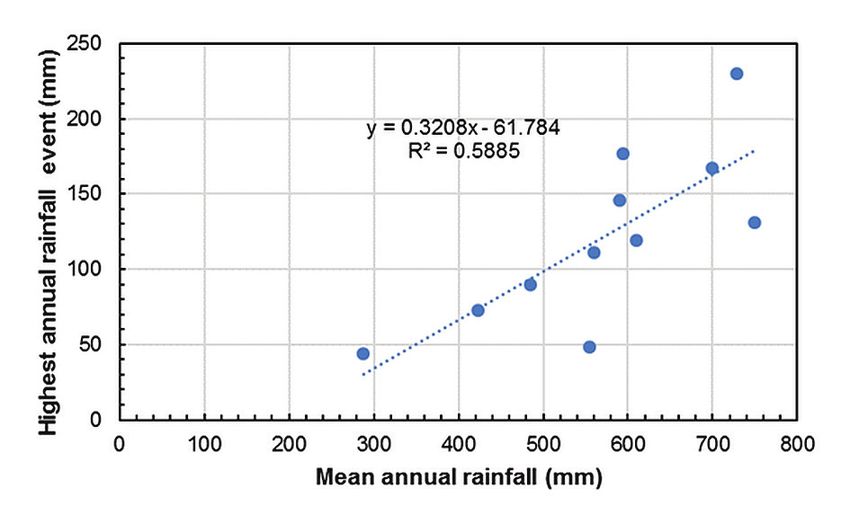
Cerdá et al.

             Figure 4. Relation between mean annual rainfall and highest daily rainfall and vice versa.

         The daily rainfall for the period from September 12, 2009, to September 30, 2009, accounted
for 340.5 mm with 230.0 mm from September 27th to September 30th and 140.0 mm on September 28th.
This extreme rainfall event accounted for 46% of the total rainfall in 2009, which was a wet year with a
total of 728.5 mm mainly due to this extreme rainfall event. The rainfall events of September 2009
accounted for 5.4% of the total rainfall registered in the study area from 2004 to 2014. Table 2 shows
the daily distribution of the rainfall from September 12 to September 30, 2009.

      Table 2. Rainfall per day and for the five events registered during the rainy season of September 2009. On
            September 9th we registered a flash flood at the ephemeral stream of Barranco de Benacancil.

                                            Period        Daily       Event
                                             Days        Rainfall    Rainfall
                                              10           mm          mm
                                            12.9.09        7.0
                                            13.9.09       24.0         31.0
                                            15.9.09       14.5         14.5
                                            17.9.09       10.5         10.5
                                            22.9.09       36.0
                                            23.9.09       18.5         54.5
                                            27.9.09       52.0
                                            28.9.09       140.0
                                            29.9.09       11.0
                                            30.9.09       27.0        230.0
                                             Total        340.5       340.5

        The rainfall event of September 2009 was relevant as during the experimental period (2002-
2014) we registered very dry years such as 2005 when 288 mm were recorded. The 140 mm registered
on September 28th is not a rare event. Other extreme events have taken place in the area, e.g. October
21-22, 1982, with 623 mm in two days registered in Casa del Barón en la Muela de Cortes de Pallas and
580 mm in the nearest town (Enguera). The October 1982 precipitation event led to a catastrophic
Xúquer river flood and the collapse of Tous Dam and the flood of the La Ribera district.
         The distribution of the rainfall at El Teularet during the research period is shown in Figure 5,
for daily and event measurements, respectively.

102                                                     Cuadernos de Investigación Geográfica, 47 (1), 2021. pp. 95-119
Runoff at plot scale during a rare flash flood

        Figure 5. Daily rainfall (mm) at the El Teularet Soil Erosion and Degradation Research Station.

3.2. Runoff
        During the entire 11 years of the study, the stream Barranco de Benacancil had runoff discharge
only on September 28, 2009, after 140 mm of rainfall in one day. The discharge was a flash flood such
as was described by farmers due to the sudden arrival of the runoff discharge wave. However, the runoff
discharge at the plots under tillage in the El Teularet Soil Erosion and Degradation Research Station
contributed to 169 runoff events during the 11 years of the study.
          Annual runoff was measured at each of the four plots of 1, 2, 4, and 16 m2. The total runoff
during the 11 years (6,280.8 mm of rainfall) amounted to 868.5, 1,066.7, 1,438.7, and 3,678.4 l for the
1, 2, 4, and 16 m2 plots, respectively. Annual variability was high, with the dry year 2005 yielding 9.8,
13.8, 20.8, and 40.4 l and wet 2007 yielding 176.1, 208.6, 300.7, and 708.1 l of runoff for the 1, 2, 4,
and 16 m2 plots, respectively (Table 3).

Cuadernos de Investigación Geográfica, 47 (1), 2021. pp. 95-119                                              103
Cerdá et al.

                     Table 3. Runoff discharge per plot and year (l). Total and average values.

                Plot          Plot 1           Plot 2           Pot 3            Plot 4          All plots
               Surface        1 m2             2 m2             4 m2             16 m2            23 m2
                Year            (l)              (l)              (l)              (l)              (l)
                2004          138.6            181.7            227.5            677.7           1,225.5
                2005           9.8              13.8            20.8              40.4             84.8
                2006           74.3            101.1            171.9            344.0            691.3
                2007          176.1            208.6            300.7            708.1           1,393.5
                2008           69.3             78.5            122.6            262.0            532.4
                2009          124.7            155.4            223.1            620.2           1,123.4
                2010           20.8             27.4            30.8              70.3            149.4
                2011           44.2             53.2            66.3             148.4            312.1
                2012          122.4            139.7            150.4            434.2            846.7
                2013           65.4             80.2            88.2             280.9            514.6
                2014           22.9             26.9            36.5              92.3            178.6
                Total         868.5           1,066.7          1,438.7          3,678.4          7,052.3
               Average         79.0             97.0            130.8            334.4            641.1

       Runoff discharge measured during the 11 years of research shows that the discharge is
dependent on the plot size. Table 4 show that the total runoff per plot upon the 6,280.8 mm of rainfall
move from the 868.5 mm till the 533.3, 359.7, and 229.9 l m-2, with an average of 497.8 l m-2 (Table 4).

                    Table 4. Runoff discharge per plot and year (mm). Total and average values.

                Plot          Plot 1          Plot 2            Pot 3            Plot 4          All plots
               Surface         1 m2            2 m2              4 m2            16 m2            23 m2
                Year          (mm)            (mm)              (mm)             (mm)             (mm)
                2004          138.6            90.9              56.9             42.4             82.2
                2005            9.8             6.9               5.2             2.5               6.1
                2006           74.3            50.6              43.0             21.5             47.3
                2007          176.1           104.3              75.2             44.3             99.9
                2008           69.3            39.3              30.7             16.4             38.9
                2009          124.7            77.7              55.8             38.8             74.2
                2010           20.8            13.7               7.7             4.4              11.7
                2011           44.2            26.6              16.6             9.3              24.2
                2012          122.4            69.9              37.6             27.1             64.3
                2013           65.4            40.1              22.0             17.6             36.3
                2014           22.9            13.4               9.1             5.8              12.8
                Total         868.5           533.3             359.7            229.9            497.8
               Average         79.0            48.5              32.7             20.9             45.3

         The runoff coefficient also shows that runoff discharge is dependent on plot size. In average
values, a decrease in the runoff coefficient is observed from 12.1, 7.8, 5.3, and 3.3% for the 1, 2, 4, and
16 m2 plots, respectively (Table 5).

104                                                     Cuadernos de Investigación Geográfica, 47 (1), 2021. pp. 95-119
Runoff at plot scale during a rare flash flood
Table 5. Runoff coefficient per plot and year (%). Total and average values.
Plot Plot 1 Plot 2 Pot 3 Plot 4 All plots
Surface 1 m2 2 m2 4 m2 16 m2 23 m2
Year (%) (%) (%) (%) (%)
2004 19.8 13.0 8.1 6.1 11.7
2005 3.4 2.4 1.8 0.9 2.1
2006 15.3 10.4 8.9 4.4 9.8
2007 23.5 13.9 10.0 5.9 13.3
2008 11.4 6.4 5.0 2.7 6.4
2009 17.1 10.7 7.7 5.3 10.2
2010 3.7 2.5 1.4 0.8 2.1
2011 7.5 4.5 2.8 1.6 4.1
2012 20.6 11.8 6.3 4.6 10.8
2013 11.7 7.2 3.9 3.1 6.5
2014 5.4 3.2 2.2 1.4 3.0
Average 12.7 7.8 5.3 3.3 7.3
The influence of the scale of measurement on runoff generation has been measure in a few
research sites. The review of De Vente and Poesen (2005) on this topic demonstrated that the scale is a
factor of the soil erosion rate measured. Most of the approaches to this topic were developed at
catchment or basin scale (Bhattarai and Dutta, 2007), and much less information is found at the plot
scale. Bagarello et al. (2018) already found in similar plots (under herbicide treatment) a strong control
of the length of the slope: as longer the slope lower is the soil losses. Smets et al. (2008) found that the
length of the plots (0.5 to 31.5 m) control the effectiveness of the mulches to control the soil and water
losses. Kirkby (2010) already highlighted the importance of the distance on the slope, and scale effect,
when researching the soil erosion processes. Parson et al. (2006) used eight runoff plots (2-28 m length)
in Walnut Gulch Experimental Watershed in southern Arizona to determine that the sediment yield
increased until 7 m plot length and later decreased. Santos et al., (2017) developed research in the
semiarid region of Brazil with 116 rainfall events with plots of 1, 20, and 28,000 m2 to determine the
impact of slash and burn on soil erosion. They found that the highest water losses were measured at 20
m2 plots. Cammeraat (2004) utilizing a nested approach that the runoff was initiated under lower rainfall
intensities at the pedon scale than at the slope (and watershed) scale in the Murcia region of the Eastern
Iberian Peninsula. Moreno de las Heras et al. (2010) used length plots from 1 to 15 m on reclaimed land
and they agree that a general decrease of unit area runoff was observed with increasing plot scale for all
slopes. Langhans et al., (2019) studied the impact of conservation tillage on different plot sizes (5, 30,
and 180 m2) and found that as larger were the plots lower the runoff coefficient, and that the impact of
the management was affected by the scale of measurement.
In the El Teularet soil erosion experimental station we found a similar behavior of the plots: a
reduction in the runoff delivery per unit area from the small to the large plots. Figure 6 shows a decrease
in the runoff discharge (mm) from the 1 m2 plots to the ones with 16 m2. The maximum values registered
in 2007 show this trend under the wettest conditions and year 2005 during the driest conditions. For the
runoff coefficient (%) the trend shows how runoff is reduced by three times from 1 to 16 m2 (Fig. 7).
Figure 6 shows the trend along with the changes in the scale of the total runoff (l). The increase is
because the plots are larger, but the runoff per unit area (% or mm) shows a reduction such as figures 6
and 7 shown.
The total rainfall at year scale influences the total runoff. The largest runoff coefficients were
registered in the wettest year (2007) with 23.5, 13.9, 10, and 5.9%, and the lowest in 2005 with 3.4, 2.4,
1.8, and 0.9 % for the 1, 2, 4, and 16 m2 plots. The relation between the rainfall and runoff also is affected
by the control that the size of the plots exerts on the runoff yield. We found that within the relation
between rainfall and runoff the size of the plots also is relevant (Fig. 7).
Cuadernos de Investigación Geográfica, 47 (1), 2021. pp. 95-119 105Cerdá et al.
Figure 6. Event rainfall (mm) at the El Teularet Soil Erosion and Degradation Research Station.
Figure 7. Runoff discharge (l) per year and plot per size of the plots (m2).
3.3. Event rainfall and runoff
The runoff collected in the 4 plots during the runoff events shows that the runoff events do not
take place when the rainfall is below 10 mm. Although we registered 470 daily rainfall grouped in 311
events, only 169 events were effective to deliver runoff, which is an average of 15.4 runoff events per
year. Within the 311 rainfall events recorded (28.3 per year), 140 events of rainfall did not contribute to
runoff due to the low rainfall volume below10 mm. Within the 109 rainfall events between 10 and 30
mm, 107 rainfall events contributed to runoff. All the rainfall events with rainfall values higher than 30
mm contributed to runoff (Table 6).
106 Cuadernos de Investigación Geográfica, 47 (1), 2021. pp. 95-119Runoff at plot scale during a rare flash flood
Table 6. Rainfall and runoff event distribution (nº, mm, %) for the 4 plots at the El Teularet Soil Erosion and
Degradation Research Station.
Ranks Rainfall Rainfall Rainfall Rainfall
Event Event
nº mm nº mm
>100 2 251.0 9 1,291.3
>60 11 842.0 14 1,046.8
>30 41 1,649.8 39 1,548.5
>10 153 2,397.7 109 1,752.7
>5 122 809.8 71 470.8
>0 141 330.5 69 170.7
Total 470 6,280.8 311 6,280.8
Ranks Runoff Runoff Runoff Runoff Runoff
Event Event Event Event Event
nº mm mm mm mm
1 m2 2 m2 4 m2 16 m2
>100 9 458.0 273.1 176.4 133.6
>60 14 198.0 121.8 85.0 41.8
>30 39 145.4 93.0 63.8 36.7
>10 107 67.1 45.5 34.6 17.8
>5 0 0.0 0.0 0.0 0.0
>0 0 0.0 0.0 0.0 0.0
Total 169 868.5 533.3 359.7 229.9
Ranks Runoff Runoff Runoff Runoff Runoff
Average 1 m2 2 m2 4 m2 16 m2
% % % % %
>100 52.8 52.7 51.2 49.0 58.1
>60 21.9 22.8 22.8 23.6 18.2
>30 17.0 16.7 17.4 17.7 16.0
>10 8.4 7.7 8.5 9.6 7.7
>5 0.0 0.0 0.0 0.0 0.0
>0 0.0 0.0 0.0 0.0 0.0
Total 100 100 100 100 100
The runoff yield (mm) was determined by the size of the plot, but the runoff initiation did not.
All the plots have shown that when runoff took place, the runoff was present in all plots, which is because
under tillage conditions the soils contribute to surface runoff when the rainfall intensity is higher than
the soil infiltration capacity (Horton, 1933). The Hortonian overland flow mechanism induces that when
runoff is present it is found along the whole slope. In agricultural land, Hortonian overland flow is
generated due to the impact of tillage that reduces that induce soil degradation, the formation of surface
crusts, and then the runoff initiation. Ziegler et al. (2001) found that Hortonian overland flow was
present in an agriculture watershed in northern Thailand where the soil hydraulic conductivity was low.
The low infiltration rates of the soils are the key factor to enhance the Hortonian overland flow (Dunne
and Dietrich, 1980). Agriculture land induces low infiltration rates and high runoff discharges. This has
been found in areas where tillage is present. Tillage induces the degradation of the soils in different
regions of the world and induced the highest runoff discharges and also quick overland flow. Chalise et
al., (2019; 2020) found this in Nepal, Cerdà et al., (2020) in eastern Spain, Takken et al., (2001) in the
loess belt in Europe, and Tullberg et al., (2001) in Australia.
On the other hand, the magnitude of the runoff discharge was determined by the size of the plot
as the larger plots contributed with the lowest runoff discharge (per unit area, mm); however, the total
amount of runoff in the larger plots was higher as the contribution area was larger (see Fig. 8).
Cuadernos de Investigación Geográfica, 47 (1), 2021. pp. 95-119 107Cerdá et al.
Figure 8. Runoff discharge (%) per year and plot per size of the plots (m2).
Table 6 also shows that the high magnitude of low-frequency rainfall events is rare. Only 2 out
of 470 rainfall days were higher than 100 mm day-1, but they generated most of the runoff. The 9 rainfall
events with more than 100 mm contributed 1,291.3 mm of rainfall, and they contribute 458.0, 273.1,
176.4, and 133.6 mm of runoff for the 1, 2, 4, and 16 m2 plots, respectively. On the contrary, the 416
rainfall events (2,394.2 mm) were registered in rainfall events below 30 mm day-1, contributed with
67.1, 45.46, 34.55, and 17.75 mm of runoff. Table 7 shows the rank of the 20th most intense day and
event rainfall event.
Table 7. The rank of the 20 more intense rainfall days and events.
Day Day Event Event
Date mm Date mm
1 28.9.09 140.0 30.9.09 230.0
2 28.2.13 111.0 15.11.12 176.8
3 22.11.11 93.0 9.12.04 167.0
4 28.9.12 90.0 23.11.11 145.5
5 11.11.12 90.0 12.10.07 131.0
6 25.4.13 90.0 11.10.08 119.0
7 26.1.07 80.0 28.2.13 111.0
8 20.3.12 70.0 29.3.04 110.5
9 18.10.07 68.0 25.4.13 100.5
10 11.10.07 67.0 28.9.12 98.0
11 4.12.04 66.0 9.11.06 89.9
12 11.9.06 64.0 14.9.06 88.0
13 12.10.07 64.0 24.3.11 83.5
14 9.10.08 58.0 26.1.07 80.0
15 8.5.08 52.0 30.11.14 72.9
16 8.6.08 52.0 25.4.11 70.0
17 27.9.09 52.0 20.3.12 70.0
18 14.12.09 51.5 29.8.13 70.0
19 28.1.06 50.0 18.10.07 68.0
20 20.10.12 50.0 10.5.08 66.0
108 Cuadernos de Investigación Geográfica, 47 (1), 2021. pp. 95-119Runoff at plot scale during a rare flash flood
Runoff events with over 100 mm event-1 contribute with 52.77% of the whole runoff generated
along the 11 years of research. This means that 9 runoff events within the 311 measured from 2004 to
2014 control the runoff generation at the agriculture plots in El Teularet study site. Fourteen runoff
events generated with total rainfall between 60 and 100 mm event-1 contributed with 21.87%. The ones
from 30 to 60 mm event-1 (39 events) reached 16.97 % and the ones from 10 to 30 mm (107 events)
contributed with 8.39 % of the total runoff. This information confirms that few rainfall events are
responsible for the runoff yield. González-Hidalgo et al., (2009) informed that the USLE database from
the United States Department of Agriculture with 310 plots and 3,195 plot years of data found that 10%
of the rainfall events contribute to 50% of the eroded soils. At the El Teularet study site, 1.9% of the
rainfall events contribute to 52.77% of the runoff. The importance of the runoff event of high intensity
is usually a consequence of specific weather types as Nadal-Romero et al. (2014) found. At the study
sites Rodrigo Comino et al. (2020) found that 60% of the runoff is due to the East winds, the ones from
the Mediterranean Sea that contribute to wet and warm air masses. González-Hidalgo et al. (2013) used
1800 catchments to be found that the contribution of the suspended sediment load at continental scale
was dominated by the 25-largest daily events that delivered 46-63 % of the load, and the 5-largest daily
events 23-39 %.
For instance, the mean contribution of the 25-largest daily events varies between 63% and 46%
of the total load depending on the basin area, while the mean contribution of just the 5-largest events
varies between 39% and 23%. González-Hidalgo et al. (2012) used 594 soil erosion plots from the USLE
database to demonstrate that soil erosion is a compressed process in time, and that runoff such as has
been demonstrated here is generated in few hours along the year. A few numbers of extreme events
control the total runoff generated.
In semiarid ecosystems, the concentration of the rainfall results from a contrasted response
between rainfall events. López-Bermúdez et al. (1998) found that isolated highly intensive rainfall
events, mainly in autumns when there is no crop cover, are the main source of runoff and sediments. We
found a similar response in El Teularet, where the most efficient rainfall events were found also in
autumn such as the one with 140 mm day-1 that delivered 9.75 % of the total runoff after 11 years. The
research of Romero-Diaz et al. (1998) along 9 years of measurements in Murcia (El Ardal research
station) and with similar plot sizes (2 x 8 m) found that the wettest years are the ones with the higher
runoff discharge and that the main runoff discharge was registered in one thunderstorm also in
September (September 29th, 1997) when 86.2 mm contributed with most of the runoff yield.
Tables 6 and 7 show the rainfall and the runoff (for the 4 plots and the total) for the 20 highest
largest rainfall events and the values for the 3, 5, and 10 highest rainfall events. The total runoff (mm)
generated per plot concentrates on the three most intense rainfall events that yield 9.1 percent of the
rainfall but 26 % of the runoff (29.3 % for the plot of 16 m2). The five largest rainfall events contribute
with 37.63 of the runoffs, the 10 highest (22.1 % of the rainfall) reached 54. 46 % of the runoff and the
20 largest rainfall events (34.19 % of the runoff) reached 71.8 % of the runoff. The 310 runoff events
are measured in 11 years are concentrated into 10 rainfall events to reach more than one half of the
runoff and the three highest rainfall events achieve more than ¼ of the total runoff. Table 8 ranks the
runoff events. Table 9 and 10 shows the distribution of the runoff ranks for different rainfall intensities.
Cuadernos de Investigación Geográfica, 47 (1), 2021. pp. 95-119 109Cerdá et al.
Table 8. The rank of the runoff (20 most intense rainfall events) for the four plots and the total discharge (mm).
Runoff Rainfall Plot 1 Plot 2 Pot 3 Plot 4 All plots
Date mm 1 m2 2 m2 4 m2 16 m2 23 m2
nº d/m/y Event (mm) (mm) (mm) (mm) (mm)
1 30.9.09 230.0 80.66 49.28 37.61 25.95 193.51
2 15.11.12 176.8 76.60 44.78 24.15 19.39 164.92
3 9.12.04 167.0 65.35 44.77 27.55 22.01 159.69
3 highest 573.80 222.6 138.8 89.3 67.35 518.1
4 23.11.11 145.5 30.22 18.29 11.42 6.31 66.24
5 12.10.07 131.0 75.56 39.06 27.57 22.83 165.01
5 highest 850.3 328.38 196.20 128.30 96.49 749.36
6 11.10.08 119.0 41.66 22.84 17.47 9.64 91.61
7 28.2.13 111.0 12.52 8.13 3.65 3.56 27.85
8 29.3.04 110.5 45.33 27.61 16.30 13.38 102.61
9 25.4.13 100.5 30.13 18.29 10.63 10.53 69.58
10 28.9.12 98.0 21.33 11.08 6.65 4.37 43.42
10 highest 1389.3 479.33 284.1 183.0 138.0 1084.4
11 9.11.06 89.9 34.69 17.85 13.57 6.24 72.34
12 14.9.06 88.0 15.70 12.33 14.25 6.65 48.92
13 24.3.11 83.5 6.99 4.79 2.55 1.35 15.68
14 26.1.07 80.0 24.38 20.16 13.89 8.39 66.81
15 30.11.14 72.9 8.41 4.33 2.56 1.52 16.82
16 25.4.11 70.0 2.55 0.76 0.89 0.53 4.73
17 20.3.12 70.0 14.22 8.13 3.14 1.60 27.08
18 29.8.13 70.0 8.55 4.33 2.40 0.89 16.16
19 18.10.07 68.0 30.25 20.18 11.34 3.74 65.52
20 10.5.08 66.0 5.13 2.72 2.66 0.98 11.49
20 highest 2147.60 630.17 379.72 250.24 169.86 1429.99
Table 9. The rank of the runoff (20 most intense rainfall events) for the four plots and the total discharge (%).
Runoff Plot Plot 1 Plot 2 Pot 3 Plot 4 All plots
Date Surface 1 m2 2 m2 4 m2 16 m2 23 m2
nº d.m.y (%) (%) (%) (%) (%) (%)
1 30.9.09 3.7 9.29 9.24 10.46 11.29 9.72
2 15.11.12 2.8 8.82 8.40 6.71 8.43 8.28
3 9.12.04 2.7 7.52 8.40 7.66 9.57 8.02
3 highest 9.1 25.63 26.03 24.83 29.30 26.02
4 23.11.11 2.3 3.48 3.43 3.18 2.74 3.33
5 12.10.07 2.1 8.70 7.32 7.66 9.93 8.29
5 highest 13.5 37.81 36.79 35.67 41.97 37.63
6 11.10.08 1.9 4.80 4.28 4.86 4.19 4.60
7 28.2.13 1.8 1.44 1.52 1.01 1.55 1.40
8 29.3.04 1.8 5.22 5.18 4.53 5.82 5.15
9 25.4.13 1.6 3.47 3.43 2.95 4.58 3.49
10 28.9.12 1.6 2.46 2.08 1.85 1.90 2.18
10 highest 22.1 55.19 53.28 50.88 60.01 54.46
11 9.11.06 1.4 3.99 3.35 3.77 2.72 3.63
12 14.9.06 1.4 1.81 2.31 3.96 2.89 2.46
13 24.3.11 1.3 0.80 0.90 0.71 0.59 0.79
14 26.1.07 1.3 2.81 3.78 3.86 3.65 3.36
15 30.11.14 1.2 0.97 0.81 0.71 0.66 0.84
16 25.4.11 1.1 0.29 0.14 0.25 0.23 0.24
17 20.3.12 1.1 1.64 1.52 0.87 0.70 1.36
18 29.8.13 1.1 0.98 0.81 0.67 0.39 0.81
19 18.10.07 1.1 3.48 3.78 3.15 1.63 3.29
20 10.5.08 1.1 0.59 0.51 0.74 0.43 0.58
20 highest 34.19 72.56 71.20 69.57 73.88 71.81
110 Cuadernos de Investigación Geográfica, 47 (1), 2021. pp. 95-119Runoff at plot scale during a rare flash flood
Table 10. Distribution of the runoff discharge per rainfall events.
Plot Plot 1 Plot 2 Pot 3 Plot 4 All plots
Surface 1 m2 2 m2 4 m2 16 m2 23 m2
(l) (l) (l) (l) (l)
>100 458.00 273.07 176.35 133.60 All plots
>60 197.96 121.83 85.01 41.82 446.62
>30 145.41 92.98 63.77 36.73 338.90
>10 67.10 45.46 34.55 17.75 164.85
>5 0 0 0 0 0
>0 0 0 0 0 0
Total 868.47 533.34 359.68 229.90 1991.39
Plot Plot 1 Plot 2 Pot 3 Plot 4 Total
Surface 1 m2 2 m2 4 m2 16 m2 23 m2
(%) (%) (%) (%) (%)
>100 52.74 51.20 49.03 58.11 52.28
>60 22.79 22.84 23.63 18.19 22.43
>30 16.74 17.43 17.73 15.98 17.02
>10 7.73 8.52 9.61 7.72 8.28
>5 0 0 0 0 0
>0 0 0 0 0 0
Total 100.00 100.00 100.00 100.00 100.00
3.4. Runoff generation and connectivity
The results of the 11 years of measurements at El Teularet research station demonstrate that the
runoff at the plot scale (from 1 to 16 m2) is highly determined by the size of the plot. As larger is the
plot lower is the runoff discharge per unit, suggesting that the average duration of the runoff event –
after the soil becomes saturated till the end of the rainfall event plus the duration of runoff-flow after
ending precipitation– depends on the drainage area (López-Vicente and Navas, 2012). Another key
information delivered in this research is that after 311 runoff events at the plot scale, 160 resulted in
effective runoff at the plot scale, but only 1 delivered runoff to the stream (Barranco de Benacancil). A
concept that can help to understand the hydrological behavior of the dry (ephemeral) rivers in the
Mediterranean is the connectivity concept, as the loss of the overland flow discharge is due to how the
flows are connected. The right term to be used under the Mediterranean karstic hydrological system is
Dis-Connectivity, as it is rare that the runoff generated at pedon and slope scale will reach the stream.
The use of the connectivity concept can help for the understanding of the geomorphic systems and the
hydrological cycle in the continents (Bracken and Croke, 2007; Masselink et al., 2017).
The connectivity of the flows explains also the sediment reallocation along slopes and
watersheds and affects the distribution of the vegetation (Keesstra et al., 2018; Gerenmew and Triest,
2019). In El Teularet, the tilled plots induce higher connectivity than a forest due to the lack of vegetation
that reduces the connectivity of the flows, and because agricultural land is better connected than the
forest ones due to the high density of roads, drainages, and bare soil surfaces (Keesstra et al., 2019). The
smoothed topography of the agricultural land also contributes to high connectivity (Yu and Harbour,
2019) than can be only reduced by the ridges such as Rodrigo-Comino et al. (2018a) found in
agricultural land cultivated with vineyards. The connectivity concept can also be used to investigate
degradation thresholds in arid and semiarid ecosystems such as Saco et al. (2020) did.
In El Teularet experiment carried out along 11 years the connectivity of the flows was zero
below 10 mm day-1 of rainfall following the measurements carried out on the four plots. Rainfall events
higher than 10 mm day-1 contribute to runoff, and the discharge was higher as higher was the runoff.
The largest runoff discharges were measured during the high rainfall events. We also demonstrated that
Cuadernos de Investigación Geográfica, 47 (1), 2021. pp. 95-119 111Cerdá et al.
the connectivity of the flows is determined by the length of the plots because as larger the plot lower the
runoff discharge per unit area.
When the slope length increases, there is a reduction in the runoff discharge per unit area due
to the loss of runoff as a consequence of the ponding developed as a consequence of the roughness of
the tillage (Zhao et al., 2018; Luo et al., 2020). The loss of surface flow due to infiltration of runoff due
to macropores (cracks or fauna and plant macropores) and due to the increase in the infiltration as the
pressure of the ponds also explain that the runoff is reduced with the size of the plots (Cerdà and
Rodrigo-Comino, 2020; Jourgholami and Labelle, 2020). The runoff coefficient in small plots increases
more with increasing storm size than in large plots (Fig. 9 and 10). When this trend is extrapolated to
the watershed it is found that only extreme events will generate hortonian overland flow that will reach
the valley bottom and will create a flood event in the channel network, but this only took place along
the study period once in eleven years.
Figure 9. Runoff discharge (l) per year and plot per size of the plots (m2).
Figure 10. Relationship of annual rainfall on runoff discharge for the four plots (1, 2, 4, and 16 m2) from
2004 till 2014.
112 Cuadernos de Investigación Geográfica, 47 (1), 2021. pp. 95-119Runoff at plot scale during a rare flash flood
In other studies, it was identified that under Mediterranean climatic conditions the hydrological
system is disconnected from the stream network (Masselink et al., 2017). And the runoff in the channel
used to originates from close areas to the channel network or from roads and degraded areas near the
talweg. The contribution of the throughflow or groundwater flow at the study site is negligible due to
the karstic system that allows the infiltrated water to deeply percolate in the aquifer. This behavior was
found also on vineyards where the tillage induces the formation of ridges underneath the vines and
reduces the runoff generated and the connectivity of the flows (Rodrigo-Comino et al., 2018b) that only
new plantations increase the flows.
During large events, the hydrological system becomes connected through overland flow, which
is mainly hortonian overland flow, but this is very rare in the study area due to the low connectivity of
the flows such as show the influence of the length of the plot. During these events also sediment is
transported to the channel network, which means that the hydrological system also dis-connects the
sediment transport system that is only active for a few days or even hours. This is relevant on agricultural
land where soil erosion is very active due to the degradation of the soil organic matter and where land
abandonment is relevant (Lasanta et al., 2019). The runoff generated in the slopes is highly dependent
on the weather types such as Rodrigo-Comino et al. (2020) demonstrated. Recently, approaches to show
the spatio-temporal changes of floods generation confirms the relevance of the runoff generated at pedon
and slope scale (Contreras et al., 2021), and snow is relevant on mountainous areas (Pisabarro, 2020)
and were the runoff connectivity and soil losses are encouraged by the trails (Salesa and Cerdà, 2019).
In the case of the study at hand, the dis-connectivity is an extreme case due to the local
conditions. The limestone (karst) induces high percolation, the marly areas devoted to agriculture land
are located in some patches that also show low connectivity within the slope and negligible with the
river. The connection between the runoff producing hillslopes and the channel network is only
established during an extreme event, such as the one measured in September 2009.
4. Conclusions
Eleven years of measurements employing plots of different sizes (1 to 16 m2) and an assessment
of the floods in the stream allow us to conclude that there is very deficient connectivity between the
slope and the streams. Within the slope under tillage recurrent runoff events (160 in 11 years) were
measured, but the runoff discharge is disconnected with the stream (1 runoff event in 11 years). The
concentration of the runoff in a few rainfall events also contributes to the lack of connectivity in most
of the rainfall events. The three most intense rainfall events contributed to 26 % of the runoff in 11 years.
Ten rainfall events contributed to 55 % of the runoff at the plot scale. A 140 mm day-1 rainfall event
connected the runoff from the plots to the Barranco de Benacancil creek. No other rainfall event
contributed to a flood at a watershed scale.
Acknowledgments
Artemi Cerdà thanks the Co-operative Research program from the OECD (Biological Resource
Management for Sustainable Agricultural Systems) for its support with the 2016 CRP fellowship
(OCDE TAD/CRP JA00088807), POSTFIRE Project (CGL2013-47862-C2-1 and 2-R), and
POSTFIRE_CARE Project (CGL2016-75178-C2-2-R) sponsored by the Spanish Ministry of Economy
and Competitiveness and AEI/FEDER, UE. This paper was written as a result of the collaboration that
was initiated due to the COST ActionES1306: Connecting European Connectivity research and COST
CA18135 FIRElinks: Fire in the Earth System. Science and Society. We wish to thank the Department
of Geography secretariat team (Nieves Gómez, Nieves Dominguez, and Susana Tomás) for their support
for three decades to our research at the Soil Erosion and Degradation Research team (SEDER), with
special thanks to the scientific researchers that as visitors from other research teams contributed to the
Cuadernos de Investigación Geográfica, 47 (1), 2021. pp. 95-119 113Cerdá et al.
SEDER research. And we also thank the Laboratory for Geomorphology technicians (León Navarro)
for the key contribution to our research. The collaboration of the Geography and Environmental
Sciences students was fruitful and enjoyable.
References
Alpert, P., Ben‐Gai, T., Baharad, A., Benjamini, Y., Yekutieli, D., Colacino, M., Diodato, L., Ramis, C., Homar,
V., Romero, R., Michaelides, S., Manes, A. 2020. The paradoxical increase of Mediterranean extreme
daily rainfall in spite of decrease in total values. Geophysical Research Letters 29 (11), 31-1.
https://doi.org/10.1029/2001GL013554
Bagarello, V., Ferro, V., Keesstra, S., Comino, J.R., Pulido, M., Cerdà, A. 2018. Testing simple scaling in soil
erosion processes at plot scale. Catena 167, 171-180. https://doi.org/10.1016/j.catena.2018.04.035
Bannari, A., Kadhem, G., El-Battay, A., Hameid, N.A., Rouai, M. 2016. Assessment of land erosion and sediment
accumulation caused by runoff after a flash-flooding storm using topographic profiles and spectral
indices. Advances in Remote Sensing 5(4), 315-354. https://doi.org/10.4236/ars.2016.54024
Bauer, T., Ingram, V., De Jong, W., Arts, B. 2018. The socio-economic impact of extreme precipitation and
flooding on forest livelihoods: evidence from the Bolivian Amazon. International Forestry Review 20
(3), 314-331. https://doi.org/10.1505/146554818824063050
Beguería, S., López‐Moreno, J.I., Gómez‐Villar, A., Rubio, V., Lana‐Renault, N., García‐Ruiz, J.M. 2006. Fluvial
adjustments to soil erosion and plant cover changes in the Central Spanish Pyrenees. Geografiska
Annaler: Series A, Physical Geography 88 (3), 177-186. https://doi.org/10.1111/j.1468-
0459.2006.00293.x
Bhattarai, R., Dutta, D. 2007. Estimation of soil erosion and sediment yield using GIS at catchment scale. Water
Resources Management 21(10), 1635-1647. https://doi.org/10.1007/s11269-006-9118-z
Bracken, L.J., Croke, J. 2007. The concept of hydrological connectivity and its contribution to understanding
runoff‐dominated geomorphic systems. Hydrological Processes 21(13), 1749-1763.
https://doi.org/10.1002/hyp.6313
Bronstert, A., Vollmer, S., Ihringer, J. 1995. A review of the impact of land consolidation on runoff production
and flooding in Germany. Physics and Chemistry of the Earth, 20 (3-4), 321-329.
Cammeraat, E.L. 2004. Scale dependent thresholds in hydrological and erosion response of a semi-arid catchment
in southeast Spain. Agriculture, Ecosystems & Environment 104(2), 317-332.
https://doi.org/10.1016/j.agee.2004.01.032
Cerdà, A., Rodrigo-Comino, J. 2020. Is the hillslope position relevant for runoff and soil loss activation under high
rainfall conditions in vineyards? Ecohydrology & Hydrobiology, 20(1), 59-72.
https://doi.org/10.1016/j.ecohyd.2019.05.006
Cerdà, A., Keesstra, S.D., Rodrigo-Comino, J., Novara, A., Pereira, P., Brevik, E., Giménez-Morera, A.,
Fernández-Raga, M., Pulido, M., di Primal, S., Jordán, A. 2017. Runoff initiation, soil detachment and
connectivity are enhanced as a consequence of vineyards plantations. Journal of Environmental
Management 202, 268-275. https://doi.org/10.1016/j.jenvman.2017.07.036
Cerdà, A., Rodrigo-Comino, J., Giménez-Morera, A., Keesstra, S.D. 2017. An economic, perception and
biophysical approach to the use of oat straw as mulch in Mediterranean rainfed agriculture land.
Ecological Engineering 108, 162-171. https://doi.org/10.1016/j.ecoleng.2017.08.028
Cerdà, A., Rodrigo-Comino, J., Novara, A., Brevik, E.C., Vaezi, A.R., Pulido, M., Giménez-Morera, A., Keesstra,
S.D. 2018. Long-term impact of rainfed agricultural land abandonment on soil erosion in the Western
Mediterranean basin. Progress in Physical Geography: Earth and Environment 42(2), 202-219.
https://doi.org/10.1177/0309133318758521
Cerdà, A., Rodrigo-Comino, J., Yakupoğlu, T., Dindaroğlu, T., Terol, E., Mora-Navarro, G., Arabameri, A.,
Radziemska, M., Novara, A., Kavian, A., Vaverková, M.D., Abd-Elmabod, S.K., Hammad, H.M.,
114 Cuadernos de Investigación Geográfica, 47 (1), 2021. pp. 95-119Runoff at plot scale during a rare flash flood
Daliakopoulos, I.N. 2020. Tillage Versus No-Tillage. Soil Properties and Hydrology in an Organic
Persimmon Farm in Eastern Iberian Peninsula. Water 12(6), 1539. https://doi.org/10.3390/w12061539
Chalise, D., Kumar, L., Kristiansen, P. 2019. Land degradation by soil erosion in Nepal: a review. Soil Systems
3(1), 12. https://doi.org/10.3390/soilsystems3010012
Chalise, D., Kumar, L., Sharma, R., Kristiansen, P. 2020. Assessing the impacts of tillage and mulch on soil erosion
and corn yield. Agronomy 10(1), 63. https://doi.org/10.3390/agronomy10010063
Contreras, F.I., Mastretta, G.M., Piccolo, M.C., Perillo, G.M.E. 2021. Spatio-temporal variability monitoring of
the floods in the center-west of the Buenos Aires Province (Argentina) using remote sensing techniques.
Geographical Research Letters (Cuadernos de Investigación Geográfica) 47.
https://doi.org/10.18172/cig.4477
Daliakopoulos, I.N., Tsanis, I.K. 2012. A weather radar data processing module for storm analysis.
Hydroinformatics 14 (2), 332-344. https://doi.org/10.2166/hydro.2011.118
De Vente, J., Poesen, J. 2005. Predicting soil erosion and sediment yield at the basin scale: scale issues and semi-
quantitative models. Earth-Science Reviews 71(1-2), 95-125. https://doi.org/10.1016/j.earscirev.2005.02.002
Downs, P.W., Thorne, C.R. 2000. Rehabilitation of a lowland river: reconciling flood defence with habitat
diversity and geomorphological sustainability. Journal of Environmental Management 58(4), 249-268.
https://doi.org/10.1006/jema.2000.0327
Dunne, T., Dietrich, W.E. 1980. Experimental investigation of Horton overland flow on tropical hillslopes. 2.
Hydraulic characteristics and hillslopes hydrographs. Zeitschrift für Geomorphologie 35, 60-80.
Geremew, A., Triest, L. 2019. Hydrological connectivity and vegetative dispersal shape clonal and genetic
structure of the emergent macrophyte Cyperus papyrus in a tropical highland lake (Lake Tana, Ethiopia).
Hydrobiologia 843(1), 13-30. https://doi.org/10.1007/s10750-017-3466-y
González-Hidalgo, J.C., Batalla, R.J., Cerda, A. 2013. Catchment size and contribution of the largest daily events
to suspended sediment load on a continental scale. Catena 102, 40-45.
https://doi.org/10.1016/j.catena.2010.10.011
González-Hidalgo, J.C., Batalla, R.J., Cerda, A., de Luis, M. 2012. A regional analysis of the effects of largest
events on soil erosion. Catena 95, 85-90. https://doi.org/10.1016/j.catena.2012.03.006
González‐Hidalgo, J.C., de Luis, M., Batalla, R.J. 2009. Effects of the largest daily events on total soil erosion by
rainwater. An analysis of the USLE database. Earth Surface Processes and Landforms 34 (15), 2070-
2077. https://doi.org/10.1002/esp.1892
Guhathakurta, P., Sreejith, O.P., Menon, P.A. 2011. Impact of climate change on extreme rainfall events and flood
risk in India. Journal of Earth System Science 120 (3), 359
Hamilton, L.S. 1987. What are the impacts of Himalayan deforestation on the Ganges-Brahmaputra lowlands and
delta? Assumptions and facts. Mountain Research and Development 7 (3), 256-263.
https://doi.org/10.2307/3673202
Horton, R.E. 1933. The role of infiltration in the hydrologic cycle. Eos, Transactions American Geophysical Union
14 (1), 446-460.
Hümann, M., Schüler, G., Müller, C., Schneider, R., Johst, M., Caspari, T. 2011. Identification of runoff processes–
The impact of different forest types and soil properties on runoff formation and floods. Journal of
Hydrology 409 (3-4), 637-649. https://doi.org/10.1016/j.jhydrol.2011.08.067
Jourgholami, M., Labelle, E.R. 2020. Effects of plot length and soil texture on runoff and sediment yield occurring
on machine-trafficked soils in a mixed deciduous forest. Annals of Forest Science, 77 (1), 1-11.
https://doi.org/10.1007/s13595-020-00938-0
Kalantari, Z., Ferreira, C.S.S., Keesstra, S., Destouni, G. 2018. Nature-based solutions for flood-drought risk
mitigation in vulnerable urbanizing parts of East-Africa. Current Opinion in Environmental Science &
Health 5, 73-78. https://doi.org/10.1016/j.coesh.2018.06.003
Keesstra, S.D. 2007. Impact of natural reforestation on floodplain sedimentation in the Dragonja basin, SW
Slovenia. Earth Surface Processes and Landforms 32 (1), 49-65. https://doi.org/10.1002/esp.1360
Cuadernos de Investigación Geográfica, 47 (1), 2021. pp. 95-119 115You can also read


