Interrelationships between the structural, spectroscopic, and antibacterial properties of nanoscale ( 50 nm) cerium oxides - Nature
←
→
Page content transcription
If your browser does not render page correctly, please read the page content below
www.nature.com/scientificreports
OPEN Interrelationships
between the structural,
spectroscopic, and antibacterial
properties of nanoscale (< 50 nm)
cerium oxides
Neelam Iqbal1*, Antonios Anastasiou2, Zabeada Aslam1, El Mostafa Raif3, Thuy Do3,
Peter V. Giannoudis4 & Animesh Jha1*
Bone healing is a complex process, and if not managed successfully, it can lead to non-union, metal-
work failure, bacterial infections, physical and psychological patient impairment. Due to the growing
urgency to minimise antibiotic dependency, alternative treatment strategies, including the use of
nanoparticles, have attracted significant attention. In the present study, cerium oxide nanoparticles
(Ce4+, Ce3+) have been selected due to their unique antibacterial redox capability. We found the
processing routes affected the agglomeration tendency, particle size distribution, antibacterial
potential, and ratio of Ce3+:Ce4+ valence states of the cerium oxide nanoparticles. The antibacterial
efficacy of the nanoparticles in the concentration range of 50–200 µg/ml is demonstrated against
Escherichia coli, Staphylococcus epidermis, and Pseudomonas aeruginosa by determining the half-
maximal inhibitory concentration (IC50). Cerium oxide nanoparticles containing a more significant
amount of Ce3+ ions, i.e., FRNP, exhibited 8.5 ± 1.2%, 10.5 ± 4.4%, and 13.8 ± 5.8% increased
antibacterial efficacy compared with nanoparticles consisting mainly of Ce4+ ions, i.e., nanoparticles
calcined at 815 °C.
Bone infections are frequent due to the increasing incidence of trauma and elective s urgeries1–3. Despite all
the efforts to maintain an aseptic operating environment, infectious bacteria may be present during treatment,
in the air in the operating room, surgical equipment, contaminated orthopaedic/medical device, and resident
microbiota already present on the patient’s s kin4. Epidemiological studies suggest that between 2 and 5%5,6 of
all implant-related procedures are likely to be further complicated due to post-operative infections, leading to
increased substantial health-related costs and prolonged hospitalisation, revision surgeries, and m ortality7–9.
The treatment of infection is complex involving parenteral or systemic drug administration and, in extreme
cases, debridement of bone and tissue due to compromised blood c irculation10. Drug administration for infec-
tion control uses a broad range of antibiotics, leading to multidrug-resistant bacterial strains8,11. As a result, the
treatment of infectious diseases requires higher and prolonged dosages of multiple antibiotics, often leading to
intolerable toxicity.
Biofilm refers to a well-organised community of bacteria surrounded by a matrix for protection that usually
adheres to a surface/implant within the human body. Bacteria being in a planktonic state enable a change in
the gene expression pattern. The genes responsible for producing bacterial extracellular polymeric substances
(EPS) are activated and e xpressed12. The excretion of EPS further facilitates the exponential growth of bacteria
leading to biofilm f ormation7,13,14. The presence of a biofilm hinders the host’s immune response and antibiotic
delivery; hence, biofilms are one of the major causes of bacterial resistance d evelopment8. Due to the growing
urgency to minimise antibiotic dependency, alternative treatment strategies, including the use of nanoparticles,
have attracted significant attention as these types of particles manifest unique physicochemical properties. The
1
School of Chemical and Process Engineering, University of Leeds, Leeds, UK. 2Department of Chemical
Engineering and Analytical Science, University of Manchester, Manchester, UK. 3School of Dentistry, Wellcome
Trust Brenner Building, University of Leeds, Leeds, UK. 4Academic Department of Trauma and Orthopaedic
Surgery, School of Medicine, University of Leeds, Leeds, UK. *email: N.Iqbal2@leeds.ac.uk; A.Jha@leeds.ac.uk
Scientific Reports | (2021) 11:20875 | https://doi.org/10.1038/s41598-021-00222-9 1
Vol.:(0123456789)
www.nature.com/scientificreports/
unique properties are only apparent on the nanoscale, e.g., surface area to volume ratio, surface charge, and
valence state compared with bulk c ounterparts15.
Emerging trends in antibacterial control are to deliver nanoparticles at the site and control bacterial prolif-
eration by stopping the enzyme and gene expression. Several types of inorganic nanoparticles (ZnO, T iO2, Ag)
emerge as novel antibacterial agents and have proven their effectiveness in treating infectious d iseases16. The
antibacterial efficacy of nanoparticles is affected by the size, shape, surface charge, and surface area to volume
ratio15. Nanoparticles size is essential with regards to biological functions as the morphological dimensions are
comparable with (i) small biological molecules (1–10 nm), (ii) viruses (10–100 nm), and (iii) the ability to attack
biological entities without changing their f unctions15. The antibacterial mechanism is likely to be attributed to the
nanoparticles’ ability to enter biofilms; unlike antibiotics, nanoparticles directly attack the cell wall of bacteria by
attaching via (i) electrostatic interaction, (ii) Van der Waals forces as well as (iii) receptor-ligand and hydrophobic
interactions8 disrupting the integrity of the bacterial cell wall leading to cell death17.
Ceramic nanoparticles for antibacterial properties
Nanoparticles can prevent bacteria from mutating via cell death, replacing or reducing conventional a ntibiotics18.
The antibacterial properties of metal and metal oxide nanoparticles such as silver19, copper20, zinc oxide21, and
titanium dioxide22 are known to alter the metabolic activity of Gram-positive and Gram-negative b acteria8. Zinc
oxide nanoparticles are found to inhibit Staphylococcus aureus, whereas concentration-dependent silver nanopar-
ticles exhibited antimicrobial activity against Escherichia coli and Pseudomonas aeruginosa23. However, specific
nanoparticles, i.e. silver, are toxic to host cells even at low doses despite exhibiting antibacterial properties24.
Additionally, triangular-shaped silver particles exhibited higher antibacterial properties than spherical or rod-
shaped nanoparticles25. Nano-silver intraperitoneal injection and its dispersion through blood adversely affect
the lungs, liver, gastroenterological tract and brain t issues26. For this reason, the use of silver in treating internal
infections is now severely curtailed. Other studies have reported g old27, magnesium o xide28 and copper o xide8,29,30
based nanoparticles prevented the formation of biofilm, which is linked to the high surface area-to-mass ratio,
i.e., smaller sized less than 10 nm7,8.
Cerium oxide particles and processes
Cerium oxide nanoparticles have attracted a great deal of interest as antibacterial agents due to the ability to
cycle between the two valences states (Ce3+ and Ce4+), leading to the formation of oxygen vacancies in the lattice.
The apparent beneficial oxygen buffering capability enables the nanoparticles to act as a catalyst for oxidation
and reduction reactions31, manifesting a unique antibacterial mechanism18. The intrinsic bivalence of cerium
oxide nanoparticles induces antioxidant capabilities32 (catalytic oxidation and reduction), protecting the cells
from oxidative stress, i nflammation33, and potential radiation d amage34. Nanoscale cerium oxide can mimic an
antioxidant enzyme superoxide dismutase found in all living c ells35. Superoxide dismutase, catalase and glu-
tathione are considered the body’s cellular defence as they catalyse the breakdown of potentially harmful oxygen
molecules known as reactive oxygen species (ROS)/free radicals, thus, preventing tissue damage within the body.
The primary role of antioxidants is to reduce excessive amounts of ROS/free radicals, hence combating oxidative
stress-related diseases36. Nanoscale cerium oxide presents relatively low or no toxicity to mammalian c ells37–40
and is proven to decrease catalysts of chronic inflammation via nanotherapeutics33, as well as demonstrating the
ability to enhance neuroprotection41.
Cerium oxide nanoparticles exhibit pro-oxidative behaviour, depending on the environment, i.e., oxidative
stress is induced directed at b acteria42. Conversely, several studies conclude no apparent antibacterial effect of
cerium oxide n anoparticles43,44. However, other findings highlight possible adverse effects of the cerium oxide
nanoparticles, where oxidative stress was induced in epithelial human lung c ells45. The range of conflicting data
in the literature may be attributed to varying manufacturing processes, chemical solvents not entirely removed,
irregular pH during production and increased calcination t emperatures46. The redox properties of cerium oxide
nanoparticles can be tuned via materials preparation method, drying method, particle size, surface chemistry,
particle shape and level of dopant m aterials31. The drying method of nanoparticles is a vital aspect to consider
as nanoparticles tend to agglomerate, which adversely affects the physicochemical properties of the particles47.
Thus, the procedures employed to evaluate the antimicrobial and antibacterial properties associated with cerium
oxide nanoparticles may also make it challenging to form significant conclusions.
Crystalline defect structure
In the fluorite structure of cerium oxide, the redox equilibrium between the two valence states ( Ce3+:Ce4+) may
be explained by considering the reaction in the presence of oxygen gas, as shown in Eq. (1):
1
2CeO2 (s) = Ce2 O3 (s) + O2 g (1)
2
The Ce–O phase diagram shown in Fig. 1 highlights the solid solution homogeneity region for CeO2 whilst also
confirming the presence of C e2O3 as a separate compound. CeO2 can be considered in terms of oxygen vacan-
cies where the intrinsic presence of oxygen vacancies in the CeO2 crystal structure renders CeO2 into a CeO2-x
non-stoichiometric oxide with ’x’ vacant oxygen sites48. The ratio of Ce3+:Ce4+ ionic states compensate against
vacant oxygen sites and may be represented by the following equation:
CeO2 (s) = CeO2−x (s) = Ce4+ 3+ 2− 4+ 3+ 2−
1−x Cex O2−0.5x (s) = Ce1−x Cex O2−0.5x x (s) (2)
Scientific Reports | (2021) 11:20875 | https://doi.org/10.1038/s41598-021-00222-9 2
Vol:.(1234567890)www.nature.com/scientificreports/
Figure 1. The phase diagram of Cerium-Oxygen system showing non-stoichiometric cerium adapted from H.
Okamoto, Journal of Phase Equilibria and Diffusion volume 29, pages 545–547 (2008)49.
In Eq. (2), the oxygen vacancy is shown by x where x is the fractional value of vacant sites in the fluorite struc-
ture. The oxygen vacancies in the C eO2-0.5× fluorite are dependent on the oxygen partial pressure and tempera-
ture during heat treatment; thus, they are likely to determine the equilibrium ratios of the two valence states,
expressed in Eqs. (1) and (2).
In the present work, cerium oxide nanoparticles ( Ce4+:Ce3+) have been selected for detailed investigation of
synthesis, structural spectroscopic analysis, and antibacterial properties. We have investigated and characterised
the properties of three types of nanoscale cerium oxides, i.e., commercial nanoparticles (RNP4), freeze-dried
(FRNP), and calcined (C280, C385 and C815). The analysis of bacterial growth in the presence of synthesised
bivalent cerium oxide nanoparticles has also been explored to investigate the antibacterial efficacy of cerium
oxide nanoparticles with varying Ce4+:Ce3+ ratios. Common Gram-negative and Gram-positive bacteria associ-
ated with orthopaedic infections, i.e. E. coli (−ve)50,51, P. aeruginosa (−ve)52,53 and S. epidermis (+ve)4,50,54 were
selected. The half-maximal inhibitory concentrations (IC50) were determined, corresponding to reducing bacte-
rial growth by 50%.
Experimental
Reagents and materials. Reagents and materials used for the synthesis of cerium oxide nanoparticles
were of analytical grade (99.99% pure), i.e., cerium nitrate hexahydrate (Ce(NO3)3·6H2O) [Sigma-Aldrich, CAS:
10294-41-4], cerium (IV) oxide (CeO2) [Sigma-Aldrich, CAS: 1306-38-3], cerium (III) phosphate (CePO4) [Alfa
Aesar, CAS: 13454-71-2], and sodium hydroxide (NaOH) [Sigma-Aldrich, CAS: 1310-73-2].
Material synthesis. Freeze‑dried cerium oxide nanoparticles. The nanoparticles were synthesised via a
hydroxide mediated method where Ce(NO3)3·6H2O was used as a precursor, as described below in reaction
steps 3–5. Hydroxide medicated approach was chosen based on the simplicity, reproducibility, and ability to
synthesise spherical nanoparticles. As demonstrated by our results, the hydroxide synthesis route also offers
better control over particle size and valence state distribution, which is essential for controlling the antibacterial
properties reported. Briefly, 10.85 g Ce(NO3)3·6H2O(s) was dissolved in 250 ml distilled water under continu-
ous stirring for 20 min resulting in a 0.1 M solution (A). Then 0.3 M NaOH solution was added dropwise under
continuous stirring to the solution (A) at 50 °C for promoting hydrolysis of cerium oxide nanoparticles summa-
rised via Eqs. (3)–(5). The solution was covered with aluminium foil and left at 50 °C under continuous stirring
for 24 h. The nanoparticles were filtered and washed five times with distilled water and ethanol. The collected
nanoparticles were frozen at –80 °C for 24 h and then placed into a freeze drier set at −100 °C and pressure of
43 mTorr for 24 h.Synthesis reaction
Ce (NO3 )3 6 H2 O + 3 NaOH → Ce(OH)3 + 3 Na (NO3 ) + 6 H2 O (3)
Precipitation
Ce3+ + 3 OH− → Ce (OH)3 (s) (4)
Oxidation
4 Ce3+ + 12 OH− + O2 → 4 CeO2(s) + 6 H2 O (5)
Scientific Reports | (2021) 11:20875 | https://doi.org/10.1038/s41598-021-00222-9 3
Vol.:(0123456789)www.nature.com/scientificreports/
Code Description Chemical formula Synthesis
RNP4 Cerium oxide CeO2 Sigma-Aldrich, CAS: 1306-38-3
FRNP Freeze dried – Hydroxide mediated approach then freeze-dried
FUNP Furnace dried – Hydroxide mediated approach then dried @ 80 °C
C280 Calcined @ 280 °C – Heat treatment of FUNP (280 °C, 2 h)
C385 Calcined @ 385 °C – Heat treatment of FUNP (385 °C, 2 h)
C815 Calcined @ 815 °C – Heat treatment of FUNP (815 °C, 2 h)
Table 1. Summary of commercial and synthesised nanoparticles with the post-synthesis cryogenic and
thermal treatments.
Furnace dried cerium oxide nanoparticles. The hydroxide mediated synthesised cerium oxide nanoparticles
were placed into a furnace at 80 °C for 24 h for drying. Thermal analysis of the furnace dried powder was used
to determine the optimal calcination temperature. All the synthesised cerium oxide nanoparticles samples are
presented in Table 1 with sample code names, corresponding formulas, and synthesis method.
Characterisation. Thermal analysis. The Perkin Elmer STA 8000, used to study the phase transformation
and chemical reactions, covered the temperature heating range from 30 to 1000 °C. The thermal analysis char-
acterisation of furnace dried ceria was essential for optimising the calcination process without promoting the
growth of nanoparticles. The isochronal heating rate of 20 °C min−1 was used to determine the optimal calcina-
tion temperature for comparative studies for the furnace dried cerium oxide nanoparticles samples.
Fourier transform infrared (FTIR) and ultraviolet–visible (UV–Vis) spectroscopy. The molecular vibration spec-
troscopic analysis of synthesised powders (FUNP, FRNP, C285, C385 and C815) was analysed and characterised
using the attenuated total reflection (ATR) mode in the Vertex 70 FTIR spectrometer. The beam splitter was KBr,
and the light source used was a MIR lamp. Each sample was scanned 32 times in the 400–4000 cm−1 range. The
spectral resolution was 4 cm−1. For the characterisation of the electronic absorption spectra of the nanoparti-
cles, the PerkinElmer®, LAMDA 950 UV/VIS/NIR spectrometer was used. A homogeneous clear suspension of
nanoparticles in deionised water at concentrations of 0.5 mg/ml was used to collect the absorption spectrum
between 190 and 500 nm; in this wavelength range, the valence change due to the electronic states of cerium
oxide is observed.
X‑ray powder diffraction (XRPD). A D8 X-ray powder diffractometer using the Kα radiation of Cu
(λ = 0.15406 nm) was used to determine the crystalline structure of all the samples of synthesised nanoparticles.
For powder diffraction, the samples were analysed in the Bragg angle (2θ) scanning range of 10°–80° at a scan
speed of 5 s with a step size of 0.03°. The recorded patterns were analysed using the HighScore Plus software, and
the Rietveld refinement was employed for peak shape and intensity analysis for ascertaining the crystallinity of
mineral samples.
Transmission electron microscopy (TEM). For TEM analysis, the samples were prepared by ultrasonic disper-
sion of the nanoparticles in methanol, after which several drops were placed onto holey carbon copper TEM
grids. The particles suspended in methanol were then allowed to dry using a heat lamp. The Titan Themis Cubed
300 TEM operated at 300 kV with high brightness X-FEG and Supertwin objective lens was used for the char-
acterisation of the nanoscale size distribution and morphological analysis. The Bright field TEM images were
collected using the Gatan OneView 16 Megapixel CMOS digital camera. The selected area electron diffraction
(SAED) patterns and the low magnification and dark-field (DF) TEM images were obtained to analyse the syn-
thesised ceria’s crystallinity. The electron energy loss spectroscopy (EELs) using the Gatan GIF Quantum ER
imaging filter at low and high energy loss spectra were collected for characterising the coexistence of the two
valence states in the calcined nanoparticles.
Surface area. Micromeritics Tristar 3000 was used to characterise the Brunauer–Emmett–Teller (BET) surface
area of the synthesised nanoparticles using the nitrogen absorption method in the powder bed. The nanoparti-
cles were placed into glass sample tubes, then placed into the FlowPrep™ 060. The powder samples were degassed
with nitrogen and heated at 50 °C for 30 min to remove surface contaminants, i.e., water and absorbed gas.
Bacterial culture and antibacterial properties. The nanoparticles tested during the bacterial experi-
ments were sterilised in an autoclave by suspending the particles in a brain–heart infusion (BHI) broth, which,
when cooled, were used within the hour. Optical density and viable count (in colony-forming units, CFUs)
measurements were carried out to assess the antibacterial characteristics of the nanoparticles over 48 h. An
D600 of 0.015 was selected based on the literature55 and was kept constant for all experi-
initial optical density O
ments to ensure reproducibility. Triplicates of bacterial experiments were conducted, where the data collected
underwent statistical analysis and is displayed as mean ± standard deviation (SD). Significant statistical differ-
Scientific Reports | (2021) 11:20875 | https://doi.org/10.1038/s41598-021-00222-9 4
Vol:.(1234567890)www.nature.com/scientificreports/
50 100 28 100
FRNP FUNP
45 a 26 b 99
99
24
40
98
Heat Flow (mW)
Heat Flow (mW)
98 22
Weight (%)
Weight (%)
35
20 97
30 97
18 96
25
96 16 280oC 385 oC
95
20 14
774oC
95 94
15 378oC 12
288oC
o
815 C
10 94 10 93
100 200 300 400 500 600 700 800 900 100 200 300 400 500 600 700 800 900
Temperature (°C) Temperature (°C)
Figure 2. Simultaneous thermal analysis of synthesised cerium oxide nanoparticles, (a) FRNP nanoparticles
and (b) FUNP nanoparticles, the endothermic peaks signify potential structural changes and a change in the
Ce3+:Ce4+ ratio. The heating temperature range was 30–1000 °C at a heating rate of 20 °C/min.
ences were analysed using a one-way analysis of variance (ANOVA) between the average of two or more results.
Values of p < 0.05 were considered statistically significant.
Brain heart infusion agar plates and broth. Brain–heart infusion (BHI) agar [Sigma Aldrich, BHI Agar #70138]
plates [Sigma-Aldrich, B RAND® disposable petri dish with lid #BR452005] were prepared following the manu-
facturer’s protocol. The solution was sterilised by autoclaving at 121 °C for 15 min. Once the agar solution had
cooled, it was poured into a set of sterile agar plates under aseptic conditions and left to solidify. The agar plates
were then stored at < 4 °C until they were required. The BHI broth [Sigma Aldrich, BHI Broth #53286] was pre-
pared by dissolving 37 g of broth powder in 1 L of distilled water. The broth was autoclaved at 121 °C for 15 min
to sterilise and refrigerated at < 4 °C for future experiments.
Growth of bacterial strains. Bacterial stock cultures of E. coli, S. epidermis and P. aeruginosa were procured
from a stock of 30% glycerol solutions kept at –80 °C. Ten µl sterile loops were used to streak S. epidermis, P.
aeruginosa and E. coli onto Brain Heart Infusion (BHI) agar plates. Inoculated plates were incubated at 37 °C
for 24 h, after which a single colony was picked from each bacterium type and grown in 25 ml of BHI broth in
an incubator at 37 °C 150 rpm for 24 h. This process enabled the production of fresh bacterial suspension for
further use by inoculation.
Optical density measurements without and with nanoparticles. Optical density (OD) measurement is a widely
used method to assess the number of growing bacteria in a culture; thus, the absorbance values of bacterial
suspensions can be measured using a p hotometer56. The initial optical densities of each bacterium type were
measured using the Jenway 6305 UV/Visible Spectrophotometer at 600 nm ( OD600). The bacterium suspensions
were diluted to an OD600 of 0.01555,57 using BHI broth to ensure reproducibility. Triplicate bacterial solutions for
each bacterium were produced, and the growth rate without the addition of the nanoparticles was measured at
2, 4, 24 and 48 h. To investigate the antibacterial properties of selected nanoparticles (FRNP, C385 and C815),
various concentrations (50, 100, and 200 µg/ml) of sterilised nanoparticles suspended in BHI broth were added
to the bacterial suspensions O
D600 of 0.015. The O
D600 was measured after 2, 4, 24, and 48 h and compared with
the optical density measurements of bacterial suspensions containing no nanoparticles. The average values ± SD
are reported.
Results of materials characterisations
Simultaneous thermal analysis. When nanoscale particles are heat-treated, the temperature plays a sig-
nificant role in determining the structural and chemical changes, e.g., higher calcination temperatures often lead
to larger nanoparticle sizes58 which affects the Ce3+:Ce4+ ratio. The simultaneous thermal analysis results for the
synthesised FRNP and FUNP cerium oxide nanoparticles are displayed in Fig. 2. The results indicate a two-step
weight loss process occurring in both types of nanoparticles up to 980 °C. The initial weight loss of ~ 2.3% is
observed between 30 and ~ 280 °C for both the FRNP and FUNP nanoparticles, corresponding to the removal of
adsorbed water in the crystalline structure of cerium oxide nanoparticles58. The second weight losses for FRNP
and FUNP nanoparticles are 2.9% (between ~ 280 and 774 °C) and 4.1% (between ~ 280 and 815 °C).
The peaks observed in FRNP and FUNP nanoparticles are endothermic and occur at different temperatures,
likely due to processing conditions. The total weight loss in FRNP is ~ 5.3% against the ~ 6.4% value for FUNP.
The thermal data for both types of nanoparticles display changes in the baseline, depending on the phase transi-
tion condition. The first two peaks in FRNP at 288 and 378 °C are comparable with the peaks in FUNP at 280
and 385 °C, respectively. The shape of the two endothermic peaks are associated with the rate of water evapora-
tion (free water, water of crystallisation and OH−). The data suggests that the overall phase change reactions in
Scientific Reports | (2021) 11:20875 | https://doi.org/10.1038/s41598-021-00222-9 5
Vol.:(0123456789)www.nature.com/scientificreports/
Figure 3. Comparing the X-ray powder diffraction peak broadening in commercial and synthesised cerium
oxide nanoparticles calcined at 280 °C, 385 °C and 815 °C. The 2θ scanning range was 20°–80° at a scan speed
of 5 s and increment of 0.03°. The obtained data were compared to the reference pattern of cerium oxide JCPDS
00-067-0123.
these two types of ceria nanoparticles are different. Figure 2a shows two high-temperature phase transformation
reactions, one above 500 °C, and the second above 675 °C, with a peak at 774 °C. The overall rate of weight loss
at the ~ 500 °C reference point in the FRNP is much lower than that in the FUNP ceria.
Compared to FUNP, the 500 °C peak is barely discernible due to the magnitude of the ensuing phase trans-
formation, which peaks at 815 °C. Since the shape of an endothermic peak in STA entails the rate of completion
of a corresponding phase transformation, it may be possible to conclude semi-quantitatively that the thermal
behaviour and corresponding phase transformation in FRNP and FUNP differ significantly. The phase trans-
formation above 650 °C in both types of nanoparticles is associated with the reactions exhibited in Eqs. (1) and
(2). Above 500 °C, the rate of weight loss is prolonged, especially for the FRNP nanoparticles. The endothermic
peak temperatures at (i) 280 °C, (ii) 385 °C and (iii) 815 °C for FUNP nanoparticles were selected to investigate
the structural changes further and determine the Ce 3+:Ce4+ ratios.
X‑ray diffraction analysis. The XRD diffraction spectra (Fig. 3) for the synthesised nanoparticles exhibit
eight major characteristic peaks observed at the 2θ values, 28.49°, 33.00°, 47.38°, 56.12°, 58.96°, 69.45°, 76.51°
and 78.89°, which correspond to (111), (200), (220), (311), (222), (400), (331) and (420) Miller indices, respec-
tively. The synthesised nanoparticles are single phased material, as no secondary peaks associated with Ce(OH)3
and Na(NO3) are observed. The X-ray powder diffraction profiles of FRNP and FUNP nanoparticles depict
broader peaks than the commercial powder RNP4. On the other hand, the full width half maximum (FWHM)
for heat-treated nanoparticles became narrower with increasing calcination temperatures, e.g., 280 °C to 815 °C.
The sharp XRD peaks signify an increase in the crystallinity of calcined cerium oxide n anoparticles59.
The cerium oxide nanoparticles analysed crystalline structures agree well with the fluorite phase CeO2 [JCPDS
00-067-0123 reference] with a lattice parameter of a = 5.423 Å, and space group Fm3m. The average crystallite
size ranges were calculated using the Braggs law (n λ = 2 d sin θ), and the Debye–Scherrer formula given below:
D = 0.9 /β cos (θ) (6)
D is the average crystallite size, λ is the X-ray wavelength, β is the FWHM of the Bragg reflection in radians,
and θ is the half of the Bragg angle (2θ). The face-centred cubic (FCC) lattice parameters’ a’ were calculated
from the formula, dhkl = a/[h^2 + k2 + l2]1/2, where dhkl corresponds to the interplanar spacing with Miller indices
h, k and l. Table 2 displays the results of the average size range for the cerium oxide nanoparticles investigated
after Rietveld refinement. The values of the calculated lattice parameters decrease with the increasing calcination
temperature, which increases the average crystallite size of cerium oxide. The room temperature values of the
lattice parameters of cerium oxide in RNP4, FRNP and FUNP nanoparticles are larger in dimension than the
calcined nanoparticles (C280, C385 and C185). The apparent reduction in the lattice dimensions for calcined
nanoparticles may be attributed to reduced lattice defects and oxygen vacancies60.
Brunauer–Emmett–Teller (BET) surface area. The surface area of the cerium oxide nanoparticles was
determined by the physical adsorption of inert gas nitrogen. At a cryogenic temperature of 78 k (− 195 °C),
Scientific Reports | (2021) 11:20875 | https://doi.org/10.1038/s41598-021-00222-9 6
Vol:.(1234567890)www.nature.com/scientificreports/
Sample Lattice cell parameter (Å) Crystallite size (nm) BET surface area (m2 g−1) BJH cumulative pore volume (cm3 g−1)
RNP4 5.41 21.56 ± 6.47 36.72 ± 0.14 0.170
FRNP 5.42 4.29 ± 1.29 71.63 ± 0.47 0.167
FUNP 5.41 6.59 ± 1.97 36.40 ± 0.15 0.153
C280 5.40 6.70 ± 2.01 35.40 ± 0.11 0.162
C385 5.39 7.87 ± 2.37 46.37 ± 0.15 0.179
C815 5.37 32.59 ± 9.78 4.27 ± 0.04 0.028
Table 2. A comparison of the lattice dimensions, average crystallite sizes, BET surface area and pore volumes
of the synthesised cerium oxide nanoparticles.
250
19
FRNP
Pore Area (m2/g nm)
Quantity Adsorbed (cm3/g STP)
200 14 FUNP
C280
9
C385
150 4 C815
-1
100 0 10 20 30 40 50
Pore Diameter (nm)
50
0
0 0.2 0.4 0.6 0.8 1
Relative Pressure P/PO
Figure 4. The dependence of the pore size distribution of processed cerium oxide nanoparticles using N
2
adsorption–desorption isotherms measurements. The inset plot compares the BJH pore diameter distribution
for the synthesised cerium oxide nanoparticles.
nitrogen gas forms an adsorbed monolayer on the surfaces of the nanoparticles. Therefore, the adsorbed gas
monolayer’s measurement as a function of relative pressures yields specific surface area and surface porosity. The
results of the BET surface area measurements displayed in Table 2 decrease with increasing calcination tempera-
ture, suggesting that the average size range of the calcined cerium oxide nanoparticles increases with increasing
temperature, as confirmed from the comparison microscopic analysis of the TEM images in Fig. 6. Nanoparti-
cles exhibit increased surface area compared to their bulk counterparts; the size of nanoparticles is inversely pro-
portional to the surface area; hence, smaller nanoparticles generally exhibit a large surface area. It is evident from
the TEM analysis that there is a particle size range variation for the RNP4 nanoparticles and that this variation
is much more considerable than what is observed in the FRNP and FUNP samples. Additionally, agglomeration
of the nanoparticles was observed for the FRNP, FUNP, C280, and the C385, which are indiscernible because
the molecular nitrogen ( N2) gas with 364 pm was used for the BET surface area measurements. A monatomic
helium gas might be able to discern the differences in surface area due to nanoparticle agglomeration. Figure 4
presents the nitrogen adsorption–desorption isotherms, and the corresponding Barrett-Joyner-Halenda (BJH)
pore size distributions for the synthesised cerium oxide nanoparticles. Nanoparticles exhibiting pore diameters
in the 2–50 nm range are considered mesoporous in nature61. The adsorption–desorption isotherms illustrate
type-IV isotherm curves with H3-type hysteresis loops, which are characteristics of mesoporous structured
nanoparticles containing slit-like pores62,63. The pore diameters increase, while the BJH pore volumes decrease
for nanoparticles calcined at high temperatures, as shown in Table 2.
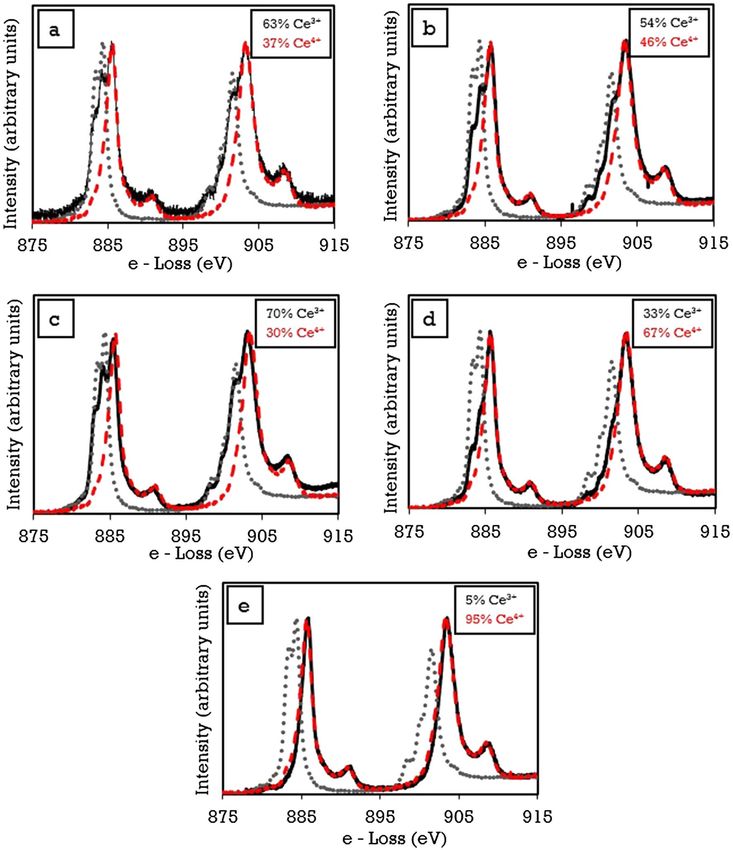
Fourier transform infrared and ultra‑violet visible spectroscopy. The FTIR spectra of all the syn-
thesised cerium oxide nanoparticles appear primarily similar, as shown in Fig. 5. The broad reflectance peak in
the 3500–4000 cm−1 range is attributed to the O–H stretching associated with the hydroxyl molecules on the
surface. The significant peaks at 2050 cm−1 are likely due to atmospheric CO2 and potentially adsorbed CO2 gas
on cerium oxide nanoparticles. As shown in Fig. 5a, the intensity of surface adsorption of C O2 peak at 2050 cm−1
increases with increasing calcination temperatures. The ceria bound gas peak for the FUNP nanoparticles has
a lower peak intensity than the calcined nanoparticles, i.e., C280, C385 and C815, suggesting that atmospheric
CO2 was readily trapped during the furnace heat-treatment process. Resolving the 2050 cm−1 peaks in Fig. 5a
highlights the doublet rotational gas phase, where the calculated peak areas increase with the temperature. The
vibration bands at 500–750 cm−1 are assigned to the Ce–O stretching and agree with cerium oxides’ vibrational
assignments in the literature40,64–66. Electronic state absorbance spectra due to valence changes in the synthesised
cerium oxide nanoparticles are shown in Fig. 5b, where the maximum absorbance peak is located at ~ 210 nm
Scientific Reports | (2021) 11:20875 | https://doi.org/10.1038/s41598-021-00222-9 7
Vol.:(0123456789)www.nature.com/scientificreports/
a
C815
C385
b
Reflectance (%)
C280
FUNP
FRNP
RNP4
1000 2000 3000 4000
Wavenumber (cm-1 )
Figure 5. (a) A comparison of synthesised cerium oxide nanoparticles calcined at 280 °C, 385 °C, and 815 °C
analysed using a Vertex 70 FTIR spectra from 400 to 4000 cm−1. The operating parameters consisted of a
total of 32 scans at a resolution of 4 cm-1 and (b) UV–Vis absorbance spectra obtained from nanoparticle
concentrations of 0.5 mg/ml. The inset Tauc Plot corresponds to the bandgap energies of synthesised cerium
oxide nanoparticles.
region. The electronic absorption spectrum directly represents the ratio of Ce3+ and Ce4+ ion concentrations
on the surface of the nanoparticles. From the comparison of absorption data as a function of temperature, it is
evident that the absorbance and the bandgap energy (eV) are strongly dependent on the heat treatment tem-
perature. The magnitude of absorbance due to C e4+ and Ce3+ increases with the temperature. The correspond-
ing bandgap due to particle size reduces with increasing temperature, as shown in the Tauc plot, from ~ 5.5
to < 5.3 eV, consistent with the bandgap observed in the bulk ceria crystal.
Transmission electron microscopy. The majority of synthesised nanoparticles were nearly spherical,
except in the case of RNP4 and C815 nanoparticles. Based on visual observation of the TEM images in Fig. 6,
the size of the nanoparticles increases with increasing calcination temperatures. The increased particles size with
increasing heat treatment temperatures, and agglomeration contribute to two possible mechanisms, (i) Ostwald
ripening and (ii) Oriented Attachment. Ostwald ripening is temperature-dependent as it influences the inter-
facial surface energies and the growth rate coefficients of the nanoparticles. Larger particles are more energeti-
cally stable than smaller particles; thus, the possible dissolution of the smaller particles led to the growth of the
larger sized nanoparticles. The oriented attachment mechanism is attributed to the aggregation of nanoparticles
which reduces the total energy of the system and the interphase boundaries, thus leading to increase particles
size67. The particles size for RNP4, FRNP, FUNP, C280, C385 and C815 were analysed from high-resolution
TEM (HRTEM) images via ImageJ software, and the average diameter values were found to be 25, 4, 6, 8, 11 and
53 nm, respectively.
Diffraction analysis was also carried out where the three-principle low diffraction index planes for the fluo-
rite structure in cerium oxide are (111), (110) and (100). The dominant lattice fringes observed in the HRTEM
cerium oxide images correspond to the (111) planes, which is expected as the (111) plane is the closest packed
plane in a face-centred cubic structure. The SAED data are therefore consistent with the X-ray powder diffraction
data in Fig. 3, discussed above. The SAED patterns for all samples except RNP4 and C815 nanoparticles depict
continuous ring patterns, indicating the particles’ polycrystalline and nano-structural nature. By comparison,
the RNP4 and C815 nanoparticles’ SAED patterns depict discrete diffraction spots and spread discontinuous
rings, which indicate relatively large-sized nanoparticles. The diffraction rings and reflections appear to agree
with the X-ray diffraction data and confirm the fluorite structure.
Electron energy loss spectroscopy. Cerium oxide is electropositive68 and can exist in two valence
3+ 4+
modes, i.e. Ce and Ce . The EELs measurements were acquired by rastering the beam across several points on
each nanoparticle surface. EELS spectra from two controls ( Ce3+ and C e4+) and five synthesised nanoparticles
are shown in Fig. 7. In each case, the background was removed, and the Fourier-Ratio Deconvolution routines
were applied prior to fitting. From the EELs spectra, the Ce M 4,5 edges of FRNP, FUNP, C280, C385 and C815
spectra are shown where the black lines represent the sample data, the red lines represent the C e4+ ion spectra,
e3+ ion spectra. Oxygen vacancies in cerium oxide form as the calcination tem-
and the grey lines represent the C
perature increases and the equilibrium partial are less than that from Eqs. (1) and (2). When cerium oxide nano-
particles were heat-treated in a muffle furnace in the air at an isotherm, the oxygen loss occurred and reached an
Scientific Reports | (2021) 11:20875 | https://doi.org/10.1038/s41598-021-00222-9 8
Vol:.(1234567890)www.nature.com/scientificreports/
4.0
O
Intensity (kCounts)
3.0 C
2.0 Ce-Lα
a Ce-Lß1Cu-Kα
1.0 Ce-Mα
Ce-Lß2
0.0
100 nm 20 nm 10 1/nm 0.0 5.0 10.0
Energy (keV)
3.0
O
Intensity (kCounts)
2.0
C
b Ce-Lα
1.0 Ce-Mα Ce-Lß1
Cu-Kα
Ce-Lß2
0.0
50 nm 20 nm 10 1/nm 0.0 5.0 10.0
Energy (keV)
6.0 O
Intensity (kCounts)
4.0 C
c Ce-Lα
2.0 Ce-Mα Ce-Lß1Cu-Kα
Ce-Lß2
0.0
100 nm 20 nm 10 1/nm 0.0 5.0 10.0
Energy (keV)
nm
12.0
Intensity (kCounts)
O
8.0
Ce-Lα
d 4.0 Ce-Lß1
Ce-Mα Cu-Kα
C
Ce-Lß2
0.0
100 nm 20 nm 10 1/nm 0.0 5.0 10.0
nm Energy (keV)
20.0
O
Intensity (kCounts)
15.0
Ce-Lα
e 10.0
Ce-Lß1
5.0 C Ce-Mα Cu-Kα
Ce-Lß2
0.0
100 nm 20 nm 10 1/nm 0.0 5.0 10.0
Energy (keV)
nm
20.0 O
Intensity (kCounts)
15.0
Ce-Lα
10.0
f Ce-Lß1
5.0 C Ce-Mα Cu-Kα
Ce-Lß2
0.0
200 nm 20 nm 10 1/nm 0.0 5.0 10.0
Energy (keV)
nm
Figure 6. Comparison of Titan Themis Cubed 300 TEM images of nanoparticles calcined at various
temperatures (a) RNP4, (b) FRNP, (c) FUNP, (d) C280, (e) C385, (f) C815, with the corresponding selected
area electron diffraction patterns and energy dispersive X-ray analysis. The insets for a–f shows the EDX spectra
associated with the synthesised cerium oxide nanoparticles in terms of oxygen and cerium comparison.
equilibrium value manifested by the Ce3+ and Ce4+ ion ratio. The comparison of the Ce3+:Ce4+ ratio for the ceria
particles analysed shows for larger-sized ceria particles, the ratio of Ce3+ and Ce4+ is lower than that in smaller
Scientific Reports | (2021) 11:20875 | https://doi.org/10.1038/s41598-021-00222-9 9
Vol.:(0123456789)www.nature.com/scientificreports/
Figure 7. Normalized EELs spectra depicting the presence of dual valence states. (a) FRNP, (b) FUNP, (c)
C280, (d) C385 and (e) C815. Compared with Ce3+ (grey) and Ce4+ (red) standards.
particles. As the calcination temperature increases, the sintering tendency of particles increases, which reduces
the overall surface area in contact with the surrounding atmosphere. As a result, the number of potential sites
which are likely to lose oxygen reduces. However, not all the oxygen vacancies are filled, leading to a variation in
the Ce3+:Ce4+ ratio. As the size of the nanoparticles increases for calcined samples, the Ce3+:Ce4+ ratio decreases
as the C815 sample contains a 95% majority of Ce4+ ions. The presence Ce4+ in the FRNP, FUNP, C280 and
C385 was calculated to be 37%, 46%, 30%, and 67% respectively. The obtained results confirm that the C e3+:Ce4+
ratio is temperature-dependent. Therefore, the optimal calcination temperature must be characterised to ensure
optimal Ce3+:Ce4+ to provide the highest antibacterial efficacy. Based on the EELs analysis, the FRNP, C385 and
C815 nanoparticles were selected due to the particle size range and C e3+:Ce4+ ratio to be further investigated.
Scientific Reports | (2021) 11:20875 | https://doi.org/10.1038/s41598-021-00222-9 10
Vol:.(1234567890)www.nature.com/scientificreports/
Figure 8. Optical density of the bacteria characterising the antibacterial properties of FRNP after direct
incubation with E. coli, P. aeruginosa and S. epidermidis at 0, 2, 4, 24 and 48 h time points. The error bars are
equivalent to the mean ± standard deviation (SD) (n = 3 in each group).
Bacterial growth
Optical density measurements and IC50. FRNP, C385 and C815 nanoparticles were selected to inves-
tigate the antibacterial properties of nanoparticles due to varying Ce3+:Ce4+ ratio and particle size distribution.
All three types of nanoparticles exhibited antibacterial properties against Gram-positive and Gram-negative
bacteria. However, the FRNP nanoparticles exhibited the greatest antibacterial activity, whereby a 38.8 ± 6.4%
reduction was observed against E. coli. In contrast, a 28.7 ± 10.2% reduction was observed against P. aerugi‑
nosa after 48 h of incubation (Fig. 8). The C385 nanoparticles exhibited 33.5 ± 5.8%, 20.7 ± 8.1% and 13.9 ± 1.1%
reduction of E. coli, P. aeruginosa and Staphylococcus epidermidis, respectively. The lowest antibacterial activity
was observed for C815 nanoparticles with 20.3 ± 7.6%, 18.2 ± 5.8% and 6.4 ± 9.9% bacterial reduction expressed
against E. coli, P. aeruginosa and S. epidermidis, respectively.
The three main antibacterial mechanisms displayed by cerium oxide nanoparticles are (a) cell wall adsorp-
tion, (b) attack proteins or cell transport and (iii) induce oxidative stress. The first antibacterial mechanism
involves the positively charged C eO2 nanoparticles adsorbing via electrostatic interactions onto the negatively
charged bacterial cell walls. The nanoparticles likely block the membrane and remain for a time impairing the
viscosity of the cell wall, thus disrupting the transport exchange69 between the solution and the bacterial c ells17.
The second antibacterial mechanism of C eO2 nanoparticles has been linked to irregularly shaped nanoparticles
causing damage to bacterial walls as demonstrated against Gram-positive b acteria18,70. The third mechanism is
associated with inducing oxidative stress by generating reactive oxygen species (ROS). The ROS are developed
on the bacterial cell wall surfaces from the reversible conversion of C e3+ and Ce4+18. The ROS are known to
attack nucleic acids, proteins and polysaccharides, causing the loss of function, thus leading to the destruction
and decomposition of b acteria71. Based on the results obtained, the relative size of the synthesised nanoparticles
is also related to antibacterial effectiveness. Similar to positively charged particles, nanoparticles with relatively
large surface areas can also adsorb tightly on the negatively charged bacterial cell walls disrupting the membrane
integrity, causing cell lysis72,73.
The half-maximal inhibitory concentrations (IC50) calculated from linear regression models are shown in
Table 4. The FRNP nanoparticles exhibited enhanced antibacterial efficacy than the C385, and C815 nanopar-
ticles, likely attributed to the high surface area to volume ratio and increased C e3+ ions. Smaller sized cerium
Scientific Reports | (2021) 11:20875 | https://doi.org/10.1038/s41598-021-00222-9 11
Vol.:(0123456789)www.nature.com/scientificreports/
IC50 (µg/ml) E. coli P. aeruginosa S. epidermis
FRNP 340 ± 4.0 558 ± 3.9 580 ± 4.6
C385 365 ± 6.6 619 ± 5.2 741 ± 5.6
C815 563 ± 8.2 663 ± 9.4 785 ± 5.8
Table 4. The half-maximal inhibitory concentration (IC50) values of FRNP, C385 and C815 tested with E. coli,
P. aeruginosa and S. epidermidis.
oxide nanoparticles appear more non-stoichiometric with respect to oxygen, which proportionately increases
the number of Ce3+ sites for facilitating the sites for redox reactions. There is contradictory evidence in the litera-
ture regarding increased antibacterial effectiveness against Gram-positive and Gram-negative bacteria. Several
studies have demonstrated superior action of cerium oxide nanoparticles against Gram-negative bacteria E. coli
compared with Gram-positive bacteria Bacillus subtilis74. However, other studies expressed moderate antibac-
terial efficacy against Gram-negative bacteria, i.e., P. aeruginosa and Proteus vulgaris, with increased activity
against Gram-positive bacteria S. aureus and Streptococcus pneumoniae70,75. The variation of the cerium oxide
antibacterial properties is likely related to possible oxygen defects in the nanoparticles, variation in the bandgap
energies76, the C
e3+:Ce4+ ratio, irregular morphologies and possibly low d ispersity77.
Conclusions. We have successfully synthesised cerium oxide nanoparticles in this study, as confirmed
by XRD, BET and TEM analysis. Two valence states were identified in FRNP, FUNP, C280, C385 and C815
nanoparticles; however, the Ce3+:Ce4+ ratio reduced with increasing calcination temperature. The nanoparticles
exhibited increased antibacterial effectiveness against Gram-negative bacteria (E. coli and P. aeruginosa) com-
pared to the Gram-positive bacteria (S. epidermis). The half-maximal inhibitory concentrations (IC50) to reduce
bacterial growth by 50% were lower for FRNP than the C385 and C815 nanoparticles. Based on the findings
herein, it appears that the antibacterial properties of nanoparticles are dependent upon two main factors, (i) the
type of bacteria and (ii) the physicochemical properties of the nanoparticles. The development and utilisation of
biomaterials consisting of Ce3+ and Ce4+ nanoparticles can provide new approaches for preventing and treating
bone infections in high-risk patients (i.e., diabetics, immunocompromised) and in compromised environments
predisposed to develop infections such as open fractures, avascular bone necrosis and prolonged reconstruc-
tion procedures. Moreover, such a strategy can help overcome the ever-growing concern of bone infections and
overcome antibiotic-mediated resistance.
Data availability
The datasets used and/or analysed during the current study are available from the corresponding author on
reasonable request.
Received: 23 May 2021; Accepted: 28 September 2021
References
1. Pulcini, C. et al. Adverse effects of parenteral antimicrobial therapy for chronic bone infections. Eur. J. Clin. Microbiol. Infect. Dis.
27(12), 1227–1232. https://doi.org/10.1007/s10096-008-0570-y (2008).
2. Waldvogel, F. A., Medoff, G. & Swartz, M. N. Osteomyelitis: A review of clinical features, therapeutic considerations and unusual
aspects. N. Engl. J. Med. 282(5), 260–266. https://doi.org/10.1016/S0140-6736(04)16727-5 (1970).
3. Bernard, L. et al. Trends in the treatment of orthopaedic prosthetic infections. J. Antimicrob. Chemother. 53(2), 127–129. https://
doi.org/10.1093/jac/dkh033 (2004).
4. Ribeiro, M., Monteiro, F. J. & Ferraz, M. P. Infection of orthopedic implants with emphasis on bacterial adhesion process and
techniques used in studying bacterial–material interactions. Biomatter 2(4), 176–194. https://doi.org/10.4161/biom.22905 (2012).
5. Johnson, C. T. & Garcia, A. J. Scaffold-based anti-infection strategies in bone repair. Ann. Biomed. Eng. 43(3), 515–528. https://
doi.org/10.1007/s10439-014-1205-3 (2015).
6. Anastasiou, A. D. et al. Antibacterial properties and regenerative potential of Sr2+ and Ce3+ doped fluorapatites; a potential solution
for peri-implantitis. Sci. Rep. 9(1), 14469. https://doi.org/10.1038/s41598-019-50916-4 (2019).
7. Knetsch, M. L. W. & Koole, L. H. New strategies in the development of antimicrobial coatings: The example of increasing usage of
silver and silver nanoparticles. Polymers 3(1), 340 (2011).
8. Wang, L., Hu, C. & Shao, L. The antimicrobial activity of nanoparticles: Present situation and prospects for the future. Int. J.
Nanomed. 12, 1227–1249. https://doi.org/10.2147/ijn.s121956 (2017).
9. Holmes, N. E. et al. Genetic and molecular predictors of high vancomycin MIC in Staphylococcus aureus bacteremia isolates. J.
Clin. Microbiol. 52(9), 3384–3393. https://doi.org/10.1128/JCM.01320-14 (2014).
10. Parsons, B. & Strauss, E. Surgical management of chronic osteomyelitis. Am. J. Surg. 188(1), 57–66. https://d oi.o
rg/1 0.1 016/S 0002-
9610(03)00292-7 (2004).
11. Anastasiou, A. D. et al. Sintering of calcium phosphates with a femtosecond pulsed laser for hard tissue engineering. Mater. Des.
101, 346–354. https://doi.org/10.1016/j.matdes.2016.03.159 (2016).
12. Mahmoudi, M. & Serpooshan, V. Silver-coated engineered magnetic nanoparticles are promising for the success in the fight against
antibacterial resistance threat. ACS Nano 6, 2656–2664 (2012).
13. Høiby, N., Bjarnsholt, T., Givskov, M., Molin, S. & Ciofu, O. Antibiotic resistance of bacterial biofilms/Niels Hǿibya [et al.]. Int. J.
Antimicrob. Agents 35(4), 322–332. https://doi.org/10.1016/j.ijantimicag.2009.12.011 (2010).
14. Hall-Stoodley, L. & Stoodley, P. Evolving concepts in biofilm infections. Cell Microbiol. 11(7), 1034–1043. https://d oi.o
rg/1 0.1 111/j.
1462-5822.2009.01323.x (2009).
Scientific Reports | (2021) 11:20875 | https://doi.org/10.1038/s41598-021-00222-9 12
Vol:.(1234567890)www.nature.com/scientificreports/
15. Raza, M. A. et al. Size-and shape-dependent antibacterial studies of silver nanoparticles synthesized by wet chemical routes.
Nanomaterials 6(4), 74. https://doi.org/10.3390/nano6040074 (2016).
16. Hajipour, M. J. et al. Antibacterial properties of nanoparticles. Trends Biotechnol. 30(10), 499–511. https://doi.org/10.1016/j.tibte
ch.2012.06.004 (2012).
17. Thill, A. et al. Cytotoxicity of C eO2 nanoparticles for Escherichia coli. Physico-chemical insight of the cytotoxicity mechanism.
Environ. Sci. Technol. 40(19), 6151–6156. https://doi.org/10.1021/es060999b (2006).
18. Zhang, M. et al. Antibacterial mechanism and activity of cerium oxide nanoparticles. Sci. China Mater. 62(11), 1727–1739. https://
doi.org/10.1007/s40843-019-9471-7 (2019).
19. Shrivastava, S. et al. Applying nanotechnology to human health: Revolution in biomedical sciences. Nanotechnology 18(22), 225103.
https://doi.org/10.1088/0957-4484/18/22/225103 (2007).
20. Usman, M. S. et al. Synthesis, characterization, and antimicrobial properties of copper nanoparticles. Int. J. Nanomed. 8, 4467–4479.
https://doi.org/10.2147/IJN.S50837 (2013).
21. Jones, N., Ray, B., Ranjit, K. T. & Manna, A. C. Manna FEMS Microbiol. FEMS Microbiol .Lett. 279(1), 71–76. https://doi.org/10.
1111/j.1574-6968.2007.01012.x (2008).
22. Cho, M., Chung, H., Choi, W. & Yoon, J. Linear correlation between inactivation of E. coli and OH radical concentration in T iO2
photocatalytic disinfection. Water Res. 38(4), 1069–1077. https://doi.org/10.1016/j.watres.2003.10.029 (2004).
23. Ramalingam, B., Parandhaman, T. & Das, S. K. Antibacterial effects of biosynthesized silver nanoparticles on surface ultrastructure
and nanomechanical properties of gram-negative bacteria viz. Escherichia coli and Pseudomonas aeruginosa. ACS Appl. Mater.
Interfaces. 8(7), 4963–4976. https://doi.org/10.1021/acsami.6b00161 (2016).
24. AshaRani, P. V., Low Kah Mun, G., Hande, M. P. & Valiyaveettil, S. Cytotoxicity and genotoxicity of silver nanoparticles in human
cells. ACS Nano 3(2), 279–290. https://doi.org/10.1021/nn800596w (2009).
25. Pal, S., Tak, Y. K. & Song, J. M. Does the Antibacterial activity of silver nanoparticles depend on the shape of the nanoparticle? A
study of the gram-negative bacterium Escherichia coli. Appl. Environ. Microbiol. 73(6), 1712. https://doi.org/10.1128/AEM.02218-
06 (2007).
26. Johnston, H. J. et al. A review of the in vivo and in vitro toxicity of silver and gold particulates: Particle attributes and biological
mechanisms responsible for the observed toxicity. Crit. Rev. Toxicol. 40(4), 328–346. https://doi.org/10.3109/104084409034530
74 (2010).
27. Shareena Dasari, T. P., Zhang, Y. & Yu, H. Antibacterial activity and cytotoxicity of gold (I) and (III) ions and gold nanoparticles.
Biochem. Pharmacol (Los Angel) 4(6), 199. https://doi.org/10.4172/2167-0501.1000199 (2015).
28. Sawai, J. et al. Antibacterial characteristics of magnesium oxide powder. World J. Microbiol. Biotechnol. 16(2), 187–194. https://
doi.org/10.1023/A:1008916209784 (2000).
29. Qing, L. C. et al. Potential antibacterial mechanism of silver nanoparticles and the optimization of orthopedic implants by advanced
modification technologies. Int. J. Nanomed. 13, 3311. https://doi.org/10.2147/IJN.S165125 (2018).
30. Dong, Y., Zhu, H., Shen, Y., Zhang, W. & Zhang, L. Antibacterial activity of silver nanoparticles of different particle size against
Vibrio Natriegens. PLoS ONE 14(9), e0222322. https://doi.org/10.1371/journal.pone.0222322 (2019).
31. Reed, K. et al. Exploring the properties and applications of nanoceria: Is there still plenty of room at the bottom?. Environ. Sci.
Nano 1(5), 390–405. https://doi.org/10.1039/C4EN00079J (2014).
32. Lv, G. et al. The application of nanoceria in the bio-antioxidation. Sci. Sin. Chim. 43, 1309. https://doi.org/10.1360/032012-536
(2013).
33. Hirst, S. M. et al. Anti‐inflammatory properties of cerium oxide nanoparticles. Small 5(24), 2848–2856. https://doi.org/10.1002/
smll.200901048 (2009).
34. Perez, J. M., Asati, A., Nath, S. & Kaittanis, C. Synthesis of biocompatible dextran‐coated nanoceria with pH‐dependent antioxidant
properties. Small 4(5), 552–556. https://doi.org/10.1002/smll.200700824 (2008).
35. Korsvik, C., Patil, S., Seal, S., Self, W. T. & Communications, C. Vacancy engineered ceria oxide nanoparticles catalyze superoxide
dismutase activity. Chem Commun https://doi.org/10.1039/b615134e (2007).
36. Celardo, I., Pedersen, J. Z., Traversa, E. & Ghibelli, L. Nanoscale c0nr00875c. Nanoscale 3(4), 1411–1420. https://doi.org/10.1039/
c0nr00875c (2011).
37. Tarnuzzer, R., Colon, J., Patil, S. & Seal, S. Vacancy engineered ceria nanostructures for protection from radiation-induced cellular
damage. Nano Lett. 5, 2573–2577. https://doi.org/10.1021/nl052024f (2006).
38. Tsai, Y. Y. et al. Novel synthesis of cerium oxide nanoparticles for free radical scavenging. Nanomedicine (Lond) 2(3), 325–32.
https://doi.org/10.2217/17435889.2.3.325 (2007).
39. Park, B. et al. Hazard and risk assessment of a nanoparticulate cerium oxide-based diesel fuel additive—A case study. Inhal. Toxicol.
20(6), 547–566. https://doi.org/10.1080/08958370801915309 (2008).
40. De Marzi, L. et al. Cytotoxicity and genotoxicity of ceria nanoparticles on different cell lines in vitro. Int. J. Mol. Sci. 14(2),
3065–3077. https://doi.org/10.3390/ijms14023065 (2013).
41. Das, M. et al. Auto-catalytic ceria nanoparticles offer neuroprotection to adult rat spinal cord neurons. Biomaterials 28(10),
1918–1925. https://doi.org/10.1016/j.biomaterials.2006.11.036 (2007).
42. Babu, K. S. et al. Cytotoxicity and antibacterial activity of gold-supported cerium oxide nanoparticles. Int. J. Nanomed. 9, 5515–
5531. https://doi.org/10.2147/IJN.S70087 (2014).
43. Limbach, L. K. et al. Removal of oxide nanoparticles in a model wastewater treatment plant: Influence of agglomeration and
surfactants on clearing efficiency. Environ. Sci. Technol. 42(15), 5828–5833 (2008).
44. Van Hoecke, K. et al. Fate and effects of CeO2 nanoparticles in aquatic ecotoxicity tests. Environ. Sci. Technol. 43(12), 4537–4546
(2009).
45. Lin, W., Huang, Y.-W., Zhou, X.-D. & Ma, Y. Toxicity of cerium oxide nanoparticles in human lung cancer cells. Int. J. Toxicol.
25(6), 451–457. https://doi.org/10.1080/10915810600959543 (2006).
46. Pelletier, D. A. et al. Effects of engineered cerium oxide nanoparticles on bacterial growth and viability. Appl. Environ. Microbiol.
76(24), 7981–7989. https://doi.org/10.1128/aem.00650-10 (2010).
47. Zhang, W., Zhang, W., Mujumdar, A. S. & Huang, L. Progress in drying technology for nanomaterials. Dry. Technol. 23(1–2), 7–32.
https://doi.org/10.1081/drt-200047900 (2005).
48. Channei, D. et al. Aqueous and surface chemistries of photocatalytic Fe-doped C eO2 nanoparticles. Catalysts 7(2), 45 (2017).
49. Okamoto, H. Ce–O (Cerium–Oxygen). J. Phase Equilib. Diffus. 29(6), 545–547. https://d oi.o
rg/1 0.1 007/s 11669-0 08-9 392-y (2008).
50. Aguilera-Correa, J. J. et al. A new antibiotic-loaded sol–gel can prevent bacterial prosthetic joint infection: From in vitro studies
to an in vivo model. Front. Microbiol. 10, 2935. https://doi.org/10.3389/fmicb.2019.02935 (2020).
51. Crémet, L. et al. Orthopaedic-implant infections by Escherichia coli: Molecular and phenotypic analysis of the causative strains. J.
Infect. 64(2), 169–175. https://doi.org/10.1016/j.jinf.2011.11.010 (2012).
52. Olivares, E. et al. Clinical impact of antibiotics for the treatment of Pseudomonas aeruginosa biofilm infections. Front. Microbial.
10, 2894. https://doi.org/10.3389/fmicb.2019.02894 (2020).
53. Mahdi, A. A., Al-Salmani, T. S. & Al-Qaisi, M. M. The novel role of healing from bacterial infections of lower limb open fractures
by X-ray exposure. Int. J. Microbiol. 2020, 3129356. https://doi.org/10.1155/2020/3129356 (2020).
54. Davidson, D. J., Spratt, D. & Liddle, A. D. Implant materials and prosthetic joint infection: The battle with the biofilm. EFORT
Open Rev. 4(11), 633–639. https://doi.org/10.1302/2058-5241.4.180095 (2019).
Scientific Reports | (2021) 11:20875 | https://doi.org/10.1038/s41598-021-00222-9 13
Vol.:(0123456789)You can also read