Characteristics of the summer atmospheric boundary layer height over the Tibetan Plateau and influential factors
←
→
Page content transcription
If your browser does not render page correctly, please read the page content below
Atmos. Chem. Phys., 21, 5253–5268, 2021
https://doi.org/10.5194/acp-21-5253-2021
© Author(s) 2021. This work is distributed under
the Creative Commons Attribution 4.0 License.

Characteristics of the summer atmospheric boundary layer
height over the Tibetan Plateau and influential factors
Junhui Che1,2,3 and Ping Zhao1,2
1 StateKey Laboratory of Severe Weather, Chinese Academy of Meteorological Sciences, Beijing, 100081, China
2 Collaborative
              Innovation Center on Forecast and Evaluation of Meteorological Disasters,
Nanjing University of Information Science and Technology, Nanjing, 210044, China
3 Shandong Meteorological Service Center, Jinan, 250031, China

Correspondence: Ping Zhao (zhaop@cma.gov.cn)

Received: 29 July 2020 – Discussion started: 24 September 2020
Revised: 15 February 2021 – Accepted: 16 February 2021 – Published: 6 April 2021

Abstract. The important roles of the Tibetan Plateau (TP) at-       late afternoon (20:00 BJT), the CBL and SBL dominate the
mospheric boundary layer (ABL) in climate, weather, and air         western and eastern TP, respectively, which results in a larger
quality have long been recognized, but little is known about        west–east difference of 1054.2 m between the western and
the TP ABL climatological features and their west–east dis-         eastern TP. The high ABL height in a cold environment over
crepancies due to the scarce data in the western TP. Based on       the western TP (relative to the plain areas) is similar to that
observational datasets of intensive sounding, surface sensible      in some extreme hot and arid areas such as Dunhuang and
heat flux, solar radiation, and soil moisture from the Third        Taklimakan deserts. In general, for the western (eastern) TP,
Tibetan Plateau Atmospheric Scientific Experiment (TIPEX-           there is low (high) total cloud coverage, with large (small) so-
III) and the routine meteorological-operational-sounding and        lar radiation at the surface and dry (wet) soil. These features
ground-based cloud cover datasets in the Tibetan Plateau for        lead to high (low) sensible heat flux and thus promote (in-
the period 2013–2015, we investigate the west–east differ-          hibit) the local ABL development. This study provides new
ences in summer ABL features over the TP and the associ-            insights for west–east structures of the summer ABL height,
ated influential factors for the first time. It is found that the   occurrence frequency, and diurnal amplitude over the TP re-
heights of both the convective boundary layer (CBL) and the         gion and the associated reasons.
neutral boundary layer (NBL) exhibit a diurnal variation and
a west–east difference in the TP, while these features are not
remarkable for the stable boundary layer (SBL). Moreover,
the ABL shows significant discrepancies in the amplitude of         1   Introduction
the diurnal variation and the persistent time of the develop-
ment between the eastern and western TP. In the early morn-         The atmospheric boundary layer (ABL) commonly refers to
ing (08:00 BJT, Beijing time), the ABL height distribution is       the bottom layer of the troposphere directly coupled with
narrow, with a mean height below 450 m a.g.l. (above ground         the earth’s surface at a response timescale of about 1 h or
level) and a small west–east difference. The SBL observed at        less, in which a variety of complex motions characterized by
this moment accounts for 85 % of the total TP ABL. There is         turbulence may be present (Stull, 1988). The turbulent mo-
a wide distribution in the ABL height up to 4000 m a.g.l. and       tions in the ABL are responsible for the atmospheric mixing
a large west–east difference for the total ABL height at noon       processes, which affect the vertical redistribution of water
(14:00 BJT), with a mean height above 2000 m a.g.l. in the          vapour, momentum, heat, and atmospheric pollutants (Stull,
western TP and around 1500 m a.g.l. in the eastern TP. The          1988; Garratt, 1992; Huang et al., 2007; Miao et al., 2015).
CBL accounts for 77 % of the total TP ABL at this moment,           The ABL height (ABLH) as a fundamental variable is critical
with more than 50 % of the CBL above 1900 m a.g.l. In the           to diagnose turbulent mixing, vertical disturbance, convec-
                                                                    tive transport, pollutant dispersion, and atmospheric environ-

Published by Copernicus Publications on behalf of the European Geosciences Union.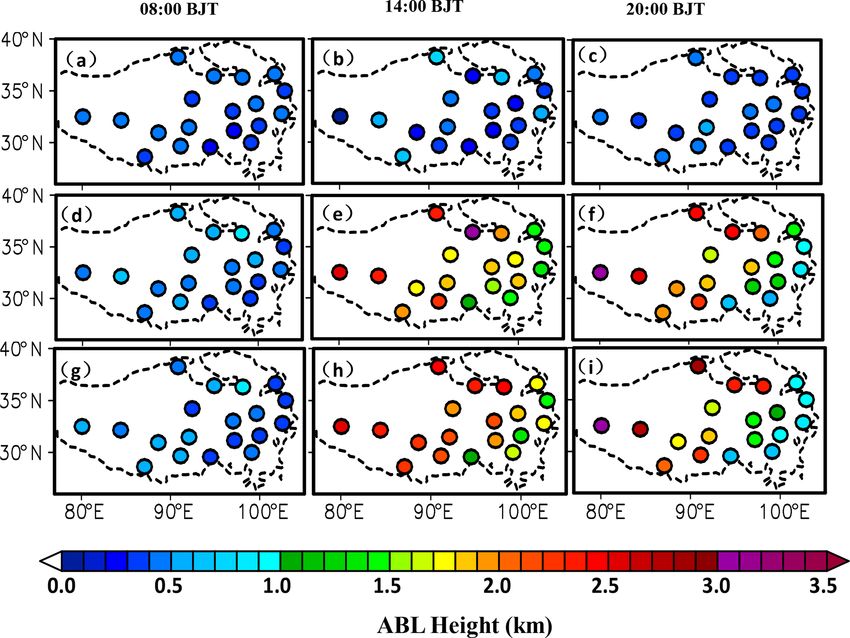
5254                            J. Che and P. Zhao: Summer atmospheric boundary layer height over the Tibetan Plateau

mental and effective heat capacity (Garratt, 1993; Seibert et       thermal properties of the underlying surface, and weather
al., 2000; Guo et al., 2009; Esau and Zilitinkevich, 2010; Dai      conditions. For example, the CBL can grow to a height of
et al., 2014; Pal and Haeffelin, 2015; Davy and Esau, 2016).        4700 m a.g.l. in New Delhi before the outbreak of the South
Therefore, the accurate specification of the ABLH is essen-         Asian monsoon, whereas it only reaches 900 m a.g.l. in Ban-
tial to develop weather, climate, and air pollution prediction      galore during the monsoon period (Raman et al., 1990). Sei-
models.                                                             del et al. (2010, 2012) pointed out that a large east–west
   The cloud-free ABL overland can be divided into three            spatial gradient of the ABLH at sunset in the United States
types, that is, the convective boundary layer (CBL), the stable     spanning several time zones may be conflated with the di-
boundary layer (SBL), and the neutral boundary layer (NBL)          urnal variations in the ABL for the local solar time in the
(Stull, 1988). The CBL usually has the strongest turbulence         west earlier than in the east at fixed observation times. Guo
forced by surface buoyancy flux with or without wind shear          et al. (2016) identified three large-scale ABLH spatial pat-
and is generally capped by a strong temperature inversion           terns in China, that is, a west–east gradient during sunrise, an
maintained through large-scale subsidence. The CBL height           east–west gradient during sunset, and a south–north gradient
is a result of the balance of the turbulence-induced entrain-       at noon. The reasons for the first two patterns are similar to
ment and the subsidence velocity (e.g. Driedonks and Ten-           those in the United States shown in Seidel et al. (2012), while
nekes, 1984). However, turbulence in the SBL is mainly              the south–north gradient may be related to the local surface
driven by the mean wind shear against negative buoyancy             and hydrological processes (Guo et al., 2016; Zhang et al.,
flux from the stable thermal stratification within the noctur-      2017).
nal surface inversion (NSI). The SBL height is hence related           The Tibetan Plateau (TP), with an average elevation ex-
to the boundary layer wind and wind shear, which sometimes          ceeding 4000 m, is characterized by complex land surface
are used to identify the SBL height. The NBL occurs in neu-         processes and boundary layer structures (Tao and Ding,
tral conditions, with a turbulence of almost the same inten-        1981; Yanai and Li, 1994; Xu et al., 2002; Yang et al.,
sity in all directions (Stull, 1988; Blay-Carreras et al., 2014).   2004; Li and Gao, 2007; Sun et al., 2007; Zhou et al., 2018;
It denotes the type of boundary layer with solely wind forc-        Zhao et al., 2019a). The ABLH in the TP can reach 2000–
ing and normally occurs during the transition from the day-         3000 m a.g.l., generally higher compared to some plain ar-
time CBL to the night-time SBL. It can also occur anytime           eas (with ABLH of 1000–1500 m a.g.l.) (Ye and Gao, 1979;
when the buoyancy forcing is weak. The ABLH variability             Zhao and Miao, 1992; Xu et al., 2002; Zhang et al., 2003).
is dominated by its strong diurnal cycle (Stull, 1988; Gar-         The ABLH in the TP varies greatly with location and season.
ratt, 1992). In this diurnal cycle, the different manifestations    At Gaize station of the western TP, the super-thick ABLH
of an ABLH are generated in response to the distinct forcing        may exceed 5000 m a.g.l. during winter (Chen et al., 2013,
mechanisms that originate from mechanical (wind shear) and          2016). In the central TP, the ABLH is lower, between 400
thermal (buoyancy) effects (Stull, 1988; Garratt, 1992). Over       and 1800 m a.g.l. at Dangxiong station and 1750 m a.g.l. at
land and after sunrise, the surface is heated by solar radiation,   Namtso Lake (Li et al., 2000; Liu et al., 2001, and Lü et al.,
resulting in upward heat flux that initiates strong updraughts      2008). Moreover, there is also a significant difference in the
of warm air. Such a mechanism generates a deepening of the          TP ABLH between dry and rainy seasons (Zuo et al., 2004).
CBL (Chen and Houze, 1997). At sunset, the surface cools            For instance, the ABLH at Naqu station is 2211–4430 m a.g.l
more rapidly compared to the air above, resulting in nega-          in the dry season, while it is 1006–2212 m a.g.l. in the rainy
tive heat flux that consumes turbulent kinetic energy. Conse-       season (Li et al., 2011).
quently, shear-driven turbulence can only maintain a shallow           Although observations and studies for the TP ABL
SBL with the formation of the NSI (Y. Zhang et al., 2011;           features have made progress, routine meteorological-
Miao et al., 2015). Above the NSI, the convective-energy-           operational-sounding observations are scarce in the western
containing eddies start to lose their strength and mixing ca-       TP due to the local high elevations, naturally harsh envi-
pacity. This deep and near-adiabatic vertical region, which is      ronmental conditions, and logistic challenges. The previous
the remnant of the daytime CBL, is known as the residual            studies on the ABL in the western TP are usually based on
layer (RL). The use of precise information on the RL in nu-         observational data at Shiquanhe (during 15 d in one summer)
merical models is of fundamental importance when describ-           and Gaize (during 22 d in one summer) stations (Song et al.,
ing the evolution of the diurnal CBL (Blay-Carreras et al.,         1984; Chen et al., 2013). Thus, the statistical representation
2014; Chen et al., 2016).                                           of their results is limited. Moreover, there are significant dif-
   The ABLH can be calculated from temperature, humidity,           ferences in surface properties and general climate between
and wind profiles (Holtslag and Boville, 1993; Seibert et al.,      the eastern and western TP (Wang et al., 2016). Few studies
2000; Seidel et al., 2010; Bosveld et al., 2014; Davy, 2018).       examined the west–east differences in the ABL features due
The CBL height is generally less than 2000–3000 m a.g.l.            to the scarce data in the western TP. To obtain longer obser-
(above ground level) and the SBL thickness is usually less          vational data in the western TP, the Third Tibetan Plateau At-
than 400–500 m a.g.l. (Garratt, 1992). The ABL height shows         mospheric Scientific Experiment (TIPEX-III) has made rou-
an obvious spatial variation due to differences in topography,      tine sounding launches at Shiquanhe, Gaize, and Shenzha

Atmos. Chem. Phys., 21, 5253–5268, 2021                                               https://doi.org/10.5194/acp-21-5253-2021
J. Che and P. Zhao: Summer atmospheric boundary layer height over the Tibetan Plateau                                                     5255

Figure 1. Distribution of sounding stations, in which the number indicates sounding profiles at each station at (a) 08:00, 14:00, and 20:00 BJT;
(b) 08:00 BJT; (c) 14:00 BJT; and (d) 20:00 BJT in the study period. Red (black) dots represent intensive (operational) observations, and some
observation station names are given as abbreviations in (a). Coloured dots represent the local time of the BJT time in (b), (c), and (d). The
green line shows the 3000 m topography.

stations of the western TP (Fig. 1) since 2013, which fills in            2     Data and analysis methods
the data gaps in the operational-sounding network over the
western TP (Zhao et al., 2018). Meanwhile, the TIPEX-III                  2.1    Observation data
also carried out the intensive-sounding observations in the TP
and adjacent stations at 14:00 Beijing time (06:00 UTC) in                The TIPEX-III has carried out the routine meteorological-
June, July, and August (Zhao et al., 2019b). Compared to the              intensive-sounding observations at Shiquanhe (SQH), Gaize
previous field experiments over the TP, the TIPEX-III has a               (GZ), and Shenzha (SZ) stations of the western TP (marked
wider and longer coverage of sounding observations over the               by red dots in Fig. 1) since the 2013 summer (Zhao et
western TP, providing valuable observational data for study-              al., 2018), which have been applied in research on the ver-
ing the ABL features in the western TP and the west–east                  tical structure of the upper troposphere and lower strato-
differences in these features in the TP during summer.                    sphere at Gaize station during the rainy season and the ef-
   This study utilizes the TIPEX-III observational sounding               fects of assimilating the intensive-sounding data on down-
data to investigate the features of the ABLH in the TP and                stream rainfall (Hong et al., 2016; Yu et al., 2018; Zhao et
their differences between the western and eastern TP during               al., 2018, 2019b). These intensive-sounding data and the rou-
summer and analyses the major factors affecting the ABLH                  tine meteorological-operational-sounding data at 16 stations
in the TP. The remainder of this paper is organized as follows.           of the east-central TP from the China Meteorological Ad-
Main features of data and methods are described in Sect. 2.               ministration (marked by black dots in Fig. 1) are utilized in
In Sect. 3, the characteristics of the ABLH in the eastern and            this study. The sounding observations at the above intensive-
western TP and their regional differences are analysed in de-             and operational-sounding stations were carried out at 08:00
tail. In Sect. 4, the major factors affecting the ABLH in the             Beijing time (BJT; 00:00 UTC), 14:00 BJT (06:00 UTC), and
TP and the west–east differences are examined. Discussions                20:00 BJT (12:00 UTC) each day during summer (June, July,
and conclusions are given in Sect. 5.                                     and August), including vertical profiles of temperature, hu-
                                                                          midity, and wind direction and speed. After the quality con-
                                                                          trol of the observational sounding data, we select data from
                                                                          three time periods for this study: 15 June to 31 July 2013, 15

https://doi.org/10.5194/acp-21-5253-2021                                                     Atmos. Chem. Phys., 21, 5253–5268, 2021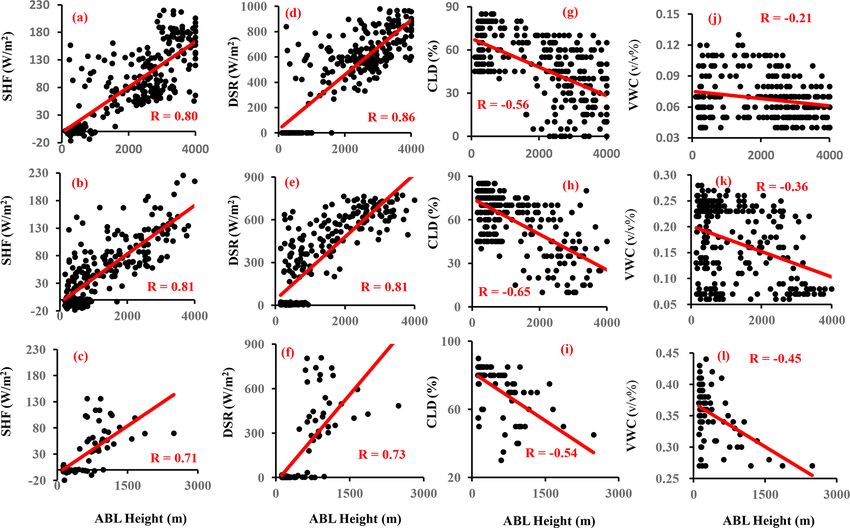
5256 J. Che and P. Zhao: Summer atmospheric boundary layer height over the Tibetan Plateau
June to 31 August 2014, and 1 June to 31 August 2015. There Here σ is the stability threshold of the near-surface
are 11 635 sounding profiles (Fig. 1a) from 19 stations over potential-temperature stratification. Since the neutral strati-
the TP region consisting of 4745, 2049, and 4841 profiles fication condition (σ = 0) is rare in nature, consistent with
at 08:00 BJT (Fig. 1b), 14:00 BJT (Fig. 1c), and 20:00 BJT Liu and Liang (2010), σ is set to 1.0 K. The threshold value
(Fig. 1d), respectively. It is evident that the observational of the NBL is set to −1.0 to 1.0. Consequently, SBLs and
sample size used in this study is much larger compared to the CBLs with weakly stable or weakly unstable stratification
previous studies. Meanwhile, it is noted that there is a large are possibly identified as NBLs.
difference in the sample size between the intensive and oper- Once the boundary layer regime has been identified, we
ational observation records at 08:00 and 20:00 BJT (Fig. 1b use the criteria defined by Liu and Liang (2010) to estimate
and d), which is called the original dataset for convenience. the ABLH for each regime. Since buoyancy is the domi-
Consequently, we also select the test group dataset, which nant mechanism driving turbulence in the CBL, the ABLH
contains the same intensive observation records as the opera- is defined as the height at which an air parcel rising adia-
tional ones at these two times, to conduct sensitivity analysis batically from the surface becomes neutrally buoyant (Stull
(shown in Sect. 3.2), which shows that the difference in the 1988). First, we find the lowest level (k1 ) (Fig. 2a) that meets
sample size between the intensive and operational observa- the following condition:
tion records does not change our conclusions.
To analyse the factors affecting the ABL in the TP, we use θk1 − θ1 ≥ σu , (2)
the TIPEX-III 30 min mean surface sensible heat flux (SHF),
in which σu is the θ increment that represents the minimum
downward solar radiation, and 5 cm soil volume moisture
strength of the unstable layer. Once level k1 is determined,
content at SQH (bare soil with less vegetation), Naqu (NQ;
another upward scan is performed to find the lowest level
alpine steppe), and Linzhi (LZ; alpine meadow with few
at which the potential-temperature gradient with height (θ̇k )
shrubs and trees) stations in the 2014–2015 summers (Wang
meets the following criterion:
et al., 2016; Zhao et al., 2018; Li et al., 2019, 2020). In ad-
dition, the manual operational ground-based cloud cover ob- ∂θk
servations at 02:00, 08:00, 14:00, and 20:00 BJT from the θ̇k ≡ ≥ θ̇r . (3)
∂z
China Meteorological Administration are also used in this
study. These ground-based cloud cover data have been uti- Here θ̇r is the minimum strength for the overlying inversion
lized by Guo et al. (2016) and Zhang et al. (2017). layer and can be considered to be the overshooting thresh-
old of the rising parcel to define the scope of the entrainment
2.2 Calculation method of ABLH zone for the CBL. The same procedure is adopted to deter-
mine the NBL height excluding the entrainment zone at the
The potential-temperature-gradient method, proposed by Liu top (Fig. 2a). Various values of σu and θ̇r will affect the deter-
and Liang (2010) and sketched in Fig. 2a, is utilized in iden- mination of the boundary layer height, and they are respec-
tifying the ABL type and calculating the ABL height. The tively set to 0.5 K and 4.0 K km−1 , consistent with Liu and
CBL height is defined at the base of the overlying inver- Liang (2010). Quantifying the uncertainty in the rawinsonde-
sion layer that caps the rising convective thermals. The SBL based approach, which is closely related to the thermody-
height is defined as the top of the underlying inversion layer, namic characteristics of the sounding profiles for identifying
where turbulence decreasing from the surface nearly ceases ABLH, is important (Seidel et al., 2010, 2012; Davy, 2018;
(Stull, 1988). In the evening and morning transition peri- Lee and Pal, 2021). The ABLH determined by this potential-
ods when the RL may occur, the neutral RL starting from temperature-gradient method from soundings is highly con-
the surface is identified with near-neutral conditions in the sistent with that derived from lidar measurements, with a
surface layer (that is the NBL). Following Liu and Liang correlation coefficient of 0.96 and root mean square error
(2010), Zhang et al. (2017), and Zhao et al. (2019), the orig- of 211 m (Liu and Liang 2010). Moreover, the changes in
inal sounding observation profiles with a fine vertical res- ABLHs are ≤ 177 m when using 3.5, 4, and 4.5 K km−1 as
olution of ∼ 1 hPa are interpolated to a vertical resolution θ̇r , respectively (Zhang et al., 2017). It is evident that the un-
of 5 hPa (corresponding to a vertical interval around 50 m certainties in the above procedure can be negligible for both
in the ABL) by the nearest-neighbour interpolation method. CBL and NBL since most of their ABLHs are much higher.
On the basis of the near-surface thermal gradient, such as a For the SBL, the turbulence in the ABL can result from ei-
potential-temperature (θ ) difference (PTD) between the fifth ther buoyancy forcing or wind shear. The SBL height is de-
layer (∼ 250 m; θ5 ) and the second layer (∼ 50 m; θ2 ), the fined as the lower of the heights of both the thermal stable
ABL is classified as follows: layer from the surface and the maximum wind in the low-
< −σ, for CBL level jet stream if present. More details of the definitions of
PTD = θ5 − θ2 > +σ, for SBL . (1) the boundary layer regimes may be seen in Liu and Liang
≥ −σ and ≤ +σ, for NBL (2010). Figure 2c and d show the typical profiles of poten-
tial temperature for CBL, NBL, and SBL at 20:00 BJT on 10
Atmos. Chem. Phys., 21, 5253–5268, 2021 https://doi.org/10.5194/acp-21-5253-2021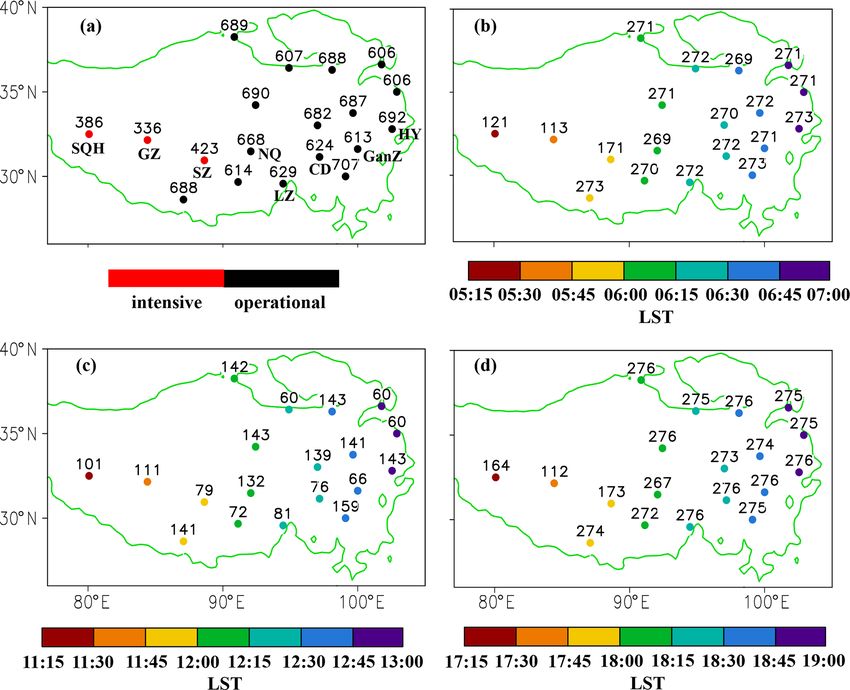
J. Che and P. Zhao: Summer atmospheric boundary layer height over the Tibetan Plateau                                                5257

Figure 2. (a) Illustration of the determination procedure for the convective boundary layer (CBL), neutral boundary layer (NBL), and stable
boundary layer (SBL) heights and examples of the potential-temperature (PT) profiles derived from sounding observation at Lasa station at
20:00 BJT for (b) CBL on 10 June 2013, (c) NBL on 21 July 2013, and (d) SBL on 11 August 2013, respectively. The dashed line in (b–d)
represents the ABL height identified using the algorithm described.

June 2013, 21 July 2013, and 11 August 2013 at Lasa station,               Figure 3a–c show the spatial distributions of the mean
and the ABL heights calculated by the potential-temperature-            ABLH over the TP at 08:00, 14:00, and 20:00 BJT, re-
gradient method are 3465, 1258, and 409 m a.g.l., respec-               spectively. In the early morning (08:00 BJT), the ABL is
tively.                                                                 of the night-time property. The ABLH is generally low (<
                                                                        450 m a.g.l.) over the TP and displays a relatively homoge-
                                                                        neous feature (Fig. 3a). At this moment, the distribution of
3     Characteristics of the summer ABLH in the eastern                 the ABLH is narrow, with a frequency peak of 35 % at an
      and western TP                                                    ABLH of 300 m a.g.l. (Fig. 3d) and 78.5 % (99.6 %) of the
                                                                        ABLH below 500 (1000) m a.g.l. (Fig. 3e). Figure 3f displays
3.1    A general characteristic of the ABLH
                                                                        the zonal sections of the ABLH along 32◦ N, in which the
The diurnal variation is an important feature of the ABL,               cross-section includes SQH, GZ, SZ, NQ, Changdu (CD),
consisting of different periods of daytime, night-time, and             Ganzi (GanZ), and Hongyuan (HY) stations. In this figure,
day–night transitions (Liu and Liang, 2010). In the central             the ABLH varies between 218.4 and 433.9 m a.g.l. from east
TP (near 90◦ E), 08:00, 14:00, and 20:00 BJT correspond to              to west and presents a relatively homogeneous feature in the
06:00 (the early morning), 12:00 (noon), and 18:00 (the late            west–east direction.
afternoon) local solar time (LST) (Fig. 1b and c), respec-                 At noon (14:00 BJT), with the well-developed daytime
tively. To reveal a difference in ABLH between the eastern              ABL (Fig. 3b), its height remarkably increases over the
TP (ETP) and the western TP (WTP), we divide all sounding               TP, with an average of 1887.7 m a.g.l., and exhibits a large
stations in the TP into two groups. One is for the WTP (to              west–east difference. There is a wide distribution of the
the west of 92.5◦ E), with 8 stations, and the other is for the         ABLH up to 4000 m a.g.l., with a relatively flat peak be-
ETP (to the east of this longitude), with 11 stations.                  tween 900 and 2900 m a.g.l. (Fig. 3d) and only 17.8 %
                                                                        (more than 50 %) of the ABLH below 1000 m a.g.l. (above
                                                                        1900 m a.g.l.) (Fig. 3e). At this moment, the regional mean

https://doi.org/10.5194/acp-21-5253-2021                                                  Atmos. Chem. Phys., 21, 5253–5268, 2021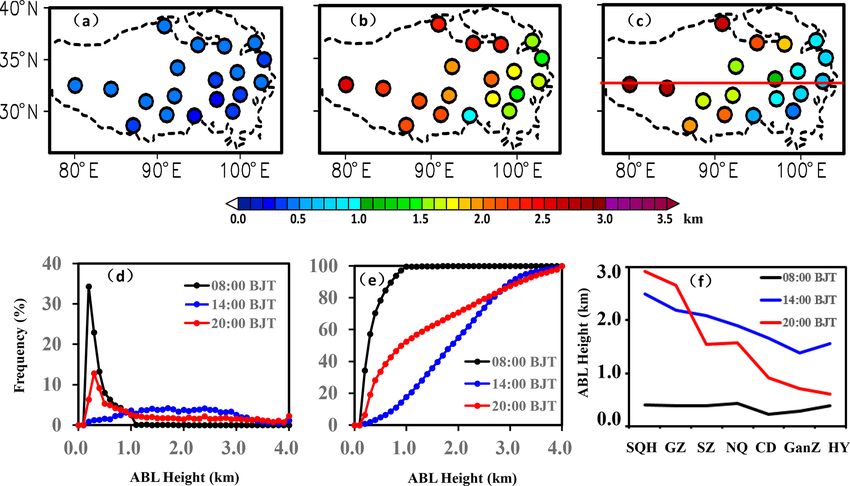
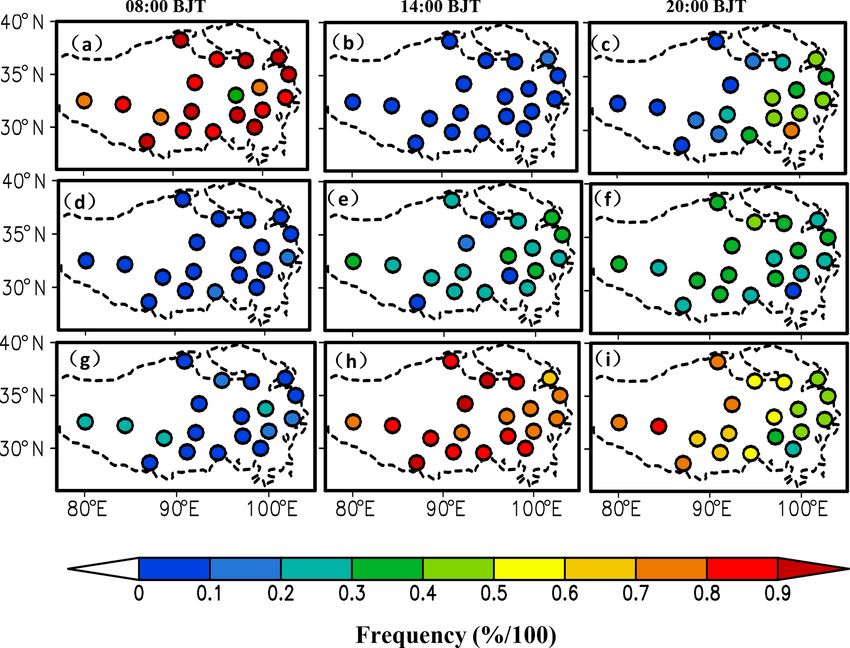
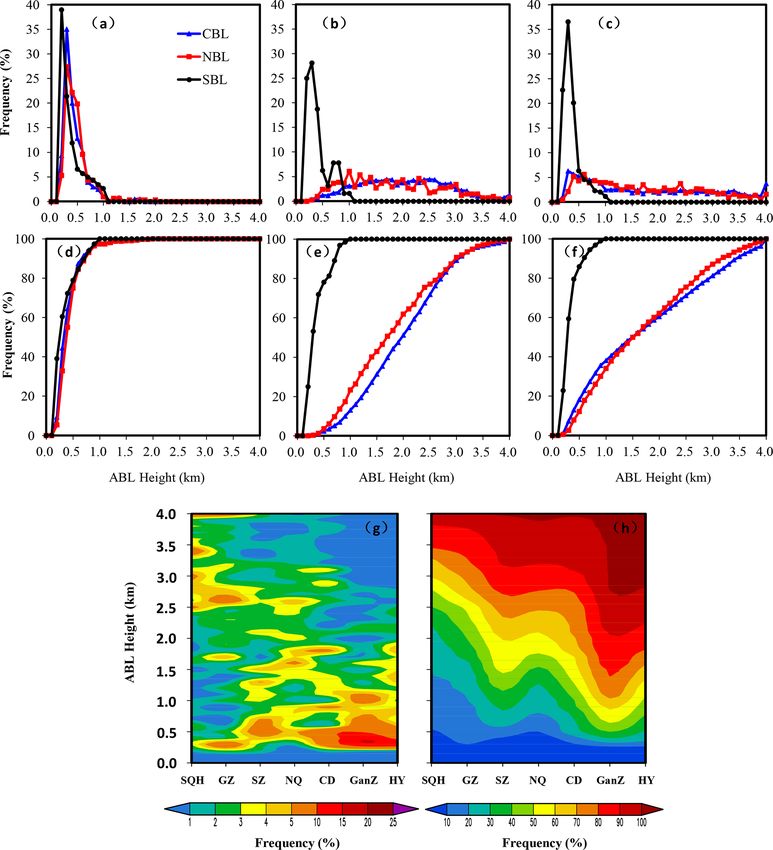
5258                             J. Che and P. Zhao: Summer atmospheric boundary layer height over the Tibetan Plateau

Figure 3. Spatial distribution of the mean ABL height (ABLH) at (a) 08:00 BJT, (b) 14:00 BJT, and (c) 20:00 BJT; (d) the regional mean
frequency and (e) cumulative frequency distributions of the ABLH in the TP at 08:00, 14:00, and 20:00 BJT; (f) the west–east cross-sections
of the ABLH along 32◦ N (indicated by red line in c) at 08:00, 14:00, and 20:00 BJT.

ABLH is 2124.2 m a.g.l. in the WTP and 1693.5 m a.g.l. in               it is noted that this difference in the local time is less over the
the ETP, with a mean difference of 430.7 m between the WTP              TP than over China (Guo et al., 2016) and the United States
and the ETP. Along 32◦ N, the ABLH remarkably increases                 (Seidel et al., 2010, 2012; Lee and Pal, 2017). Thus the con-
from 1379.4 m a.g.l. at GanZ station to 2504.2 m a.g.l. at              tribution of the time zone difference to the regional difference
SQH station, with the west–east difference exceeding 1200 m             in ABLH is relatively smaller in the TP.
(Fig. 3f). This regional difference in the TP ABLH could be                 Figure 4 further shows the variations in the ABLH from
likely related to the hydrologic factors such as air moisture           08:00 to 14:00 BJT and from 14:00 to 20:00 BJT, indicating
and soil water (also see Sect. 4) that may modulate the spa-            varying rates in 6 h. It is seen from Fig. 4a that the ABLH in
tial distribution of the daytime ABLH (Seidel et al., 2012).            the TP increases substantially from 08:00 to 14:00 BJT, with
   In the late afternoon (20:00 BJT), the ABL begins to show            a mean growth rate of 1500 m/6 h. There is also a large west–
the night-time features. The ABLH also starts to decrease               east difference in the ABLH growth rate in this period, with a
in the ETP, with the regional mean height < 1000 m a.g.l.,              regional mean of 1800 m/6 h and 1300 m/6 h in the WTP and
while it continues to increase at the westernmost stations,             the ETP, respectively. From 14:00 to 20:00 BJT (Fig. 4b), the
with the regional mean height > 2000 m a.g.l. (Fig. 3c). This           growth rate of the ABLH is negative in the ETP, exhibiting
result indicates a larger west–east difference (1054.2 m) be-           an opposite trend to that in Fig. 4a, which indicates a signifi-
tween the WTP and the ETP. Especially, the ABLH is                      cant decrease (around −600 m/6 h) in the ABLH after noon.
602 m a.g.l. at HY station and 2920.6 m a.g.l. at SQH station,          In the WTP, the growth rate generally shows a weak increase
with a difference above 2000 m between these two stations               (around 400 m/6 h) or decrease (around −140 m/6 h). It is ev-
(Fig. 3f). At this moment, the frequency of the high ABLH               ident that the growth rate from 08:00 to 14:00 BJT may indi-
decreases, with 12.8 % of the frequency peak at an ABLH of              cate the amplitude of the ABL diurnal variation over the TP.
300 m a.g.l. (Fig. 3d) and 50 % of the ABL heights less than            Compared to the ETP, the ABL in the WTP has the larger
1000 m a.g.l. (Fig. 3e). It is evident that the west–east differ-       amplitude of the diurnal variation and the longer develop-
ence in the ABLH over the TP increases from noon to the                 ment time.
late afternoon (LST). During the evening transition, the day-
time boundary layer undergoes a transition to the night-time            3.2   Characteristics of SBL, NBL, and CBL heights
boundary layer. Since the TP spans almost 1.5 time zones
from west to east (Fig. 1c), the local solar time is earlier            We further examine the characteristics of different ABL
in the west (where 20:00 BJT corresponds to 17:20 LST in                types. Figure 5 presents the spatial distribution of occur-
the westernmost SQH station) compared to the east (where                rence frequency of SBL, NBL, and CBL at 08:00, 14:00, and
20:00 BJT corresponds to 18:50 LST for the easternmost HY               20:00 BJT. It is seen that the occurrence frequency exhibits
station), which supports an earlier transition from the day-            significant discrepancies at different times for the SBL and
time ABL to the night-time ABL in the east (Seidel et al.,              CBL. At 08:00 BJT, the occurrence frequency of the SBL
2010, 2012; Guo et al., 2016; Lee and Pal, 2017). Meanwhile,            (CBL) is large (little) (Fig. 5a and Fig. 5g, respectively),

Atmos. Chem. Phys., 21, 5253–5268, 2021                                                    https://doi.org/10.5194/acp-21-5253-2021
J. Che and P. Zhao: Summer atmospheric boundary layer height over the Tibetan Plateau                                      5259

                                                                  the ABLH up to 4000 m a.g.l, with a relatively flat peak be-
                                                                  tween 1000 and 3000 m a.g.l., which is remarkably different
                                                                  from a single peak of the SBL. The frequency of the NBL
                                                                  height between 500 and 3000 m a.g.l. is generally less than
                                                                  5 % (Fig. 6b), with a frequency peak of 6.1 % at 1000 m a.g.l.,
                                                                  and more than 50 % of the NBL height exceeds 1700 m a.g.l.
                                                                  (Fig. 6e). The height of the CBL is higher, with a frequency
                                                                  peak near 4.5 % between 1500 and 2500 m a.g.l. (Fig. 6b),
Figure 4. Spatial distribution of the ABLH growth rate from       and more than 50 % of the CBL height is above 2000 m a.g.l.
08:00 to 14:00 BJT (a) and from 14:00 to 20:00 BJT (b).           (Fig. 6e). These results show that the ABL develops well at
                                                                  noon (LST). When the ABL begins turning to the nigh-time
                                                                  property at 20:00 BJT (Fig. 6c and f), the distributions of the
with a mean value 84.9 % (8.5 %) over the TP. At 14:00 BJT,       CBL and NBL heights are still wide, but the frequency of
the occurrence of the SBL (CBL) remarkably decreases (in-         the high ABL height decreases, with a frequency peak below
creases), accounting for 3.1 % (76.9 %) of the ABL (Fig. 5b       500 m a.g.l. It is obvious that the CBL and NBL heights show
and Fig. 5h, respectively). At 20:00 BJT, the SBL (CBL)           similar results consistent with those from Zhang et al. (2017).
mainly occurs in the ETP (WTP) (Fig. 5c and Fig. 5i, re-          Stull (1988) and Blay-Carreras et al. (2014) revealed that the
spectively), with a regional mean of 35.0 % (65.0 %). How-        NBL often occurs in the transition periods between the CBL
ever, the NBL shows a relatively weaker temporal variation        and the SBL. Since these transitions occur rapidly, the NBL
over the TP (Fig. 5d–f), with a mean occurrence frequency         may have the same characteristics in the state variables as the
of 6.4 %, 20.0 %, and 25.5 % at 08:00, 14:00, and 20:00 BJT,      CBL prior to the transition, although the dynamic forcing in
respectively. The above results are consistent with the diur-     the NBL may be weaker compared to the CBL.
nal development of the ABL structure, including the SBL              To reveal the spatial variations in the ABLH over the
in the early morning, the CBL at noon, and different types        TP, the distributions of mean SBL, NBL, and CBL heights
of ABLs between the eastern and western TP in the late af-        at 08:00, 14:00, and 20:00 BJT are illustrated in Fig. 7.
ternoon (LST) because of the latitudinal difference and the       The SBL height is generally low and varies between 200
resultant difference in local solar times. Note that the obser-   and 730 m a.g.l. at these times, with a mean height of
vations were made simultaneously for all stations. Neverthe-      336.0 m a.g.l. at 08:00 BJT, 356.0 m a.g.l. at 14:00 BJT, and
less, the daytime SBL and the night-time CBL may also oc-         321.9 m a.g.l. at 20:00 BJT (Fig. 7a–c), which indicates the
cur with low frequencies in the TP, which is likely due to the    weak spatial differences in the SBL height over the TP
“abnormal” forcing associated with certain synoptic condi-        at three observation times. For the NBL and CBL, their
tions or cloud coverage (Medeiros et al., 2005; Poulos et al.,    heights are still low in the early morning (LST) (Fig. 7d
2002; Stull, 1988).                                               and g), with the ABLH < 450 m a.g.l., and have small spa-
   To analyse the temporal variations in the ABLH over the        tial differences. At noon (LST) (Fig. 7e and h), the NBL
TP, the ABL height–occurrence frequency relationships for         and CBL heights rapidly increase, especially in the WTP,
the SBL, NBL, and CBL at 08:00, 14:00, and 20:00 BJT are          which leads to a remarkable east–west gradient in the ABL
presented in Fig. 6a–f. For the SBL, the frequency distri-        height. At this moment, there is a regional mean NBL (CBL)
bution of the ABLH shows a similar feature at three mea-          height of 2074.6 m a.g.l. (2191.4 m a.g.l.) in the WTP and
surement times (Fig. 6a–c) and is characterized by a nar-         1594.8 m a.g.l. (1788.0 m a.g.l.) in the ETP, with a difference
row single mode, with frequency peaks of 39.0 %, 28.1 %,          of 479.8 m (403.4 m) between the WTP and the ETP. In the
and 36.6 % at an ABLH of 200, 300, and 300 m a.g.l. at            late afternoon (LST) (Fig. 7f and i), the NBL (CBL) height
08:00, 14:00, and 20:00 BJT, respectively, which indicates        continues to increase in the WTP, with a regional mean
small temporal variations in the SBL height because the           of 2092.0 m a.g.l. (2192.2 m a.g.l.), while the NBL (CBL)
SBL is inhibited. Moreover, the SBL height above 80 %             height begins to decrease in the ETP, with a regional mean
is < 600 m a.g.l, and the cumulative frequency of the SBL         of 1423.1 m a.g.l. (1237.2 m a.g.l.). This varying feature in
height exceeding 1000 m a.g.l. is low (near 0) at 08:00, 14:00,   the ETP and WTP results in larger differences of 668.9 m
and 20:00 BJT (Fig. 6d–f). For the NBL and CBL, how-              (955.0 m) in the NBL (CBL) height between the WTP and
ever, their heights vary strongly with time under the influence   ETP. Thus there is a significant difference in the frequency
of surface heating in the daytime. At 08:00 BJT (Fig. 6a),        distribution of the ABL height between the ETP and the WTP
the distributions of the NBL and CBL heights are narrow,          in the daytime (Fig. 6g). The cumulative frequency contours
with frequency peaks of 27.5 % and 35.1 % at an ABLH of           gradually go upward from east to west (Fig. 6h). The east-
300 m a.g.l. for NBL and CBL, respectively, similar to that       ern TP is dominated by a low CBL height, with a peak of
of the SBL, which is possibly due to the initial develop-         14.4 % at a height of 350 m a.g.l. (Fig. 6g) and 50 % (5 %)
ment of the CBL and NBL in the early morning (LST). At            of the CBL height below 1000 m a.g.l. (above 2500 m a.g.l.)
14:00 BJT, the CBL and NBL have a wide distribution of            (Fig. 6h). For the WTP, the strong peak of 4 %–10 % cor-

https://doi.org/10.5194/acp-21-5253-2021                                           Atmos. Chem. Phys., 21, 5253–5268, 2021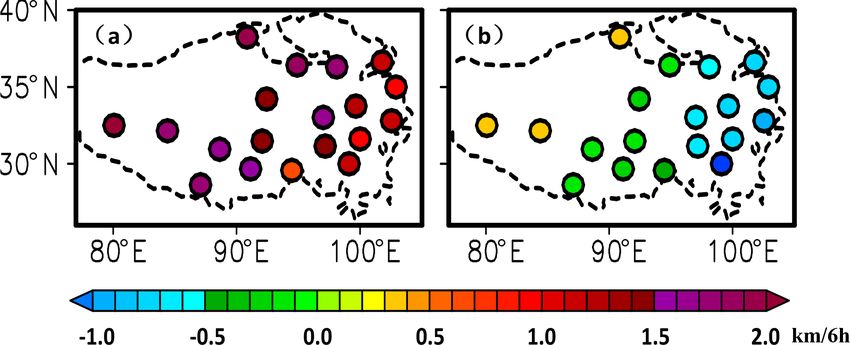
5260                             J. Che and P. Zhao: Summer atmospheric boundary layer height over the Tibetan Plateau

Figure 5. Spatial distribution of the occurrence frequency for the SBL (a–c), NBL (d–f), and CBL (g–i) at 08:00, 14:00, and 20:00 BJT.

responds to the high CBL between 2500 and 3500 m a.g.l.                ing 600 m a.g.l. at 20:00 BJT. Then, which factors contribute
(Fig. 6g), especially at SQH station, and there are larger CBL         to this difference in the ABL between the WTP and ETP? In
heights, with almost 50 % of the CBL extending upward to               the following section, we examine some factors that may be
more than 2500 m a.g.l., almost 10 % reaching 4000 m a.g.l.            responsible for the ABL height over the TP.
or higher, and only 15 % of the CBL below 1000 m a.g.l
(Fig. 6h).
   To investigate an effect of differences in the sample pro-          4   Factors responsible for the ABL height over the TP
files shown in Fig. 1b and d, we use the test group dataset to
                                                                       Previous studies have addressed effects of surface sensi-
repeat the above analyses. Figures 8a and b show the scat-
                                                                       ble heat flux (SHF), soil volume moisture content (VWC),
ter plots of the occurrence frequency of the SBL, NBL, and
                                                                       downward-solar-radiation flux (DSR), and the cloud cover
CBL from the original and test group datasets at each of the
                                                                       (CLD) on ABL height (Liu, et al., 2004; Zhao et al., 2011;
19 stations at 08:00 and 20:00 BJT, respectively. It is seen
                                                                       Sanchez-Mejia and Papuga, 2014; Rihani et al., 2015; Lin et
that the correlation coefficients between the two datasets are
                                                                       al., 2016; Zhang et al., 2017, 2019; Qiao et al., 2019). How-
0.92–0.99, with root mean square errors (RMSEs) of the oc-
                                                                       ever, these studies paid little attention to reasons for the west–
currence frequency between 1.1 % and 2.7 %. Similar results
                                                                       east difference in the ABL between the eastern and western
are also seen in the SBL, NBL, and CBL heights at 08:00 BJT
                                                                       TP. To investigate a possible reason for this difference, we
(Fig. 8c) and 20:00 BJT (Fig. 8d). The correlation coeffi-
                                                                       utilize the TIPEX-III SHF, DSR, and VWC at SQH, NQ,
cients in the ABL height are 0.90–0.99. The RMSE of the
                                                                       and LZ stations and the corresponding meteorological opera-
SBL height is 14 m and 25 m at 08:00 and 20:00 BJT, respec-
                                                                       tional CLD observations to analyse the relationships between
tively. The RMSE of the CBL and NBL heights are 54–59 m
                                                                       these variables and the ABL height.
at 08:00 BJT and 99–107 m at 20:00 BJT. These high correla-
                                                                          The driving force of turbulence in the ABL is the sur-
tions and small errors show that the difference in the sample
                                                                       face buoyancy flux as a result of surface and air temperature
size does not change our conclusions.
                                                                       and humidity differences and the mean surface layer wind.
   From the foregoing analysis, the CBL and NBL heights in
                                                                       The kinematic heat flux (KHF) and kinematic moisture flux
the TP show remarkable temporal variations and west–east
                                                                       (KMF) at the surface are the two factors directly responsible
spatial differences, while these features are not remarkable
                                                                       for the surface buoyancy flux (Brooks and Rogers, 2000).
for the SBL. From noon to the late afternoon (LST), the NBL
                                                                       Since KMF is often small, KHF associated with SHF is ex-
and CBL are deeper in the WTP compared to the ETP, with
                                                                       amined as a major component of buoyancy flux in dry con-
the ABLH difference between the WTP and the ETP exceed-
                                                                       ditions over land. According to the method of Brooks and

Atmos. Chem. Phys., 21, 5253–5268, 2021                                                   https://doi.org/10.5194/acp-21-5253-2021
J. Che and P. Zhao: Summer atmospheric boundary layer height over the Tibetan Plateau 5261 Figure 6. The regional mean frequency distributions of the ABLH over the TP for the CBL (blue), NBL (red), and SBL (black) at (a) 08:00 BJT, (b) 14:00 BJT, and (c) 20:00 BJT; (d–f) same as in (a–c) but for the cumulative frequency distributions; the west–east cross- sections of frequency (g) and cumulative frequency (f) distributions of the CBL height along 32◦ N in the daytime (14:00 and 20:00 BJT). Rogers (2000), our calculation results show that the contri- ference (52 W m−2 ) between SQH and NQ stations. This re- bution from KMF to surface buoyancy flux is below 18 % sult indicates a decreasing trend of SHF from west to east in at SQH, NQ, and LZ stations. Moreover, the ABL may the TP, consistent with a reduction in the ABL height from be largely affected by the cumulative SHF in the daytime SQH via NQ to LZ station (shown in Figs. 3 and 10a). In (Zhang et al., 2019). Thus we analyse the possible effect of addition, Fig. 11 demonstrates the diurnal variations in SHF SHF on the ABL. Figure 9a–c presents the scatter plots be- and the ABL height at SQH, NQ, and LZ stations. The dura- tween the mean SHF over the past 6 h and the ABL height at tion of positive SHF in a diurnal cycle at SQH, NQ, and GZ SQH, NQ, and LZ stations. As shown in this figure, the cor- stations is 14, 12, and 11 h, respectively, and indicates a de- relation is 0.80, 081, and 0.71 (significant at the 99 % con- creasing trend from west to east in the TP. It is clear that the fidence level) at these stations, respectively. When SHF is peak of the SHF occurs earlier than the maximum ABLH in a strong, the turbulent motion is strong, and the ABL develops, diurnal cycle at SQH station. The maximum ABL height oc- which is consistent with the result of Q. Zhang et al. (2011). curs near 20:00 BJT (approximately 17:20 LST), correspond- Their result shows a significant correlation of 0.78 in the arid ing to a strong SHF. At LZ station, however, the SHF turns area of Northwest China between the ABL thickness and the into a negative value at 20:00 BJT (18:20 LST), and then the cumulative SHF. Figure 10a and b further present the fea- ABL height decreases. Some past studies show that the de- tures of the ABL height and SHF at SQH, NQ, and LZ sta- velopment of ABL height generally lags the development of tions. The mean value of SHF is 85, 42, and 33 W m−2 at SHF, and ABL depth growth continues even after SHF attains SQH, NQ, and GZ stations, respectively, and has a large dif- the maximum daytime value until the time of early evening https://doi.org/10.5194/acp-21-5253-2021 Atmos. Chem. Phys., 21, 5253–5268, 2021
5262                            J. Che and P. Zhao: Summer atmospheric boundary layer height over the Tibetan Plateau

Figure 7. Spatial distributions of the mean ABLH for the SBL (a–c), NBL (d–f), and CBL (g–i) at 08:00, 14:00, and 20:00 BJT.

Figure 8. The scatter plots of occurrence frequency of the SBL, NBL, and CBL for the original and test group datasets at 19 stations at
(a) 08:00 BJT and (b) 20:00 BJT; (c, d) same as in (a, b) but for the ABLH.

Atmos. Chem. Phys., 21, 5253–5268, 2021                                                 https://doi.org/10.5194/acp-21-5253-2021
J. Che and P. Zhao: Summer atmospheric boundary layer height over the Tibetan Plateau                                                 5263

Figure 9. Scatter plots of the ABLH and the 6 h average of surface sensible heat flux (SHF) (a–c), surface downward solar irradiance
(DSR) (d–f), total cloud coverage (CLD) (g–i), and surface soil volume moisture content (VWC) (j–l) at 08:00, 14:00, and 20:00 BJT at
SQH (a, d, g, j), NQ (b, e, h, k), and LZ (c, f, i, l) stations in the study period. The correlation coefficient (R) is given in each panel.

Figure 10. (a) The ABLH, (b) SHF, (c) DSR, (d) CLD, and (e) VWC at SQH, NQ, and LZ stations in the study period. Horizontal bars show
the 5th, 25th, 50th, 75th, and 95th percentile values, and “×” symbols show the corresponding mean value.

transitions (Chen et al., 2016; Zhang et al., 2019). Conse-             ature and SHF. We show the scatter plots between the 6 h
quently, the difference in the ABL height between the WTP               mean DSR and the ABL height at SQH, NQ, and LZ stations
and ETP is closely associated with a west–east difference in            (Fig. 9d–f). The ABL height is highly correlated with the
SHF that is a direct thermal factor for the ABL development             6 h average of DSR at these stations, with correlation coef-
in the TP.                                                              ficients of 0.86, 081, and 0.73, respectively, which is equiv-
   The solar radiation at the surface is an important compo-            alent to those of SHF. The mean DSR shows a decreasing
nent of the surface energy budget, affecting surface temper-            trend from SQH (510 W m−2 ) to LZ (200 W m−2 ) station.

https://doi.org/10.5194/acp-21-5253-2021                                                   Atmos. Chem. Phys., 21, 5253–5268, 2021
5264                            J. Che and P. Zhao: Summer atmospheric boundary layer height over the Tibetan Plateau

                                                                     Figure 12. The mean ABLH (for the NBL and CBL) and CLD
                                                                     over the ETP (blue) and WTP (red) in the daytime (14:00 and
                                                                     20:00 BJT).

                                                                     station, with a correlation coefficient of −0.21. This differ-
                                                                     ence between the WTP and the ETP may be associated with
                                                                     the climatic feature of the local soil moisture. The surface
                                                                     type transitions from alpine meadow with few shrubs and
                                                                     trees or alpine steppe in the ETP to bare soil with few obsta-
Figure 11. Diurnal variations in surface sensible heat flux (blue)
                                                                     cles in the WTP (Wang et al., 2016). Accordingly, soil mois-
and the ABLH (red) averaged over the study period at (a) SQH,        ture decreases gradually from the ETP to the WTP (Fig. 10e),
(b) NQ, and (c) LZ stations.                                         with a mean value of soil moisture below 0.10 m3 m−3 at
                                                                     SQH station and 0.38 m3 m−3 at LZ station. Little soil mois-
                                                                     ture in the WTP weakly modulates the local surface heat
Since the solar irradiance at the surface is negatively asso-        flux, which may lead to a weak correlation between the ABL
ciated with the local cloud cover (Guo et al., 2016; Lin et          height and soil moisture in the WTP.
al., 2016; Li et al., 2017; Zhang et al., 2017), the cloud cover
is also correlated with the ABL height. Figure 9g–i shows
that the 6 h mean CLD has significant correlations of −0.56,         5   Summary and discussion
−0.65, and −0.54 with the ABL height at SQH, NQ, and LZ
stations, respectively. A decrease in the mean ABL height            Using the summer TIPEX-III intensive and meteorological
from SQH to LZ station (Fig. 10a) corresponds to an increase         operational observational datasets, we examine the ABL fea-
in cloud cover (Fig. 10d) and a decrease in DSR (Fig. 10c).          tures and the relationships of the ABL height with surface
When cloud cover is between 0 % and 20 %, the mean ABL               sensible heat flux, solar radiation, cloud cover, and soil mois-
height for the NBL and CBL is 2019 m a.g.l. (2732 m a.g.l.)          ture in the TP region. The main conclusions are summarized
in the ETP (WTP), and when cloud cover is > 80 %, the                as follows.
ABL height decreases to 741 m a.g.l. (1626 m a.g.l.) in the             Generally speaking, the ABL height exhibits diurnal vari-
ETP (WTP) (Fig. 12). Therefore, the increased cloud cover            ations and regional differences in the TP, especially for the
inhibits the development of both the NBL and CBL. The dif-           CBL and NBL. These features are weak for the SBL. Com-
ference in cloud cover between the WTP and ETP contributes           pared to the ETP, the ABL in the WTP has the larger am-
to the west–east distribution of DSR and SHF, also finally           plitude of the diurnal variation and the longer development
contributing to the difference in the ABL development. Cor-          time. In the early morning (LST), the ABL height is gener-
responding to more cloud cover in the ETP, the local ABL             ally low over the TP, not showing a large west–east differ-
is more closely associated with atmospheric moisture pro-            ence, and the distribution of the ABL height is narrow, with
cesses.                                                              78.5 % of the ABL height < 500 m a.g.l. At noon (LST), the
   Soil moisture is also an important factor affecting SHF.          CBL and NBL heights remarkably increase and have a wide
Low soil moisture generally coincides with a high sur-               distribution in the ABL height up to 4000 m a.g.l., with more
face sensible heat flux, which facilitates the ABL develop-          than 50 % of the ABL height exceeding 1900 m a.g.l. Their
ment (e.g. McCumber and Pielke, 1981; Sanchez-Mejia and              heights exhibit a large west–east difference. At this moment,
Papuga, 2014; Rihani et al., 2015). Figure 9j–l shows that           the distribution of the SBL height is also narrow, with a cu-
the relationship between the ABL height and the 6 h mean             mulative frequency of 80 % at a height of 500 m a.g.l., and
VWC at SQH, NQ, and LZ stations. The ABL height at LZ                there is no remarkable west–east difference. In the late after-
station is negatively correlated with the local soil moisture,       noon (LST), there is a narrow distribution of the SBL height
with a significant correlation coefficient of −0.45. This result     and wide distributions of both the NBL and CBL heights.
indicates that the ABL height is lower when surface soil is          At this moment, the ABL height continues to increase in the
moister. However, the negative correlation is weaker at SQH          WTP, while it begins to decrease in the ETP. This feature re-

Atmos. Chem. Phys., 21, 5253–5268, 2021                                                https://doi.org/10.5194/acp-21-5253-2021
J. Che and P. Zhao: Summer atmospheric boundary layer height over the Tibetan Plateau 5265
height, occurrence frequency, and diurnal amplitude over the
TP region during summer for the first time. It is noted that
there is a big drop in the CBL height, from 3000–4000 to
1000–2000 m a.g.l., from the WTP to the ETP. Such a steep
west–east inhomogeneity in the TP (with an east–west spa-
tial scale of about 2000 km) is remarkably different from
the regional variability in the ABLH on much larger scales
(∼ 4000 km), such as in the United States (Seidel et al., 2012)
and in China (Guo et al., 2016). This unique inhomogeneity
in the TP may trigger the local mesoscale circulation, con-
vection, and precipitation according to relationships among
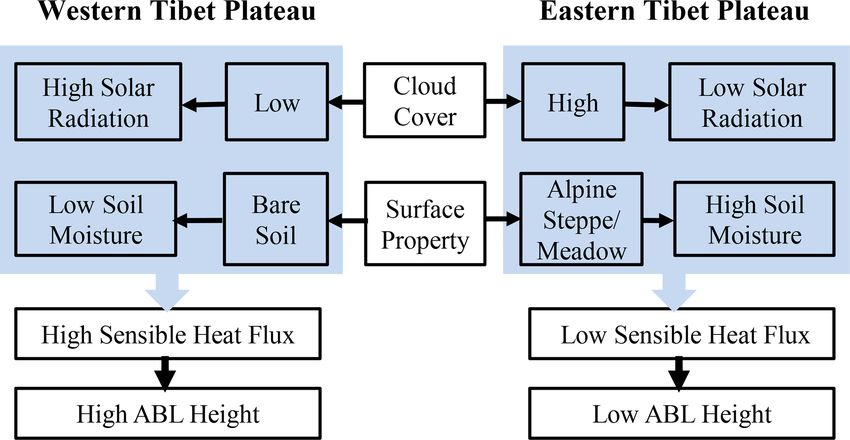
Figure 13. The schematic diagram for relationships between the surface heating, ABL, and convection activities (Segal and
ABLH and the influential factors in the ETP and the WTP. Arritt, 1992; Goutorbe et al., 1997; Huang et al., 2009; Zhang
et al., 2019; Qiao et al., 2019). Therefore, the influences of
the west–east differences in the ABLH over the TP on the
sults in a larger west–east difference in the ABL height. In local weather and climate should be further studied in the
spite of a cold environment in the TP (relative to plain ar- future. In addition, this study merely investigates the charac-
eas), the WTP still has an ABL height above 2000 m a.g.l., teristics of the summer ABLH in the TP due to the limitation
which is similar to some extreme hot and arid areas such as of the intensive-sounding observations. More efforts should
Dunhuang and Taklimakan deserts. In the ETP, the ABLH be made to expand the climatology of ABLH to other seasons
is similar to that in North China (1500–1900 m a.g.l) and is in the TP when more sounding data are available.
generally larger compared to the East Asian summer mon-
soon region (< 1500 m a.g.l) such as the Yangtze River Delta
and the Pearl River Delta (Zhang et al., 2011, 2017; Guo et Code and data availability. The TIPEX-III original observations
al., 2016; Qiao et al., 2019). used in this study are available on its website (http://data.cma.cn/
The occurrence frequency of the SBL and CBL in the tipex; last access: 10 March 2021). The calculation code and derived
TP shows remarkable temporal variations. Most (few) of the data in this study are open and available by contacting Junhui Che
(chejunhui9@163.com).
SBLs (CBLs) occur in the early morning, and the occurrence
frequency rapidly decreases (increases) at noon (LST), ac-
counting for 3.6 % (76.9 %) of the ABL in the TP. Possibly
Competing interests. The authors declare that they have no conflict
owing to a difference in the solar elevation angle with respect of interest.
to longitude in the late afternoon (LST), the SBL and CBL
dominate the ETP and WTP, respectively. However, the NBL
shows a relatively weak temporal variation over the TP, with Author contributions. JC designed the study, analysed the data, and
a mean occurrence frequency of 6.4 % in the early morning wrote the manuscript. PZ contributed to the study design, supervi-
and around 20 % at noon and in the late afternoon (LST). sion, and writing of the manuscript.
The ABL height is significantly correlated with SHF, DSR,
and cloud cover in the TP and is also closely associated with
soil moisture in the ETP. The decreasing trends in both SHF Acknowledgements. We thank the TIPEX-III for providing the data
and DSR and the increasing trends in both cloud cover and available on its home pages (http://data.cma.cn/tipex, last access:
soil moisture from west to east may cause the corresponding 21 March 2021). This work is supported by the National Key Re-
west–east reduction in the ABL height. In the WTP (ETP), search and Development Program of China and the Strategic Prior-
with low (high) cloud cover, there is larger (smaller) down- ity Research Program of the Chinese Academy of Sciences.
ward solar radiation at the surface. Meanwhile, correspond-
ing to bare soil (alpine meadow or steppe) in the WTP (ETP),
there is a dry (wet) soil condition. These features cause high Financial support. This research has been supported by the Na-
tional Key Research and Development Program of China (grant
(low) sensible heat flux, thus promoting (inhibiting) the local
no. 2018YFC1505700) and the Second Scientific Expedition to the
ABL development. The above factors affecting the WET and Qinghai–Tibet Plateau (grant no. 2019QZKK020803).
ETP ABL heights are summarized in Fig. 13.
The Tibetan Plateau is an area very sensitive to global
climate change and exerts important thermal and dynami- Review statement. This paper was edited by Peter Haynes and re-
cal effects on the general circulation and climate through the viewed by three anonymous referees.
unique and complex land surface and boundary layer pro-
cesses. Owing to new sounding observations in the WTP, our
analysis reveals remarkable west–east differences in the ABL
https://doi.org/10.5194/acp-21-5253-2021 Atmos. Chem. Phys., 21, 5253–5268, 20215266 J. Che and P. Zhao: Summer atmospheric boundary layer height over the Tibetan Plateau
References study in climate and desertification, J. Hydrol., 188–189, 4–17,
https://doi.org/10.1016/S0022-1694(96)03308-2, 1997.
Blay-Carreras, E., Pino, D., Vilà-Guerau de Arellano, J., van de Guo, J., Miao, Y., Zhang, Y., Liu, H., Li, Z., Zhang, W., He, J., Lou,
Boer, A., De Coster, O., Darbieu, C., Hartogensis, O., Lohou, M., Yan, Y., Bian, L., and Zhai, P.: The climatology of plan-
F., Lothon, M., and Pietersen, H.: Role of the residual layer and etary boundary layer height in China derived from radiosonde
large-scale subsidence on the development and evolution of the and reanalysis data, Atmos. Chem. Phys., 16, 13309–13319,
convective boundary layer, Atmos. Chem. Phys., 14, 4515–4530, https://doi.org/10.5194/acp-16-13309-2016, 2016.
https://doi.org/10.5194/acp-14-4515-2014, 2014. Guo, J. P., Zhang, X. Y., Che, H. Z., Gong, S. L., An, X., and Cao,
Bosveld, F. C., Baas, P., Steeneveld, G., Holtslag, A. A. M., C. X.: Correlation between PM concentrations and aerosol op-
Angevine, W. M., Bazile, E., Bruijn, E. I. F., Deacu, D., Ed- tical depth in eastern China, Atmos. Environ., 43, 5876–5886,
wards, J. M., Ek, M., Larson, V. E., Pleim, J. E., Raschendor- https://doi.org/10.1016/j.atmosenv.2009.08.026, 2009.
fer, M., and Svensson, G.: The third GABLS intercomparison Holtslag, B. and Boville, B. A.: Local versus nonlocal
case for evaluation studies of boundary-layer models, Part B: boundary-layer diffusion in a global climate model,
Results and process understanding, Bound.-Lay. Meteorol., 152, J. Climate, 6, 1825–1842, https://doi.org/10.1175/1520-
157–187, https://doi.org/10.1007/s10546-014-9919-1, 2014. 0442(1993)0062.0.CO;2,1993.
Brooks, I. M. and Rogers, D. P.: Aircraft observations of the Hong, J., Guo, J., Du, J., and Wang, P.: An observational study on
mean and turbulent structure of a shallow boundary layer the vertical structure of the upper troposphere and lower strato-
over the Persian Gulf, Bound.-Lay. Meteorol., 95, 189–210, sphere in Gaize, Tibet during the rainy season, Acta Meteorol.
https://doi.org/10.1023/A:1002623712237, 2000. Sin., 74, 827–836, https://doi.org/10.11676/qxxb2016.05, 2016.
Chen, S. S. and Houze, R. A.: Diurnal variation and life- Huang, J. P., Minnis, P., Yi, Y., Tang, Q., Wang, X., Hu, Y., Liu,
cycle of deep convective systems over the tropical Pa- Z., Ayers, K., Trepte, C., and Winker, D.: Summer dust aerosols
cific warm pool, Q. J. Roy. Meteor. Soc., 123, 357–388, detected from CALIPSO over the Tibetan Plateau, Geophys. Res.
https://doi.org/10.1002/qj.49712353806, 1997. Lett., 34, L18805, https://doi.org/10.1029/2007GL029938, 2007.
Chen, X. L., Juan, A. Añel., Su, Z. B., Laura, de. La. Torre., Hen- Huang, Q., Marsham, J. H., Parker, D. J., Tian, W., and Weck-
nie, Kelder., Jacob, van. Peet., and Ma, Y. M.: The deep atmo- werth, T.: A comparision of roll and nonroll convection and
spheric boundary layer and its significance to the stratosphere the subsequent deepening moist convection: An LEM case
and troposphere exchange over the Tibetan Plateau, PLoS. ONE, study based on SCMS data, Mon. Weather Rev., 137, 350–365,
8, e56909, https://doi.org/10.1371/journal.pone.0056909, 2013. https://doi.org/10.1175/2008MWR2450.1, 2009.
Chen, X. L., Škerlak, B., Rotach, M. W., Juan, A. Anel., Su, Lee, T. R. and Pal, S.: On the potential of 25 Years (1991–
Z. B., Ma, Y. M., and Li, M. S.: Reasons for the ex- 2015) of rawinsonde measurements for elucidating climatolog-
tremely high-ranging planetary boundary layer over the West- ical and spatiotemporal patterns of afternoon boundary layer
ern Tibetan Plateau in winter, J. Atmos. Sci., 73, 2021–2038, depths over the contiguous US, Adv. Meteorol., 2017, 6841239,
https://doi.org/10.1175/jas-d-15-0148.1, 2016. https://doi.org/10.1155/2017/6841239, 2017.
Dai, C., Wang, Q., Kalogiros, J. A., Lenschow, D. H., Gao,Z., Lee, T. R. and Pal, S.: The impact of height-independent errors in
and Zhou, M.: Determining boundary-layer height from air- state variables on the determination of the daytime atmospheric
craft measurements, Bound.-Lay. Meteorol., 152, 277–302, boundary layer depth using the bulk Richardson approach, J. At-
https://doi.org/10.1007/s10546-014-9929-z, 2014. mos. Ocean. Tech., 38, 47–61, https://doi.org/10.1175/JTECH-
Davy, R.: The climatology of the atmospheric boundary layer in D-20-0135.1, 2021.
contemporary global climate models, J. Climate, 31, 9151–9173, Li, J. L., Hong, Z. X., and Sun, S. F.: An observational ex-
https://doi.org/10.1175/JCLI-D-17-0498.1, 2018. periment on the atmospheric boundary layer in Gerze area
Davy, R. and Esau, I.: Differences in the efficacy of climate forcings of the Tibetan Plateau, Chinese J. Atmos. Sci., 24, 301–312,
explained by variations in atmospheric boundary layer depth, https://doi.org/10.3878/j.issn.1006-9895.2000.03.02, 2000.
Nat. Commun., 7, 11690, https://doi.org/10.1038/ncomms11690, Li, M. S., Ma, Y. M., Ma, W. Q., I, Hirohiko., Sun, F.
2016. L., and Ogino, S. Y.: Structural difference of atmospheric
Driedonks, A. G. M. and Tennekes, H.: Entrainment effects in the boundary layer between dry and rainy seasons over the
well-mixed atmospheric boundary layer, Bound.-Lay. Meteorol., central Tibetan Plateau, J. Glaciol. Geocryol., 33, 72–79,
30, 75–105, https://doi.org/10.1007/BF00121950, 1984. https://doi.org/10.3969/j.issn.1000-6826.2014.06.03, 2011.
Esau, I. and Zilitinkevich, S.: On the role of the planetary bound- Li, N., Zhao, P., Wang, J., and Deng, Y.: Estimation of surface heat
ary layer depth in the climate system, Adv. Sci. Res., 4, 63–69, fluxes over the central Tibetan Plateau using the maximum en-
https://doi.org/10.5194/asr-4-63-2010, 2010. tropy production model, J. Geophys. Res.-Atmos., 124, 6827–
Garratt, J. R.: The Atmospheric Boundary Layer, Cambridge, 6840, https://doi.org/10.1029/2018JD029959, 2019.
Univ. Press., 37, 89–134, https://doi.org/10.1007/3-211-38078- Li, N., Zhao, P., Wang, J., and Deng, Y.: The Long-Term Change of
7_4, 1992. Latent Heat Flux over the Western Tibetan Plateau, Atmosphere-
Garratt, J. R.: Sensitivity of climate simulations to land-surface Basel, 11, 262, https://doi.org/10.3390/atmos11030262, 2020.
and atmospheric boundary-layer treatments–A review, J. Cli- Li, Y. and Gao, W.: Atmospheric boundary layer circulation on the
mate, 6, 419–448, https://doi.org/10.1175/1520-0442(1993)006< eastern edge of the Tibetan Plateau, China, in summer, Arct.
0419:socstl> 2.0.co;2, 1993. Antarct. Alp. Res., 39, 708–713, https://doi.org/10.1657/1523-
Goutorbe, J. P., Lebel, T., Dolman, A. J., Gash, J. H. C., Kabat, 0430(07-50 4)[li]2.0.co;2, 2007.
P., Kerr, Y. H., Monteny, B., Prince, S. D., Stricker, J. N. M.,
Tinga, A., and Wallace, J. S.: An overview of HAPEX-Sahel: A
Atmos. Chem. Phys., 21, 5253–5268, 2021 https://doi.org/10.5194/acp-21-5253-2021You can also read