Intrinsic disorder in protein domains contributes to both organism complexity and clade specific functions - Nature
←
→
Page content transcription
If your browser does not render page correctly, please read the page content below
www.nature.com/scientificreports
OPEN Intrinsic disorder in protein
domains contributes
to both organism complexity
and clade‑specific functions
Chao Gao1,3, Chong Ma1,2,3, Huqiang Wang1, Haolin Zhong1, Jiayin Zang1, Rugang Zhong2,
Fuchu He1* & Dong Yang1,3*
Interestingly, some protein domains are intrinsically disordered (abbreviated as IDD), and the disorder
degree of same domains may differ in different contexts. However, the evolutionary causes and
biological significance of these phenomena are unclear. Here, we address these issues by genome-
wide analyses of the evolutionary and functional features of IDDs in 1,870 species across the three
superkingdoms. As the result, there is a significant positive correlation between the proportion of
IDDs and organism complexity with some interesting exceptions. These phenomena may be due
to the high disorder of clade-specific domains and the different disorder degrees of the domains
shared in different clades. The functions of IDDs are clade-specific and the higher proportion of
post-translational modification sites may contribute to their complex functions. Compared with
metazoans, fungi have more IDDs with a consecutive disorder region but a low disorder ratio, which
reflects their different functional requirements. As for disorder variation, it’s greater for domains
among different proteins than those within the same proteins. Some clade-specific ‘no-variation’ or
‘high-variation’ domains are involved in clade-specific functions. In sum, intrinsic domain disorder
is related to both the organism complexity and clade-specific functions. These results deepen the
understanding of the evolution and function of IDDs.
Proteins containing intrinsically disordered regions (IDR)1,2 are called intrinsically disordered proteins (IDP, also
named as intrinsically u nstructured3,4 or natively unfolded p roteins5), which haven no stable ordered structure
but have important biological functions via interacting with various p artners1–3,6. According to our empirical
knowledge, protein domains, as conserved units that can evolve, fold7 and function8 independently, are the
structured and compact r egions9 in contrast to IDRs. However, some protein domains indeed can exist and
function without a stable three-dimensional structure. This type of protein domains was named as intrinsically
disordered domains (IDDs). During the last two decades, an increasing number of IDDs have been reported10–14.
Previous studies mainly focused on the special physical–chemical properties and functional characteristics
of certain IDDs. For example, Dogan et al.15 found that the binding rates of disordered domains are faster than
those of structured domains. Stanley et al.16 showed that in the cAMP response element binding protein (CREB),
the disordered kinase inducible domain (KID) could become structured after its phosphorylation. Furthermore,
a research has revealed that IDDs can participate in the formation of dynamic protein complexes and prevent
additional protein monomer polymerization to maintain protein s tability17.
The preceding studies mainly focused on different individual disordered protein domains. With the advance-
ment of genome sequencing of human and model organisms, the characteristics of IDDs at the entire proteome
level have been explored by some studies. Chen et al. explored the distribution pattern of the conserved pre-
dicted disordered regions in domains and domain f amilies18, and this kind of IDDs can mediate protein–protein
recognition19. However, the distribution pattern of the IDDs across the species of the three superkingdoms and
its functional significance are unclear. To this end, the calculation of the number of IDDs encoded by a genome
1
State Key Laboratory of Proteomics, National Center for Protein Sciences (Beijing), Beijing Proteome Research
Center, Beijing Institute of Lifeomics, 38 Science Park Road, Changping District, Beijing 102206, China. 2Beijing
Key Laboratory of Environmental and Viral Oncology, College of Life Science and Bioengineering, Beijing
University of Technology, Beijing 100124, China. 3These authors contributed equally: Chao Gao, Chong Ma and
Dong Yang. *email: hefc@nic.bmi.ac.cn; yangdongbprc@163.com
Scientific Reports | (2021) 11:2985 | https://doi.org/10.1038/s41598-021-82656-9 1
Vol.:(0123456789)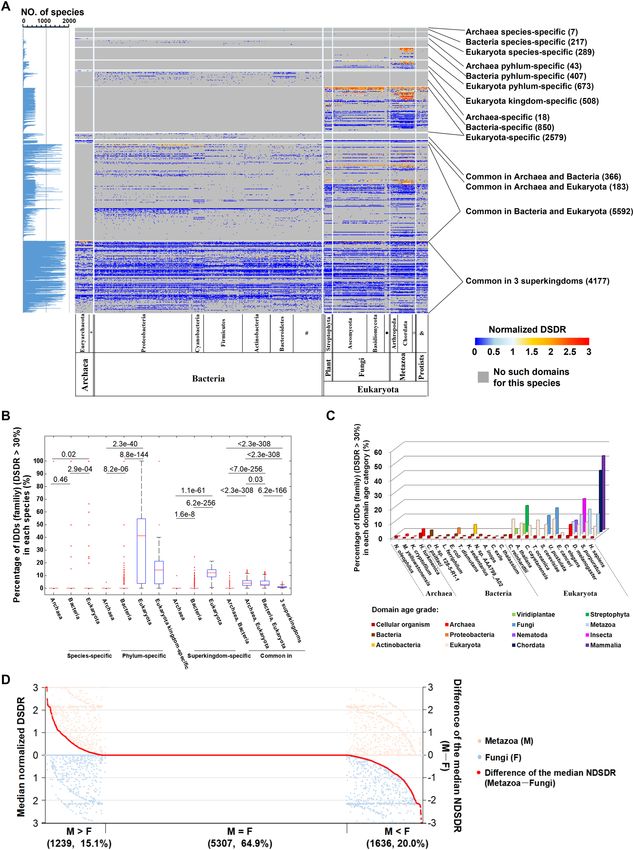
www.nature.com/scientificreports/
Figure 1. Distribution of IDDs in 1870 species across the three superkingdoms. (A) The percentage of IDDs ▸
(DSDR > 30%) in each species from archaea (light green), bacteria (lime) and eukaryotes. Each bar indicates
the results of a species. All species are arranged according to taxonomy information from NCBI database. The
superkingdoms are separated by solid lines and the kingdoms in eukaryotes, including protists (light blue),
metazoa (aqua), fungi (yellow) and plant (pale goldenrod), are separated by dashed lines. Each phylum is filled
with different colors in the middle circle. The outer circle represents different classes. The detailed information
about the names and colors of each species, class and phylum is presented in supplementary table S1–S3. The
abbreviations in this figure: Ha, the class of Halobacteria; DSDR, domain structural disorder ratio. (B) Box-plot
of the percentage of intrinsically disordered (DSDR > 30%) domain (purple) or domain families (red) in each
species across the three superkingdoms (C, excluding halobacteria). For box-plots, the values of upper and lower
quartile are indicated as upper and lower edges of the box, and the median values are indicated as a bar in the
box. The differences in percentage of disordered domain distribution between different categories are examined
by Mann–Whitney U test. The corrected P values are shown at the top of each panel. (D) Cumulative probability
of the percentage of intrinsically disordered domain (solid line) or domain families (dashed line) in archaea
(blue), bacteria (green) and eukaryotes (red) (E, excluding halobacteria).
and a comprehensive exploration of their evolutionary and functional features are important; such research will
enrich our understanding of the evolution of the protein repertoire.
More specifically, this analysis will also provide valuable insights into the mechanism of the increasing organ-
ismal complexity during evolution. Previous studies suggest hub proteins usually have higher content of intrinsic
disorder to interact with various partners and form complex n etworks6,20–25 and IDPs substantially contribute to
the increasing organism c omplexity26,27. It is known clearly that eukaryotes have more proportion of intrinsically
disordered proteins than p rokaryotes26–31. However, the proportion of disorder at protein level in eukaryotes has
no good correlation with species complexity26,27. Here, we investigated the relationship between the proportion
of intrinsic disorder at domain level and eukaryotic organism complexity.
In this study, there are two measures of the degree of disorder: the domain structural disorder ratio (DSDR),
represented by the percentage of disordered residues in one domain; and CDRN, the number of consecutive
disordered regions (CDR). CDRs are the regions where the consecutive disordered residues are more than 20 in
the domains longer than 50 residues, or more than 40% of the total residues in the other domains. The relation-
ship between these two measures had not been explored before. We investigated their relationship and compared
the relationship patterns among different evolutionary lineages.
Protein domains usually repeat in the same proteins or are shared among different proteins. The unique
protein domain types are defined as domain f amilies32,33. Each domain family has a unique domain identifier
and name (See Method section for its detailed definition). Based on usual understanding, the protein domains
belonging to a same family should have the same structural characteristics. To test whether this intuitive under-
standing is correct, the variation of the disorder degree of the same protein domains was investigated in our
analysis. Furthermore, we investigated the factors that affect the variation of domain disorder and the biological
significance of their variation.
Results
Distribution of IDDs across the three superkingdoms. In order to achieve a complete representation
of the distribution pattern of IDDs across the three superkingdoms, one representative species was chosen from
each genus. In total, 1,870 species were involved in the calculation and analysis of domain disorder, including 97
species of archaea, 1224 species of bacteria and 549 species of eukaryotes (Dataset 1, 2; including 135 metazoans,
304 fungi, 65 protists, and 45 plants). We found that the percentages of IDDs (DSDR > 30%, or CDRN ≥ 1) are
highest in eukaryotes compared with the other two superkingdoms (Fig. 1, S1, and table S1A, S2A for the results
based on SPOTD; Table S1B, S2B for the results based on IUPred; Figure S2 and table S1C, S2C for the results
based on MobiDB-lite). From the viewpoint of domain families, the degree of disorder of each domain family
is defined by the dominant category (Figure S3). The median proportion of IDD families in eukaryotes is 10.1%
(See table S2A for raw data), while in archaea and bacteria the corresponding value is 1.5% (See table S2A for
raw data). These results indicate that evolutionarily more complex species (hereinafter, abbreviated as ‘complex
species’) have a considerably higher proportion of IDDs.
One of the most obvious exceptions to this observation is found in archaeal halobacteria, which contain an
even higher proportion of IDDs than eukaryotes (Fig. 1A). When halobacteria were excluded from archaea, the
ratio of IDDs per species in archaea was the lowest among the three superkingdoms (Fig. 1B–E, S1B-E, S2A–D).
Other studies have also found that halobacteria have an unusually high ratio of disordered proteins34. However,
another literature reported that this phenomenon was due to methodological b ias35. Our results show that the
original conclusion is valid even if the method is corrected (Figure S4). The main innovation of the current study
is that we focused on disorder at the domain level, while previous studies focused on the disorder at protein level.
Comparing the percentage of IDDs calculated at domain level (Table S1) to that at domain family level
(Table S2), we found an interesting phenomenon: in eukaryotes, the percentages of IDDs were considerably lower
than those of the disordered domain families (Fig. 1B–E, S1B–E, S2A–D), whereas there are no such significant
differences between domain and domain families in archaea and bacteria. This phenomenon may be related to
the number of domain repeats in eukaryotes. The average number of repeats of the disordered domain families
was obviously less than that of the completely structured domain families (Figure S5, Table S4). Completely
structured domains in eukaryotes tend to repeat many times.
Scientific Reports | (2021) 11:2985 | https://doi.org/10.1038/s41598-021-82656-9 2
Vol:.(1234567890)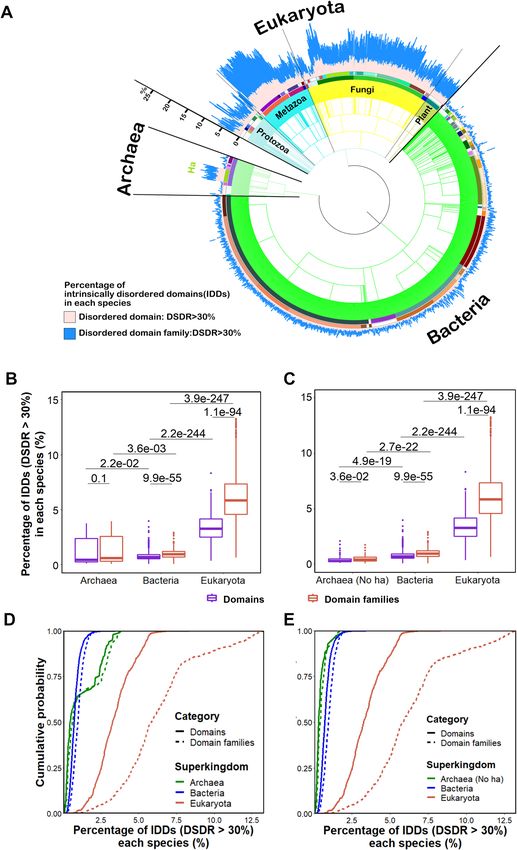
www.nature.com/scientificreports/

Scientific Reports |   (2021) 11:2985 |   https://doi.org/10.1038/s41598-021-82656-9        3

                                                                                       Vol.:(0123456789)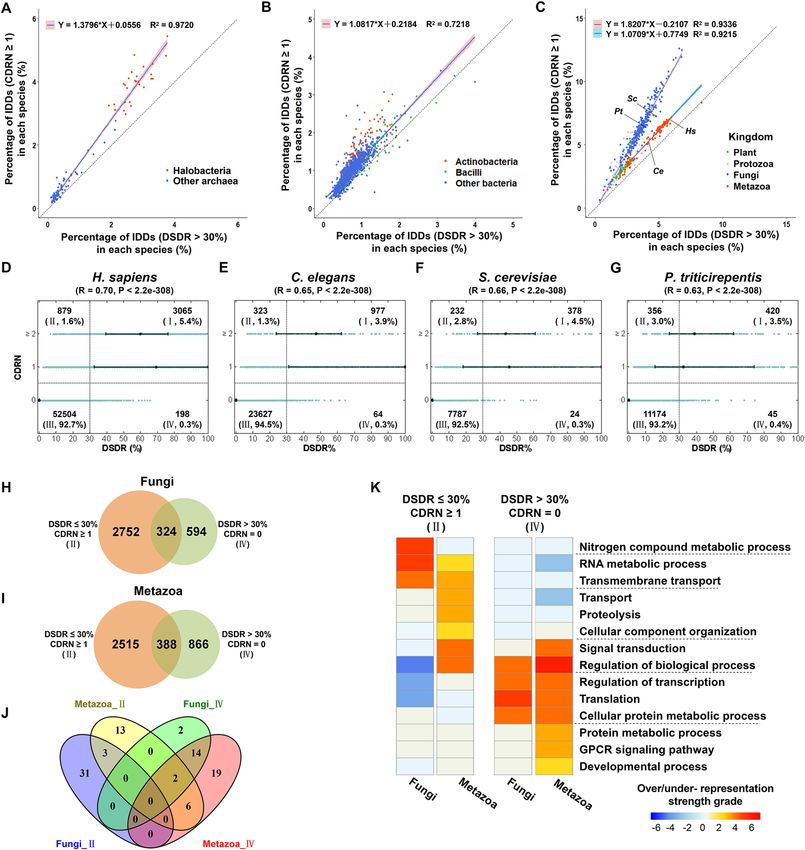
www.nature.com/scientificreports/
The above results revealed that there is an obvious difference between prokaryotes and eukaryotes in the IDD
distribution pattern. We next focused on the difference of IDD distribution of different clades within eukaryotes.
The correlation between intrinsic disorder of protein domain and eukaryotic organism com‑
plexity. Different eukaryotes have great differences in complexity. Some are only unicellular eukaryotes,
while others have hundreds of cell types. The organism complexity of eukaryotes can be measured by the num-
ber of cell types in this species36–40. In previous studies, Schad et al.26 and Xue et al.27 reported that the fraction
of protein structural disorder increases significantly between prokaryotes and eukaryotes but within eukaryotes
there was no significant correlation between organism complexity and the average disorder content in proteins.
We confirmed that protein disorder does not significantly correlate well with organism complexity, whether we
use the average value of protein structural disorder ratio (PSDR, Fig. 2A, S6A) or the percentage of disordered
proteins (PSDR > 30%) (Fig. 2B, S6B) to represent the disorder degree of proteome. However, there is a sig-
nificant positive correlation between the percentage of disordered protein domain (DSDR > 30%) and organism
complexity (Fig. 2C, S6C), but if CDRN was used to define disordered protein domain, there is no significant
correlation (Fig. 2D, S6D), indicating that in complex species there are more disordered domains with higher
ratios of disordered residues, not with a consecutive disordered region. These results revealed that compared
with the simple eukaryotes, the complex ones contain much more IDDs, but at protein level, they have no such
obvious difference in the proportion of intrinsically disordered proteins (IDPs). This implies that IDDs may
contribute to the complex functions in evolutionarily complex eukaryotes.
When domain repetition of the same domain family in one species was not taken into account, a stronger
correlation can be obtained (Fig. 2E–F, S6E–F), suggesting complex eukaryotes have more IDDs without repeti-
tion compared with simple eukaryotes. This means factors unrelated to organism complexity are added when
considering domain repetitions (Fig. 2C–D, S6C–D). The proportion of IDDs in complex eukaryotes will decrease
when the domain repetitions are included, because structured domains have more repetition counts than dis-
ordered domains.
These results suggest that domain disorder, rather than protein disorder, is an important factor contributing
to eukaryotic organism complexity. Intrinsic disorder in protein domains may be an important factor to promote
the increasing complexity of eukaryotes.
However, the comparison of different species of eukaryotes showed that the percentage of IDDs in simpler
organisms is even higher than that of complex organisms (Fig. 2G, Figure S7). For example, the percentages of
IDDs in ascomycetes or basidiomycetes, two phyla of fungi, are much higher than those in some metazoans,
such as arthropods. However, according to the cell type number of an organism (Approximately: 5 for these
two phyla of fungi vs. 64 for arthropod Drosophila melanogaster)26,37, the organismal complexity of arthropods
is much higher than fungi of these two phyla. Thus, intrinsic domain disorder in a species is not only related
to organismal complexity, but may also be related to special functions, which will be discussed in the following
text (Part 4 results).
The causes of uneven distribution of IDDs among species. The preceding results show that, in gen-
eral, the percentage of IDDs in species is positively related to organism complexity, that is, there is a greater
proportion of IDDs in complex species; but in some instances, there are also more IDDs in some simpler species
compared to complex species. What is the reason for the uneven distribution of the proportion of IDDs across
species? This may be related to two aspects of protein domain evolution: firstly, some clade-specific domains
(only appear in the species of a certain evolutionary clade) may tend to be more disordered, leading to the
higher proportion of IDDs in these species, especially in complex eukaryotic species; secondly, the degree of
disorder of some common domains (appear widely across a kingdom, even across superkingdoms) diverged
during evolution, that is, some domains from the same families may have remarkably different DSDR values in
different species.
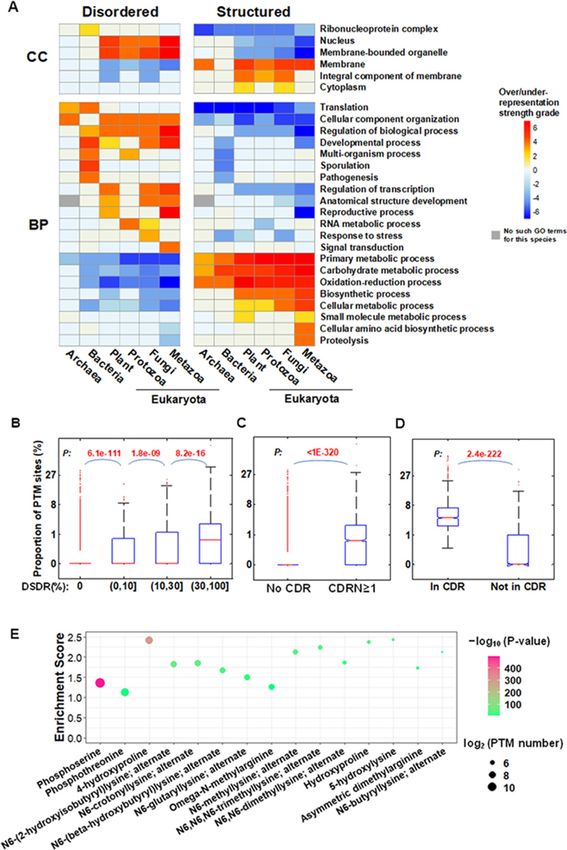
In order to test these two hypotheses, we first classified protein domains into 14 categories according to the
species distribution width (Fig. 3A, Dataset 3). For the first hypothesis, the percentage of IDDs in each cat-
egory was calculated. It was clear that eukaryote-specific domains, including species-specific, phylum-specific,
kingdom-specific and superkingdom-specific domains, contained a higher proportion of IDDs than prokaryote-
specific domains (Fig. 3B). The distribution width of a domain could be used as an indicator of evolutionary
origin time (domain age); thus, we can infer that young domains (clade-specific domains) tend to be IDDs
especially in eukaryotes. As examples, the data of 25 representative species were used to calculate the proportions
of IDDs in the domains with different domain age grades. We found that younger domains consist of a higher
fraction of IDDs than older ones, particularly in complex eukaryotes (Fig. 3C, S8A–C). For example, in humans,
over half of the mammalian-specific domains are IDDs.
For the second hypothesis, we compared the degree of disorder of the same domains among different species.
For the domains common in metazoans and fungi, 15.1% of them had higher degrees of disorder in metazoans,
whereas 20.0% of them had higher degrees of disorder in fungi (Fig. 3D). Thus, the degree of disorder of old
domains (widely distributed domains) varies considerably among species, but the degree of disorder is not
always high in complex species. The comparisons between eukaryotes and prokaryotes (Figure S9A), multicel-
lular eukaryotes and unicellular eukaryotes (Figure S9B), metazoan and protozoa (Figure S9C), and between
chordates and other metazoans (Figure S9D) also supported this conclusion.
These two factors led to the fact that each evolutionary clade may have its own specific young IDDs and
special ancient IDDs.
Scientific Reports | (2021) 11:2985 | https://doi.org/10.1038/s41598-021-82656-9 4
Vol:.(1234567890)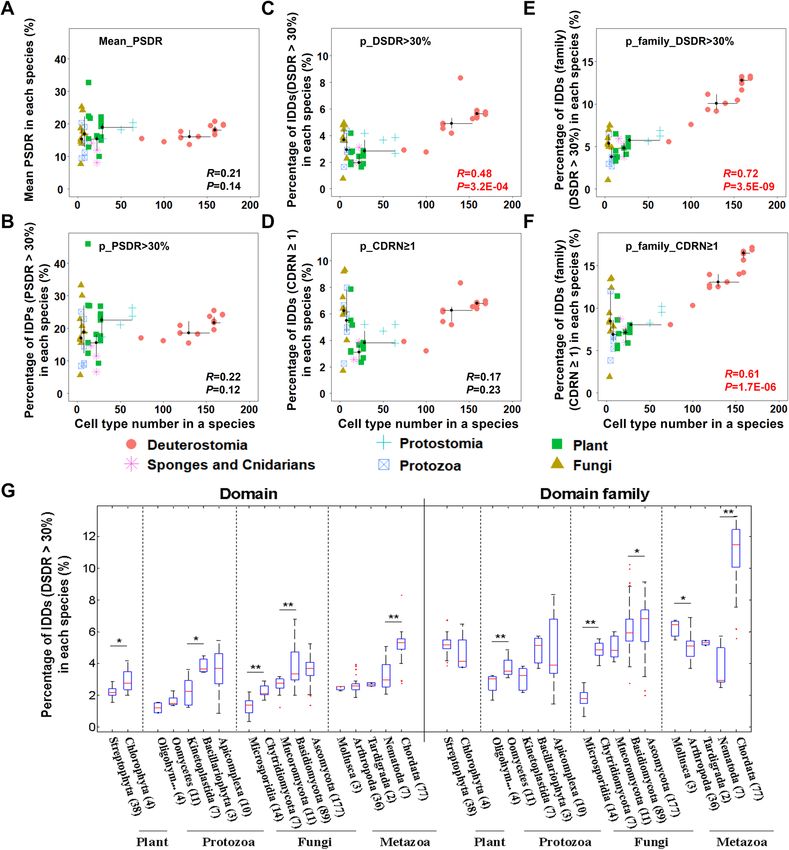
www.nature.com/scientificreports/

                                  Figure 2.  The correlation between structural disorder and organism complexity. (A) Protein disorder degree
                                  was measured by the average of all representative proteins (the longest one for each gene) in each species. (B)
                                  Proteins with more than 30% disordered amino acids (PSDR > 30%) were regarded as disordered proteins.
                                  Protein disorder degree was measured by the percentage of disordered proteins in each species. (C, D) At
                                  domain level, structural disorder of each species was measured by the percentage of IDDs (C, DSDR > 30%, or
                                  D, CDRN ≥ 1). (E, F) At domain family level, domain families were defined using dominant category method;
                                  structural disorder of each species was measured by the percentage of intrinsically disordered domain families
                                  (E, family_DSDR > 30%, or F, family_CDRN ≥ 1). Scatter plots was made for organism complexity and structural
                                  disorder values obtained by different methods in fifty-one eukaryotes. Spearman method was used for the
                                  correlation analysis. The correlation coefficients (R) and P values (P) are shown in the inset, among which the
                                  significant results are shown as red. (G) Box-plot of the percentage of intrinsically disordered (DSDR > 30%)
                                  domains (left panel) or domain families (right panel) in each species across the different phyla of eukaryotes.
                                  The four kingdoms of eukaryotes are marked on the bottom of the figure. The values of upper and lower
                                  quartile, and the median values are indicated as bars in the boxes. The differences in percentage of disordered
                                  domain distribution between adjacent categories are examined by Mann–Whitney U test. The corrected P values
                                  are marked as stars in sub-figure G (*P < 0.05; ** P < 0.01).

Scientific Reports |   (2021) 11:2985 |               https://doi.org/10.1038/s41598-021-82656-9                                               5

                                                                                                                                          Vol.:(0123456789)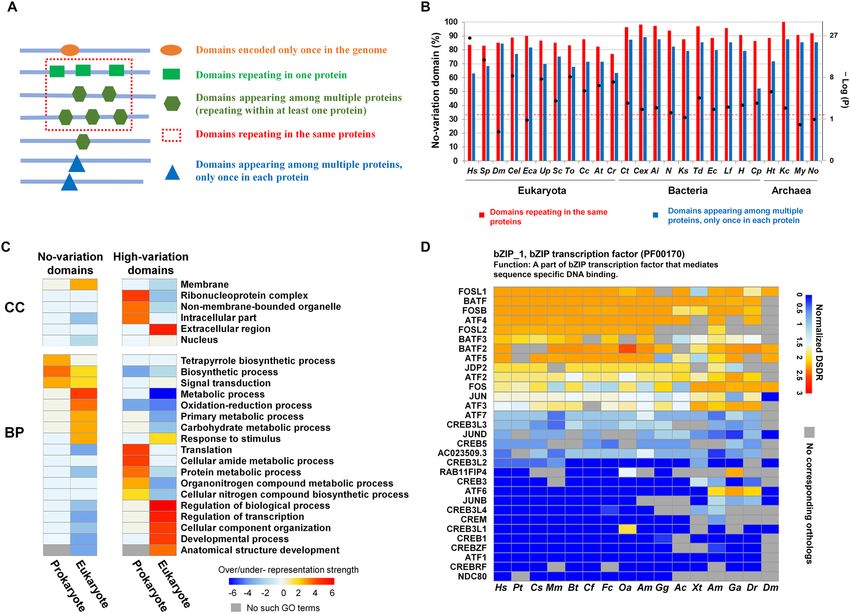
www.nature.com/scientificreports/

          Scientific Reports |   (2021) 11:2985 |   https://doi.org/10.1038/s41598-021-82656-9   6

Vol:.(1234567890)
www.nature.com/scientificreports/
◂ Figure 3. The correlation between domain age and domain disorder degree. (A) Heat map of the DSDR
distribution of all protein domains in different species across three superkingdoms. The normalized DSDR
(see method) of the same domain family within one species is represented by the median value. The number
of species containing a certain domain family is shown on the left panel. Domain families are classified
according to their distribution width (right panel). The numbers of domain families in each category are shown
in brackets. The taxonomic names of the phylum, kingdom and superkingdom for each species are marked
on the bottom of the figure. The symbols representing multiple taxonomic names in this figure: *Candidatus
Korarchaeota, Crenarchaeota and Thaumarchaeota; #Fibrobacteres, Aquificae, Chlamydiae, Chloroflexi,
Fusobacteria, Acidobacteria, Planctomycetes, Chlorobi, Thermodesulfobacteria, Coprothermobacterota,
Dictyoglomi, Thermotogae, Lentisphaerae, Verrucomicrobia, Synergistetes, Gemmatimonadetes, Elusimicrobia,
Armatimonadetes, Caldiserica, Deferribacteres, Spirochaetes, Chrysiogenetes, Calditrichaeota, Ignavibacteriae,
Candidatus Saccharibacteria, Candidatus Omnitrophica, Nitrospinae, Candidatus Peregrinibacteria,
Balneolaeota, Candidatus Tectomicrobia; filled circle, Microsporidia, Chytridiomycota, Blastocladiomycota,
Zoopagomycota, Cryptomycota; open circle, Placozoa, Ctenophora, Mollusca, Cnidaria, Tardigrada, Porifera.
(B) Box-plot of the percentage of intrinsically disordered (DSDR > 30%) domain families in each category
of domain distribution width. The four kingdoms of eukaryotes are marked on the bottom of the figure. The
values of upper and lower quartile, and the median values are indicated as bars in the boxes. The differences
between different categories are examined by Mann–Whitney U test. The corrected P values are shown. (C) The
distribution of IDDs (DSDR > 30%) in each age grade of the 25 representative species from archaea, bacteria
and eukaryotes. Domains of each representative species are divided into different age grades. (D) Comparison
of the normalized DSDR values of the same domain families in metazoa and fungi. Scatter-plot shows the
median normalized DSDR values of the same domain families in metazoa (top half of the figure) and fungi
(bottom half of the figure). The red dots represent the difference of the median normalized DSDR value of each
domain family between metazoa and fungi. The number and percentage of domain families belonging to each
differential category are shown in brackets.
The biological functions of IDDs. As domains are the functional units in proteins, we assume that the
domains with different degrees of disorder have different biological functions. In order to test this hypothesis,
all of the IDDs (DSDR > 30%, or CDRN ≥ 1 in no less than 50% species of each group) and the completely struc-
tured domains (DSDR = 0 in no less than 50% species of each group) were subjected to the over-representation
analysis of gene ontology (GO). We found that the completely structured domains tend to localize at membranes,
and participate in the biological processes related to metabolism, including various biosynthetic and catabolic
processes, as well as oxidation–reduction process (Fig. 4A). In contrast, the IDDs in prokaryotes tend to localize
at ribonucleoprotein complex, and tend to participate in translation and cellular component organization. The
IDDs in bacteria are also specifically related to pathogenesis and sporulation. In eukaryotes, the IDDs are more
likely to localize at the nucleus and participate in different regulatory processes. For example, in most cases, the
basic leucine zipper domain (pfam00170) is an IDD, which exists in many eukaryotic DNA binding proteins.
Most of the proteins containing this domain are transcription factors. In addition, some kingdom-specifically
over-represented terms can be observed. For example, ‘signal transduction’ is specifically over-represented in
metazoan IDDs; ‘response to stress’ is specifically over-represented in fungi IDDs. These results revealed that the
IDDs in different evolutionary clades tend to perform different types of biological functions.
More specifically, we investigated the special functional characteristics of IDDs in archaeal halobacteria
(Figure S10) and two phyla of fungi (Figure S11). Compared with other archaebacteria, 380 IDDs (82%) in
halobacteria are halobacteria-specific (Figure S10A). Halobacteria-specific IDDs tend to be involved in specific
metabolic processes, such as the metabolism of amino acid, oxoacid, and oxidation–reduction process (Fig-
ure S10B,C). The participation of halobacteria-specific IDDs in these specific metabolic processes may be the
requirements of their special halophilic ability. To investigate the fungi-specific functions related to IDDs, we
acquired protein phenotype dataset from Pathogen-Host Interaction (PHI) database41 (http://www.phi-base.
org), which includes over 7000 proteins from over 200 species with phenotype annotation based on mutation
experiment, and we explored the specific mutant phenotypes related to the proteins with IDDs in ascomycetes
and basidiomycetes (two phyla of fungi), compared with other species. As the result, the proteins with IDDs of
these two phyla of fungi significantly enriched in proteins whose mutation would lead to ‘reduced virulence’
compared with non-IDD domains (Figure S11). In contrast, proteins with IDDs of bacteria or parasites are not
enriched in this phenotype. This result indicates that IDDs in ascomycetes and basidiomycetes are related to
their virulence and fitness.
As mentioned in Fig. 3, protein domains could be classified into different categories according to species
distribution width (domain age). Since the same protein domains may have different degrees of disorder in
different species, we also calculated the percentage of species where the domain is an IDD (disordered width).
Based on these two parameters, domain age and the disordered width, all the domains were divided into six cat-
egories (Figure S12). For the old domains, appearing in both eukaryotes and prokaryotes, the disordered width
has a great influence on the functional type. The widely disordered old domains (disordered in more than 50%
species) mainly participate in the regulatory processes, whereas the old domains, which are disordered in less
than 50% species are mainly involved in metabolic processes, including oxidation–reduction, biosynthetic and
catabolic processes, similar to the enriched biological processes for completely structured domains in Fig. 4A. The
eukaryote-specific or prokaryote-specific domains both have their specifically enriched GO terms. For example,
eukaryote-specific domains tend to participate in regulation of transcription, reproductive and developmental
processes, signal transduction, and intracellular transport, etc. For example, Androgen_recep domain (androgen
Scientific Reports | (2021) 11:2985 | https://doi.org/10.1038/s41598-021-82656-9 7
Vol.:(0123456789)www.nature.com/scientificreports/
Figure 4. Functional features of intrinsically disordered domains. (A) Over- or under-representation analysis ▸
of biological process (BP) and cellular component (CC) for the IDDs in archaea, bacteria and eukaryotes. The
over- or under-representation strengths of each class were represented by − log (P) or log (P), respectively. Heat
map showing the grades of over- or under-representation strengths, scoped from − 7 to 7. (B–D) Comparison of
the PTM site proportion in different type of domains/regions classified according to disorder degree. Box-plot
of the PTM site proportion in protein domains with different disorder degree classified according to DSDR (B)
or CDRN (C), or in CDR regions or other regions in domains (D). The values of upper and lower quartile, and
the median values are indicated as bars in the boxes. The differences between the neighboring categories are
examined by Mann–Whitney U test. The corrected P values are shown. (E) The significantly over-represented
PTM types in IDDs. The over-representation strengths of each PTM type were represented by − log (P), marked
with different colors. The number of each type of PTM sites in IDDs were indicated as the size of the circles. The
analyses about PTM in disordered domains/regions were based on human data (B–E). The results of other six
species were in figure S11 and table S5.
receptor, PF02166, Fig S13A) is a young (chordates-specific) and widely disordered domain, which is found in 54
chordate species involved in this study. All of the Androgen_recep domains in 42 mammals are highly disordered
(DSDR > 30%). In human, this domain, with a high degree of disorder (DSDR = 63.5%, CDRN = 2), exists in the
androgen receptor protein (AR, P10275), which can regulate gene expression and affect cellular proliferation
and differentiation in target tissues. Prokaryote-specific domains tend to specifically participate in pathogenesis,
interspecies interactions (for both types of disordered width), and DNA modification, the generation of precursor
metabolites and energy (for the IDDs in less than 50% species). The examples for each of the six categories of
IDDs are shown in figure S13. These results reveal that the functions of IDDs are related to both domain age and
disordered width, and disordered width has a greater influence on the functions of old IDDs, while the functions
of young IDDs are mainly related to their clade-specificity.
Post-translational modifications (PTM) usually play important roles in protein–protein interaction and regu-
lation of the activities of most of the protein machines in cells. Previous studies revealed IDRs are frequently
subjected to PTMs that increase the functional states1,31,42,43. Thus, we speculate that IDDs may provide more
residues to PTM than structured domains. We tested this hypothesis based on 7 representative species. It’s obvi-
ous that there are significant differences in proportion of PTM sites between structured and disordered protein
domains (Fig. 4 B–D, Figure S14). The proportion of PTM sites is much higher in the intrinsically disordered
protein domains [DSDR > 30% (Fig. 4B, Figure S14A), or CDRN ≥ 1 (Fig. 4C, Figure S14B)] than the structured
domains (DSDR = 0, or CDRN = 0). Within the IDDs with CDRs, the CDRs have much higher proportion of
PTM sites than other regions of these IDDs (Fig. 4D, Figure S14C). The significantly over-represented PTM types
in intrinsically disordered domains were explored (Fig. 4E, Table S5). Phosphorylation of serine and threonine,
acetylation, methylation and crotonylation of lysine, hydroxylation of proline and lysine, methylation of argi-
nine etc. are the most over-represented PTM types in IDDs of the 7 species investigated in our analysis. These
results are basically consistent with the previous studies about PTM in disordered region in protein level6,31. The
significant higher proportion of PTM sites in IDDs than structured domains found in our analysis indicates that
PTM may contribute to the complex functions of IDDs.
The relationship between DSDR and CDRN. In this study, two related, but different measures of the
degree of domain disorder were used: (1) the proportions of each grade of domain structural disorder ratio
(DSDR); (2) the number of consecutive disordered regions (CDRN). The relationship between DSDR and CDRN
was explored in the three superkingdoms. We calculated the proportion of IDDs in each species according to
DSDR or CDRN. Scatter plots of the percentage of IDDs in each species show a very interesting phenomenon:
The data points of both archaea (Fig. 5A) and bacteria (Fig. 5B) can be fitted into a straight line, while the data
points of different kingdoms in eukaryotes, e.g. fungi and metazoan, clearly form two lines (Fig. 5C). Similar
results were obtained at the domain family level (Figure S15). But there are no such obvious two distinct lines
in the scatter plots of Eukaryota in non-domain regions (including linkers, and N- or C- terminal regions) (Fig-
ure S16). This reveals that the interesting difference between fungi and metazoans in the relationship between
SDR and CDRN exists specifically in domain regions. In other words, the difference in protein disorder pattern
between fungi and metazoans are in domains, not in non-domain regions.
According to the values of DSDR and CDRN, all of protein domains were divided into 4 classes: I, II, III, IV
(Fig. 5D–G). The slope of the straight line formed by the data points of fungi is greater than that of metazoan
(Fig. 5C). Consistent with this result, the differences between the percentage of class II domain (DSDR ≤ 30%,
CDRN ≥ 1) and that of category IV (DSDR > 30%, CDRN = 0) of each species in metazoan (Fig. 5D,E) are much
lower than those differences in fungi (Fig. 5F,G). The numbers of domains belonging to these two categories
in fungi (Fig. 5H) and metazoan (Fig. 5I) were calculated and their biological functions were explored by the
over-representation analysis of the biological process (BP). It’s obvious that there is almost no overlap between
the significant over-represented BP terms of class II and IV domains (Fig. 5J). Comparison between fungi and
metazoans reveals their common and specific significant over-represented BP terms (Fig. 5K), which indicates
that some specific metabolic processes in fungi require the class II domains. For example, two fungi-specific
class II domains, fungal_trans and PDEase_II, are involved in the regulation of transcription and nitrogen
compound metabolic process. Although these two domains are not high-DSDR domains, they both have a
consecutive disordered region (29 and 58 amino acid residues, respectively), which is of great significance for
their fungi-specific functions (Figure S17, see supplementary descriptions for details). These results suggested
that some IDDs with a special relationship between DSDR and CDRN are required in specific clades to perform
Scientific Reports | (2021) 11:2985 | https://doi.org/10.1038/s41598-021-82656-9 8
Vol:.(1234567890)www.nature.com/scientificreports/
Scientific Reports | (2021) 11:2985 | https://doi.org/10.1038/s41598-021-82656-9 9
Vol.:(0123456789)www.nature.com/scientificreports/
Figure 5. The relationship between DSDR and CDRN and the functions of the special categories. (A–C)
Scatter plots of the percentage of IDDs in each species of the three superkingdoms (A, archaea; B, bacteria; C,
eukaryotes). Each point represents a species. The dashed diagonal line represents the line where Y and X are
equal. The equation in each sub-figure was obtained by fitting a straight line based on the data of all species of
archaea (A), bacteria (B) and fungi or metazoa (C). (D–G) Scatter plots of the DSDR and CDRN values of the
four example eukaryote species. Each point represents a domain. According to the values of DSDR and CDRN,
all of protein domains were divided into 4 classes: I, II, III, IV. The sum of the percentages of class I and class IV
domains is equivalent to the X value of the corresponding species in sub-figure C; the sum of the percentages of
class I and class II domains is equivalent to the Y value of the corresponding species in sub-figure C. (H–I) Venn
diagrams of the IDDs of the two classes (II, IV) of fungi (H) and metazoa (I). There is an overlap between the
two classes because some of IDDs belong to different classes (II, or IV) in different species. (J) Venn diagrams of
the significantly over-represented BP terms for the two classes (II, IV) of IDDs of fungi and metazoan. (K) Over-
or under-representation analysis of BPs for the two classes (II, IV) of IDDs of fungi and metazoa. The methods
of over- or under- representation analysis and the criterion for strength grading are the same as that of Fig. 3A.
The dashed lines separate the significantly over-represented BP terms for each class.
Scientific Reports | (2021) 11:2985 | https://doi.org/10.1038/s41598-021-82656-9 10
Vol:.(1234567890)www.nature.com/scientificreports/
Figure 6. The distribution and functional features of domains with different DSDR variations. (A)
Classification of protein domains according to the domain distribution in all of the proteins encoded by the
genome. (B) Distribution of No-variation dominant categories of DSDR variation in the domains repeating
in the same proteins and the domains appearing among multiple proteins of the 25 representative species.
The DSDR variation value was calculated by the difference of normalized DSDR. Black spots represent
statically significant differences, tested by the Fisher’s exact test. Black spots above the dashed line represent
significant over representations. The abbreviations: Hs Homo sapiens; Sp Strongylocentrotus purpuratus; Dm
Drosophila melanogaster; Cel Caenorhabditis elegans; To Thalassiosira oceanica; Cc Cyclospora cayetanensis;
Eca Enterospora canceri; Up Umbilicaria pustulata; Sc Saccharomyces cerevisiae; At Arabidopsis thaliana;
Cr Chlamydomonas reinhardtii; Ct Chloroherpeton thalassium; Cex Caldisericum exile; Ai Alistipes inops;
N Nitrospina sp. SCGC_AAA799_A02; Ks Kytococcus sedentarius; Td Thermosulfurimonas dismutans; Ec
Escherichia coli; Lf Leptospirillum ferriphilum; H Hydrogenivirga sp. 128–5-R1-1; Cp Chlamydia psittaci; Ht
Haloterrigena turkmenica; Kc Candidatus korarchaeum cryptofilum; My Metallosphaera yellowstonensis; No
Candidatus nitrocosmicus oleophilus. (C) Over- or under-representation analysis of biological process (BP) and
cellular component (CC) for the ‘no-variation’ (DSDR variation = 0) and ‘high-variation’ (DSDR variation > 1)
domains (see Materials and methods for details). The methods of over- or under- representation analysis and
the criterion for strength grading are the same as that of Fig. 3A. (D) Examples of ‘high-variation’ domains.
DSDR was normalized by interpolation method. Heatmap shows the normalized DSDR values of the same
domain family in different proteins of different species. Each column represents a different species, and each row
represents the corresponding orthologs. The abbreviations of the species: Hs Homo sapiens; Pt Pan troglodytes;
CS Chlorocebus_sabaeus; Mm Mus musculus; Bt Bos Taurus; Cf Canis familiaris; Fc Felis catus; Oa Ovis aries; Am
Ailuropoda melanoleuca; Gg Gallus gallus; Ac Anolis carolinensis; Xt Xenopus tropicalis; Am Astyanax mexicanus;
Ga Gasterosteus aculeatus; Dr Danio rerio; Dm Drosophila melanogaster.
clade-specific functions. For example, some special functions in fungi require disordered domains, especially
those with CDR but not high DSDR values.
The variation of disorder degree of repeating domains and its functional significance. Accord-
ing to the protein domain repetition features, all the protein domains were divided into four categories (Fig. 6A).
A comparison of different domain categories within the same species revealed that the percentages of IDDs were
higher in the domains encoded only once in the genome than those repeating in the same or different proteins
Scientific Reports | (2021) 11:2985 | https://doi.org/10.1038/s41598-021-82656-9 11
Vol.:(0123456789)www.nature.com/scientificreports/
(Figure S18A,B, Table S6). This result indicates that gene-specific non-repeating protein domains prefer to be
IDDs compared to repeating domains, especially in eukaryotes. This type of relationship between domain repeat-
ing pattern and domain disorder degree may be the result of their relationship with domain age. As the result in
Fig. 3 B,C, young domains, especially eukaryote-specific domains, tend to be disordered; young domains also
tend to have fewer repetitions (Figure S18C) due to the smaller number of events of duplication and shuffling
since their emergence during evolution. Thus, special functional requirements (Fig. 4B) led to the emergence of
new IDDs, which have fewer repetitions.
According to the common understanding, the same domain family may share the same or a similar struc-
ture; thus, their degree of disorder may be similar. Surprisingly, the DSDR values of some repeating domains
from the same domain family are completely different. Thus, we investigated the variation of disorder degree
of all repeating domains in each whole proteome to get a complete understanding of this phenomenon and its
evolutionary and functional significance. The DSDR values were normalized using the interpolation method
(Figure S19A, see Materials and Methods). The variation values of DSDR were divided into the following three
classes: 0 (no-variation), 0–1 (low-variation), and 1–3 (high-variation). The repeating domains were divided,
using the dominant category method, into the following four classes: ‘no-variation’, ‘low-variation’, ‘high-variation’
and ‘no dominant category’ (Figure S19B). The proportions of each dominant category were calculated for the
25 species (Table S7). It was found that the majority of repeating domains belonged to ‘no-variation’ and ‘low-
variation’ categories. We next explored the direct contributing factors for the variation of the disorder degree
and the causes for the low proportion of ‘high-variation’ category. The results revealed that the DSDR value of
a domain is mainly determined by the hydrophobicity of the amino acid residues within or close to the domain
regions (Figure S20, Table S8, see supplementary descriptions for details).
Amino acids have different hydrophobicity; therefore, if the sequences of two protein domains are simi-
lar, it would be expected that they have similar hydrophobicity and therefore, similar DSDR values; however,
sometimes, different amino acids also have similar hydrophobicity. Therefore, to fully understand the reasons
for DSDR variation, the relationship between sequence similarity (Dataset 4) and DSDR variation degree was
explored. We found that a large proportion of repeating domain pairs have a sequence similarity of less than
40% (Figure S21A–D), which verifies the conclusion of the low level of sequence similarities between domain
repeats44. Repeating domains that had a low sequence similarity exhibited the low variable DSDR values (< 1)
(Figure S21A–D), that is, such domains had similar DSDR values. These results indicate that sequences of
repeating domains are not conserved, but their structures are conserved. Low sequence similarity can prevent
the aggregation of the same domains, and thereby prevent protein m isfolding45. In contrast, a low variation of
DSDR ensures that proteins take on the correct conformation and that their functions are conserved.
Although only a small part of the repeating domains has high variations of DSDR values, it’s of great sig-
nificance to explore the distribution pattern of the variation of DSDR across different species and to decipher
the functional difference between the domains with constant and high-variable DSDR values. The number of
‘high-variation’ domains in a species has a significant positive correlation with organism complexity. But after
normalized by the total number of repeating domains, this correlation disappeared (Table S9, supplementary
results). We next compare the proportion of ‘no-variation’ dominant category among 25 representative species
(Fig. 6B, S21E). The domain families repeating in the same proteins had a higher proportion of the ‘no-variation’
dominant category than the domain families repeating amongst multiple proteins in each species (Fig. 6B, S21E).
Furthermore, the differences in the proportion of the ‘no-variation’ dominant category in different repetition
categories were confirmed by the Fisher’s exact test. Twenty of the twenty-five species showed significant differ-
ences between the two types of repeating domains (Fig. 6B, S21E).
The DSDR variation of the protein domains is closely related to their functions. We found the functions of
‘no-variation’ and ‘high-variation’ domains are quite different which may reveal the functional constraints on
DSDR variations (Fig. 6C, Table S10). ‘No-variation’ domains of prokaryotes tend to localize at membrane and
function in tetrapyrrole biogynthetic process and signal transduction. In eukaryotes, ‘No-variation’ domains tend
to localize at membrane and function in metabolism process, oxidoreduction, response to stimulus. For example,
PsaA_PsaB domain (pfam00223), participating in photosynthesis, a branch of metabolic process, shows a con-
stant degree of disorder (DSDR = 0) in different plants (Figure S21F). PsaA and PsaB are specifically located at
the chloroplast thylakoid m embrane46. The stable three-dimensional structure of the PsaA_PsaB domain ensures
that PsaA and PsaB can specifically recognize and bind to P700 to form a trimeric complex (photosystems I,
PSI)47,48, acting as a plastocyanin/cytochrome c6-ferredoxin oxidoreductase in the photosynthesis.
High-variation domains in prokaryotes tend to localize at intracellular part and function in translation and
protein metabolism. In contrast, high-variation domains in eukaryotes tend to localize at extracellular region and
nucleus participating in many regulation processes, such as transcription regulation. This type of domains needs
variable DSDR values to meet with the diversified functions. For example, bZIP_1, a bZIP transcription factor,
has a wide variety of DSDR values (from 0 to 82.5% in human) (Fig. 6D). Its varied disorder degree contributes
to the functional versatility of transcription factors. The flexibility of bZIP_1 domain of AP-1 family enables
them to freely combine to form different heterodimers, and then combine to synthesize different DNA locations
to realize functional diversification. While the disorder of the ZIP domain in the CREB family remains stable.
This helps them bind to specific regions of DNA precisely.
Discussion
IDPs play important roles in various biological processes1–3 and they usually have special evolutionary features1,2.
For example, genes encoding IDPs tend to be evolutionarily young49; the disordered regions in IDPs tend to have
higher amino acid replacement rates50 and biased amino acid composition affected by the GC content51. In gen-
eral, these disordered regions in proteins are usually the linking regions between different protein d omains20,51.
Scientific Reports | (2021) 11:2985 | https://doi.org/10.1038/s41598-021-82656-9 12
Vol:.(1234567890)www.nature.com/scientificreports/
However, IDDs indeed exist. The functions of IDDs have been investigated in previous studies12,52–55, but the
comprehensive analysis of the distribution and functional significance of IDDs is lacking. In this study, we
investigated the functional and evolutionary characteristics of IDDs at the entire proteome level across three
superkingdoms. Our analyses revealed that the degree of domain disorder is not only related to organism com-
plexity, but is also related to the clade-specific special functions.
Some previous studies have investigated the contribution of protein disorder to the formation of complex reg-
ulation mechanisms in eukaryotes. For example, evolution from unicellular organisms to multicellular organisms
in all major eukaryotic lineages significantly benefited from IDPs, alternative splicing (AS) and post-translational
modification (PTM), in which IDPs conferred multifunctionalities and tightly associated with AS and PTMs55,56.
Nido et al. found that protein disorder degree in the centrosome correlates with species complexity57. Yruela et
al. explored the role of disordered proteins in chloroplast and nucleus of p lants58.
From the general viewpoint, it was reported that there is a significant positive correlation between the disorder
content of proteins and organism complexity measured by cell type n umbers55. However, in that a nalysis55, the
number of intrinsically disordered protein residues was not normalized by the total size of proteome. The more
complex the species, the larger the total amount of amino acid residues, and the more disordered r esidues26.
Therefore, it can’t be said that the increase of disordered residues contributes to the species complexity. If we want
to evaluate the contribution of protein disorder to the complexity of organisms, we should use the percentage of
disordered residues to total residues for correlation analysis. By this way, both Schad’s26, Xue’s27 and our results
indicated that there is no significant correlation between biological complexity and protein disorder in eukary-
otes. In Yruela et al.’s work, they also reported that if they use the fraction of disordered residues in transcription
factor sequences to analyze the correlation with organism complexity, the correlation was p oor59. For the first
time, our analysis revealed that the degree of disorder of protein domains correlates with organismal complex-
ity with a significant correlation coefficient. The reason for this phenomenon may lie in the more important
functionality of protein domains than other regions of proteins. The protein domains are the structural and
functional units of proteins. If a protein domain has a disordered region or has a high proportion of disordered
residues, the structure and function of this domain will be more flexible, which in turn has a strong influence on
the function of proteins. Thus, complex organisms need more intrinsic disorder domains to perform complex
regulatory functions.
However, not all species are in line with the general positive correlation between the degree of domain disor-
der and organism complexity. For example, halobacteria, ascomycetes and green algae have higher proportions
of IDDs than the species with similar or even higher organism complexity. These phenomena indicate that the
degree of disorder of protein domains is also influenced by certain special functions evolved in a specific evo-
lutionary lineage. In halobacteria, the protein adaptations toward the high-salt pressure result in special char-
acteristics of the protein sequence : the acidic and polar amino acid residues are over-represented significantly,
and the hydrophobic residues are remarkably under-represented60. Studies have shown that halophiles prefer coil
formation to alpha-helix formation61. Halophiles may rely on disordered domains to maintain their adaptability
to high-salt environments. In eukaryotes, the virulence of ascomycetes and the cilium formation of green algae
is also regulated by the functions of a large number of disordered domains.
As for the causes of formation of disordered protein domains, the long length of the domain maybe a pre-
requisite for it to have a CDR. We found that the IDDs having a CDR but a low disorder ratio (DSDR < 30%)
(Class II) tend to be much longer than those containing higher disorder ratio (DSDR > 30%) but no CDR (Class
IV) (Figure S17A and supplemental description in additional file 1). Further, we compared all the domains with
various disorder degrees (Figure S22). In eukaryotes, the domains containing CDR(s) tend to be longer than
those without a CDR (Figure S22C). This is consistent with the above result (Figure S17A). Interestingly, from
the viewpoint of DSDR, the domains containing a small fraction of disorder residues (0 < DSDR ≤ 10%) tend
to be the longest type (figure S22D–F). It indicates that long protein domains tend to have at least a CDR but
not to have a large fraction of disorder residues. But this relationship is not the cause-effect relationship. Both
of the length and disorder degree of protein domains are the results of evolution. The functional requirements
played driving roles during the evolutionary processes that the longer and disordered domains were remained
to perform complex functions.
In the viewpoint of the disorder variation of the same protein domains, the clade-specific ‘no-variation’ and
‘high-variation’ domains may contribute to the clade-specific functions which need constant or variable DSDR
values respectively.
Notably, although the accuracy of the disorder prediction methods has been greatly improved these years,
it is still difficult to guarantee 100% accuracy. This may not affect the core conclusion of large-scale statistical
analysis, as in this study. In addition, we used two disorder prediction methods based on different principles and
similar conclusions were obtained. Thus, the core conclusions of this study are reliable. However, if we want to
explore the functions of a certain IDD in a certain protein, we should do experiments to confirm its structural
properties. Another limitation in this analysis is the number of species having cell type number data. But the 51
species are also representative across eukaryotes, including deuterostomes (16 species), protostomes (4 species),
sponges and cnidarians (3 species), protists (6 species), fungi (8 species), plant (13 species).
In conclusion, this study focused on the uneven distribution pattern and functional characteristics of the IDDs
across 1870 species of the three superkingdoms. We found that intrinsic disorder of protein domain contributes to
both of organism complexity and clade-specific functions: 1) complex species tend to have higher proportions of
IDDs, contributing to the increasing organism complexity; 2) some clade-specific IDDs, clade-specific domains
with specific DSDR/CDRN ratios and clade-specific ‘no-variation’ or ‘high-variation’ domains are involved in
clade-specific functions. These new findings enrich our knowledge about the evolution of protein domains and
provide valuable new insights for the functional studies of disordered domains.
Scientific Reports | (2021) 11:2985 | https://doi.org/10.1038/s41598-021-82656-9 13
Vol.:(0123456789)www.nature.com/scientificreports/
Methods
Datasets. The protein sequences were retrieved from the Ensembl Database62 (V90, ftp://ftp.ensembl.org/
pub/release-90/fasta/), Ensembl Metazoa Database (V43, ftp://ftp.ensemblgenomes.org/pub/release-43/metaz
oa/fasta), Ensembl Bacteria Database (V39, ftp://ftp.ensemblgenomes.org/pub/release-39/bacteria//fasta/),
Ensembl Plants Database (V42, ftp://ftp.ensemblgenomes.org/pub/release-42/plants/fasta/), Ensembl Fungi
Database (V44, ftp://ftp.ensemblgenomes.org/pub/fungi/release-44/fasta/), Ensembl Protists Database (V44,
ftp://ftp.ensemblgenomes.org/pub/protists/release-44/fasta/), Ensembl Tardigrades Database (http://download.
tardigrades.org/v1/sequence/) and NCBI Refseq Database (ncbi.nlm.nih.gov/protein)63.
Identification of protein domains and the definition of domain family. The protein domains were
identified as described previously36,40. In brief, to identify the domains presented in the whole sequences of each
species, we used HMMER-scan program64 to search the Pfam-A databases65. And the full sequence E value and
C-Evlaue were kept less than 0.01. According to previous definitions32,33, domain families in our study refer to
the unique domain types. Protein domains belonging to a same family share the same Pfam IDs and domain
names, but are located in different contexts, including different proteins and different regions of the same pro-
tein.
Intrinsic disorder prediction. Intrinsically disordered regions were identified using SPOT-D66(default
parameters) and IUPred67 (V1.0, Prediction type: long disorder). SPOT-D and IUPred are popular programs
for the prediction of structural disorder scores. SPOTD is based on deep recurrent and convolutional neural
networks. IUPred is based on the physicochemical properties of amino acids. Both of them were used to calcu-
late the structural disorder value of each amino acid. An amino acid with a high structural disorder value which
exceeds the default threshold was considered to be disordered. ESpritz68 (V1.1, PSI-BLAST based prediction,
Prediction type: NMR, Decision threshold: 5% False Positive Rate) was used as a corrected method for halobac-
teria. PSI-BLAST can avoid over-prediction of disorder scores35.
To further validate the main conclusions, a consensus predictor, MobiDB-lite (http://mobidb .bio.unipd. it/)69,
was used. The protein sequence and disorder region information were downloaded using API method (https://
mobidb.bio.unipd.it/help/apidoc). 39 species were included in the analysis of the correlation between disorder
degree and organism complexity (Table S1C). 25 representative species were used to validate the main conclu-
sions about the disorder distribution and variation (Table S1C, S2C).
Calculation and classification of DSDR and CDRN. According to the results of domain identification
and intrinsic disorder prediction, we extracted the corresponding disorder value of each amino acid of each
domain. The DSDR was represented by the percentage of the disordered amino acids in a protein domain. In
a previous s tudy70, proteins were divided into three categories according to PSDR: 0–10%, ‘highly structured’;
10–30%, ‘moderately unstructured’; 30–100%, ‘highly unstructured’. Similarly, the protein domains were divided
into four classes according to the DSDR values: 0, ‘completely structured domain’; 0–10%, ‘highly structured
domain’; 10–30%, ‘moderately unstructured domain’; and 30–100%, ‘intrinsically disordered domain’.
The definition of CDRN is more complicated. For domains with more than 50 amino acids, one region with
more than 20 consecutive disordered residues is a consecutive disordered region (CDR). For the rest of the
domains, if the number of consecutive disordered residues in a region is more than 40% of the total number of
the domain then this region is considered as a consecutive disordered region. From the viewpoint of CDRN,
the protein domains were divided into three classes: 0, ‘domain without CDR’; 1, ‘domain with one CDR’; ≥ 2,
’domain with multiple CDRs’. High-DSDR (DSDR > 30%) domains and domains containing one or more CDRs
are considered as IDDs. Notably, this definition of IDD is different from the ‘disordered’ type in Pfam database.
In Pfam, only fifty-five entries with more than 100 residues and conserved sequences in primate proteins are
regarded as ‘disordered’71. But there are also disordered regions in other types, such as PF03250 in ‘family’ type72.
IDDs in this study generally refer to the domains with high DSDR or containing CDR in all Pfam entries types.
Disordered width, in this study, means the percentage of species in which the domain is an IDD among the spe-
cies containing this type of domain.
Normalization of DSDR by interpolation method. The DSDR values were normalized using the inter-
polation method. Four points, (0, 0), (10, 1), (30, 2) and (100, 3) were used to calculate the coefficients a, b and c,
and the constant d, of the equation y = a × x 3 + b × x 2 + c × x + d . The four pair values of these four points
were used to replace the variables x and y in the equation respectively, and then, the following values were
determined: a = 1/78,750, b = − 137/63,000, c = 253/2100 and d = 0. Therefore, the normalization equation can be
expressed as follows:
x3 137x 2 253x
y= − +
78750 63000 2100
where x represents the DSDR value, and y denotes the normalized DSDR value.
The normalized curve is shown in Figure S19A.
Dominant category method. Each domain family was assigned a DSDR dominant category according
to the DSDR distribution of the domain family. As mentioned above, DSDRs were divided into four grades.
For each domain family, the number and proportion of each DSDR grade was calculated. If the proportion
of a DSDR grade was greater than 0.5 then the domain family was assigned to this DSDR dominant category
Scientific Reports | (2021) 11:2985 | https://doi.org/10.1038/s41598-021-82656-9 14
Vol:.(1234567890)You can also read