Assessing the potential for deep learning and computer vision to identify bumble bee species from images - Nature
←
→
Page content transcription
If your browser does not render page correctly, please read the page content below
www.nature.com/scientificreports
OPEN Assessing the potential for deep
learning and computer vision
to identify bumble bee species
from images
Brian J. Spiesman1*, Claudio Gratton2, Richard G. Hatfield3, William H. Hsu4, Sarina Jepsen3,
Brian McCornack1, Krushi Patel5 & Guanghui Wang5,6
Pollinators are undergoing a global decline. Although vital to pollinator conservation and ecological
research, species-level identification is expensive, time consuming, and requires specialized
taxonomic training. However, deep learning and computer vision are providing ways to open this
methodological bottleneck through automated identification from images. Focusing on bumble bees,
we compare four convolutional neural network classification models to evaluate prediction speed,
accuracy, and the potential of this technology for automated bee identification. We gathered over
89,000 images of bumble bees, representing 36 species in North America, to train the ResNet, Wide
ResNet, InceptionV3, and MnasNet models. Among these models, InceptionV3 presented a good
balance of accuracy (91.6%) and average speed (3.34 ms). Species-level error rates were generally
smaller for species represented by more training images. However, error rates also depended on the
level of morphological variability among individuals within a species and similarity to other species.
Continued development of this technology for automatic species identification and monitoring has
the potential to be transformative for the fields of ecology and conservation. To this end, we present
BeeMachine, a web application that allows anyone to use our classification model to identify bumble
bees in their own images.
Bees (Hymenoptera: Anthophila) serve a critical role in most terrestrial ecosystems as pollinators of crops
and natural plant communities e.g.,1–3. With mounting evidence for the global decline of many bee species4–7,
considerable effort has been focused on understanding the causes of bee decline, monitoring programs, and
developing conservation strategies to preserve their biodiversity and ensure the continued provision of pollina-
tion services8. One essential yet challenging step in bee research is to accurately identify individuals so that the
number of species and population sizes in an area can be assessed. Focusing on bumble bees (Bombus) in the
United States and Canada, we address this challenge in bee research by assessing the potential for automatic
species-level identification from images using deep learning classification models.
Species-level bee identification is challenging because experts often rely on subtle morphological features to
differentiate many of the more than 20,000 species w orldwide9. Bumble bees, for example, can often be identi-
fied by experts in the field or from images based on distinctive color patterns. However, similarities between
some species require comparing very fine-scale differences in e.g., coloration, facial features, or g enitalia10,11. As
a result, many species cannot be identified in the field or from photos by human observers if important features
are obscured or not sufficiently resolved. Instead, individuals are usually collected, cleaned, pinned, and labeled,
before being identified by experts under a microscope. This process is expensive, time consuming, and greatly
slows the pace of pollinator research. The challenge will only become more limiting with the declining number
of taxonomic experts12. The remaining experts are underfunded and have limited time, which can be consumed
by identifying numerous samples of common s pecies13. Moreover, this sampling process requires lethal collec-
tion methods, which are increasingly disparaged or restricted, especially when projects involve sensitive species,
1
Department of Entomology, Kansas State University, Manhattan, KS, USA. 2Department of Entomology,
University of Wiscosin – Madison, Madison, WI, USA. 3The Xerces Society for Invertebrate Conservation, Portland,
OR, USA. 4Department of Computer Science, Kansas State University, Manhattan, KS, USA. 5Department of
Electrical Engineering and Computer Science, University of Kansas, Lawrence, KS, USA. 6Department of Computer
Science, Ryerson University, Toronto, ON, Canada. *email: bspiesman@ksu.edu
Scientific Reports | (2021) 11:7580 | https://doi.org/10.1038/s41598-021-87210-1 1
Vol.:(0123456789)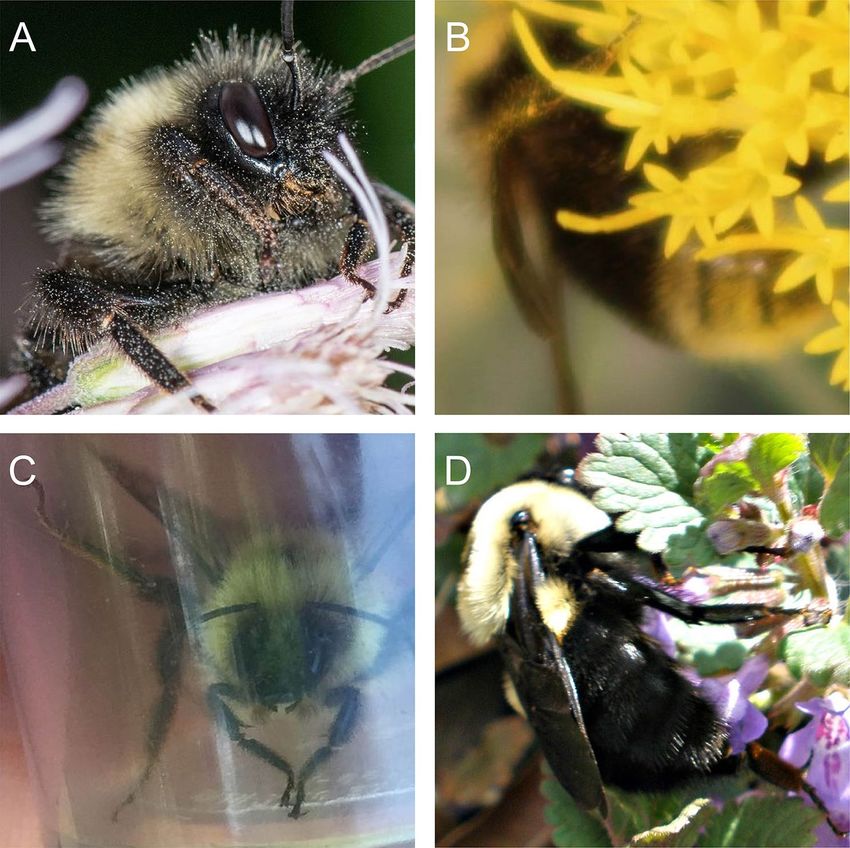
www.nature.com/scientificreports/
such as the endangered rusty patched bumble bee (Bombus affinis). Methods for automated and reliable bee
identification from photos are thus greatly n eeded14.
In addition to the benefits for basic research, tools for automated identification would also benefit community
(or citizen) science programs, which provide important monitoring data and engage the public in science and
conservation efforts. With programs such as BeeSpotter (beespotter.org), Bumble Bee Watch (BBW; bumblebee-
watch.org), iNaturalist (inaturalist.org), and the Wisconsin Bumble Bee Brigade (WBBB; wiatri.net/inventory/
bbb), users can contribute to national and regional databases by uploading georeferenced images of bumble
bees and providing preliminary identifications, which are then verified by experts or community sourced. This
verification step is important because user-submitted identifications to WBBB and BBW agree with experts only
73 and 53 percent of the time, r espectively15,16. If not properly verified, such erroneous data could have serious
negative consequences for pollinator conservation. Moreover, automated identification methods would reduce
the substantial number of submissions that remain unverified because experts cannot keep up, while providing
high quality data for pollinator conservation science.
There has been a longstanding recognition that we need tools for automated insect identification17–19, however
we have been limited by effective methods and computational power. But, with the use of powerful graphics pro-
cessing units and ongoing advances in computer vision, it is now possible to efficiently and accurately detect and
identify objects, including insects, from images. Applying state-of-the-art deep learning methods to the problem
of species-level bee identification would help reduce this research bottleneck and put an expert-level identification
tool in the hands of everyone from bee enthusiasts to students, educators, land managers, and scientists14. Deep
learning technology has a realistic potential to be transformative, not only for pollinator research, but for address-
ing a wide range of problems in agriculture20 and surveillance of arthropods that transmit human p athogens21.
Deep learning techniques such as convolutional neural networks (CNNs) are at the forefront of computer
vision. More commonly applied in the fields of self-driving c ars22 and healthcare d iagnostics23, researchers are
beginning to apply CNNs to insect detection and i dentification21,24–26. Mobile apps such as Seek (inaturalist.org/
pages/seek_app) and Google Lens (lens.google.com) can be used to identify some taxa but species-level accuracy
for bees in these apps is not sufficient for research purposes.
One key benefit of CNNs that makes them ideal for bee identification is that they do not rely on inputs of
known feature sets, such as the morphological characteristics that taxonomists rely on. Instead, training a CNN
only requires a set of labeled images that the model can learn from, developing its own feature set that it uses for
identification. CNNs are robust to images with subjects (e.g., bees) that are oriented differently, partially obscured,
or set in different environmental contexts, such as in different lighting conditions or visiting different flower
species. This ability to self-learn discriminating feature sets is ideal for a species-level bee classifier because key
features that experts require to make identifications are often not visible in images.
In this paper we assess the performance of four convolutional neural network models trained to classify 36
North American bumble bee species, comparing tradeoffs between speed and accuracy. We then assess the poten-
tial for deep learning to automate the identification of bumble bee species from images and discuss the outlook
for applying this technology in ecological research and large scale monitoring programs. Lastly, we introduce
BeeMachine, a web app based on our model that allows users to identify bumble bees from their own images.
Methods
Image data set. We focused our analysis on bumble bees in the United States and Canada, as described in
Williams et al.27. To train and validate classification models, bumble bee images were gathered from Bumble Bee
Watch, iNaturalist, and BugGuide. Only images categorized as "verified" (identified by an expert) or "research
grade" (identity agreed upon by at least two of three users) from Bumble Bee Watch and iNaturalist, respectively,
were included in our analyses. Images from BugGuide were identified by expert naturalists. Our initial dataset
comprised over 120,000 images belonging to 42 species.
Original images were cropped tightly to each bee using an object detection algorithm trained to detect bumble
bees (Fig. 1). This allowed us to automate some of the preprocessing of the image data set. Each cropped image
was encoded to the JPG format and then manually inspected for errors. Detection algorithm errors included
false positives, such as other bee taxa that happened to be included in an image, which were discarded. Rarely,
misidentified bumble bees were encountered, which we relabeled and included in our training set. Cropped
images less than 200 × 200 pixels were discarded. We did not distinguish between workers, queens, and males
within species so our classification models generalize across bumble bee castes that often vary in morphology
and color pattern.
We required a minimum of 150 images for a species to be included in the analysis. The sample sizes of 6 spe-
cies in our original dataset were thus insufficient to be included in the model. After quality control we retained
89,776 images belonging to 36 species (Fig. 2, Table S1) out of the 46 bumble bee species in the US and Canada
recognized by Williams et al.27. Some species are more frequently photographed than others because they are
common and/or live near population centers, while others are rarely photographed. Six of the North American
species not included (B. balteus, B. distinguendus, B. hyperboreus, B. jonellus, B. neoboreus, and B. polaris) are
high-latitude and/or high-elevation species that are infrequently encountered. Three species (B. bohemicus, B.
suckleyi, and B. variabilis) are historically uncommon and/or in decline. One species, B. franklini, has a very
restricted range and has not been encountered since 2006 despite a concerted search. As a result of this range
in commonness, our image dataset was highly imbalanced among species. We therefore limited the number of
images per species to a maximum of 10,000 to help limit the classification bias associated with imbalanced data
sets.
Scientific Reports | (2021) 11:7580 | https://doi.org/10.1038/s41598-021-87210-1 2
Vol:.(1234567890)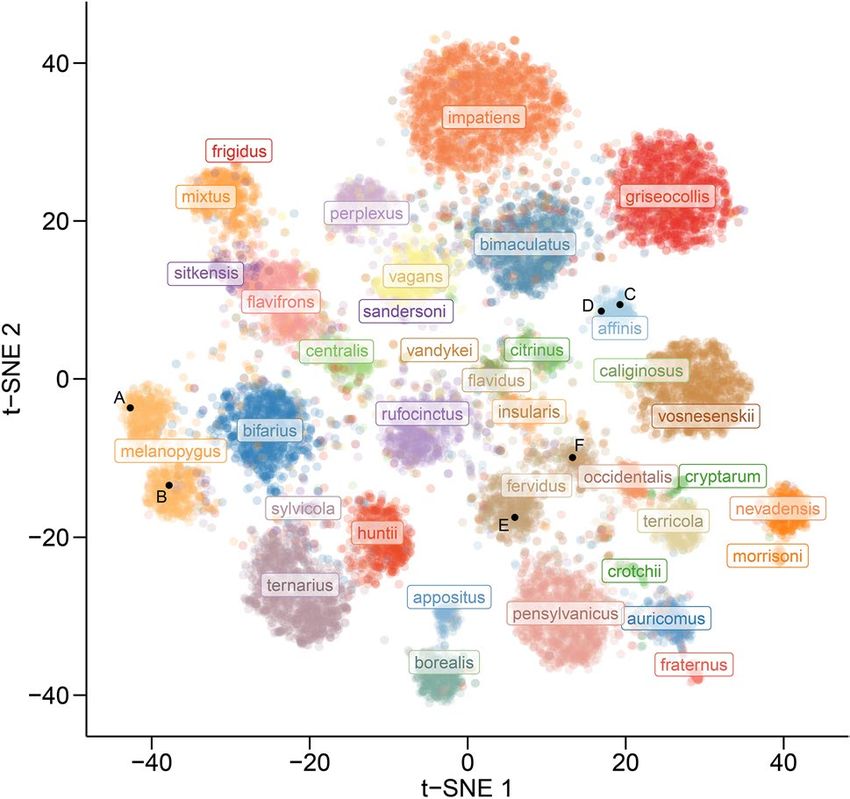
www.nature.com/scientificreports/
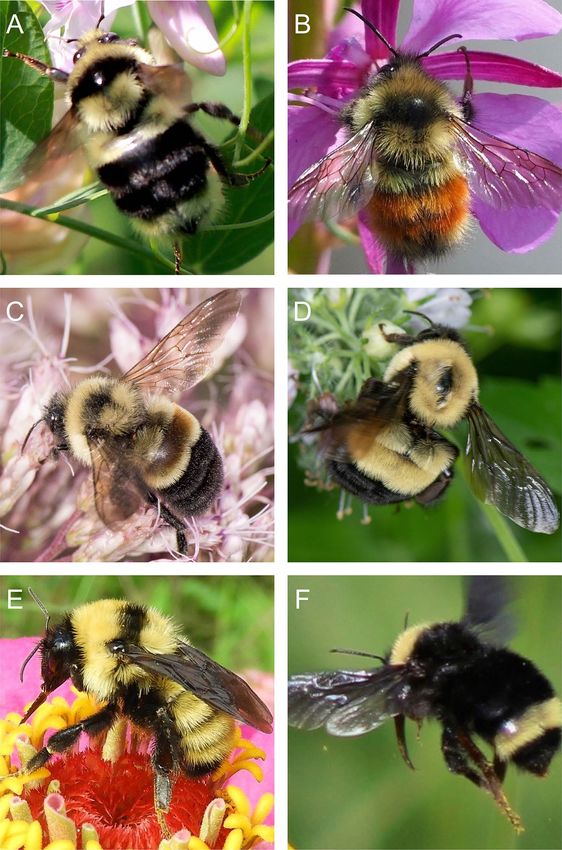
Figure 1. Example test images showing coarse scale intraspecific variability in appearance. Bombus
melanopygus are (A) without orange coloration in the southern part of their range but (B) with orange on the
northern end. (C) A B. affinis worker displaying its characteristic rusty-colored patch on T2 of its abdomen,
however (D) the patch is usually absent or reduced on queens. B. fervidus has (E) extensive yellow coloration
in the eastern part of its range, but (F) is more extensively black in the western end. Photo credits: (A) Andrea
Kreuzhage, (B) Scott Ramos, (C, D) Heather Holm, (E) Sue Gregoire, (F) Asa B. Spade.
Classification models. Many classification models based on convolutional neural networks (CNN) have
been proposed in the field of computer vision. We compared the performance of four widely used models that
vary in complexity of architecture to evaluate tradeoffs in accuracy and speed for bumble bee species classifica-
tion. One of the main limitations of deep neural networks is the vanishing gradient problem, which prevents the
adjustment of model weights during the training process, making it hard to improve model performance before
Scientific Reports | (2021) 11:7580 | https://doi.org/10.1038/s41598-021-87210-1 3
Vol.:(0123456789)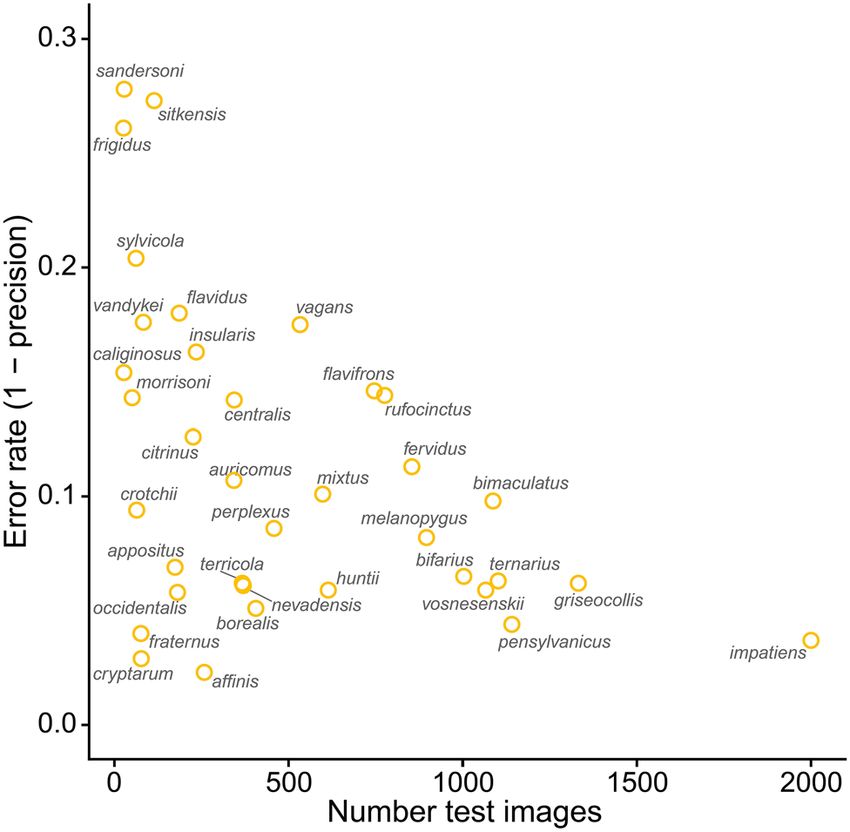
www.nature.com/scientificreports/
Figure 2. Visualization of trait separation among species based on t-SNE. Black points (A–F) show the location
in trait space of images in Fig. 1 panels.
information passes through the end of the network. (1) ResNet-10128 was proposed to address this problem by
using skip connections that allow useful layer output to pass over groups of layers (or residual blocks) and thus
penetrate much further into deep networks. (2) Wide-ResNet-10129, on the other hand, is wider but shallower
than ResNet-101. This difference in architecture allows information to more easily pass through the network
while providing a greater number of channels to maintain performance. (3) InceptionV330 has fewer layers but
achieves greater computational efficiency by, for example, using factorized convolution, which breaks down
channels into simpler linear sequences while maintaining spatial context within the image. (4) MnasNet-A131
was designed to be faster for mobile devices and thus has the fewest layers of the models compared here. The
MnasNet architecture was obtained by a mobile neural architecture search mechanism that is designed to find
an optimal trade-off between accuracy and latency.
Model training. To speed up the training process, we used models pre-trained on the ImagNet database32
and then retrained them for bumble bee species classification using our image data set. We divided our full data
set into training (80%) and test (20%) groups. After randomly shuffling images in each class (species) we split
the images within species along the 80:20 ratio to maintain their proportional representations in the training
and test groups. For each model, cropped images were resampled to a standard size for model input. Following
the original implementation of these models, we used images of 224 × 224 pixels for ResNet, Wide-Resnet, and
MnasNet, and 299 × 299 pixels for InceptionV3. We used an image augmentation strategy that included random
rotation (≤ 100°), crop (≤ 10%), sheer (≤ 30%) and horizontal flip to help reduce overfitting and improve the
generality of our m odels33. To help account for the class imbalance in our data set, predictions were weighted
by class sample size. We used the SGD (stochastic gradient descent) optimizer with an initial learning rate of
0.01 for all models except MansNet, which was initially set at 0.1. The learning rate was reduced by a factor of
10 after steps of 30 epochs. We used batch normalization and models were trained for 150 epochs using Nvidia
Tesla K80 or P100 GPUs.
At the species level, we calculated two metrics of model performance: precision (true positives / (true posi-
tives + false positives)) and recall (or sensitivity: true positives / (true positives + false negatives)). Precision is a
useful metric when using the model to predict the identity of an unknown specimen. That is, given a prediction,
precision tells you how likely it is that the prediction is correct. Recall, on the other hand, lets a user assess, given
a specimen with a known label or identification, how likely it is that the model will make the correct prediction.
Species-specific error rates were defined as 1 – precision or the false positive rate.
For each model, we compared overall (top-1) accuracy, or the accuracy of the most likely prediction. We
compared top-N test accuracy (i.e., accuracy assuming the correct identity is within the top-N predictions),
macro precision (i.e., the mean of species-level recall scores), and macro recall (i.e., mean of species-level preci-
sion scores). We also examined the tradeoff in overall test accuracy and speed to determine the most appropriate
model to focus on for this study. Model speed was quantified as the mean time necessary to make predictions
on images in the test data set. All speed tests were run on the same system using a Tesla P100 GPU. We then
examined species-level precision, recall and error rates in relation to the number of training and test images.
We visualized model-based trait separation among species using T-distributed Stochastic Neighbor Embed-
ding (t-SNE) by examining model weights from the final fully connected layer of the network before softmax
predictions were made.
Scientific Reports | (2021) 11:7580 | https://doi.org/10.1038/s41598-021-87210-1 4
Vol:.(1234567890)www.nature.com/scientificreports/
#Params Model speed Macro
Model (million) (ms) Top-1 accuracy Top-2 accuracy Top-3 accuracy Top-4 accuracy Top-5 accuracy Macro recall precision
Wide-ResNet101 124.9 5.46 0.9171 0.9627 0.9782 0.9850 0.9897 0.8552 0.8831
InceptionV3 24.0 3.34 0.9162 0.9610 0.9767 0.9834 0.9882 0.8519 0.8881
ResNet101 42.6 3.33 0.9133 0.9633 0.9787 0.9852 0.9892 0.8499 0.8740
MnasNet-A1 1.0 3.28 0.8579 0.9335 0.9609 0.9730 0.9814 0.7689 0.8250
Table 1. Comparison of model size, speed, and performance, ordered by top-1 accuracy. Text in bold indicates
the best value in each category. Wide-ResNet101 has the highest top-1 accuracy and macro precision but
was substantially slower than the other models. MnasNet-A1 was the fastest model but had relatively poor
performance. InceptionV3 was relatively fast while maintaining good model performance with the highest
precision and second highest accuracy and recall.
Table 2. InceptionV3 confusion matrix showing the number of test images for each prediction.
Results
Three of the CNN models used for species-level identification of bumble bees all provided similar accuracy rates
(Table 1). Wide-ResNet had the highest test accuracy of 91.7% followed closely by InceptionV3 (91.6%) and
ResNet100 (91.3%). MnasNet, however, had relatively low test accuracy of 85.8%. There was a substantial increase
of 5.4 percentage points on average, between top-1 and top-2 accuracy. Top-5 accuracy was greater than 98.1% for
all models. There was a tradeoff between speed and accuracy for the best and fastest models with Wide-ResNet
being slightly more accurate but relatively slow and MnasNet being slightly faster but relatively inaccurate.
Of the four models tested, InceptionV3 presents a good balance between performance and speed. InceptionV3
had the highest precision and nearly matched Wide-ResNet’s accuracy and recall while being 39% (2.1 ms) faster
(Table 1). Likewise, InceptionV3 was 5.8 percentage points more accurate than MnasNet while only 0.06 ms
slower. The speed and accuracy of InceptionV3 makes it useful for web-based and mobile applications that rely
on both speed and reliable predictions. We therefore focus on our InceptionV3 results for the remainder of this
paper.
The InceptionV3 model nicely separated species into distinct groupings based on traits extracted from the
model (Fig. 2). There was little overlap in two-dimensional trait space, which corresponds with the high degree
of accuracy in the classification results.
The classification results for each test image are displayed in a confusion matrix (Table. 2, see also Table S2),
which shows how predicted species (columns) correspond to the actual species (rows). Values along the diago-
nal indicate the number of correct predictions, whereas off-diagonal values indicate misclassifications. Bombus
affinis, for example, was correctly classified, based on the match to taxonomic expert classification, in 250 of 258
test images (96.9%) indicating high recall. Similarly, only B. borealis, B. fervidus, B. perplexus, and B. rufocinctus
were mistaken for B. affinis in 1, 1, 1 and 3 of their respective test images, indicating that B. affinis has high
precision (97.7%).
Scientific Reports | (2021) 11:7580 | https://doi.org/10.1038/s41598-021-87210-1 5
Vol.:(0123456789)www.nature.com/scientificreports/
Figure 3. Relationship between error rate and the number of test images.
Figure 4. Examples of misclassified images. (A) B. affinis misclassified as B. citrinus. (B) B. occidentalis
misclassified as B. terricola. (C) B. bimaculatus misclassified as B. impatiens. (D) B. griseocollis misclassified as B.
impatiens. Photo credits: (A) Heather Holm, (B) Bernard Yurke, (C) Sarah Litterick, (D) Ansel Oommen.
Scientific Reports | (2021) 11:7580 | https://doi.org/10.1038/s41598-021-87210-1 6
Vol:.(1234567890)www.nature.com/scientificreports/
Bombus affinis had high recall and precision, with few instances of other species being mistaken for B. affinis
and mistaking B. affinis for few other species. Bombus vosnesenskii, B. griseocollis, B. fraternus, B. pensylvanicus,
and B. impatiens also performed well on both metrics. On the other hand, B. sandersoni, B. caliginosus, B. sitken-
sis, B. sylvicola, and B. frigidus performed the most poorly on these two metrics. Bombus caliginosus is very similar
in appearance to B. vosnesenskii (Fig. 2) and was therefore frequently misclassified as such (Table 2). Likewise,
B. sandersoni is similar in appearance to B. vagans (Fig. 2), with which it was most often confused (Table 2).
Species that were trained on more images tended to have lower test error rates (Fig. 3). However, there
was substantial variation in error rates for species with low sample sizes, which was likely due to the degree of
intraspecific variation and/or distinctiveness from other species. Regardless of species, images were more likely
to be misclassified if bees were in poor focus or obscured. Examples of misclassified images are shown in Fig. 4.
To assess how model results were affected by the particular random subsets of training and test images, we
trained each model two additional times with different random train/test splits. These subsequent model runs
provided very similar results compared to those reported above, with on average less than one percentage point
difference in top-1 accuracy, macro precision, and macro recall.
Discussion
Using computer vision to identify bees or other taxa in images will be important for advancing research on pol-
linator ecology and conservation. We have shown that a deep learning image classification approach can accu-
rately (> 91% for our best models) and rapidly identify North American bumble bee species from heterogeneous
digital images. It is not known what the true range of expert accuracy is, but as with our model, it likely varies by
species and with the quality of images available to make a prediction. Anecdotally, our model correctly classified
a test image that we later discovered was mislabeled by an expert; a small degree of mislabeling is unavoidable
in large image datasets. This observation is consistent with research showing that CNN models are robust to a
islabeling34. It also suggests that with refinement, deep CNN models will have the potential to
small level of m
perform at least on par with experts at image classification tasks.
The four CNN models we tested performed similarly. However, InceptionV3, with its relatively small size
and complex architecture, presented a good blend of speed and accuracy. Although smaller models, such as
MnasNet-A1, can be slightly faster, they can suffer from lower accuracy, recall, and precision, compared to
InceptionV3. Potential end users of this classification model, i.e., those interested in characterizing bee com-
munities and monitoring population trends, would likely favor reliability over model speed and latency issues.
However, speed is a factor in user satisfaction and will be important for future video-based applications of our
model. Nevertheless, minimizing classification error is especially important when using crowdsourced data with
inexperienced observers to monitor endangered species. For example, using error-prone data can over- or under-
estimate spatial distributions depending on whether misclassifications are false positives or false negatives35,36,
which can significantly affect conservation management decisions.
At the species level, InceptionV3 classification error rates decreased with a greater number of training and
test samples. But error rates also depended on a species’ degree of variability in appearance. For example, B.
fraternus is easily identified by experts because of its relatively distinctive appearance that varies little among
castes or across its North American range. Thus, B. fraternus had a relatively low error rate (4.0%) despite being
trained on few images (n = 304). On the other hand, Bombus sylvicola has a similar training sample size (n = 248)
but a much higher error rate (20.4%). This is likely because B. sylvicola is more variable in appearance and can
resemble many other species, such as B. huntii, B. melanopygus, B. rufocinctus, and B. ternarius. Similarly, Bombus
rufocinctus is highly variable in appearance across its broad North American range27 and was confused with 25
other species, the most in our study. However, the larger number of training images of B. rufocinctus (n = 3,104)
appeared to help reduce its error rate (14.4%). Bombus caliginosus also had a small training sample size (n = 108)
and relatively high error rate (15.4%). But instead of having a variable appearance, it is remarkably similar to B.
vosnesenskii, with which it was frequently confused in our model. Indeed, experts can struggle to differentiate
these two species based on photos alone.
Even species with many samples may sometimes be confused within a smaller group of similar species with
similar morphology. For example, Bombus bimaculatus, B. impatiens, and B. griseocollis share similar features
and are thus grouped together in feature space (Fig. 2). Figure 4D shows an example of B. griseocollis that was
misclassified as B. impatiens. Bombus griseocollis, however, was the second most likely choice. Bombus pensyl-
vanicus and B. auricomus are similarly grouped in feature space. There can be a relatively small difference in
prediction probability scores among species in these small groups of similar yet highly sampled species, which
is one of the reasons for the large 5.4 percentage point increase from top-1 to top-2 model accuracy. That is, if
the top prediction is not correct, the top two predictions are very likely to include another species within the
multispecies grouping and thus contain the correct class.
Gathering more images, especially of species with higher error rates, would likely improve the classification
accuracy of our model and reduce species-specific error rates. This would allow us to capture a greater range
of the heterogeneity in each species as well as reduce the imbalance among classes. For example, species with
at least 4,500 images (3,600 train + 900 test) all had error rates lower than 10% (Fig. 3, Table S1). This suggests
that, for species with error rates greater than 10%, obtaining at least 4,500 images would be an important goal
for improving model performance. A challenge, however, is that the species with low training sample sizes are
generally rarer in nature and/or have a restricted range. This rarity reduces their occurrence in databases such
as Bumble Bee Watch because these species are not frequently encountered by volunteers. Some images can be
gathered from preserved specimens in collections, but it will also be necessary to mount sampling expeditions
specifically aimed at capturing images of these rare species in the field. Our classification model could also make
use of images already in hand that have not yet been validated. Bumble Bee Watch, for example, has a backlog
Scientific Reports | (2021) 11:7580 | https://doi.org/10.1038/s41598-021-87210-1 7
Vol.:(0123456789)www.nature.com/scientificreports/
of thousands of images that have not been verified by experts, most of which are common species. Passing these
images through our model could flag potential high-value images for priority validation by experts. Once vali-
dated, the images could be incorporated into subsequent versions of the classification model.
Maximizing confidence in model predictions. Given the current model, a number of steps can be
taken to increase one’s confidence in the model predictions. For example, users can increase accuracy by input-
ting higher-quality images. Misclassified images are often low-resolution because the bee is small in the original
image and therefore not represented by a sufficient number of pixels to capture important features. A bee may
also be in poor focus or partially obscured (Fig. 4 A-C). An automated image quality score, based on the number
of pixels and focus of the input image, could potentially be provided to users as a screening tool to help them
assess their confidence in class predictions.
Users may increase their confidence in a prediction by assessing the results of a series of images of the same
individual taken from different points of view. Experts often use an ensemble approach in which they examine
multiple images that may each capture different diagnostic features and then assign an identification to all images,
even if an identification couldn’t be made based on any single image. The same approach could be taken with
our model by assessing the top 3–5 prediction probabilities on a series of photos or frames from a short video
clip. We examined a subset of misclassified test images and found that other images of the same individual were
often classified correctly.
Model improvement. Further development of our training data set should enhance generalization and
model accuracy, especially by prioritizing images of poorly sampled species with higher error rates. However,
exploring new ways of learning and data generation may further enhance the model. For example, metric learn-
ing could be used to learn similar features between a pair of images, thus enhancing the discriminative power of
deep CNNs37. Alternatively, generative adversarial networks38 may help improve error rates for poorly sampled
species and low accuracy due to class imbalance by generating synthetic image data when new images are dif-
ficult to acquire.
Knowledge of the spatial location of an observation may improve model performance as bumble bees vary in
appearance across their geographic range. For example, the local phenotype of B. melanopygus may more closely
resemble B. bifarius than its own phenotype from a different portion of its range. Associating learned features
with geographic locations may therefore help to improve classification accuracy when observation coordinates
are available. Similarly, location data could weight or narrow the prediction field. For example, the individual
shown in Fig. 4F was (wrongly) classified as B. ternarius, even though it was observed out of the typical range of
B. ternarius. Removing or downweighting out-of-range predictions would have resulted in the correct prediction,
B. huntii, which was second most likely.
BeeMachine web application. We created a web application called BeeMachine to let users identify bum-
ble bees in their own images using our classification model, which can be found at https://beemachine.ai. Users
can upload images of bumble bees and receive the top three predictions along with associated probabilities.
BeeMachine is in the early stages of development and will be frequently updated to enhance usability and accu-
racy as well as including more species from other regions of the world in the classification model. BeeMachine
can currently be accessed and used on both desktop and mobile browsers but a dedicated mobile application is
in development which will allow for a more streamlined user experience in the field, more educational content,
and integration into video-based sampling strategies.
Conclusions
Computer vision will soon play an integral role in bee research. Now common in other fields, classification and
object detection models will be used in the lab and deployed on devices in the field to capture data in realtime
and over large spatial scales39. Further development of this technology and data sets for training models will be
critical to our ability to efficiently assess trends in bumble bees and other bee taxa. For example, large scale and
ambitious bee monitoring programs, such as proposed by Woodard et al.40 could benefit from machine-aided
observation and identification technology. Beyond bees, this technology is easily scalable and can be generalized
to other taxa. With mounting evidence of a global decline in insect biodiversity41,42, we need these AI-based
tools to efficiently monitor insect populations. Object detection can be coupled with still or video cameras for
automated sampling of insects visiting flowers43, captured in traps44, or visiting non-lethal camera traps as com-
monly used in studies of larger wildlife45. For example, cameras could be mounted to blue vane or pan traps
that have been modified to allow insect visitors to pass through unharmed after triggering an AI-based imaging
system. By aiding with hard-to-identify taxa, such as insects, in combination with high throughput systems,
applied computer vision can provide a more nuanced picture of global insect biodiversity trends compared to
trends in relatively simple measures of biomass e.g.,46.
Presently, our model can reliably identify many of the common species of North American bumble bees.
Thus, computer vision can already help reduce the workload on overburdened experts, freeing them to focus on
more challenging identifications and the science of taxonomy. Continued refinement and taxonomic expansion
of machine algorithms, such as ours, will only increase their utility and expand their use to other taxa. But given
the fluid nature of taxonomic classification, this tool will remain a work-in-progress, requiring input from a com-
munity of taxonomic experts to, among other things, define species. The recent separation of Bombus bifarius into
two species, B. vancouverensis and B. bifarius47, is but one example of the vital work of taxonomic and genomic
experts that will be incorporated into updated versions of our classification model.
Scientific Reports | (2021) 11:7580 | https://doi.org/10.1038/s41598-021-87210-1 8
Vol:.(1234567890)www.nature.com/scientificreports/
Received: 22 November 2020; Accepted: 25 March 2021
References
1. Alexandra-Maria, K. et al. Importance of pollinators in changing landscapes for world crops. Proc. R. Soc. B Biol. Sci. 274, 303–313
(2007).
2. Winfree, R., Williams, N. M., Gaines, H., Ascher, J. S. & Kremen, C. Wild bee pollinators provide the majority of crop visitation
across land-use gradients in New Jersey and Pennsylvania, USA. J. Appl. Ecol. 45, 793–802 (2008).
3. Brosi, B. J. & Briggs, H. M. Single pollinator species losses reduce floral fidelity and plant reproductive function. Proc. Natl. Acad.
Sci. 110, 13044–13048 (2013).
4. Potts, S. G. et al. Global pollinator declines: trends, impacts and drivers. Trends Ecol. Evol. 25, 345–353 (2010).
5. Cameron, S. A. et al. Patterns of widespread decline in North American bumble bees. Proc. Natl. Acad. Sci. 108, 662–667 (2011).
6. Koh, I. et al. Modeling the status, trends, and impacts of wild bee abundance in the United States. Proc. Natl. Acad. Sci. 113, 140–145
(2016).
7. Cameron, S. A. & Sadd, B. M. Global trends in bumble bee health. Annu. Rev. Entomol. 65, 209–232 (2020).
8. Murray, T. E., Kuhlmann, M. & Potts, S. G. Conservation ecology of bees: populations, species and communities. Apidologie 40,
211–236 (2009).
9. Michener, C. D. The Bees of the World (Johns Hopkins University Press, Baltimore, 2007).
10. Milam, J. et al. Validating morphometrics with DNA barcoding to reliably separate three cryptic species of bombus cresson
(Hymenoptera: Apidae). Insects 11, 669 (2020).
11. Williams, P. H. et al. Widespread polytypic species or complexes of local species? Revising bumblebees of the subgenus Melano-
bombus world-wide (Hymenoptera, Apidae, Bombus). Eur. J. Taxon. 719, 1–120 (2020).
12. Drew, L. W. Are we losing the science of taxonomy? As need grows, numbers and training are failing to keep up. Bioscience 61,
942–946 (2011).
13. Portman, Z. M., Bruninga-Socolar, B. & Cariveau, D. P. The state of bee monitoring in the United States: A call to refocus away
from bowl traps and towards more effective methods. Ann. Entomol. Soc. Am. 113, 337–342 (2020).
14. Valan, M., Makonyi, K., Maki, A., Vondráček, D. & Ronquist, F. Automated taxonomic identification of insects with expert-level
accuracy using effective feature transfer from convolutional networks. Syst. Biol. 68, 876–895 (2019).
15. Gratton, C. & Zuckerberg, B. Citizen science data for mapping bumble bee populations, in Novel Quantitative Methods in Pollinator
Ecology and Management (2019).
16. MacPhail, V. J., Gibson, S. D., Hatfield, R. & Colla, S. R. Using Bumble Bee Watch to investigate the accuracy and perception of
bumble bee (Bombus spp.) identification by community scientists. PeerJ 8, e9412 (2020).
17. Weeks, P. J. D., Gauld, I. D., Gaston, K. J. & O’Neill, M. A. Automating the identification of insects: a new solution to an old problem.
Bull. Entomol. Res. 87, 203–211 (1997).
18. Schröder, S. et al. The new key to bees: Automated identification by image analysis of wings. in The Conservation Link Between
Agriculture and Nature (eds. Kevan, P. & Imperatriz-Fonseca, V.) 209–216 (Ministry of Environment, 2002).
19. MacLeod, N., Benfield, M. & Culverhouse, P. Time to automate identification. Nature 467, 154–155 (2010).
20. Fuentes, A., Yoon, S., Kim, S. C. & Park, D. S. A robust deep-learning-based detector for real-time tomato plant diseases and pests
recognition. Sensors 17, 2022 (2017).
21. Motta, D. et al. Application of convolutional neural networks for classification of adult mosquitoes in the field. PLoS ONE 14,
e0210829 (2019).
22. Bojarski, M. et al. End to end learning for self-driving cars. arXxiv:1604.07316 (2016).
23. Anthimopoulos, M., Christodoulidis, S., Ebner, L., Christe, A. & Mougiakakou, S. Lung pattern classification for interstitial lung
diseases using a deep convolutional neural network. IEEE Trans. Med. Imaging 35, 1207–1216 (2016).
24. Liu, Z., Gao, J., Yang, G., Zhang, H. & He, Y. Localization and classification of paddy field pests using a saliency map and deep
convolutional neural network. Sci. Rep. 6, 20410 (2016).
25. Martineau, M., Raveaux, R., Chatelain, C., Conte, D. & Venturini, G. Effective training of convolutional neural networks for insect
image recognition. In Advanced Concepts for Intelligent Vision Systems, pp 426–437 (eds Blanc-Talon, J. et al.) (Springer Interna-
tional Publishing, Cham, 2018).
26. Marques, A. C. R. et al. Ant genera identification using an ensemble of convolutional neural networks. PLoS ONE 13, e0192011
(2018).
27. Williams, P. H., Thorp, R. W., Richardson, L. L. & Colla, S. R. Bumble Bees of North America: An Identification Guide (Princeton
University Press, Princeton, 2014).
28. He, K., Zhang, X., Ren, S. & Sun, J. Deep residual learning for image recognition. 2016 IEEE Conf. Comput. Vis. Pattern Recognit.
CVPR 770–778 (2015).
29. Zagoruyko, S. & Komodakis, N. Wide residual networks. arXxiv:1605.07146 (2017).
30. Szegedy, C., Vanhoucke, V., Ioffe, S., Shlens, J. & Wojna, Z. Rethinking the inception architecture for computer vision.
arXxiv:1512.00567 (2015).
31. Tan, M. et al. MnasNet: Platform-aware neural architecture search for mobile. arXxiv:1807.11626 (2019).
32. Deng, J. et al. ImageNet: A large-scale hierarchical image database. in 2009 IEEE Conference on Computer Vision and Pattern
Recognition 248–255 (2009).
33. Hernández-García, A. & König, P. Further advantages of data augmentation on convolutional neural networks. arXxiv:1906.11052
11139, 95–103 (2018).
34. Fard, F. S., Hollensen, P., Mcilory, S. & Trappenberg, T. Impact of biased mislabeling on learning with deep networks. in 2017
International Joint Conference on Neural Networks (IJCNN) 2652–2657 (2017).
35. Clare, J. D. J., Townsend, P. A. & Zuckerberg, B. Generalized model-based solutions to false positive error in species detection/
non-detection data. Ecology 102, e03241 (2021).
36. Clare, J. D. J. et al. Making inference with messy (citizen science) data: when are data accurate enough and how can they be
improved?. Ecol. Appl. 29, e01849 (2019).
37. Tian, Z. et al. Discriminative CNN via metric learning for hyperspectral classification. in IGARSS 2019 - 2019 IEEE International
Geoscience and Remote Sensing Symposium 580–583 (2019).
38. Nazki, H., Yoon, S., Fuentes, A. & Park, D. S. Unsupervised image translation using adversarial networks for improved plant disease
recognition. Comput. Electron. Agric. 168, 105117 (2020).
39. Wäldchen, J. & Mäder, P. Machine learning for image based species identification. Methods Ecol. Evol. 9, 2216–2225 (2018).
40. Woodard, S. H. et al. Towards a U.S. national program for monitoring native bees. Biol. Conserv. 252, 108821 (2020).
41. Wagner, D. L. Insect declines in the anthropocene. Annu. Rev. Entomol. 65, 457–480 (2020).
42. Montgomery, G. A. et al. Is the insect apocalypse upon us? How to find out. Biol. Conserv. 241, 108327 (2020).
43. Høye, T. T., Mann, H. M. R. & Bjerge, K. Camera-based monitoring of insects on green roofs. DCE – Natl. Cent. Environ. Energy
18 (2020).
44. Ärje, J. et al. Automatic image-based identification and biomass estimation of invertebrates. Methods Ecol. Evol. 11, 922–931 (2020).
Scientific Reports | (2021) 11:7580 | https://doi.org/10.1038/s41598-021-87210-1 9
Vol.:(0123456789)www.nature.com/scientificreports/
45. Norouzzadeh, M. S. et al. Automatically identifying, counting, and describing wild animals in camera-trap images with deep
learning. Proc. Natl. Acad. Sci. 115, E5716–E5725 (2018).
46. Hallmann, C. A. et al. More than 75 percent decline over 27 years in total flying insect biomass in protected areas. PLoS ONE 12,
e0185809 (2017).
47. Ghisbain, G. et al. Substantial genetic divergence and lack of recent gene flow support cryptic speciation in a colour polymorphic
bumble bee (Bombus bifarius) species complex. Syst. Ecol. 45, 635–652 (2020).
Acknowledgements
We thank USDA NIFA (2020-67013-31862) for funding this research. Our project was developed using data
from iNaturalist (inaturalist.org), BugGuide (bugguide.net), and Bumble Bee Watch (bumblebeewatch.org). We
thank the supporters of Bumble Bee Watch: Wildlife Preservation Canada, York University, University of Ottawa,
Montreal lnsectarium, London Natural History Museum, and BeeSpotter. Three reviewers provided feedback
that improved the manuscript. We are grateful to all the community scientists, taxonomists, and other volunteer
participants who have gathered data and provided their expertise to make this work possible.
Author contributions
B.S. conceived the study and wrote the first draft of the manuscript. K.P. and B.S. performed the modeling. B.S.,
C.G., R.H., W.H., S.J., B.M., K.P., and G.W. all provided critical feedback, editing, and approval of the final draft.
Competing interests
The authors declare no competing interests.
Additional information
Supplementary Information The online version contains supplementary material available at https://doi.org/
10.1038/s41598-021-87210-1.
Correspondence and requests for materials should be addressed to B.J.S.
Reprints and permissions information is available at www.nature.com/reprints.
Publisher’s note Springer Nature remains neutral with regard to jurisdictional claims in published maps and
institutional affiliations.
Open Access This article is licensed under a Creative Commons Attribution 4.0 International
License, which permits use, sharing, adaptation, distribution and reproduction in any medium or
format, as long as you give appropriate credit to the original author(s) and the source, provide a link to the
Creative Commons licence, and indicate if changes were made. The images or other third party material in this
article are included in the article’s Creative Commons licence, unless indicated otherwise in a credit line to the
material. If material is not included in the article’s Creative Commons licence and your intended use is not
permitted by statutory regulation or exceeds the permitted use, you will need to obtain permission directly from
the copyright holder. To view a copy of this licence, visit http://creativecommons.org/licenses/by/4.0/.
© The Author(s) 2021
Scientific Reports | (2021) 11:7580 | https://doi.org/10.1038/s41598-021-87210-1 10
Vol:.(1234567890)You can also read