Investigating the background and local contribution of the oxidants in London and Bangkok
←
→
Page content transcription
If your browser does not render page correctly, please read the page content below
Faraday Discussions
                                                                                               Cite this: DOI: 10.1039/d0fd00086h

                                                                                                                                                                           View Article Online
                                                                                                     PAPER                                                                 View Journal
         This article is licensed under a Creative Commons Attribution 3.0 Unported Licence.

                                                                                               Investigating the background and local
                                                                                               contribution of the oxidants in London and
Open Access Article. Published on 15 2020. Downloaded on 13/01/2021 5:28:37 .

                                                                                               Bangkok†
                                                                                               M. Anwar H. Khan, *a Rayne Holland, a Amy Foulds,a
                                                                                               James C. Matthews,a Sanjee Panditharatne, a Michael E. Jenkin,b
                                                                                               Douglas Lowe,c Panida Navasumrit,d Carl J. Percival e
                                                                                               and Dudley E. Shallcross af

                                                                                               Received 29th June 2020, Accepted 14th October 2020
                                                                                               DOI: 10.1039/d0fd00086h

                                                                                               The contribution of NOx emissions and background O3 to the sources and partitioning of
                                                                                               the oxidants [OX (¼ O3 + NO2)] at the Marylebone Road site in London during the 2000s
                                                                                               and 2010s has been investigated to see the impact of the control measures or technology
                                                                                               changes inline with the London Mayor’s Air Quality Strategy. The abatement of the
                                                                                               pollution emissions has an impact on the trends of local and background oxidants,
                                                                                               [OX]L and [OX]B, decreasing by 1.4% per year and 0.4% per year, respectively from 2000
                                                                                               to 2019. We also extend our study to three roadside sites (Din Daeng, Thonburi and
                                                                                               Chokchai) in another megacity, Bangkok, to compare [OX]L and [OX]B and their
                                                                                               behavioural changes with respect to the Marylebone Road site. [OX]L and [OX]B at the
                                                                                               Marylebone Road site (0.21[NOx] and 32 ppbv) are comparable with the roadside sites of
                                                                                               Thailand (0.12[NOx] to 0.26[NOx] and 29 to 32 ppbv). The seasonal variation of [OX]B
                                                                                               levels displays a spring maximum for London, which is due to the higher northern
                                                                                               hemispheric ozone baseline, but a maximum during the dry season is found for
                                                                                               Bangkok which is likely due to regional-scale long-range transport from the Asian
                                                                                               continent. The diurnal variations of [OX]L for both London and Bangkok roadside sites
                                                                                               confirm the dominance of the oxidants from road transport emissions, which are found
                                                                                               to be higher throughout the daytime. WRF-Chem-CRI model simulations of the

                                                                                               a
                                                                                                School of Chemistry, University of Bristol, Cantock’s Close, Bristol, BS8 1TS, UK. E-mail: anwar.khan@bristol.
                                                                                               ac.uk
                                                                                               b
                                                                                                   Atmospheric Chemistry Services, Okehampton, Devon, EX20 4QB, UK
                                                                                               c
                                                                                               School of Earth, Atmospheric and Environmental Science, The University of Manchester, Manchester M13 9PL,
                                                                                               UK
                                                                                               d
                                                                                                Laboratories of Environmental Toxicology/Chemical Carcinogenesis, Chulabhorn Research Institute, Laksi,
                                                                                               Bangkok 10210, Thailand
                                                                                               e
                                                                                               NASA Jet Propulsion Laboratory, California Institute of Technology, 4800 Oak Grove Dr, Pasadena, CA 91109,
                                                                                               USA
                                                                                               f
                                                                                               Department of Chemistry, University of the Western Cape, Robert Sobukwe Road, Bellville, 7375, South Africa
                                                                                               † Electronic supplementary information (ESI) available: Additional data (Fig. S1–S5 and Table S1). See
                                                                                               DOI: 10.1039/d0fd00086h

                                                                                               This journal is © The Royal Society of Chemistry 2020                                      Faraday Discuss.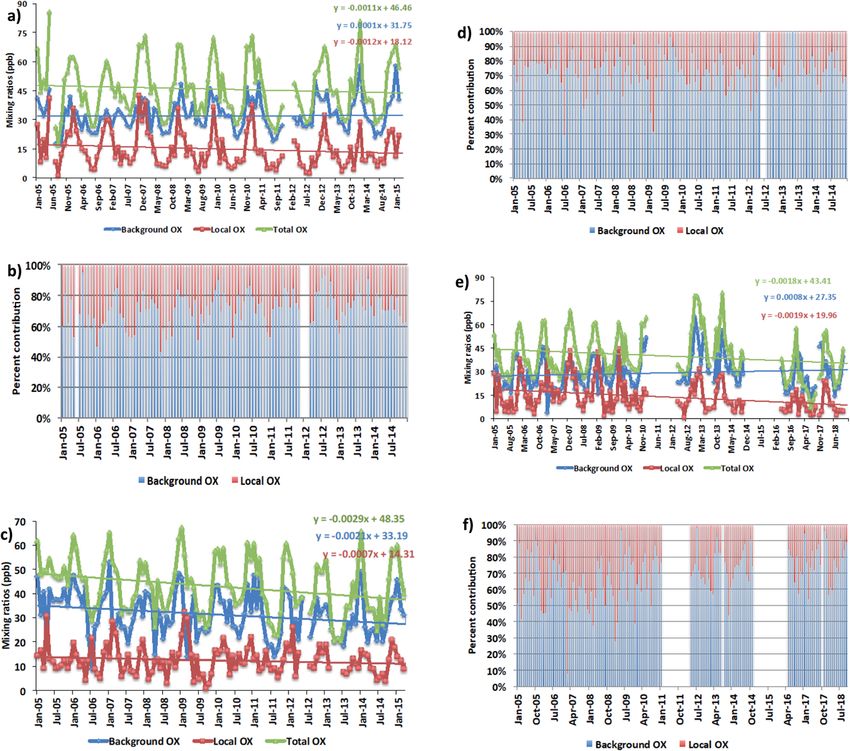
View Article Online
Faraday Discussions Paper
distribution of [OX] showed that the model performed well for London background sites
when predicting [OX] levels compared with the measured [OX] levels suggesting that
the model is treating the chemistry of the oxidants correctly. However, there are large
discrepancies for the model–measurement [OX] levels at the traffic site because of the
difficulties in the modelling of [OX] at large road networks in megacities for the
This article is licensed under a Creative Commons Attribution 3.0 Unported Licence.
complex sub grid-scale dynamics that are taking place, both in terms of atmospheric
processes and time-varying sources, such as traffic volumes. For roadside sites in
Bangkok, the trend in changes of [OX] is predicted by the model correctly but
overestimated in absolute magnitude. We suggest that this large deviation is likely to be
Open Access Article. Published on 15 2020. Downloaded on 13/01/2021 5:28:37 .
due to discrepancies in the EDGAR emission inventory (emission overestimates) beyond
the resolution of the model.
Introduction
Nitrogen dioxide (NO2) and ozone (O3) are key urban air pollutants with well-
documented public health impacts.1 It is well established that the chemistry of
O3, NO2 and nitric oxide (NO) is strongly coupled by the following null cycle,
typically on the timescale of a few minutes under most ambient conditions.2,3
NO + O3 / NO2 + O2 (1)
NO2 + hn (+ O2) / NO + O3 (2)
Because of this rapid interconversion, the term “oxidant” (hereaer denoted
OX) has sometimes been used as a collective term for NO2 and O3,4,5 similarly to
NOx being the well-established collective term for NO and NO2. Reactions (1) and
(2) therefore partition NOx between its component forms of NO and NO2, and OX
between its component forms of O3 and NO2, but conserves both NOx and OX.
Reported analyses of ambient data have shown that the concentration of OX at
a given location, [OX], can be described in terms of the combination of a back-
ground (NOx-independent) source and a local (NOx-dependent) source, denoted
here as [OX]B and [OX]L, respectively,5,6 as also apparent from the example data
shown in Fig. 1.
[OX] ¼ [OX]B + [OX]L (i)
[OX]L is believed to be mainly derived from primary emissions of NO2,
particularly at roadside and kerbside locations, such that the slope of the [OX] vs.
[NOx] relationship provides an estimate of the volumetric fraction of NOx emitted
as NO2.6,7 [OX]B provides a quantication of the background [O3] which would
exist at the given location in the notional absence of NOx. It can therefore be
regarded as the global (hemispheric) baseline O3 level, modied by regional-scale
processes (i.e. deposition and chemistry) that can either remove or produce OX.
Analyses of this type have been carried out in a number of studies,5,6,8,9 with values
of [OX]B and [OX]L reported for a variety of locations and time periods.
There is a substantial spatial variability in the levels of NO2 and O3 in urban
areas, resulting from localised sources of NOx and its relatively short life-time.10–12
The dominant NOx sources are road traffic and static combustion in domestic,
Faraday Discuss. This journal is © The Royal Society of Chemistry 2020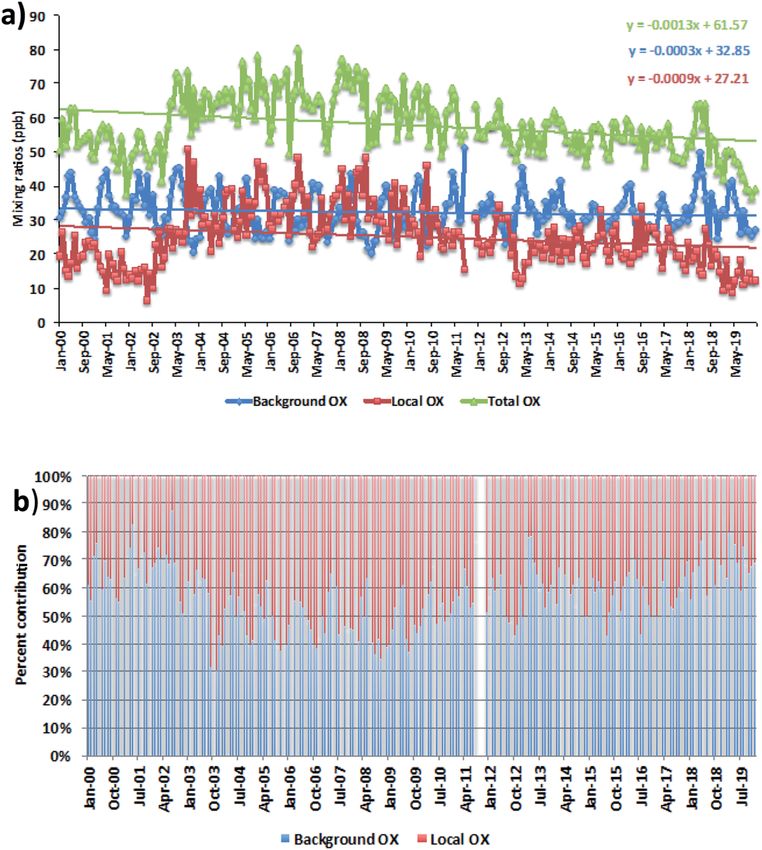
View Article Online
This article is licensed under a Creative Commons Attribution 3.0 Unported Licence. Paper Faraday Discussions
Open Access Article. Published on 15 2020. Downloaded on 13/01/2021 5:28:37 .
Fig. 1 Variation of hourly OX with NOx at the Marylebone Road site for the month of
August 2012.
commercial, and industrial processes.13–15 The combined health effect of NO2 and
O3 has been reported to be elevated compared with their individual effects, which
has led to interest in the processes controlling OX levels in the urban areas.16,17 A
recent study showed that the OX can enhance the chronic health risks of ne
particulate matter (PM2.5),18 thus the reduction of OX levels could be benecial to
reduce the public health impacts of PM2.5.
Currently there are 33 megacities (cities with population of more than 10
million) declared by United Nations in 2018 and the number is likely to increase
to 43 by 2030.19 London is one of the megacities in the world where air quality is
an issue of increasing public concern. For example, levels of NO2 at roadside and
kerbside locations in London have exceeded the EU annual mean limit value of 40
mg m3 on many occasions.20 The U.K. has progressively adopted EU emissions
control measures for both NOx and volatile organic compounds (VOCs) since the
early 1990s, with potential impacts on the magnitude of [OX]L and [OX]B.21–23 We
therefore investigate the time dependence of these oxidant components at the
London Marylebone Road kerbside site, over the time period 2000–2019, to
examine the effects of the control measures.
Thailand is one of the rapid economically developing and urbanised countries,
which has led to the emergence of a megacity (e.g. Bangkok) and concomitant
problems of poor air quality. The transportation, electricity generation and
manufacturing industries are considered to be the major sources of air pollutants
in Bangkok.24 A recent study showed that NOx levels in Bangkok are mostly below
the National Ambient Air Quality Standards (NAAQS), but, O3 levels in Bangkok
frequently exceed the NAAQS.25 Uttamang et al.25 analysed the Bangkok metro-
politan region pollutant data for 2010–2014 and found that both local and
background OX contributions are responsible for increasing the concentration of
O3. We update the work of Uttamang et al.25 using more calendar year-coverage
data (2005–2018), highlighting roadside and kerbside locations in Bangkok and
compare the results with those of the Marylebone Road site in London to inves-
tigate any systematic differences in the magnitudes and time dependences of the
oxidant components for the two different scenarios (midaltitude vs. tropics).
Megacities are immense sources of air pollutants, with large impacts on
regional and global atmospheric chemistry.26 In addition to local sources, ozone
This journal is © The Royal Society of Chemistry 2020 Faraday Discuss.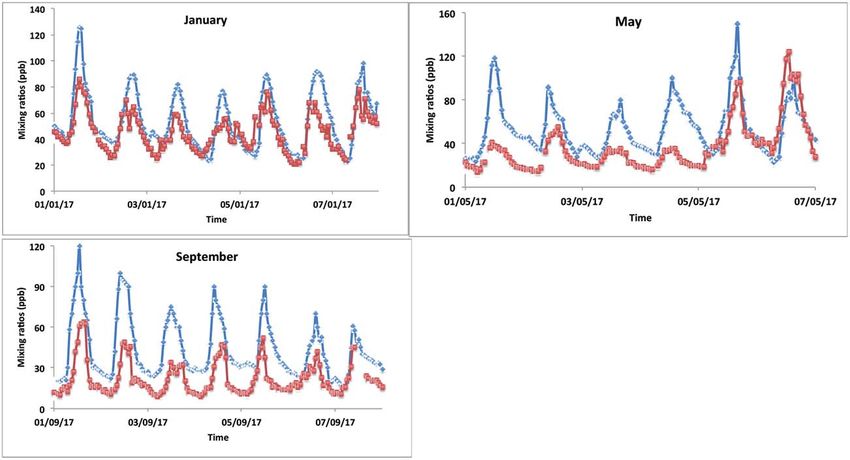
View Article Online
Faraday Discussions Paper
precursors (NOx, volatile organic compounds (VOCs)) can also be transported over
long distances from the source and cause ozone formation in the downwind
locations.27 The balance between local and long-range transport effects are
assumed to depend strongly on regional meteorological and geographical differ-
ences. The representation of chemistry and accurate ozone precursor emission
This article is licensed under a Creative Commons Attribution 3.0 Unported Licence.
inventories in the model is very important to reproduce O3 globally and regionally.
Recently, we used a mesoscale non-hydrostatic 3-D meteorological model, WRF-
Chem-CRI, to simulate the distribution of important trace gases (e.g. NOx, O3)
over North-West Europe and found reasonable agreement with measurement data
Open Access Article. Published on 15 2020. Downloaded on 13/01/2021 5:28:37 .
of urban and rural areas of the U.K.28 In this study, we use the similar model set-up
to conduct month-long simulations of O3 and NOx during summer and winter
months of 2012 over the U.K. and week-long simulations of O3 and NOx during
January, May and September months of 2017 over Thailand which is then evaluated
with Automatic Urban and Rural Network (AURN), Department for Environment,
Food and Rural Affairs (DEFRA), measurement data for London and Pollution
Control Department (PCD) measurement data for Bangkok. We compare the
modelled and measured OX data of London sites with different environments (e.g.
suburban background, urban background, urban traffic, and urban industrial) to
investigate how the WRF-Chem model predicts background OX in these sites.
Methods
Site description
Marylebone Road is a kerbside site in central London, which is located next to
a busy six-lane road in a street canyon with traffic ows of over 80 000 vehicles per
day with frequent congestion.29 For model comparison, we selected ve sites with
different environmental conditions: two urban background (Westminster, 17 m
away from the nearest road; Bloomsbury, 25 m away from the nearest road), one
suburban background (Eltham, 25 m away from the nearest road), one urban
industrial (Harlington, 10 m away from the nearest road) and one urban traffic
(Marylebone Road, 1 m away from the road).
Three roadside monitoring sites: Kheha Chumchon Din Daeng, Chokchai
Police Station and Thonburi Electricity Authority substation site in Bangkok
operated by PCD were chosen based on traffic density and traffic ow. The Din
Daeng site is located in central Bangkok, next to a busy six-lane road. South of the
measurement site are tall apartment buildings, but to the north is a school and
grassy spaces. Thonburi Electricity Authority substation site is next to a six-lane
road, which is based in an industrial area with a canal to the west, a nearby gas
station to the east and a residential area to the north. Chokchai is next to an eight-
lane road, which can accumulate air pollutants due to frequent congestion. The
site is not located in the business centre district, but the inlet of the sampling site
is very close to a bus stop.
Measurement technique
NOx and O3 have been monitored simultaneously at the Marylebone Road since
July 1997 as part of the AURN set up by DEFRA. Throughout the AURN,
measurements were made with commercial instrumentation using recognised
techniques (i.e. photometry is used for O3 measurements and
Faraday Discuss. This journal is © The Royal Society of Chemistry 2020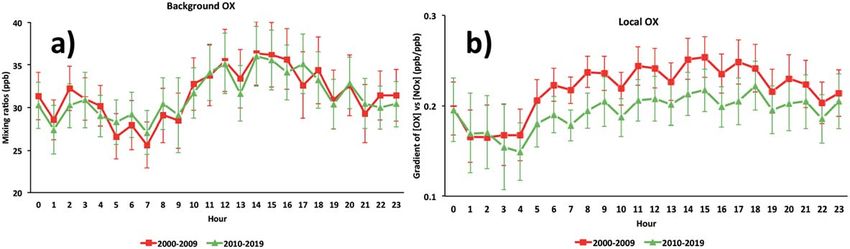
View Article Online
Paper Faraday Discussions
chemiluminescence is used for NOx measurements) as described by DEFRA.30
However, it is important to note that these analysers are subject to potential
interferences from several other oxidised nitrogen species, which can be
erroneously reported as NO2.31,32 Despite this, these species are only likely to
have a signicant impact at rural or remote locations where NOx concentra-
This article is licensed under a Creative Commons Attribution 3.0 Unported Licence.
tions are reduced and so-called NOz components abound, due to their forma-
tion from NOx processing (e.g. PANs). Thus, [NOz]/[NOx] increases with
chemical processing time, so the interferences are not important to consider at
roadside or kerbside locations. The uncertainty (expressed at a 95% condence
Open Access Article. Published on 15 2020. Downloaded on 13/01/2021 5:28:37 .
level) of the measured data for NOx and O3 was around 15%.33 Measurements
for these species are reported at hourly resolution and are openly available
from the U.K. Air Information Resource (http://uk-air.defra.gov.uk/data/
data_selector). This study considers the hourly mean OX and NOx data for
the years 2000–2019 inclusive where data has been divided by hour of the day
for each month of the year. The data coverage at this site is reasonably
consistent except 2011 with the majority of months showing well over the 80%
coverage required for inclusion in this study.
For the Bangkok roadside sites, NO and NO2 measurements were performed
using chemiluminescence detection (Thermo Scientic 42i). The working range
of the instrument is 0–500 ppb to 0–20 ppm with a minimum detection limit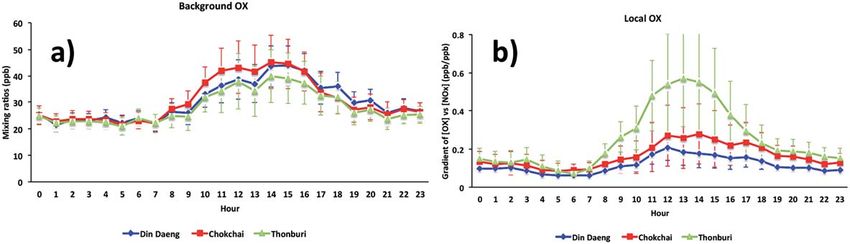
View Article Online
Faraday Discussions Paper
Modelling
We used a mesoscale non-hydrostatic 3-D meteorological model, WRF-Chem-CRI,
which is an online fully coupled chemistry transport model.34 The chemistry and
aerosol components, along with the prognostic meteorological variables, are
integrated over the same timestep as the transport processes, using the same
This article is licensed under a Creative Commons Attribution 3.0 Unported Licence.
advection and physical parameterisations.34 The meteorological, physical and
chemical parameterizations of the model are described in detail elsewhere.28,35
The meteorology was driven by the European Centre for Medium Range Weather
Forecasts (ECMWF) ERA-Interim reanalysis data.36 The chemical boundary
Open Access Article. Published on 15 2020. Downloaded on 13/01/2021 5:28:37 .
conditions were provided from MOZART-4 global model.37 Biogenic emissions
were calculated online by the Model of Emissions of Gases and Aerosols from
Nature (MEGAN) (https://www2.acom.ucar.edu/modeling/model-emissions-
gases-and-aerosols-nature-megan).38 The MEGAN model calculates the biogenic
emissions of the species from terrestrial ecosystems with a resolution of 1 km 1
km and is driven by land cover by vegetation, environmental factors (e.g.
temperature, humidity, solar intensity, soil moisture) and atmospheric chemical
composition. The anthropogenic emissions for the London study have been
sourced from a combination of the UK National Atmospheric Emissions Inventory
(NAEI) (https://naei.beis.gov.uk) and the European The Netherlands Organisation
for Applied Scientic Research, Monitoring Atmospheric Composition and
Climate’s emission inventory (TNO-MACC-IIIT).39 The NAEI data for the year 2012
with a resolution of 1 km 1 km was used in this study. The NAEI includes seven
direct greenhouse gases addressed at the Kyoto summit, as well as other trace
gases believed to be of atmospheric signicance: NOx, CO, non-methane volatile
organic compounds (NMVOCs) and SO2. Where data from the NAEI was not
available, the TNO was employed to ll the gaps. The TNO data with a resolution
of 0.125 0.0625 for the year 2011 was used in the study. Scaling factors based
on those built for the EMEP model are applied to the anthropogenic emission
inventories in order to account for daily, weekly and monthly differences.40 The
anthropogenic emissions for the Bangkok study were extracted from the global
Emission Database for Global Atmospheric Research with Task Force on Hemi-
spheric Transport of Air Pollution (EDGAR v4.3.2) emission inventories for 2010 at
0.1 0.1 resolution.41,42 These datasets are provided as monthly means giving
the seasonal cycles. Daily activity cycles, and speciation of NMVOC emissions (see
ESI, Table S1†), have been imposed (see details in Chen et al.43 and Lowe).44 The
chemistry scheme used is CRI (Common Representatives Intermediate Mecha-
nism), a chemical mechanism describing gas-phase transformations of methane
and 25 NMVOCs, via 232 chemical species participating in 638 simulated
reactions.28
The model domain for the London study covers North-West Europe with a 15
km horizontal resolution with a size of 134 (E–W) by 146 (N–S) grid cells and 41
vertical levels with enhanced resolution within the planetary boundary layer. Two
scenarios were run using this domain from 00:00 UTC on 30 July 2012 to 00:00
UTC 24 August 2012 and from 00:00 UTC on 8 January 2012 to 00:00 UTC on 12
February 2012 covering summer and winter months, respectively. Because of the
long time period in the scenarios, the re-initialisation of the model meteorology
was performed every 3 days using ECMWF meteorology to minimize the errors in
the modelled meteorology (bias from model to actual). The Bangkok study region
Faraday Discuss. This journal is © The Royal Society of Chemistry 2020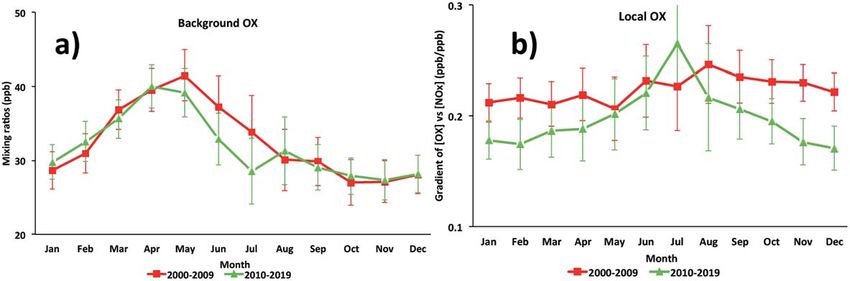
View Article Online
Paper Faraday Discussions
included Thailand, Vietnam, Laos and Cambodia (8 N–22 N and 94 E–108 E, see
ESI Fig. S2†) centred at 15 N and 101 E with 15 km horizontal resolution and 41
vertical levels. Three scenarios were run using this domain for the periods of 1–7
January 2017 (winter season), 1–7 May 2017 (summer season) and 1–7 September
2017 (rainy season) with 2 additional days for spin-up.
This article is licensed under a Creative Commons Attribution 3.0 Unported Licence.
Results and discussion
Local and background oxidants and their contribution and trend
Open Access Article. Published on 15 2020. Downloaded on 13/01/2021 5:28:37 .
The comparison of the average ‘local’ and ‘background’ contribution to the OX
levels, [OX]L and [OX]B, in the Marylebone Road (2000–2019), Din Daeng (2005–
2014), Chokchai (2005–2014) and Thonburi (2005–2018) with the other studies is
shown in Table 1. The variability of [OX]L for London and Bangkok for different
studies could be due to the control strategy response (e.g. changing the eet
technology by introducing Euro-classes and alternative-fuelled vehicles and/or
adopting a range of regulations) for reducing vehicle emissions over time. The
[OX]L and [OX]B levels in the Marylebone Road found in the study are comparable
with the study of Jenkin6 who analysed the [OX]L and [OX]B in London rural, urban
and kerbside sites over 1992–2001. The large difference of [OX]L levels in the study
from the Jenkin6 study can be explained by the larger fraction of NOx emitted as
NO2 in the roadside site than that in the rural, urban and kerbside sites. For
Bangkok roadside sites, we found average [OX]B levels of 32 ppb, 31 ppb, and
29 ppb for Din Daeng, Chokchai and Thonburi, respectively, but Uttamang et al.25
reported signicantly higher average [OX]B of 48 ppb and 95 ppb for non-episodes
([O3] < 100 ppb) and episodes ([O3] > 100 ppb), respectively. This is to be expected
Table 1 The comparison of the local and background OX levels in London and Bangkok
sites derived from fitted linear regression analysis
[OX]B
Site Site information Time period [OX ]L (ppb) (ppb) Ref.
Din Daeng, Bangkok Roadside 2005–2014 0.12 0.03 32.0 This
[NOx] 4.4 study
Thonburi, Bangkok Roadside 2005–2018 0.26 0.11 29.1 This
[NOx] 5.4 study
Chokchai, Bangkok Roadside 2005–2014 0.18 0.08 31.4 This
[NOx] 5.5 study
Marylebone Road, Roadside 2000–2009 0.22 0.02 32.4 This
London [NOx] 3.2 study
2010–2019 0.20 0.03 32.1
[NOx] 3.1
Bangkok Roadside suburb 2010–2014 0.13[NOx] 53.9 25
2010–2014 0.31[NOx] 47.0
Greater London Rural, urban & 1992–2001 0.10[NOx] 34.7 6
kerbside
Greater London Rural, urban & June 98 and 0.10[NOx] 38.2 5
kerbside June 99
Buenos Aires, Urban background Aug–Sep 2011 0.10[NOx] 22.0 9
Argentina
Delhi, India Urban background Sep 2010–Aug 0.54[NOx] 28.9 45
2012
This journal is © The Royal Society of Chemistry 2020 Faraday Discuss.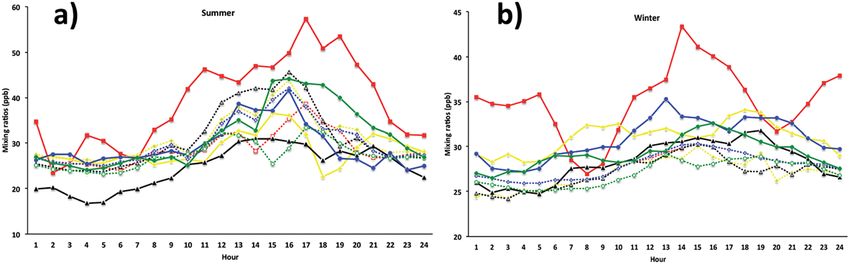
View Article Online
Faraday Discussions Paper
for Bangkok where our study analysed 24 hour data of NOx and O3 during 2005–
2018 for Thonburi and 2005–2014 for Din Daeng and Chokchai, but the Uttamang
et al.25 study considered only daytime data during 2010–2014 for Din Daeng and
Thonburi. The higher [OX]L levels at Bangkok roadside sites in this study
compared with the Uttamang et al.25 study are caused by the fact that the Bangkok
This article is licensed under a Creative Commons Attribution 3.0 Unported Licence.
data set is a much longer data set, and the initial years of the study (2005–2009)
resulted in much higher local pollution levels as emissions control technologies
or vehicle eet composition were not implemented during this time period.
We averaged the hourly gradient from the plot of [NOx] vs. [OX] for each month
Open Access Article. Published on 15 2020. Downloaded on 13/01/2021 5:28:37 .
and then multiplied by the monthly average NOx levels to calculate the monthly
[OX]L mixing ratios. The summation of [OX]L and [OX]B for each month is found
to be very similar with the summation of O3 and NO2 for both London and
Bangkok roadside sites (correlation coefficient 1, r2 ¼ 0.99 for each site, ESI
Fig. S3†). At the Marylebone Road, the average [OX]L over the last 20 years
contributes a signicant amount of 25.0 3.2 ppb (44% to the total OX levels,
Fig. 2b). A reduction of contribution of average [OX]L from the 2000s (28.0 3.1
ppb; 46% to the total OX) to the 2010s (22.0 3.2 ppb; 41% to the total OX) is
found. However, our results still indicate that there is a signicant local pollution
source (e.g. the fraction of NOx emitted as NO2) in the Marylebone Road site (see
ESI Fig. S4a†) that contributes to a large fraction of [OX]L levels during the 2010s.
At the Bangkok roadside sites, the contribution of average [OX]L to the total
Fig. 2 (a) The trends and (b) the percent contribution of oxidant levels in the Marylebone
Road for the period of 2000–2019. Statistical significance is based on a p < 0.001 and the
trends are reported with 95% confidence intervals.
Faraday Discuss. This journal is © The Royal Society of Chemistry 2020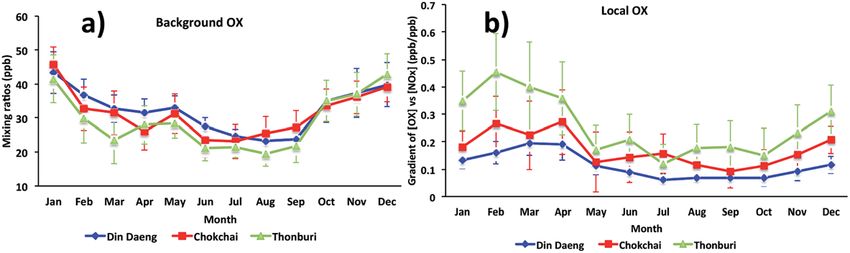
View Article Online
Paper Faraday Discussions
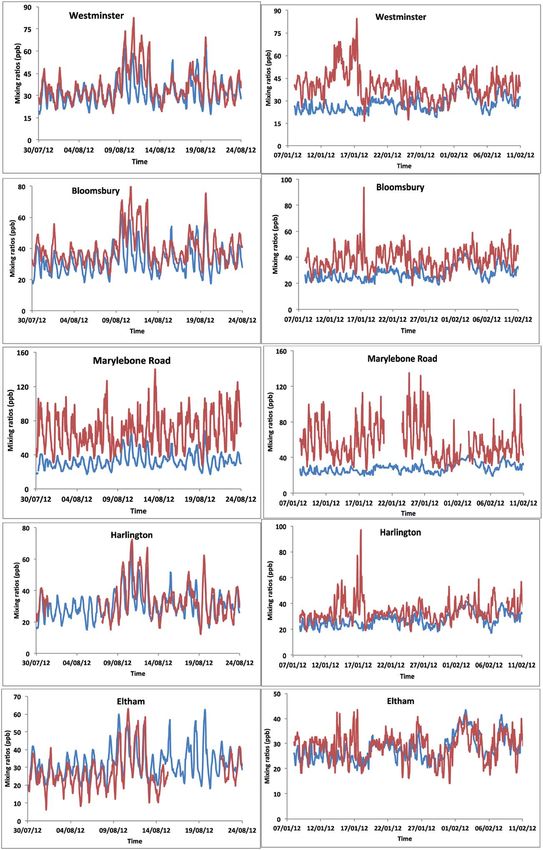
oxidants is lower (e.g. 14.5 5.0 ppb (31% to the total OX, Fig. 3b) for Din Daeng;
12.5 6.0 ppb (29% to the total OX, Fig. 3d) for Chokchai and 14.1 6.0 ppb (32%
to the total OX, Fig. 3f) for Thonburi) than the Marylebone Road. The aspect ratio
(ratio of building height to street width, H/W) comparison (Marylebone Road
1.0,46 Bangkok roadside sites 0.4 (ref. 47)) suggests that street canyons are
This article is licensed under a Creative Commons Attribution 3.0 Unported Licence.
much deeper in the Marylebone Road than that in the roadside sites of Bangkok.
Thus the street canyons in Marylebone Road are not as well ventilated as the
comparatively open locations in the Bangkok roadside sites, which is a possible
reason for increased [OX]L in the Marylebone Road.48,49 However, the pollution
Open Access Article. Published on 15 2020. Downloaded on 13/01/2021 5:28:37 .
levels dened by the fraction of NOx emitted as NO2 in Bangkok roadside sites are
highly variable with lower in Din Daeng compared with Thonburi and Chokchai
roadside sites (ESI Fig. S4b†). This might be explained by the mobile sources (e.g.
vehicles) in Bangkok metropolitan region,25 which is highly dependent on traffic
density and traffic ow. The NOx emissions from vehicles are dependent on fuel
type and speed of the vehicles,50 which can be responsible for the variation of the
[OX]L for different roadside sites in Bangkok.
For the Marylebone Road, decreasing trends of both [OX]L and [OX]B levels, by
0.33 ppb per year (1.4% per year, p < 0.001) and 0.11 ppb per year (0.4% per year, p
< 0.001), respectively, have been found for the period of 2000 to 2019 (Fig. 2a). The
Fig. 3 The trends (a, c and e) and the percent contribution (b, d and f) of oxidant levels in
Din Daeng (2005–2014), Chokchai (2005–2014) and Thonburi (2005–2018), respectively.
Statistical significance is based on a p < 0.001 and the trends are reported with 95%
confidence intervals.
This journal is © The Royal Society of Chemistry 2020 Faraday Discuss.View Article Online
Faraday Discussions Paper
local D[OX] has been found to have an upward trend (2.12 ppb per year, 8.9% per
year, p < 0.001) for the 2000s, but a downward trend (1.17 ppb per year, 5.4% per
year, p < 0.001) for the 2010s (see ESI Fig. S5†). An increasing trend of [OX]L from
2002–2005 is seen, which can be explained by the absolute increase in the
percentage of NOx emitted from vehicles as NO2 (Fig. S4a†). In response to the
This article is licensed under a Creative Commons Attribution 3.0 Unported Licence.
Euro III control in the U.K., we found an increase of 5.2% per year NOx emitted as
NO2 in the Marylebone Road from 2001 to 2005. The increased introduction of
Euro-III diesel vehicles tted with oxidation catalysts or the tting of catalytically
regenerative particle traps to buses can produce this extra amount of NO2,51 which
Open Access Article. Published on 15 2020. Downloaded on 13/01/2021 5:28:37 .
could be responsible for increasing [OX]L levels from 2001 to 2005 by 9.8% per
year. In response to the Euro IV–VI and Euro 4–6 legislations, a large number of
policy initiatives were introduced in line with the London Mayor’s Air Quality
Strategy (e.g. the roll out of new hybrid and electric vehicles or zero-emission
vehicles), thus changing the composition of the vehicle eet, which is a direct
consequence of the Low and Ultra Low Emission Zone legislature and inclusion of
the Congestion Charge Zone across London to improve air quality by reducing
NOx and particulate matter (PM) levels.21,52 On-road emissions from Euro IV heavy
vehicles and buses showed a reduction in the primary NO2 fraction resulting in
NO2 emissions from 2010 to 2014 in London.53,54 Furthermore, it has also been
shown that the emissions from aged Euro 4 and 5 diesel cars reduced the ratio of
NO2/NOx.53 These control strategies could be the main reasons to see a decrease of
1.5% per year NOx emitted as NO2 from 2010 to 2019. This is consistent with the
study of Font et al.55 and this NO2 decrease is likely to contribute to the decrement
of [OX]L in the 2010s. It can be concluded that the adopted emission control in
recent years has been successful in the abatement of pollutant emissions, which
reduced [OX]L levels at a rate of 5.4% per year from 27.2 ppb (2000s) to 15.6 ppb
(2010s).
The [OX]B in London is strongly dependent on the mixing ratios of O3 on the
northern hemispheric ozone baseline.7,56 We found very similar decreasing trends
of [OX]B in the 2010s as shown for northern hemispheric mid-latitude baseline O3
by Derwent et al.57 The relatively constant northern hemispheric ozone baseline
during the 2000s is reported in the Derwent et al.57 study, but we found a higher
downward trend of the D[OX]B with 0.55 ppb per year (1.6%, p < 0.001) in the
2000s compared with 0.08 ppb per year (0.3%, p ¼ 0.05) in the 2010s. The O3 can
be formed from regional-scale photochemical processing of VOCs and NOx over
north-west Europe during the anti-cyclonic heat-wave period58 and which can
then be transported to the south and east of the U.K. making an additional
contribution of [OX]B at the Marylebone Road. The signicant reductions of the
European anthropogenic emissions of NOx, VOCs in response to precursor
emissions controls (e.g. 1999 Gothenburg Protocol) from 2000 to 2009 can be
responsible for reducing regional photochemical ozone production.59 This is
likely to be the main reason for the decreasing [OX]B trend during the 2000s.
For Bangkok roadside sites, similar downward trends for [OX]L levels are found
in Din Daeng with 0.44 ppb per year (2.8% per year, p ¼ 0.001), in Thonburi with
0.69 ppb per year (4.6%, p < 0.001) and in Chokchai with 0.26 ppb per year (2.0%,
p ¼ 0.004) (Fig. 3a, c and e). From 2007–2015, the registered vehicle numbers in
Bangkok metropolitan area increased from 6.2 million to approximately 10
million, but the annual local pollutants (e.g. NOx, CO, NMVOCs) emissions from
vehicles have signicantly decreased due to the policy implemented on road
Faraday Discuss. This journal is © The Royal Society of Chemistry 2020View Article Online
Paper Faraday Discussions
transport activities.60 Thailand has subscribed to the Euro systems of light duty
vehicle emissions standard since 1997, but have adopted the more intensive
enforcement of fuel and engine standard levels for light duty vehicles from the
Euro 2 standard level in 1999 to the Euro 4 standard level in 2013 (with a stricter
limit on NOx and VOCs emissions from gasoline engines and on CO, NOx, VOCs +
NOx and PM emissions from diesel engines adopted).61 These policies have had
This article is licensed under a Creative Commons Attribution 3.0 Unported Licence.
some impact on decreasing NOx emitted as NO2 by 1.8% per year (Din Daeng;
2005–2014), 0.6% per year (Chokchai; 2005–2014), and 1.0% per year (Thonburi;
2005–2018) (see Fig. S4b†).
Open Access Article. Published on 15 2020. Downloaded on 13/01/2021 5:28:37 .
For [OX]B levels, the upward trends are found in Din Daeng (0.04 ppb per year,
0.1% per year, p ¼ 0.18) and in Thonburi (0.97 ppb per year, 2.9%, p ¼ 0.19), but
the changes are not signicant in the 95% condence interval (Fig. 3a and e).
However, a downward trend of [OX]B is seen in Chokchai (0.77 ppb per year, 2.6%
per year, p < 0.001) (Fig. 3c). Although the NOx emissions have decreased since
2011, the O3 concentration increases in the Asian continental air are still signif-
icant due to the continued increase in VOC emissions.62 Thus, the decreasing
local NOx emissions are not the only effective way to reduce the oxidant levels due
to the regional air pollution transport, which can increase the [OX]B levels in
Bangkok. The different [OX]B trends for London and Bangkok roadside sites can
be explained by meteorological variability and hemispheric transport of
pollution.63
Seasonal variation of local and background OX
For the Marylebone Road, the [OX]B has an annual cycle with a maximum in May
(41 ppb), inuenced by the spring maximum northern hemispheric ozone base-
line and a minimum in November (27 ppb) (Fig. 4a). More generally, high NOx is
associated with low boundary layer heights due to weak convective activities and
turbulent mixing in the winter, which can increase the loss of O3 and NO2 by
deposition to the surface, thereby reducing [OX]B in winter months. The previous
study at the Marylebone Road showed the seasonal variation of [OX]B with
a maximum during spring (43 ppb in April) and a minimum during autumn
(30 ppb in October).7 From the 2000s to the 2010s, the spring [OX]B is reduced by
1 ppb but the summer [OX]B is reduced by 3 ppb (see Fig. 4a) which could be
explained by the reduced photochemical O3 production as a result of reduced
European regional O3 precursor emissions. The number of extreme heat waves in
Europe is fewer in the 2010s than in the 2000s.64 In summer, heat waves are
Fig. 4 The seasonal cycles of (a) background OX and (b) local OX contributions in the
Marylebone Road (2000–2019).
This journal is © The Royal Society of Chemistry 2020 Faraday Discuss.View Article Online
Faraday Discussions Paper
common and [OX]B levels are expected to increase due to an increase in regional-
scale photochemical events.56 However, the signicant control of O3 precursor
emissions in recent years decreased the [OX]B formation from European polluted
air mass arriving at Marylebone Road. This conrms the success of the ozone
precursor emission control strategies in the abatement of oxidant emissions/
This article is licensed under a Creative Commons Attribution 3.0 Unported Licence.
production.
For [OX]L, the seasonal variability will depend on the level of the primary
pollutants, NO2 and the prevalent local photochemistry, thus a peak of [OX]L is
found during summer months (Fig. 4b). The contribution of [OX]L is found to be
Open Access Article. Published on 15 2020. Downloaded on 13/01/2021 5:28:37 .
higher during the 2000s compared with the 2010s which can be explained by the
extra emissions of NO2 due to the introduction of EURO III light duty diesel
vehicles (tted with oxidation catalysts) into the vehicle eet and the tting of
catalytically regenerative particle traps to bus eets.30 Signicantly high [OX]L is
seen in the 2000s during winter (when a shallow inversion layer is formed) which
is most likely due to the combination of extra emissions of NO2 and stagnant air.
For Bangkok, the seasonal variations of [OX]B and [OX]L (Fig. 5) show that high
mixing ratios were found during dry months (November to April) with low mixing
ratios during wet months (June to September). The differences in the meteoro-
logical conditions (solar radiation, temperature, cloud cover) between wet and dry
seasons affect the photochemical production of OX. The dry season is linked to
a more stable atmosphere and less intensive wet removal of oxidants65 resulting in
higher [OX]L and [OX]B levels. The long-range transport from the Asian continent
can contribute to [OX]B concentrations in Thailand,66 which plays an important
role in seasonal uctuations of OX in Bangkok.67 There is a slight increase of [OX]B
during April–May (Fig. 5a), which could be due to the transport of ozone
precursors from the burning region.68
Diurnal variation of local and background OX
The diurnal cycles of [OX]B in London and Bangkok roadside sites are found to
reach a maximum during the aernoon (Fig. 6 and 7) which is attributed to
a deepening boundary layer causing entrainment of ozone-rich air from alo. The
diurnal cycle is very consistent with that in similar studies for London7 and
Bangkok25 roadside sites.
The diurnal variation of [OX]L is related to transport emissions of NO2. Thus,
the levels of [OX]L at the Marylebone Road and Bangkok roadside sites are high
throughout the daytime (Fig. 6 and 7). The diesel NOx emissions peak during the
Fig. 5 The seasonal cycles of (a) background OX and (b) local OX contributions in
Bangkok roadside sites (Din Daeng, 2005–2014; Chokchai, 2005–2014; Thonburi, 2005–
2018).
Faraday Discuss. This journal is © The Royal Society of Chemistry 2020View Article Online
This article is licensed under a Creative Commons Attribution 3.0 Unported Licence. Paper Faraday Discussions
Fig. 6 The diurnal cycles of (a) background and (b) local oxidant levels in the Marylebone
Open Access Article. Published on 15 2020. Downloaded on 13/01/2021 5:28:37 .
Road (2000–2019).
Fig. 7 The diurnal cycles of (a) background and (b) local oxidant levels in Bangkok
roadside sites (Din Daeng, 2005–2014; Chokchai, 2005–2014; Thonburi, 2005–2018).
middle of the day.69 The NO2/NOx emission ratio is high for diesel engines which
can increase even further with lower vehicle speeds.30 The high [OX]L in the
Marylebone Road during the 2000s can be explained by the introduction of EURO
III light duty diesel vehicles (tted with oxidation catalysts) into the vehicle eet.
Thonburi is an industrial area, so the frequent movement of diesel engine heavy
vehicles in this area can emit a signicant amount of NOx as NO2 resulting in
higher [OX]L levels compared with Din Daeng and Chokchai. The traffic at both
Din Daeng and Chokchai throughout the day is busy, but, due to the close
proximity of a bus stop at the Chokchai monitoring site, buses regularly stop and
idle which could be responsible for enhanced [OX]L levels compared with that in
Din Daeng. Aer sunset, the formation of [OX]L at both London and Bangkok
roadside sites is inhibited and the planetary boundary layer becomes more stable
resulting in [OX]L reduction through chemical reaction (e.g. O3 + NO2 / NO3 +
O2) and physical processes (e.g. dry deposition).70 Since NO3 is building up in the
night-time and rapidly photolysed during the day, this process regenerates local
oxidants in early daylight hours.
Modelling of OX
We simulated model [OX ¼ (NO2 + O3)] mixing ratios and compared with the
measurements at the ve ground sites in the centre of London. The results
showed a general trend in peak [OX] which is well represented during summer
months (Fig. 8). The correlation coefficients for the Westminster, Harlington,
Eltham and Bloomsbury sites are high (r 0.8) suggesting that the model
captures the [OX] trend very well. The model–measurement agreement is also
reasonably good as the biases and root mean square errors (RMSE) for all these
This journal is © The Royal Society of Chemistry 2020 Faraday Discuss.View Article Online
Faraday Discussions Paper
sites are within 10 ppb (Table 2). The Westminster and Bloomsbury sites are
strongly inuenced by local traffic, which cause increased biases and RMSEs
compared with the Eltham and Harlington sites. The small correlation coefficient
This article is licensed under a Creative Commons Attribution 3.0 Unported Licence.
Open Access Article. Published on 15 2020. Downloaded on 13/01/2021 5:28:37 .
Fig. 8 The model–measurement comparison of [OX] levels in London sites for the period
of 30 July to 24 August 2012 (left side figures) and 8 January to 11 February 2012 (right side
figures). The red and blue lines represent measurement and modelled data, respectively.
Faraday Discuss. This journal is © The Royal Society of Chemistry 2020View Article Online
Paper Faraday Discussions
(r ¼ 0.4) and high bias (36 ppb) and RMSE (40 ppb) for the Marylebone Road
suggests that the model agreement with measurement for this site is relatively
poor compared with other London sites. This is likely to be a consequence of the
monitoring station being in close proximity to a busy six-lane road in a street
canyon, which regularly experiences high traffic volumes and prolonged periods
This article is licensed under a Creative Commons Attribution 3.0 Unported Licence.
of congestion. The site is subject to a well-characterized canyon vortex leading to
concentrations dominated by wind direction. Although running at a relatively ne
resolution of 15 km by 15 km, WRF-Chem-CRI is unable to pick up the local
sources and sub grid-scale chemical dynamics, which drive the air quality at street
Open Access Article. Published on 15 2020. Downloaded on 13/01/2021 5:28:37 .
level sites. Dispersion models such as ADMS take time-varying local sources (such
as traffic at street level) into account, as well as incorporating features such as
building, complex terrain, which alter the dynamics and thus composition of the
surrounding atmosphere. Overall, the model is generally able to reproduce the
[OX] levels in London to a reasonable extent and provide an accurate represen-
tation of air quality in complex urban environments.
There are many discrepancies in the [OX] peaks during winter months. The
NOx emissions from vehicles are higher in winter months compared with summer
months, thus the increased emissions fraction of NOx in the form of NO2 from
vehicles can have a direct local-scale impact on the levels of [OX]. Except the
Eltham site (a suburban site which experiences very low traffic volumes compared
with other sites), the model–measurement agreements for all other sites have
poor correlation coefficients, biases and RMSEs during winter months compared
with summer months. This is likely to be a result of the resolution of the model,
which is not enough to resolve the local effects (e.g. fraction of NOx emitted as NO2
from vehicle). In the model, the local sources are spread out across the grid cell,
resulting in diffusion of the emissions and leading to lower simulated mixing
ratios of [OX]. There have also been studies which have found signicant
underestimations (30–40%) of traffic-related NO2 emissions in the inventory data,
NAEI, used by WRF-Chem-CRI.71 As traffic (diesel vehicles in particular) is
a signicant source of NO2 in urban environments such as London, the observed
underestimation in modelled [OX] mixing ratios seen at London sites is therefore
likely to be a consequence of the underestimation of traffic-related emissions in
the inventory data used in the model.
Table 2Correlation coefficients, biases and root mean square errors (RMSE) between
model–measurement [OX] levels for different London sites during summer and winter
months
Summer Winter
Bias RMSE Pearson Bias RMSE Pearson
Site (ppb) (ppb) correlation (ppb) (ppb) correlation
Marylebone 35.8 40.3 0.41 28.6 34.9 0.05
Road
Westminster 4.2 7.9 0.78 12.0 15.7 0.07
Harlington 1.9 6.7 0.81 7.0 10.9 0.27
Eltham 4.2 7.5 0.78 1.2 5.3 0.52
Bloomsbury 7.1 9.7 0.77 10.9 13.3 0.37
This journal is © The Royal Society of Chemistry 2020 Faraday Discuss.View Article Online
Faraday Discussions Paper
WRF-Chem-CRI is able to reproduce the diurnal variations of background [OX]
at London sites, with good agreement between mixing ratios in the modelled and
measured data (biases/RMSE < 10 ppb and correlation coefficient > 0.5) (Fig. 9 and
Table 3). In general, the [OX]B is underestimated by the model, which is likely due
to the under-prediction of the diesel related VOCs used in the model.72 Further-
This article is licensed under a Creative Commons Attribution 3.0 Unported Licence.
more, the VOCs used in the model were not constrained using the AURN dataset
which can partly contribute the imbalances between model–measurement.
However, there are times when peak [OX]B is overestimated by the model (e.g.
summer time in Westminster, Bloomsbury and Eltham), which could be due to
Open Access Article. Published on 15 2020. Downloaded on 13/01/2021 5:28:37 .
the regional photochemical events occurring below the resolution of the model.
Westminster and Bloomsbury are urban background sites, but they are very close
(within 2 km) to the traffic sites (e.g. Marylebone Road) and Eltham is a suburban
site in London, which is also not far from the Marylebone Road (14 km). These
sites lay on a large concentration gradient, thus the WRF-Chem model with 15 km
15 km resolution was unable to distinguish between points beyond the areas.
This can also explain the large model–measurement [OX]B deviation for the
Marylebone Road site compared with the other London sites.
The model–measurement comparison plots (Fig. 10) for different months
(January, May and September) show that the model matched the changes in [OX]
levels with measurement very well for the Bangkok roadside site Thonburi with
Fig. 9 The model–measurement comparison of background [OX] levels in London sites
for the period of (a) 30 July to 24 August 2012 and (b) 8 January to 11 February 2012 (right
side figure). The red, blue, black, yellow, green lines represent Marylebone Road,
Bloomsbury, Eltham, Westminster and Harlington, respectively. The solid lines are
measurement data and broken lines are modelled data.
Table 3Correlation coefficients, biases and root mean square errors (RMSE) between
model–measurement [OX]B levels for different London sites during summer and winter
months
Summer Winter
Bias RMSE Pearson Bias RMSE Pearson
Site (ppb) (ppb) correlation (ppb) (ppb) correlation
Marylebone 9.9 12.3 0.83 7.2 7.8 0.66
Road
Westminster 1.7 3.8 0.72 3.9 4.2 0.68
Harlington 4.2 6.6 0.68 2.2 2.5 0.69
Eltham 6.4 7.5 0.83 1.1 1.7 0.81
Bloomsbury 0.8 2.5 0.88 2.9 3.1 0.90
Faraday Discuss. This journal is © The Royal Society of Chemistry 2020View Article Online
Paper Faraday Discussions
observed peaks and troughs at nearly similar times (correlation coefficients, r >
0.5). However, there is a large overprediction of model [OX] values with biases and
RMSEs of 10 and 15 ppb for January, 17 and 27 ppb for May, and 21 and
26 ppb for September (Fig. 10 and Table 4) which is most likely arising from
inaccurate NOx emissions (traffic, industrial) in the inventory data. Models are
This article is licensed under a Creative Commons Attribution 3.0 Unported Licence.
used to predict and forecast the effects of changes in emissions. They therefore
require accurate emission inventory data and complete representations of phys-
ical and chemical atmospheric processes in order to do this as well as possible.
There have been noted issues with emissions inventories (RETRO, INTEX-B,
Open Access Article. Published on 15 2020. Downloaded on 13/01/2021 5:28:37 .
MACCity, SEAC4RS) most recently which cause an over-prediction of O3 mixing
ratios in Thailand for March and December.73 The spatial distribution of the
regional emissions, with hot spots seen in Bangkok, implemented in EDGAR is
based on population, which does not reect the real emission scenarios of
Thailand. Although Bangkok has a large population, the stationary sources of
emissions are likely to be overestimated in the EDGAR emission inventory. To
improve the model–measurement deviation, the development of an alternative
regional emission inventory based on emission control technology for stationary
and mobile sources is necessary.
Fig. 10 The model–measurement comparison of [OX] levels in the Bangkok roadside site
Thonburi for January, May, and September 2017. The red and blue lines represent
measurement and modelled data, respectively.
Table 4 Correlation coefficients, biases and root mean square errors (RMSE) between
model–measurement [OX] levels for the Bangkok roadside site Thonburi during January,
May and September 2017
Jan May Sep
Bias RMSE Pear. Bias RMSE Pear. Bias RMSE Pear.
(ppb) (ppb) corr. (ppb) (ppb) corr. (ppb) (ppb) corr.
9.4 15.3 0.86 16.8 27.4 0.55 21.4 25.8 0.79
This journal is © The Royal Society of Chemistry 2020 Faraday Discuss.View Article Online
Faraday Discussions Paper
Conclusions
The background and local oxidant contributions at London and Bangkok road-
side sites to the total oxidant levels are investigated and found to be 32 ppb [OX]B
and 0.21[NOx] ppb [OX]L at Marylebone Road, 32 ppb [OX]B and 0.12[NOx] ppb
This article is licensed under a Creative Commons Attribution 3.0 Unported Licence.
[OX]L at Din Daeng, 29 ppb [OX]B and 0.26[NOx] ppb [OX]L at Thonburi and 31 ppb
[OX]B and 0.18[NOx] ppb [OX]L at Chokchai. The seasonal variation of [OX]B shows
a maximum in spring season for London and dry season for Bangkok. The diurnal
variation of both [OX]L and [OX]B for both London and Bangkok shows a peak
Open Access Article. Published on 15 2020. Downloaded on 13/01/2021 5:28:37 .
during the aernoon. Decreasing trends of [OX]L levels at London and Bangkok
roadside sites are found for the period of 2001–2019 and 2005–2015, respectively.
There is also a decreasing trend of [OX]B levels at Marylebone Road and Chokchai
with no signicant changes at Din Daeng and Thonburi. Overall, the adopted
emission controls in both the U.K. and Thailand have been successful in the
decrease of [OX]B and [OX]L levels. The [OX]L at the London roadside site is higher
than that at the Bangkok roadside sites. However, a large number of policy
initiatives have been taken following the London Mayor’s Air Quality Strategy.
This includes the roll out of zero-emission buses, implementing the Ultra Low
Emission Zone legislation and including the Congestion Charge Zone across
London to improve the oxidant levels in central London. To assess the London
Mayor’s policy, this type of analysis must be carried out periodically for checking
the [OX] levels, which will be benecial in terms of improved quality of life, for
both people and ecosystems. The model, WRF-Chem-CRI was able to reproduce
the temporal trends and mixing ratios of [OX]B in London well, highlighting its
capability as a regional air quality model which could be a useful tool for pre-
dicting long-term changes in [OX]B by accounting for changes in the emissions.
Periodic overestimations of model [OX] mixing ratios in the Bangkok roadside site
suggest errors in the EDGAR emission inventory, which is based on population
rather than emission control technology. Further analysis with scaling of the
emission inventory would be required to determine the extent of this over-
estimation, and if there are other factors driving this observation.
Conflicts of interest
There are no conicts to declare.
Acknowledgements
We thank the Department for Environment, Food and Rural Affairs (Defra) for
supporting UK monitoring network data and Pollution Control Department (PCD)
for providing Bangkok air pollution data. This work is the collaboration between
UK and Thai scientists facilitated by funding from the GCRF Global Impact
Accelerator Account 2018 (Grant code-EP/S515899/1). DES, JCM, PN, RH, and
MAHK also thank Newton NERC Fund (grant code-NE/P014674/1), Thailand
Research Fund (grant code-RDG6030008), Bristol ChemLabS and the Primary
Science Teaching Trust under whose auspices various aspects of this work were
supported. AF thanks EPSRC for her PhD studentship. CJP’s work was carried out
at Jet Propulsion Laboratory, California Institute of Technology, under contract
with the National Aeronautics and Space Administration (NASA), and was
Faraday Discuss. This journal is © The Royal Society of Chemistry 2020View Article Online
Paper Faraday Discussions
supported by the Upper Atmosphere Research and Tropospheric Chemistry
Programs. © 2020 all rights reserved.
References
This article is licensed under a Creative Commons Attribution 3.0 Unported Licence.
1 WHO, Ambient Air Pollution. A Global Assessment of Exposure and Burden of
Disease, World Health Organisation, Geneva, Switzerland, 2016.
2 P. A. Leighton, Photochemistry of Air Pollution, Academic Press, New York, 1961.
3 J. H. Seinfeld and S. N. Pandis, in Atmospheric Chemistry and Physics: From Air
Open Access Article. Published on 15 2020. Downloaded on 13/01/2021 5:28:37 .
Pollution to Climate Change, John Wiley & Sons, New Jersey, United States, 2nd
edn, 2006.
4 D. Kley, H. Geiss and V. A. Mohnen, Atmos. Environ., 1994, 28, 149–158.
5 L. J. Clapp and M. E. Jenkin, Atmos. Environ., 2001, 35, 6391–6405.
6 M. E. Jenkin, Atmos. Environ., 2004, 38, 5117–5129.
7 M. E. Jenkin, Atmos. Environ., 2004, 38, 5131–5138.
8 A. Notario, I. Bravo, J. A. Adame, Y. Dı́az-de-Mera, A. Aranda, A. Rodrı́guez and
D. Rodrı́guez, Atmos. Res., 2012, 104–105, 217–226.
9 N. Mazzeo, L. Venegas and H. Choren, Atmos. Environ., 2005, 39, 3055–3068.
10 S. Beirle, K. F. Boersma, U. Platt, M. G. Lawrence and T. Wagner, Science, 2011,
333, 1737–1739.
11 J. Cyrys, M. Eeens, J. Heinrich, C. Ampe, A. Armengaud, R. Beelen,
T. Bellander, T. Beregszaszi, M. Birk, G. Cesaroni, M. Cirach, K. de Hoogh,
A. De Nazelle, F. de Vocht, C. Declercq, A. Dedele, K. Dimakopoulou,
K. Eriksen, C. Galassir, R. Grauleviciene, G. Grivas, O. Gruzieva,
A. H. Gustafsson, B. Hoffmann, M. Iakovides, A. Ineichen, U. Kramer,
T. Lanki, P. Lozano, C. Madsen, K. Meliefste, L. Modig, A. Moelter,
G. Mosler, M. Nieuwenhuijsen, M. Nonnemacher, M. Oldenwening,
A. Peters, S. Pontet, N. Probst-Hensch, U. Quass, O. Raaschou-Nielsen,
A. Ranzi, D. Sugiri, E. G. Stephanou, P. Taimisto, M. Y. Tsai, E. Vaskovi,
S. Villani, M. Wang, B. Brunekreef and G. Hoek, Atmos. Environ., 2012, 62,
374–390.
12 T. Wang, P.-C. Wang, F. Hendrick, H. Yu and M. Van Roozendael, Atmos.
Oceanic Sci. Lett., 2015, 8, 392–396.
13 L. Jaeglé, L. Steinberger, R. V. Martin and K. Chance, Faraday Discuss., 2005,
130, 407–423.
14 R. J. van der A, H. J. Eskes, K. F. Boersma, T. P. C. van Noije, M. Van
Roozendael, I. De Smedt, D. H. M. U. Peters and E. W. Meijer, J. Geophys.
Res., 2008, 113, D04302.
15 F. Liu, S. Beirle, Q. Zhang, R. J. van der A, B. Zheng, D. Tong and K. He, Atmos.
Chem. Phys., 2017, 17, 9261–9275.
16 M. L. Williams, R. W. Atkinson, H. R. Anderson and F. J. Kelly, Air Qual., Atmos.
Health, 2014, 7, 407–414.
17 C. Yang, H. Li, R. Chen, W. Xu, C. Wang, L. A. Tse, Z. Zhao and H. Kan, Environ.
Res. Lett., 2016, 11, 074014.
18 S. Weichenthal, L. L. Pinault and R. T. Burnett, Sci. Rep., 2017, 7, 16401.
19 United Nations, The World’s cities in 2018, Data Booklet, New York, United
States, 2018.
20 R. Brook and K. King, Updated analysis of air pollution exposure in London,
Report to Greater London Authority, Aether, 2017, https://www.london.gov.uk/
This journal is © The Royal Society of Chemistry 2020 Faraday Discuss.View Article Online
Faraday Discussions Paper
sites/default/les/aether_updated_london_air_pollution_exposure_nal_20-
2-17.pdf, accessed June 2020.
21 City of London Air Quality Strategy, Delivering healthy air in the City of London,
The Air Quality Team, London, UK, 2019–2024.
22 UNECE, The 1999 Gothenburg Protocol to Abate Acidication, Eutrophication and
This article is licensed under a Creative Commons Attribution 3.0 Unported Licence.
Ground-Level Ozone, https://www.unece.org/env/lrtap/multi_h1.htm, accessed
June 2020.
23 B. Richmond, A. Misra, M. Broomeld, P. Brown, E. Karagianni, T. Murrells,
Y. Pang, N. Passant, B. Pearson, R. Stewart, G. Thistlethwaite, D. Wakeling,
Open Access Article. Published on 15 2020. Downloaded on 13/01/2021 5:28:37 .
C. Walker, J. Wiltshire, M. Hobson, M. Gibbs, T. Misselbrook, U. Dragosits
and S. Tomlinson, UK informative inventory report (1990 to 2017), Ricardo
Energy & Environment, Defra, https://uk-air.defra.gov.uk/assets/documents/
reports/cat09/1904121008_GB_IIR_2019_v2.0.pdf, accessed June 2020.
24 P. Watcharavitoon, C.-P. Chio and C.-C. Chan, Aerosol Air Qual. Res., 2013, 13,
1741–1754.
25 P. Uttamang, V. P. Aneja and A. F. Hanna, Atmos. Chem. Phys., 2018, 18, 12581–
12593.
26 M. G. Lawrence, T. M. Butler, J. Steinkamp, B. R. Gurjar and J. Lelieveld, Atmos.
Chem. Phys., 2007, 7, 3969–3987.
27 N. Castell-Balaguer, L. Téllez and E. Mantilla, Environ. Sci. Pollut. Res., 2012,
19, 3461–3480.
28 M. A. H. Khan, J. Clements, D. Lowe, G. McFiggans, C. J. Percival and
D. E. Shallcross, Atmos. Res., 2019, 229, 145–156.
29 A. Charron and R. M. Harrison, Environ. Sci. Technol., 2005, 39, 7768–7776.
30 AQEG, Nitrogen dioxide in the United Kingdom. Report of the UK Air Quality
Expert Group (AQEG), Prepared for the Department for Environment, Food
and Rural Affairs, the Scottish Executive, the Welsh Assembly and the
Department of the Environment in Northern Ireland, Defra Publications,
London, 2004.
31 E. J. Dunlea, S. C. Herndon, D. D. Nelson, R. M. Volkamer, F. San Martini,
P. M. Sheehy, M. S. Zahniser, J. H. Shorter, J. C. Wormhoudt, B. K. Lamb,
E. J. Allwine, J. S. Gaffney, N. A. Marley, M. Grutter, C. Marquez, S. Blanco,
B. Cardenas, A. Retama, C. R. Ramos Villegas, C. E. Kolb, L. T. Molina and
M. J. Molina, Atmos. Chem. Phys., 2007, 7, 2691–2704.
32 A. M. Winer, J. W. Peters, J. P. Smith and J. N. Pitts, Environ. Sci. Technol., 1974,
8, 1118–1121.
33 AEA, QA/QC procedures for the UK automatic urban and rural air quality
monitoring network (AURN), Report to Defra and the Developed Administrations,
(AEAT/ENV/R/2837), 2009.
34 G. A. Grell, S. E. Peckkam, R. Schmitz, S. A. McKeen, G. Frost, W. C. Skamarock
and B. Eder, Atmos. Environ., 2005, 39, 6957–6975.
35 S. Archer-Nicholls, D. Lowe, S. Utembe, J. Allan, R. A. Zaveri, J. D. Fast,
Ø. Hodnebrog, H. D. van der Gon and G. McFiggans, Geosci. Model Dev.,
2014, 7, 2557–2579.
36 D. P. Dee, S. M. Uppala, A. J. Simmons, P. Berrisford, P. Poli, S. Kobayashi,
U. Andrae, M. A. Balmaseda, G. Balsamo, P. Bauer, P. Bechtold,
A. C. M. Beljaars, L. van de Berg, J. Bidlot, N. Bormann, C. Delsol,
R. Dragani, M. Fuentes, A. J. Geer, L. Haimberger, S. B. Healy, H. Hersbach,
E. V. Holm, L. Isaksen, P. Kallberg, M. Kohler, M. Matricardi, A. P. McNally,
Faraday Discuss. This journal is © The Royal Society of Chemistry 2020View Article Online
Paper Faraday Discussions
B. M. Monge-Sanz, J.-J. Morcrette, B.-K. Park, C. Peubey, P. de Rosnay,
C. Tavolato, J.-N. Thepaut and F. Vitart, Q. J. R. Meteorol. Soc., 2011, 137,
553–597.
37 L. K. Emmons, S. Walters, P. G. Hess, J.-F. Lamarque, G. G. Pster, D. Fillmore,
C. Granier, A. Guenther, D. Kinnison, T. Laepple, J. Orlando, X. Tie, G. Tyndall,
This article is licensed under a Creative Commons Attribution 3.0 Unported Licence.
C. Wiedinmyer, S. L. Baughcum and S. Kloster, Geosci. Model Dev., 2010, 3, 43–
67.
38 A. Guenther, T. Karl, P. Harley, C. Wiedinmyer, P. I. Palmer and C. Geron,
Atmos. Chem. Phys., 2006, 6, 3181–3210.
Open Access Article. Published on 15 2020. Downloaded on 13/01/2021 5:28:37 .
39 J. J. P. Kuenen, A. J. H. Visschedijk, M. Jozwicka and H. A. C. Denier van der
Gon, Atmos. Chem. Phys., 2014, 14, 10963–10976.
40 D. Simpson, A. Benedictow, H. Berge, R. Bergström, L. D. Emberson,
H. Fagerli, C. R. Flechard, G. D. Hayman, M. Gauss, J. E. Jonson,
M. E. Jenkin, A. Nyı́ri, C. Richter, V. S. Semeena, S. Tsyro, J.-P. Tuovinen,
Á. Valdebenito and P. Wind, Atmos. Chem. Phys., 2012, 12, 7825–7865.
41 M. Crippa, D. Guizzardi, M. Muntean, E. Schaaf, F. Dentener, J. A. van
Aardenne, S. Monni, U. Doering, J. G. J. Olivier, V. Pagliari and G. Janssens-
Maenhout, Earth Syst. Sci. Data, 2018, 10, 1987–2013.
42 G. Huang, R. Brook, M. Crippa, G. Janssens-Maenhout, C. Schieberle, C. Dore,
D. Guizzardi, M. Muntean, E. Schaaf and R. Friedrich, Atmos. Chem. Phys.,
2017, 17, 7683–7701.
43 Y. Chen, O. Wild, E. Ryan, S. K. Sahu, D. Lowe, S. Archer-Nicholls, Y. Wang,
G. McFiggans, T. Ansari, V. Singh, R. S. Sokhi, A. Archibald and G. Beig,
Atmos. Chem. Phys., 2020, 20, 499–514.
44 D. Lowe, WRF-Chem emission tool, The University of Manchester, http://
github.com/douglowe/WRF_UoM_EMIT/releases/tag/v1.1, accessed June
2020.
45 S. Tiwari, A. Dahiya and N. Kumar, Atmos. Res., 2015, 157, 119–126.
46 I. Nikolova, A. R. MacKenzie, X. Cai, M. S. Alam and R. M. Harrison, Faraday
Discuss., 2016, 189, 529–546.
47 P. Takkanon and P. Chantarangul, Arch. Sci. Rev., 2019, 62, 35–46.
48 T. A. M. Pugh, A. R. Mackenzie, D. Whyatt and C. N. Hewitt, Environ. Sci.
Technol., 2012, 46, 7692–7699.
49 D. Carslaw and G. Rhys-Tyler, Atmos. Environ., 2013, 81, 339–347.
50 J. B. Heywood, in Internal Combustion Engine Fundamentals, Tata McGraw-Hill,
USA, 1988.
51 AQEG, Trends in primary nitrogen dioxide in the UK, Report of the UK Air Quality
Expert Group, AQEG, Prepared for the Department for Environment, Food and
Rural Affairs, the Scottish Executive, the Welsh Assembly and the Department
of the Environment in Northern Ireland, Defra Publications, London, 2007.
52 R. B. Ellison, S. P. Greaves and D. A. Hensher, Transp. Res. D, 2013, 23, 25–33.
53 D. C. Carslaw, T. P. Murrells, J. Andersson and M. Keenan, Faraday Discuss.,
2016, 189, 439–454.
54 A. Font and G. W. Fuller, Environ. Pollut., 2016, 218, 463–474.
55 A. Font, L. Guiseppin, M. Blangiardo and V. Ghersi, Environ. Pollut., 2019, 249,
1–12.
56 M. E. Jenkin, Atmos. Environ., 2008, 42, 5434–5445.
57 R. G. Derwent, A. J. Manning, P. G. Simmonds, T. G. Spain and S. O’Doherty,
Atmos. Environ., 2018, 179, 279–287.
This journal is © The Royal Society of Chemistry 2020 Faraday Discuss.You can also read