HeatWatch Queensland Extreme heat in the Sunshine State - Increasing extreme heat will have profound impacts - The Australia Institute
←
→
Page content transcription
If your browser does not render page correctly, please read the page content below
HeatWatch Queensland
Extreme heat in the Sunshine State

  Increasing extreme heat will have profound impacts
        on people, industries and ecosystems in
                     Queensland.

Discussion paper

Mark Ogge
Bill Browne
Travis Hughes

June 2019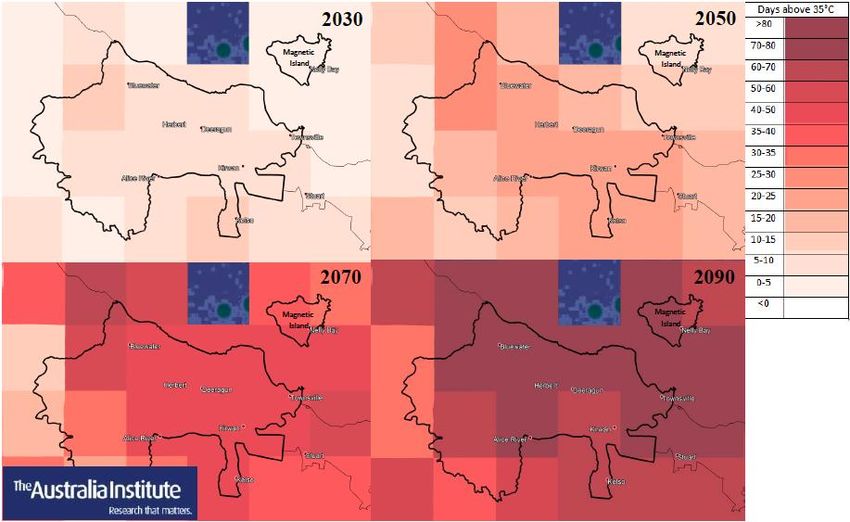
ABOUT THE AUSTRALIA INSTITUTE
The Australia Institute is an independent public policy think tank based in Canberra. It
is funded by donations from philanthropic trusts and individuals and commissioned
research. We barrack for ideas, not political parties or candidates. Since its launch in
1994, the Institute has carried out highly influential research on a broad range of
economic, social and environmental issues.

OUR PHILOSOPHY
As we begin the 21st century, new dilemmas confront our society and our planet.
Unprecedented levels of consumption co-exist with extreme poverty. Through new
technology we are more connected than we have ever been, yet civic engagement is
declining. Environmental neglect continues despite heightened ecological awareness.
A better balance is urgently needed.

The Australia Institute’s directors, staff and supporters represent a broad range of
views and priorities. What unites us is a belief that through a combination of research
and creativity we can promote new solutions and ways of thinking.

OUR PURPOSE – ‘RESEARCH THAT MATTERS’
The Institute publishes research that contributes to a more just, sustainable and
peaceful society. Our goal is to gather, interpret and communicate evidence in order to
both diagnose the problems we face and propose new solutions to tackle them.

The Institute is wholly independent and not affiliated with any other organisation.
Donations to its Research Fund are tax deductible for the donor. Anyone wishing to
donate can do so via the website at https://www.tai.org.au or by calling the Institute
on 02 6130 0530. Our secure and user-friendly website allows donors to make either
one-off or regular monthly donations and we encourage everyone who can to donate
in this way as it assists our research in the most significant manner.

Level 1, Endeavour House, 1 Franklin St
Canberra, ACT 2601
Tel: (02) 61300530
Email: mail@tai.org.au
Website: www.tai.org.au
ISSN: 1836-9014
Summary
The projected rise in extremely hot days as a result of global warming presents a
serious risk to the health and wellbeing of the Queensland community.

There has already been a clear increase in numbers of these extreme heat days over
recent decades, as demonstrated in our profiles on:

     •   The Gold Coast;
     •   Brisbane;
     •   The Sunshine Coast;
     •   Roma;
     •   Gladstone;
     •   Rockhampton;
     •   Mackay;
     •   The Whitsundays; and
     •   Townsville.1

Exposure to extreme heat can lead to serious illness and death. At temperatures above
35 degrees, the human body’s ability to cool itself reduces, which can lead to a
cascading series of Heat Related Illnesses (HRI) and ultimately heatstroke that can
cause organ failure and death. Heatwaves have caused more deaths in Australia since
1890 than cyclones, bushfires, floods, earthquakes and severe storms combined.2

In parts of Queensland, the extreme heat risk is exacerbated by high humidity.
Combined with 70% humidity, conditions over 35 degrees are considered “dangerous”
by government agencies such as the US Government National Oceanic and
Atmospheric Administration. Temperatures of 35 degrees combined with 80%
humidity are considered “extremely dangerous”.

The workforce in Queensland is also particularly vulnerable to increasing extreme heat
with significant shares of workers employed in industries that frequently require heavy
outdoor labour including mining, construction and agriculture.

1
  Full reports for Gladstone, the Gold Coast, Mackay, Rockhampton, Roma, the Sunshine Coast,
  Townsville and the Whitsundays are available on our HeatWatch page:
  http://www.tai.org.au/heatwatch
2
  McMichael et al. (2003) Climate change and human health, risks and responses, p 53,
  https://www.who.int/globalchange/publications/climchange.pdf

    HeatWatch Queensland                                                                       1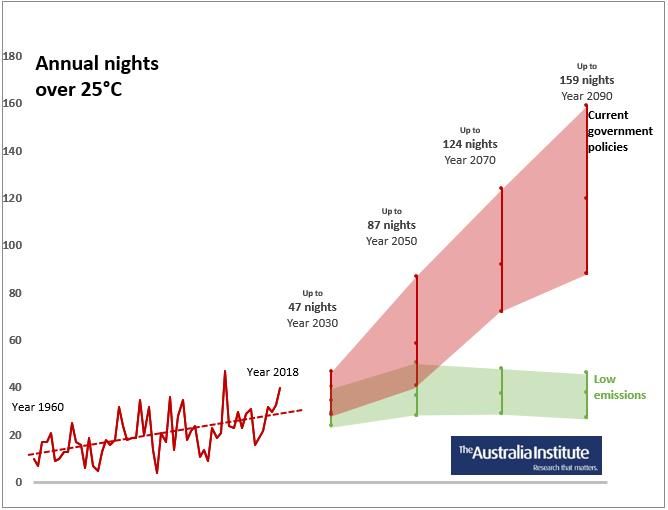
Cool night-time temperatures are essential for good health and to allow people to
recover from hot days. 25 degrees is considered a threshold for hot nights. The
number of nights over 25 degrees in parts of Queensland have increased significantly
and could increase further, in some cases leaving essentially all of summer with
extreme heat nights.

Extreme heat events present a risk to critical infrastructure including road, rail and
electricity generation and have a major impact on productivity and economic activity.

None of this is inevitable. CSIRO modelling shows that if emissions are reduced
decisively in line with the globally agreed target of 1.5 degrees above pre-industrial
levels, the number of days per year over 35 degrees could peak in most locations by
2070 before reducing by 2090, ensuring relatively safe temperatures for our children
and grandchildren.

   HeatWatch Queensland                                                                  2
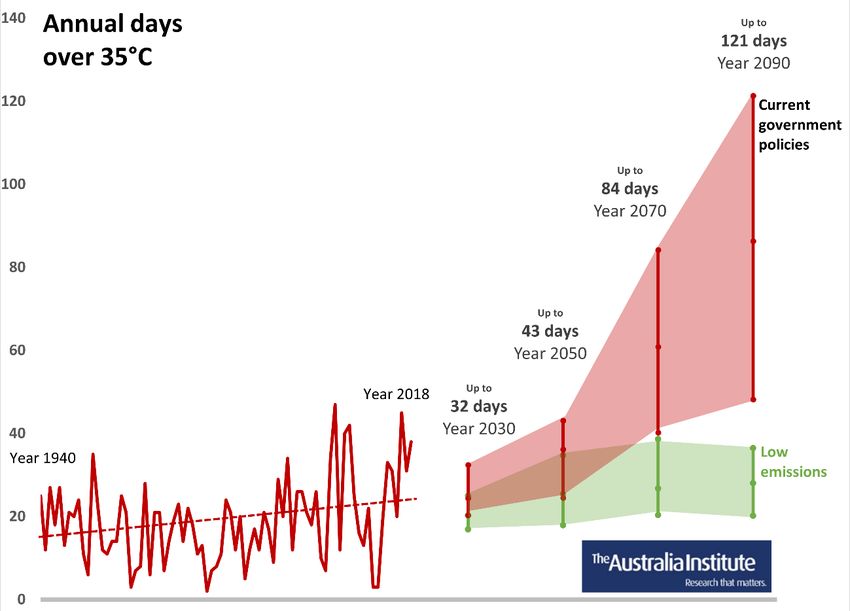
Table of Contents
Summary ........................................................................................................................... 1
Introduction ...................................................................................................................... 5
   Extreme heat ................................................................................................................ 6
   Data............................................................................................................................... 7
The Gold Coast.................................................................................................................. 9
Brisbane .......................................................................................................................... 10
The Sunshine Coast......................................................................................................... 11
Roma ............................................................................................................................... 12
Gladstone........................................................................................................................ 13
Rockhampton.................................................................................................................. 14
Mackay............................................................................................................................ 15
The Whitsundays ............................................................................................................ 17
Townsville ....................................................................................................................... 19
Electorates ...................................................................................................................... 21
   Capricornia.................................................................................................................. 22
       Key findings............................................................................................................. 22
   Dawson ....................................................................................................................... 23
       Key findings............................................................................................................. 23
   Herbert ....................................................................................................................... 24
       Key findings............................................................................................................. 24
Urban Heat Island effect in Queensland ........................................................................ 25
Projected increases in nights over 25 degrees ............................................................... 26
   Mackay........................................................................................................................ 27
   Townsville ................................................................................................................... 28
Days over 40 degrees ..................................................................................................... 29
Health and productivity impacts of extreme heat ......................................................... 30
Heat stress and the Queensland workforce ................................................................... 32
Mining workers ............................................................................................................... 34
Tourism ........................................................................................................................... 35

     HeatWatch Queensland                                                                                                             3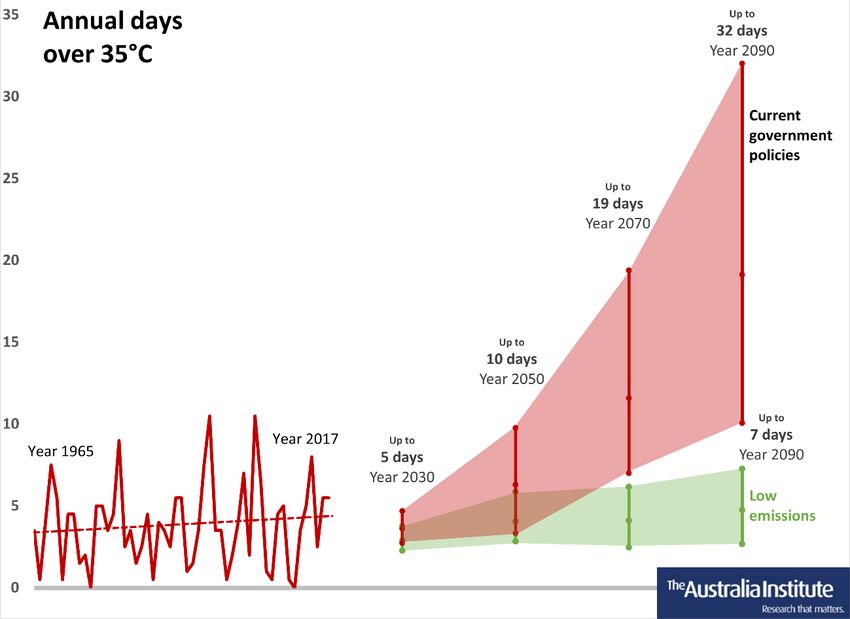
Agriculture ...................................................................................................................... 36
Infrastructure and industry ............................................................................................ 37
Natural disasters ............................................................................................................. 38
Conclusion ...................................................................................................................... 40

     HeatWatch Queensland                                                                                                          4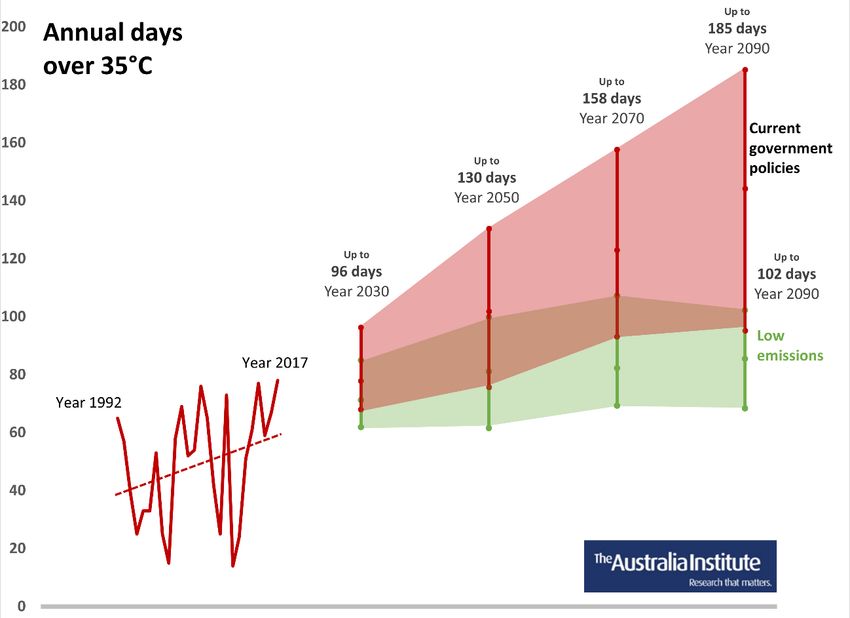
Introduction
The intense heatwave in November 2018 triggered a bushfire crisis throughout
Queensland, putting hundreds of homes at risk.3 Australia also just experienced its
hottest summer on record in 2018-19, and the first season in which temperatures have
exceeded two degrees above the long-term averages.4

Extreme heat is already dangerous for human health, ecosystems, infrastructure and
agriculture and it will worsen with climate change.

Global temperature increases of 1.5 or 2 degrees above pre-industrial levels will have
dramatic impacts on human health, the ecosystem and the economy. Human-induced
warming reached 1 degree above pre-industrial levels in 2017.5 Current policy settings
would see more extreme warming than 2 degrees above pre-industrial levels.

The Australia Institute’s Heatwatch initiative puts current Australian research about
temperature increases due to global warming into context, using data from BoM and
the CSIRO.

HeatWatch uses extreme heat days (days over 35 degrees) along with other thresholds
like 40 degrees to highlight the effects of global warming. This includes a dramatic
increase in days where it is uncomfortable or dangerous to operate outside – affecting
industries like construction, sport and other outdoor activities.

The special HeatWatch Queensland Report looks at the likely projections and impacts
for key locations in the state and was prepared for the inaugural Queensland Climate
Week. This report aggregates key findings from eight Queensland HeatWatch reports:
Gladstone, the Gold Coast, Mackay, Rockhampton, Roma, the Sunshine Coast,
Townsville and the Whitsundays. New analysis for Brisbane is also included in this
report. Three of the Queensland reports were presented alongside Queensland Fire
and Emergency Services workshops on extreme heat. The report also draws on
HeatWatch reports for the federal electorates of Capricornia, Dawson and Herbert.

3
  Daily Mercury (December 2018) STAY INFORMED: Fires still active in Mackay Region,
  https://www.dailymercury.com.au/news/stay-informed-fires-still-active-in-mackay-region/3591424/
4
  Sydney Morning Herald (2019) ‘It’s been extreme’: Australia’s summer smashes seasonal heat records,
  https://www.smh.com.au/environment/weather/it-s-been-extreme-australia-s-summer-smashes-
  seasonal-heat-records-20190227-p510od.html
5
  IPCC (2018) Global Warming of 1.5 °C, p 1:4, https://www.ipcc.ch/report/sr15/

    HeatWatch Queensland                                                                            5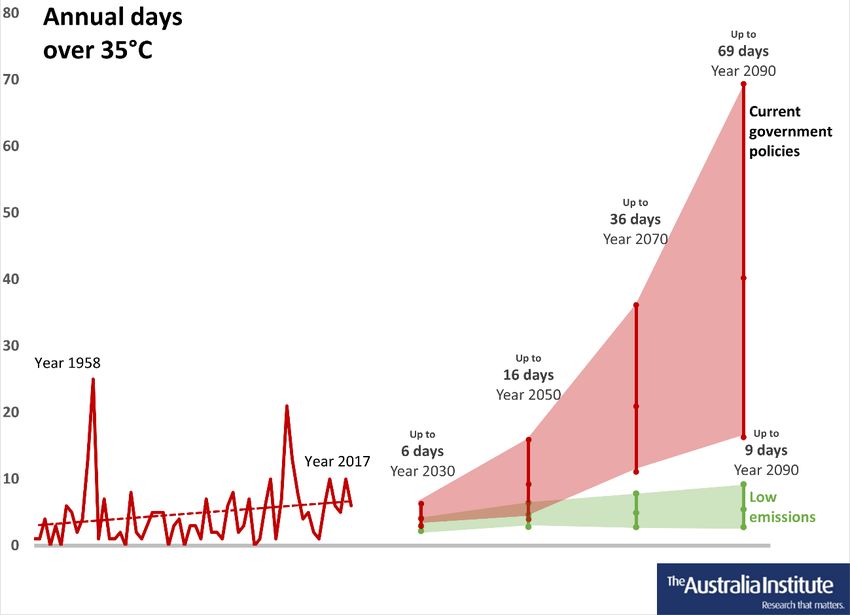
The Australia Institute will continue to focus on additional locations and welcomes
interest in collaborating on local versions of the reports.

All HeatWatch reports are available on our website: http://www.tai.org.au/heatwatch

EXTREME HEAT
Extreme heat is dangerous for human health, ecosystems, infrastructure and
agriculture. At temperatures above 35 degrees, the human body’s main cooling
mechanism – sweating – is far less effective. Sweating exchanges heat from the body
to the atmosphere, but this heat exchange process diminishes significantly beyond 35
degrees, so body temperature rises. This creates discomfort and a range of health
impacts, from mild to severe, and can ultimately be fatal without intervention.6

Because of this, many regulators and researchers use 35 degrees as an important
threshold for safety, work and climatic conditions. 35 degrees is seen as the “limit of
high temperature tolerance” by the Occupational Health and Safety Representatives of
the Victorian Trades Hall Council and many academic researchers note it as the point
where substantial productivity is lost. The CSIRO and Bureau of Meteorology (BoM)
publish 35-degree threshold predictions.7

Temperature and humidity are often combined into a heat index figure to provide a
simple indicator of the body’s ability to cool itself. One of the most important indices is
published by the US Government National Oceanic and Atmospheric Administration
(NOAA). As shown in the NOAA heat stress chart in Figure 1 below, temperatures in
the low thirties combined with high humidity are considered “dangerous” to human
health.

NOAA’s heat stress index rises to “Extreme Danger” at temperatures over 35 degrees
combine with 80% humidity.

6
  Hanna and Tait (2015) Limitations to thermoregulation and acclimatisation challenges human
  adaptation to global warming, Int J Environ Res Public Health,
  https://academic.oup.com/heapro/article/30/2/239/561863
7
  Victorian Trades Hall Council (2018) Heat, http://www.ohsrep.org.au/hazards/workplace-
  conditions/heat; Singh et al. (2015) Working in Australia's heat: health promotion concerns for health
  and productivity, Health Promotion International,
  https://academic.oup.com/heapro/article/30/2/239/561863; CSIRO and BoM (2015) Climate change in
  Australia: Projections for Australia’s NRM Regions,
  https://www.climatechangeinaustralia.gov.au/en/publications-library/technical-report/

    HeatWatch Queensland                                                                              6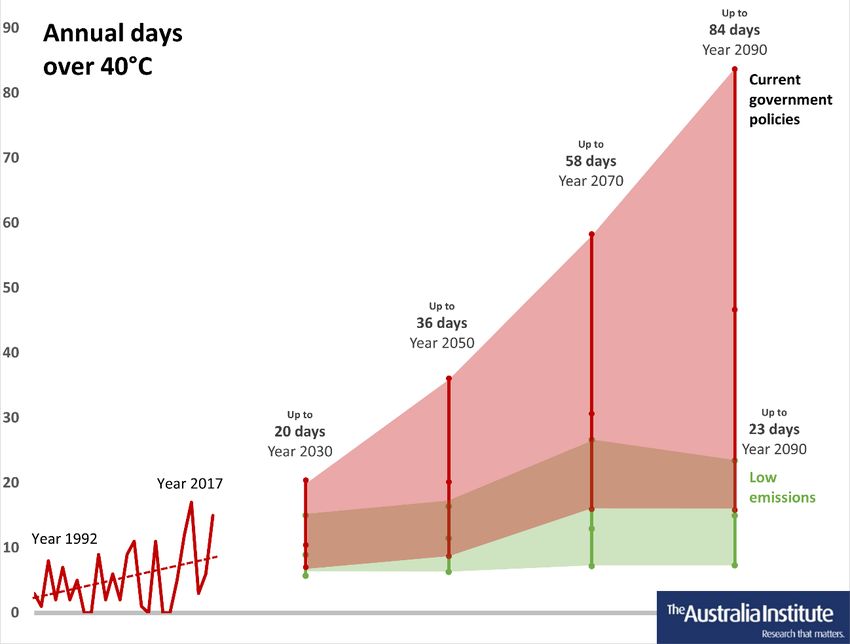
Figure 1: NOAA Heat Stress Index

        Source: National Weather Service (n.d.) Heat safety,
        http://www.nws.noaa.gov/os/heat/heat_index.shtml

A future of such extreme heat days matched with high humidity represents a serious
threat to the wellbeing of people in Queensland and to Australia’s wider population.
As well as an increase in heat-related deaths and illness, the rise in extreme heat
increases irritability and psychological stress.8 Hot weather affects patterns in
domestic violence,9 interrupts sleep patterns and reduces capacity and willingness to
exercise. All carry broad ramifications, such as increased accident risk, sedentary life
style-induced diabetes and cardio vascular disease.10 Tracking and minimising the way
climate change is affecting the number of hot days is of direct interest to the wellbeing
of local communities, particularly in areas of high vulnerability to heatwaves.

DATA
CSIRO and BoM have produced temperature projections under several climate change
scenarios for most of terrestrial Australia. The CSIRO–BoM data is a time series from
the Australian Water Availability Project (AWAP) where the average temperature was
compiled in roughly five kilometre by five kilometre spatial grids between 1981 and
2010.11 This time series uses between five and eight models to predict days over 35

8
  Queensland Health (2015) Heatwave Response Plan
  https://www.health.qld.gov.au/__data/assets/pdf_file/0032/628268/heatwave-response-plan.pdf
9
  Auliciems and Di Bartolo (1995) Domestic violence in a subtropical environment: police calls and
  weather in Brisbane, International Journal of Biometeorology 39 (1).
10
   Kjellstrom et al. (2009) The Direct Impact of Climate Change on Regional Labor Productivity, Archives
  of Environmental & Occupational Health 64 (4); World Health Organisation (2017) Preventing
  noncommunicable diseases (NCDs) by reducing environmental risk factors,
  http://apps.who.int/iris/bitstream/10665/258796/1/WHO-FWC-EPE-17.01-eng.pdf?ua=1
11
   CSIRO and BoM (2015) Climate Change in Australia Information for Australia’s Natural Resource
  Management Regions: Technical Report

    HeatWatch Queensland                                                                                   7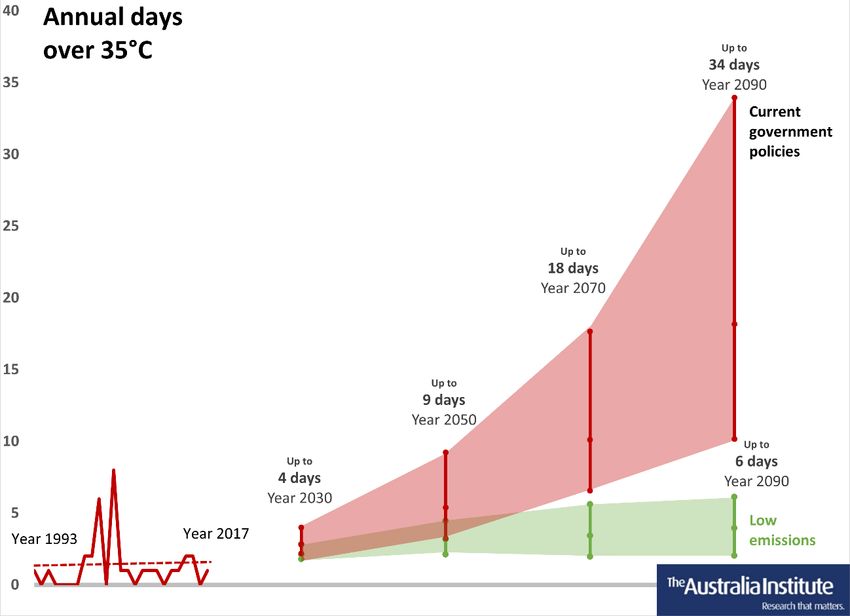
degrees, over 37 degrees and over 40 degrees in 2030, 2050, 2070 and 2090. 12 It also
has a historical average for the years 1981–2010.

The report also employs the IPCC scenarios for global climate action: Representative
Concentration Pathway (RCP) 2.6 (“low emissions”), RCP 4.5 (“intermediate
emissions”) and RCP 8.5 (“high emissions/current government policies”). RCP 2.6
equates roughly to what is required to keep the world below 1.5 degrees warming,
RCP 4.5 to what is required to keep the world below 2 degrees warming, and RCP 8.5
to the “business as usual” scenario where the world fails to act decisively on climate
change. RCP 8.5 is the current trajectory due to the failure of most major polluting
governments to implement necessary climate policies.

Separately, BoM has weather measurement stations providing historical climate data.

12
  All eight models – ACCESS1.0, CESM1-CAM5, CNRM-CM5, GFDL-ESM2M, HadGEM2-CC, CanESM2,
 MIROC5 and NorESM1-M – are available for the RCP 4.5 and RCP 8.5 scenarios. Five models – CESM1-
 CAM5, CNRM-CM5, CanESM2, MIROC5 and NorESM1-M – are available for the RCP 2.6 scenario.

     HeatWatch Queensland                                                                           8
The Gold Coast
The Gold Coast, although known for its consistent warm weather, has seen the
number of extreme temperature days increase in recent years and their frequency is
projected to rise dramatically unless greenhouse gas emissions are reduced.
Under current government policies, in the Gold Coast days over 35 degrees would go
from a historical average of 1 days per year to up to 4 days by 2030, 9 days by 2050, 18
days by 2070 and 34 days by 2090.
The Gold Coast would benefit significantly from climate policies that would keep
warming below 1.5 degrees. Climate policies to keep warming below 1.5 degrees
would keep predicted days over 35 degrees to 3 days or below by 2030, increase to 4
days or below by 2050 and stabilise at 6 days or below by 2090.
Figure 2: Forecast annual number of days over 35 degrees the Gold Coast
Source: BoM (2019) Climate data online, http://www.bom.gov.au/climate/data/index.shtml;
CSIRO and BoM (2018) Climate projections, provided on request
HeatWatch Queensland 9Brisbane
Brisbane has a warm, sunny climate. However, it has relatively few very hot days. This
is at risk of changing if strong climate policies are not adopted.
Under current government policies, in Brisbane days over 35 degrees would go from a
historical average of 2 days per year to up to 6 days by 2030, 14 days by 2050, 25 days
by 2070 and 45 days by 2090.
Brisbane would benefit significantly from climate policies that would keep warming
below 1.5 degrees. Climate policies to keep warming below 1.5 degrees would keep
predicted days over 35 degrees to 4 days or below by 2030, increase to 7 days or
below by 2050 and stabilise at 8 days or below by 2090.
Figure 3: Forecast annual number of days over 35 degrees Brisbane
Source: BoM (2019) Climate data online, http://www.bom.gov.au/climate/data/index.shtml;
CSIRO and BoM (2018) Climate projections, provided on request
HeatWatch Queensland 10The Sunshine Coast
The Sunshine Coast, although known for its consistent warm weather, has seen the
number of extreme temperature days increase slightly in recent years and their
frequency is forecast to rise dramatically unless emissions are reduced.
Under current government policies, in the Sunshine Coast days over 35 degrees would
go from a historical average of 2 days per year to up to 5 days by 2030, 10 days by
2050, 19 days by 2070 and 32 days by 2090.
The Sunshine Coast would benefit significantly from climate policies that would keep
warming below 1.5 degrees. Climate policies to keep warming below 1.5 degrees
would keep predicted days over 35 degrees to 4 days or below by 2030, increase to 6
days or below by 2050 and stabilise at 7 days or below by 2090.
Figure 4: Forecast annual number of days over 35 degrees the Sunshine Coast
Source: BoM (2019) Climate data online, http://www.bom.gov.au/climate/data/index.shtml;
CSIRO and BoM (2018) Climate projections, provided on request
HeatWatch Queensland 11Roma
While Roma is known for its warm weather and hot days, the average number of over
35 days has increased considerably in recent years and is forecast to increase
drastically unless emissions are reduced.
Under current government policies, in Roma days over 35 degrees would go from a
historical average of 53 days per year to up to 96 days by 2030, 130 days by 2050, 158
days by 2070 and 185 days by 2090.
Roma would benefit significantly from climate policies that would keep warming below
1.5 degrees. Climate policies to keep warming below 1.5 degrees would keep predicted
days over 35 degrees to 85 days or below by 2030, increase to 100 days or below by
2050 and stabilise at 102 days or below by 2090.
Figure 5: Forecast annual number of days over 35 degrees Roma
Source: BoM (2019) Climate data online, http://www.bom.gov.au/climate/data/index.shtml;
CSIRO and BoM (2018) Climate projections, provided on request
HeatWatch Queensland 12Gladstone
While Gladstone’s summer weather is consistently warm, the number of extremely hot
days – days over 35 degrees Celsius – has generally been low. The average number of
over 35 degree days has, however, more than doubled in recent years and is forecast
to increase without a strong policy response to climate change.
Under current government policies, in Gladstone days over 35 degrees would go from
a historical average of 2 days per year to up to 6 days by 2030, 16 days by 2050, 36
days by 2070 and 69 days by 2090.
Gladstone would benefit significantly from climate policies that would keep warming
below 1.5 degrees. Climate policies to keep warming below 1.5 degrees would keep
predicted days over 35 degrees to 4 days or below by 2030, increase to 6 days or
below by 2050 and stabilise at 9 days or below by 2090.
Figure 6: Forecast annual number of days over 35 degrees Gladstone
Source: BoM (2019) Climate data online, http://www.bom.gov.au/climate/data/index.shtml;
CSIRO and BoM (2018) Climate projections, provided on request
HeatWatch Queensland 13Rockhampton
While Rockhampton is known for the consistency of its warm summer weather, the
number of extremely hot days has been relatively low. The average number of over 35
degree days has, however, increased considerably in recent years and is forecast to
increase drastically without a strong action on climate change.
Under current government policies, in Rockhampton days over 35 degrees would go
from a historical average of 14 days per year to up to 32 days by 2030, 43 days by
2050, 84 days by 2070 and 121 days by 2090.
Rockhampton would benefit significantly from climate policies that would keep
warming below 1.5 degrees. Climate policies to keep warming below 1.5 degrees
would keep predicted days over 35 degrees to 25 days or below by 2030, increase to
35 days or below by 2050 and stabilise at 37 days or below by 2090.
Figure 7: Forecast annual number of days over 35 degrees Rockhampton
Source: BoM (2019) Climate data online, http://www.bom.gov.au/climate/data/index.shtml;
CSIRO and BoM (2018) Climate projections, provided on request
HeatWatch Queensland 14Mackay
Mackay has historically enjoyed a relatively pleasant coastal climate. However, this is
at risk as the climate warms and the number of extreme heat events increases.
Prior to last November the temperature in Mackay had not exceeded 40 degrees since
records began in 1960.
However last November Mackay experienced its most extended heatwave on record
and its highest recorded temperature of 40.7 degrees, easily breaking a record set just
three days before.13 Mackay also experienced four consecutive days above previous
November records, as well as breaking annual records for consecutive days over 35
and 38 degrees.14
Under current government policies, in Mackay days over 35 degrees would go from a
historical average of 1.5 days per year to up to 7 days by 2030, 19 days by 2050, 38
days by 2070 and 71 days by 2090. This would be concentrated in summer, where up
to 57% of summer days would be over 35 degrees by 2090.
Mackay would benefit significantly from climate policies that would keep warming
below 1.5 degrees. Climate policies to keep warming below 1.5 degrees would keep
predicted days over 35 degrees to 2 days by 2030, increase to 10 days by 2050 and
stabilise at 11 days by 2090.
13
BoM (2018) Climate Data online, Mackay Aero,
http://www.bom.gov.au/jsp/ncc/cdio/weatherData/av?p_nccObsCode=122&p_display_type=dailyDat
aFile&p_startYear=2018&p_c=-218394947&p_stn_num=033045
14
BoM (2018) Special Climate Statement 67—an extreme heatwave on the tropical Queensland coast,
http://www.bom.gov.au/climate/current/statements/scs67.pdf
HeatWatch Queensland 15Figure 8: Forecast annual number of days over 35 degrees Mackay
Source: BoM (2019) Climate data online, http://www.bom.gov.au/climate/data/index.shtml;
CSIRO and BoM (2018) Climate projections, provided on request
HeatWatch Queensland 16The Whitsundays
The Whitsundays have historically enjoyed a relatively pleasant coastal climate.
However, this is at risk as the climate warms and the number of extreme heat events
increases.
Last November, Proserpine experienced its most extended heatwave on record,
including its hottest day on record, when temperatures reached 44.9 degrees on
November 26th. The following two days remained above the previous record of 42.9
degrees. In this period there was a record nine consecutive days over 35 degrees,
almost double the previous record of five days. There were four consecutive days over
38 degrees and three over 40 degrees. There had never before been any consecutive
days over 38 degrees recorded in Proserpine since records began in 1970.15
As shown in Figure 9 below, under current government policies, in Cannonvale days
over 35 degrees would go from a historical average of 2 days per year (1981-2010) to
up to 8 days by 2030, 24 days by 2050, 51 days by 2070 and 87 days by 2090. This
would be concentrated in summer, where potentially almost every summer day could
be over 35 degrees by 2090.
Proserpine is projected to have even greater increases. As shown in Figure 10 below,
under current government policies, in Proserpine days over 35 degrees would go from
a historical average of around 10 days per year to up to 22 days by 2030, 50 days by
2050, 84 days by 2070 and 122 days by 2090. Again, this would be concentrated in
summer, where potentially almost every summer day could be over 35 degrees by
2090
The Whitsundays would benefit significantly from climate policies that would keep
warming below 1.5 degrees. Climate policies to keep warming below 1.5 degrees keep
predicted days over 35 degrees in Cannonvale to below 4 days by 2030, increase to up
to 12 days by 2050 and stabilise at 13 days or below by 2090.
15
BoM (2018) Special Climate Statement 67—an extreme heatwave on the tropical Queensland coast
HeatWatch Queensland 17Figure 9: Forecast annual number of days over 35 degrees Cannonvale/Airlie Beach
Source: BoM (2019) Climate data online, http://www.bom.gov.au/climate/data/index.shtml;
CSIRO and BoM (2018) Climate projections, provided on request
Figure 10: Forecast annual number of days over 35 degrees Proserpine/Whitsunday
Airport
Source: BoM (2019) Climate data online, http://www.bom.gov.au/climate/data/index.shtml;
CSIRO and BoM (2018) Climate projections, provided on request
HeatWatch Queensland 18Townsville
Townsville has historically enjoyed a relatively pleasant coastal climate. However, this
is at risk as the climate warms and the number of extreme heat events increases.
In November 2018, Townsville experienced its most extended heatwave on record,
including its highest recorded November temperature of 41.7 degrees. During this
heatwave Townsville experienced a record six consecutive days over 35 degrees for
November and set an annual record of four consecutive days over 38 degrees. There
are no previous recorded incidents of more than one consecutive day over 38 degrees
since records began in 1941.16
Under current government policies, in Townsville days over 35 degrees would go from
a historical average of 3 days per year to up to 12 days by 2030, 32 days by 2050, 64
days by 2070 and 108 days by 2090. This would be concentrated in summer, where
potentially almost every summer day could be over 35 degrees by 2090.
Townsville would benefit significantly from climate policies that would keep warming
below 1.5 degrees. Climate policies to keep warming below 1.5 degrees would keep
predicted days over 35 degrees to 7 days or below by 2030, increase to up to 18 days
by 2050 and stabilise at 17 days or below by 2090.
16
BoM (2018) Special Climate Statement 67—an extreme heatwave on the tropical Queensland coast,
http://www.bom.gov.au/climate/current/statements/scs67.pdf
HeatWatch Queensland 19Figure 11: Forecast annual number of days over 35 degrees Townsville
Source: BoM (2019) Climate data online, http://www.bom.gov.au/climate/data/index.shtml;
CSIRO and BoM (2018) Climate projections, provided on request
HeatWatch Queensland 20Electorates
Climate change is increasing land and ocean temperatures. These increases can be
measured as an increase in average temperatures over the year as a whole. Australia
has warmed by just over 1 degree as a result of greenhouse gas emissions and is
projected to warm by up to over 5 degrees by the end of century if global emissions
remain high.17 The World Bank considers 4 degrees “devastating” with “extremely
severe risks for vital human support systems.”18
QLD Government projections show an increase in the annual mean temperature for
QLD as a whole of up to 5.5 degrees by 2090.19
However, while increasing average or mean temperatures can have serious impacts on
human health and activities, extreme temperature events are the most dangerous to
human health, agriculture and the natural environment.
The QLD Government provides projections for the number of extreme heat days over
various thresholds. These maps in the tables below show the increasing frequency of
extreme temperature days over the coming decades. The darker the shade of red, the
greater the increase in the amount of hot days per year in that location.
17
BoM and CSIRO (2015) Australia’s changing climate,
https://www.climatechangeinaustralia.gov.au/media/ccia/2.1.6/cms_page_media/176/AUSTRALIAS_C
HANGING_CLIMATE_1.pdf
18
World Bank (2012) Turn down the heat: Why a 4 degrees Celsius warmer world must be avoided,
https://openknowledge.worldbank.org/handle/10986/11860
19
Queensland Government (2018) Future Climate Dashboard, Mean Temperature QLD,
https://app.longpaddock.qld.gov.au/dashboard/#responseTab1
HeatWatch Queensland 21CAPRICORNIA
Capricornia is a Central Queensland electorate that stretches from Rockhampton and
Yeppoon to the southern suburbs of Mackay, and inland to significant regional centres
like Collinsville, Moranbah, Dysart and Clermont.
Table 1: Increases in number of days over 35 degrees in the electorate of Capricornia.
Source: QLD Government (2018) Future Climate Dashboard
Key findings
Unless strong action is taken on climate change, by 2070, well within our children’s
lifetime, the electorate of Capricornia is projected to experience:
• Up to 30% increase in evaporation.
• Up to 50% reduction in rainfall.
• Up to 100% increase heatwave days per year.
• A single heatwave could last up to over 35 days.
• A 90-130% increase in the frequency of droughts and floods.
HeatWatch Queensland 22DAWSON
Dawson is a Central Queensland electorate that runs from Mackay to the southern
suburbs of Townsville. It includes the Whitsundays and regional centres like Ayr,
Bowen and Proserpine.
Table 2: Increases in number of days over 35 degrees in the electorate of Dawson.
Source: QLD Government (2018) Future Climate Dashboard
Key findings
Unless strong action is taken on climate change, by 2070, well within our children’s
lifetime, the electorate of Dawson is projected to experience:
• Up to 25% increase in evaporation
• Up to 50% reduction in rainfall
• Up to 100% increase in heatwave days per year
• Increasing fire risk
• A 90-130% increase in the frequency of droughts and floods.
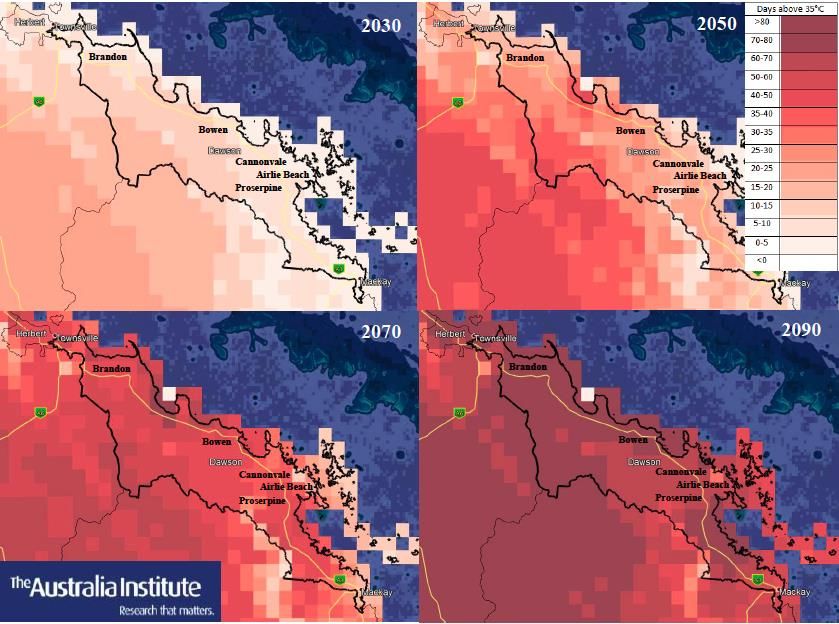
HeatWatch Queensland 23HERBERT
Herbert is the Central Queensland electorate for Townsville, including Magnetic Island.
Some Townsville suburbs are in the adjacent electorates of Dawson and Kennedy.
Table 3: Projected increase in the number of days over 35 degrees per year in the
electorate of Herbert
Source: QLD Government (2018) Future Climate Dashboard
Key findings
Unless strong action is taken on climate change, by 2070, well within our children’s
lifetime, the electorate of Herbert is projected to experience:
• Up to 30% increase in evaporation.
• Up to 50% reduction in rainfall.
• Up to 100% increase heatwave days per year.
• Single heatwaves lasting up to over 50 days.
• A 90-130% increase in the frequency of droughts and floods.
• Coastal inundation effecting over 4000 properties in 23 suburbs (by 2100).
HeatWatch Queensland 24Urban Heat Island effect in Queensland
Highly urbanised areas create an environment that is divergent from the surrounding
rural areas. Research has found that due to urban structures like concrete and
skyscrapers – along with roads, pavement, and diminished vegetation cover – cities
becomes warmer as more heat is absorbed in the materials during day and then
released at night, which increases night-time temperatures.20
This creates an Urban Heat Island effect (UHI) not just on these surfaces but also in the
atmosphere. This is more prominent during summer as temperatures rise. During the
daytime UHI causes exposed surfaces like roofs to heat to temperatures up to 50
degrees hotter than the air while rural areas remain closer to the atmospheric
temperatures, creating an ‘island’ effect in cities.21
UHI’s influence is perhaps most important at night. Heat absorbed in urban structures
during the day is slowly released after sunset compared to heat in vegetated areas.
This produces much higher air temperatures overnight than in equivalent rural areas.22
On a clear calm night, the US Environmental Protection Agency states that the
temperature difference can be as high as 12 degrees between urban and rural areas.23
The overnight effects of UHI are consistent across climate zones and scenarios. Coastal
cities also suffer from UHI despite sea breeze.24 Studies also raise the concern that
night temperature extremes carry higher risks of mortality as people are unable to
recover from daytime heat stress.25
20
Sharifi and Soltani (2017) Daily variation of urban heat island effect and its correlations to urban
greenery: A case study of Adelaide, Frontiers of Architectural Research 6.
21
United States Environmental Protection Agency (n.d.) Learn About Heat Islands,
https://www.epa.gov/heat-islands/learn-about-heat-islands
22
Argueso et al. (2015) Effects of City Expansion on Heat Stress under Climate Change Conditions, PLoS
ONE 10
23
United States Environmental Protection Agency (n.d.) Learn About Heat Islands,
https://www.epa.gov/heat-islands/learn-about-heat-islands
24
Santamouris et al. (2017) Urban Heat Island and Overheating Characteristics in Sydney, Australia – an
analysis of multiyear measurements, Sustainability 9
25
Zhao et al. (2018) Interactions between urban heat islands and heat waves, Environmental Research
Letters 13
HeatWatch Queensland 25Projected increases in nights over
25 degrees
When hot days are combined with hot nights, heat load and stress carry over and the
body has no opportunity to cool down and recover. Studies show that there is an
association between the mortality of not just stroke patients but also the general
population and high night temperatures.26
Extreme heat nights also cause increased insomnia and lack of rest. This is exacerbated
by the higher relative humidity overnight. As sleep is vital for healthy human
functioning, a deficit means more susceptibility to disease, obesity, chronic illness and
harm to our psychological and cognitive functioning.27
The number of hot days in places like Mackay and Townsville will be accompanied by
an even greater increase in the frequency of extreme summer nights. Parts of this
more rapid warming at night are characteristic of the climate system however, as
night-time temperatures are more sensitive to a build-up of greenhouse gases.28
The BoM classifies nights with extreme heat as those with a minimum temperature of
25 degrees.
26
Murage et al. (2017) Effect of night-time temperatures on cause and age-specific mortality in London,
Environmental Epidemiology 1; Roye (2017) The effects of hot nights on mortality in Barcelona, Spain,
International Journal of Biometeorology 61
27
Obradovich et al. (2017) Nighttime temperature and human sleep loss in a changing climate, Science
Advances 3
28
Davy et al. (2016) Diurnal asymmetry to the observed global warming, International Journal of
Climatology
HeatWatch Queensland 26MACKAY
Under current government policies, in Mackay nights over 25 degrees would go from a
historical average of 14 nights per year to up to 47 nights by 2030, 87 nights by 2050,
124 nights by 2070 and 159 nights by 2090. This would also be concentrated in
summer, where up to 95% of summer nights would be over 25 degrees by 2090.
However, with strong climate policies limiting global average temperatures to 1.5
degrees as recommended by the IPCC, extreme heat nights will be significantly less
frequent. Under this scenario shown in green in Figure 12 below, hot nights in Mackay
peak at up to 51 nights per year over 25 degrees in 2050 and stabilise around 46 nights
by 2090.
Figure 12: Forecast annual number of nights over 25 degrees Mackay
Source: BoM (2019) Climate data online, http://www.bom.gov.au/climate/data/index.shtml;
CSIRO and BoM (2018) Climate projections, provided on request
HeatWatch Queensland 27TOWNSVILLE
Under current policies, Townsville nights over 25 degrees are expected to increase
from a historical average of 26 nights per year to up to 78 nights by 2030, 126 nights
by 2050, 161 nights by 2070 and 197 nights by 2090. Virtually all summer nights, and
much of autumn and spring, are likely to stay above 25 degrees by 2090.
However, with strong climate policies limiting global average temperatures to 1.5
degrees as recommended by the IPCC, extreme heat nights will be significantly less
frequent. Under this scenario shown in green in Figure 13 below, hot nights in
Townsville peak at up to 78 nights per year over 25 degrees in 2050 and stabilise
around 70 nights by 2090.
Figure 13: Forecast annual number of nights over 25 degrees Townsville
Source: BoM (2019) Climate data online, http://www.bom.gov.au/climate/data/index.shtml;
CSIRO and BoM (2018) Climate projections, provided on request
HeatWatch Queensland 28Days over 40 degrees
In some parts of Queensland, such as Roma, the increase in days over 40 degrees will
have serious consequences.
The number of days over 40 degrees in Roma is expected to increase dramatically in
the coming decades according to the eight models used by the CSIRO and BoM climate
models. Under a business as usual (BAU) scenario on greenhouse emissions, the CSIRO
projects that Roma could experience as many as 20 days over 40 degrees per year in
2030, and up to 84 days per year by 2090. This would be over twenty times the BoM
average of four days per year from 1992–2011.
Figure 14 below lays out the CSIRO predictions out to 2090 under the BAU and the RCP
2.6 scenario that includes a significant reduction in emissions.
Figure 14: Forecast annual number of days over 40 degrees Roma
Source: BoM (2019) Climate data online, http://www.bom.gov.au/climate/data/index.shtml;
CSIRO and BoM (2018) Climate projections, provided on request
HeatWatch Queensland 29Health and productivity impacts of
extreme heat
The impact of extreme heat on human health, particularly over extended periods, is
severe. Although people living in hot areas do acclimatise to help cope with extreme
temperatures, there are limits.29 A large increase in days over 35 degrees will push past
those limits.
The health impacts of increasing extreme heat can include both direct heat illnesses
such as heat exhaustion and indirect illnesses such as heart failure and even death.
WorkSafe Queensland lists a range of illnesses arising directly from extreme
temperatures from mild cramps, rashes, and dehydration to severe injuries such as
heat stroke, exhaustion and even death if treatment is delayed.30 As climate change
worsens this can be expected to put people that are more vulnerable at increasingly
greater risk.
The elderly, the very young, and those with pre-existing health conditions are most
vulnerable to heat impacts. Illnesses such as angina, kidney disease, and diabetes are
more likely to be triggered or exacerbated when people are unable to maintain a safe
body temperature.31
People suffering from mental disorders are also vulnerable. This vulnerability to
extreme heat can result from altered behavioral responses to high temperatures or the
impact of medications.
As stated earlier, irritability and psychological stress also increase in heat. When hot
days are combined with hot nights, heat load and stress carry over and the body has
no opportunity to cool down and recover. Studies show that there is an association
between the mortality of not just stroke patients but also the general population and
29
Hanna and Tait (2015) Limitations to thermoregulation and acclimatisation challenges human
adaptation to global warming, Int J Environ Res Public Health 12
30
WorkSafe Queensland (n.d.) Health effects, https://www.worksafe.qld.gov.au/injury-prevention-
safety/hazardous-exposures/heat-stress/health-effects
31
Hanna et al. (2016) The silent killer: Climate Change and the Health Impacts of Extreme Heat, The
Climate Council, https://research-
management.mq.edu.au/ws/portalfiles/portal/72578140/72578105.pdf
HeatWatch Queensland 30high night temperatures.32 The ‘synergistic effect’ of night humidity, increased
temperatures, and urban heat island effects in heatwaves has been estimated in some
studies to double general mortality risk by the end of the century under RCP 8.5.33
Often underrated, major heatwaves have been dubbed the ‘silent killer’, causing more
deaths in the last century in Australia than all natural disasters put together.34
Extreme heat nights also cause increased insomnia and lack of rest. This is exacerbated
by the higher relative humidity overnight. As sleep is vital for healthy human
functioning, a deficit means more susceptibility to disease, obesity, chronic illness and
harm to our psychological and cognitive functioning.35
Productivity decreases significantly under these stresses as people are affected with
the consequences of extreme heat. Workplace safety and the ability to work declines.
This can also be displayed in economic terms as costs rise to account for the lack of
labour productivity and changes needed in workplaces.36
The cost of lost productivity because of extreme heat in Australia has been estimated
at almost $7 billon in 2013-14 alone.37
32
Murage et al. (2017) Effect of night-time temperatures on cause and age-specific mortality in London,
Environmental Epidemiology 1; Roye (2017) The effects of hot nights on mortality in Barcelona, Spain,
International Journal of Biometeorology 61
33
Zhao et al. (2018) Interactions between urban heat islands and heat waves, Environmental Research
Letters 13
34
Hanna et al. (2016) The silent killer: Climate Change and the Health Impacts of Extreme Heat
35
Obradovich et al. (2017) Nighttime temperature and human sleep loss in a changing climate, Science
Advances 3
36
Climate Council (2014) Heatwaves: Hotter, Longer, More Often,
https://www.climatecouncil.org.au/uploads/9901f6614a2cac7b2b888f55b4dff9cc.pdf
37
Zander, Opperman and Garnet (2015) Extreme heat poses a billion-dollar threat to Australia’s
economy, https://theconversation.com/extreme-heat-poses-a-billion-dollar-threat-to-australias-
economy-41153
HeatWatch Queensland 31Heat stress and the Queensland
workforce
Increasing extreme heat will have serious consequences for the health and safety of
many of Queensland’s workforce.
The workforce in Queensland is particularly vulnerable to the dangers of increasing
extreme heat with around 14% of the workforce employed in the mining, construction
and agricultural industries, all of which require workers to undertake strenuous work
in the heat.38
As discussed above, at temperatures above 35 degrees, the human body’s main
cooling mechanism – sweating – is far less effective. Sweating exchanges heat from the
body to the atmosphere, but this heat exchange process diminishes significantly
beyond 35 degrees, so body temperature rises. There is a range of health impacts,
from mild to severe. Heat stroke can cause permanent damage to the brain and other
vital organs and can even result in death.39
Townsville hosts the largest garrison in the Australian Defence Force (ADF) and is home
to 15,000 defence force personnel and their families.40 Soldiers are required to train
strenuously in heavy clothing which reduces air circulation essential to cooling the
body, and heavy equipment which adds to the level of exertion. The tragic
consequences of excessive training in the heat can be seen in the case of the death of
a young soldier due to heat stress at the ADF Puckapunyal base in Victoria this year.41
As discussed above, at temperatures above 35 degrees, the human body’s main
cooling mechanism – sweating – is far less effective. The US Army Research Institute of
38
ABS (2016) Table Builder 2016 Australian Census,
https://auth.censusdata.abs.gov.au/webapi/jsf/tableView/tableView.xhtml
39
Hanna and Tait (2015) Limitations to thermoregulation and acclimatisation challenges human
adaptation to global warming, Int J Environ Res Public Health,
https://academic.oup.com/heapro/article/30/2/239/561863; Australian Mining Review (2017) WA
miners urged to guard against heat stress, https://www.miningreview.com.au/wa-miners-urged-
guard-heat-stress/
40
Townsville City Council (2017) Defence Fact Sheet: Australian Defence Force,
https://www.townsville.qld.gov.au/__data/assets/pdf_file/0018/9360/Defence-Fact-Sheet-17.pdf
41
Smith (2019) Australian soldier dies during exercise at Puckapunyal Army base in Victoria,
https://www.news.com.au/national/victoria/news/australian-soldier-dies-during-exercise-at-
puckapunyal-army-base-in-victoria/news-story/452c965683ad8e2ecdb7f2017dff98c9
HeatWatch Queensland 32Environmental Medicine advises that all outdoor work with physical exertion be
cancelled when the combination of humidity and temperature hits a heat stress
threshold (known as a wet-bulb globe temperature) of 32 degrees (see the NOAA Heat
Stress Index in Figure 15).42
Figure 15: NOAA Heat Stress Index
Source: National Weather Service (n.d.) Heat safety,
http://www.nws.noaa.gov/os/heat/heat_index.shtml
Despite Worksafe Queensland warnings that working in extreme heat can lead to
serious injury and death,43 there is no temperature level threshold for halting heavy
outdoor work in Queensland. The death of a CSG worker near Roma in Queensland as
a result of heat in 2016 prompted the Queensland Government Coroner to
recommend one be adopted.44
42
Hanna (2016) Microclimates and heat islands: Climate change exacerbates occupational heat
exposures,
http://greenhouse.asnevents.com.au/assets/Greenhouse/Presentations/1420HannaMR2Wed.pdf
43
WorkSafe Queensland (n.d.) Health effects, https://www.worksafe.qld.gov.au/injury-prevention-
safety/hazardous-exposures/heat-stress/health-effects
44
Briggs (2016) Coroner calls for temperature threshold to stop outdoor work in extreme heat,
https://www.abc.net.au/news/2016-04-20/coroner-calls-temperature-threshold-to-stop-outdoor-
work-heat/7342464
HeatWatch Queensland 33Mining workers
Extreme heat presents a significant health risk to mining workers. The Australasian
Mining Safety Journal describes the risks as follows:
When environmental temperatures exceed that of dry skin, sweating becomes
the primary source of thermoregulation. However, as temperatures continue to
rise, particularly in humid environments with poor airflow, this may not be
enough. The body’s core temperature rises, resulting in a continuum of
ailments, collectively known as heat illness. This ranges from the relatively mild
heat rash and muscle cramps, to heat exhaustion and the potentially fatal heat
stroke.
Heat illness can present as headache, nausea or vomiting, irritability, clammy
skin, dizziness, fatigue, elevated heart rate, and rapid breathing rate. This
translates to lower productivity, poor morale and higher rates of accidents in
the workplace. When left untreated, heat illness can progress to heat stroke,
where confusion, further reduced muscle coordination, convulsions and
ultimately a loss of consciousness can occur.45
There are also factors that compound the heat risks of mining in particular including
having to wear heavy protective clothing that can reduce air circulation to the skin,
long shifts and that water is not always readily available.
A survey of mine workers in Northern Australia found heat stress symptoms were
experienced by 87% of open cut mine workers and 79% of underground mine workers.
Around 80% of workers experienced these symptoms more than once. The survey also
found that only 27% were well hydrated with 10% significantly dehydrated.46
45
Australasian Mining Safety Journal (October 2015) Handling the heat,
https://www.amsj.com.au/handling-the-heat/
46
Hunt et al. (2012) Symptoms of heat illness in surface mine workers,
https://eprints.qut.edu.au/54048/
HeatWatch Queensland 34Tourism
Tourism is a significant industry in Queensland, accounting for 138,000 direct jobs and
79,000 indirect jobs.47 Tourism in the state is based firmly on outdoor attraction, with
the Great Barrier Reef particularly significant. The attractiveness of destinations to
tourists is largely dependent on the climate.
If the dramatic rise in extreme temperature days projected to occur on our current
emissions trajectory occur, the attractiveness of Queensland as a destination is likely
to be significantly diminished. According to the Tourism Climatic Index, the entirety of
Queensland would be “unfavourable” for tourism by the 2080s under some warming
scenarios.48 This will have flow on effect to the many businesses and workers in the
states’ tourism industry whether or not they are directly exposed to the heat.
In addition, climate change directly threatens the Great Barrier Reef, which has
experienced catastrophic bleaching in recent years and is the tourist attraction most
endangered by global warming. Each year, 2.2 million international tourists and 1.7
million domestic tourists visit the Great Barrier Reef; Reef tourism contributes $5.7
billion per year.49 If the Reef continues to experience severe bleaching, tourist
numbers could fall by over one million per year.50
Climate change will also reduce the attractiveness of other Queensland tourism. The
deadly box jellyfish is increasingly found in southerly, sub-tropical waters, perhaps
because of waters warming due to climate change. Coastal beaches are vulnerable to
erosion, which requires increasingly costly nourishment to address.51 Extreme
weather, including cyclones, droughts and floods, also threatens tourism as well as
agriculture, industry and human life.52
47
Tourism Research Australia (2017) State Tourism Satellite Accounts 2016-17,
https://www.tra.gov.au/Economic-analysis/Economic-Value/State-Tourism-Satellite-Account/state-
tourism-satellite-account
48
Climate Council (2018) Icons at risk, p 12–14, https://www.climatecouncil.org.au/resources/tourism-
2018/
49
Climate Council (2018) Icons at risk, p 16–21
50
Campbell and Swann (2016) Great barrier bleached, http://www.tai.org.au/content/great-barrier-
bleached
51
Climate Council (2018) Icons at risk, p 30–31
52
Queensland Government (2018) Building a resilient tourism industry,
https://www.qld.gov.au/__data/assets/pdf_file/0036/68697/building-resilient-tourism-industry-qld-
ccr-plan.pdf
HeatWatch Queensland 35Agriculture
The impact of climate change has far reaching effects not just on human health and
productivity, but also on animals and crops as they struggle to adapt.
Excessive heat load, or heat stress, is the response of cattle when they are unable to
dissipate body heat effectively due to sustained extreme temperatures. Cattle
ordinarily maintain their body temperature within a narrow range over the course of a
day and cool down at night. When exposed to high heat load the animal attempts to
make physiological changes and adjustments to cope and survive.53
Under these conditions, heat-stressed cattle will eat less, seek shade, breathe with
their mouths open, and pant, salivate and splash water if it is available.54 The stress
also generally results in a loss of performance (growth and reproduction). Eventually, if
the heat load becomes excessive, critical functions may no longer be maintained and
clinical disease, collapse and even death can result.
Crop yields too are under threat from climate change. The wheat industry is worth
more than $5 billion per year nation-wide and is Australia’s most valuable crop.
However, ‘potential’ wheat yields have fallen in Australia between 1990 and 2015 by a
dramatic 27%.55 Researchers attribute this decline to reduced rainfall and to the rising
temperatures associated with climate change.56 High temperatures can also damage
crop reproduction and indirectly increase plant water stress.57
The CSIRO projects that, as global warming continues, the ability of different regions of
Australia to grow food will change. Yields in areas such as Roma that are drier are also
projected to decline as the ‘cropping belt’ moves south towards the wetter southern
fringes in Western Australia and Victoria.58
53
Barnes et al. (2004) Physiology of heat stress in cattle and sheep,
http://www.livecorp.com.au/LC/files/dc/dcfff517-e032-4d6e-8dc5-5be26b9ba845.pdf
54
Coventry and Phillips (2000) Heat Stress in Cattle,
https://dpir.nt.gov.au/__data/assets/pdf_file/0015/233070/788.pdf
55
The Conversation, Changing climate has stalled Australian wheat yields: study,
https://theconversation.com/changing-climate-has-stalled-australian-wheat-yields-study-71411
56
Hochman et al. (2017) Climate trends account for stalled wheat yields in Australia since 1990, Global
Change Biology, https://onlinelibrary.wiley.com/doi/full/10.1111/gcb.13604
57
Climate Council (2014) Heatwaves: Hotter, Longer, More Often,
https://www.climatecouncil.org.au/uploads/9901f6614a2cac7b2b888f55b4dff9cc.pdf
58
CSIRO (n.d.) Crops ready for a different future climate,
https://research.csiro.au/climate/themes/agriculture/crops-ready-different-future-climate/
HeatWatch Queensland 36Infrastructure and industry
Extreme heat can cause failures to critical infrastructure, particularly transport and
electricity supply. Coal and gas power stations in particular are highly vulnerable to
extreme heat, experiencing both reduced output and an increased level of
breakdowns. This is exacerbated by high electricity demand as a result of increased use
of air-conditioning during extreme heat conditions. During the February 2017
heatwave in South Australia, 17% of gas generation (438 MW) failed to deliver during
the peak demand period on the heatwave day (8th of February),59 leading to
widespread blackouts.60
In urbanised environments, air-conditioning can be critical to people’s wellbeing during
extreme heat. Electricity blackouts during heatwaves lead to the loss of air-
conditioning when it is most essential. During the 2009 Heatwave in Melbourne on the
evening of the 30th of January, 500,000 people were left without power on a day that
reached 44 degrees. There were 374 deaths recorded as a result of this heatwave
overall. The estimated economic cost of the heatwave was $800 million.61
An efficient transport system is fundamental to the functioning of all large cities.
Transport is also vulnerable to extreme heat. Roads can melt62 and rail can buckle.63
Some public transport does not have air-conditioning, or the air-conditioning can break
down, causing distress to commuters.64
59
Ogge and Aulby (2017) Can’t stand the heat; The energy security risk of Australia’s reliance on coal and
gas generators in an era of increasing heatwaves,
http://www.tai.org.au/sites/defualt/files/P454%20Can%27t%20stand%20the%20heat%20FINAL%202.31.pdf
60
Harvey and Shepherd (February 2017) Rolling blackouts ordered as Adelaide swelters in heatwave,
https://www.news.com.au/national/south-australia/rolling-blackouts-ordered-as-adelaide-swelters-in-
heatwave/news-story/13394f19db1ee94a59f4036fccdc1ba7
61
NCCARF (2010) Impacts and adaptation responses of infrastructure communities to heatwaves,
https://www.nccarf.edu.au/business/sites/www.nccarf.edu.au.business/files/attached_files_publications/Pub%20
13_10%20Southern%20Cities%20Heatwaves%20-%20Complete%20Findings.pdf
62
Cheer (January 2018) Traffic delays after 10 kilometers of Victoria's Hume Freeway melts,
https://www.sbs.com.au/news/traffic-delays-after-10-kilometres-of-victoria-s-hume-freeway-melts
63
Lauder (2009) Melbourne railway buckles under heat,
http://www.abc.net.au/worldtoday/content/2008/s2477350.htm
64
Robertson (January 2017) Eastern Australia swelters under heatwave as hottest January on record
looms, https://www.theguardian.com/australia-news/2017/jan/18/eastern-australia-swelters-under-
heatwave-as-hottest-january-on-record-looms
HeatWatch Queensland 37You can also read