CHILDREN'S EXPOSURE TO LEAD IN SANTA CLARA COUNTY - SANTA CLARA COUNTY OFFICE OF EDUCATION August 2021
←
→
Page content transcription
If your browser does not render page correctly, please read the page content below

CHILDREN’S EXPOSURE TO LEAD
   IN SANTA CLARA COUNTY

       SANTA CLARA COUNTY OFFICE OF EDUCATION
                       August 2021
Contents
     Summary ...................................................................................................................................................................... 3
     Introduction ................................................................................................................................................................. 4
     There is No Safe Level of Lead ..................................................................................................................................... 4
     Damaging Effects of Lead ............................................................................................................................................. 5
        Symptoms of Lead Exposure .................................................................................................................................... 5
        Developmental Effects of Lead Exposure: Cognition ............................................................................................... 5
        Developmental Effects of Lead Exposure: Education .............................................................................................. 5
        Lead Exposure During Pregnancy and Breastfeeding............................................................................................... 6
     Sources of Lead Exposure ............................................................................................................................................ 7
        Leaded Aviation Fuel ................................................................................................................................................ 7
        Paint ......................................................................................................................................................................... 7
        Drinking Water ......................................................................................................................................................... 8
        Leaded Gasoline ....................................................................................................................................................... 8
        Industrial Sites .......................................................................................................................................................... 8
        Artificial Turf ............................................................................................................................................................ 9
     Preventing Lead Exposure .......................................................................................................................................... 10
        The Need for Prevention Focused Policy ............................................................................................................... 10
        Prevention Resources for Families ......................................................................................................................... 11
     Lead Exposure Data in Santa Clara County ................................................................................................................ 13
        Child Demographic Data ........................................................................................................................................ 13
        Blood Lead Levels in Children ................................................................................................................................ 14
        Schools Near Reid-Hillview Airport ........................................................................................................................ 16
     Glossary of Terms ....................................................................................................................................................... 18

                                                                                     1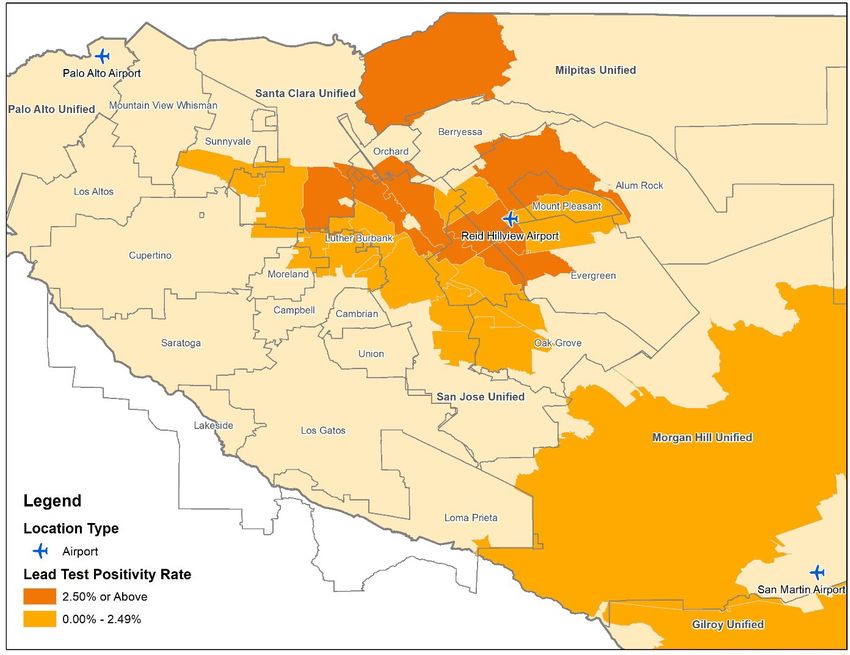
This report was prepared by Dr. Matthew Tinsley, Director, Strong Start and Dr. David Villegas, Manager of
Research, Evaluation, and Planning for the Santa Clara County Office of Education.

                                                    2
Summary
There is no safe level of lead exposure in children. Despite research demonstrating effects on children’s
educational attainment, cognitive function, and behavioral and emotional regulation at concentrations
well below the current reference level of 5µg/dL, almost half a million children in the U.S. are expected
to have blood lead levels (BLL) above it. Children continue to be exposed to lead from historical sources,
such as leaded gasoline and paint, and ongoing pollution from leaded aviation fuel. California’s BLL
testing and reporting program shows elevated BLL among young children in a number of zip codes in
Santa Clara County, and critics suggest the issue may be more common and widespread than the
currently reported data reflects. Within Santa Clara County, the area around Reid-Hillview Airport –
which serves the kind of piston-driven small aircraft that continue to use leaded aviation gasoline – is of
particular concern due to the number of children, childcare providers, and schools in close proximity to
the airport.

                                                    3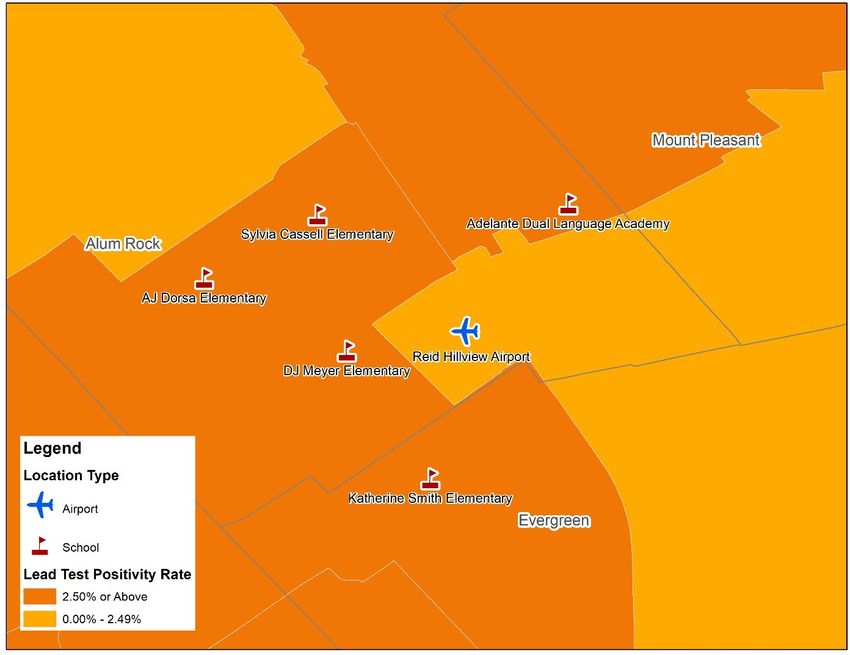
Introduction
Despite decades of research demonstrating the damaging effects of lead exposure on children, it
continues to be a significant public health concern. Lead is a toxic metal that has been used in a variety
of products, including paint, gasoline, plumbing pipes and fixtures, and tableware. These products can
result in lead, in household dust or soil, in drinking water, or in food stored or served in these dishes,
being ingested or inhaled. Once in the body, even at very low concentrations, lead dysregulates nervous
system signaling. Lead exposure in children can cause permanent changes in central nervous system
development, resulting in cognitive and
behavioral impairments, learning
disabilities, and attention problemsi.           472,000 children, ages 1-5, have elevated blood
Public policy, including banning of lead         lead levels in the United States
paint and leaded gasoline, has led to
dramatic reductions in children’s blood
levels (BLL) over the past 50 yearsii, however many sources of lead exposure remain, and current
population estimates indicate that approximately 472,000 children, ages 1-5, have elevated BLL in the
United States. Based on the results of blood lead testing in children ages 1-5 in Santa Clara County, as
many as 2,000 children under age 6 in our community may have elevated BLL.

The Santa Clara County Office of Education (SCCOE) is committed to serving, inspiring, and promoting
student and public school success. The SCCOE works to reduce inequities that lead to racial, and other,
disparities in students’ education outcomes. This report is designed to provide an overview of research
on the impact of lead exposure on children’s cognitive and educational outcomes, to describe the most
prevalent sources of lead exposure, and to present the current public data on BLL in children and
education outcomes in Santa Clara County.

There is No Safe Level of Lead
Between 1960 and 1991, the Centers for Disease Control and Prevention (CDC) lowered the blood lead
level (BLL) requiring intervention (the “level of concern”) from 60µg/dL to 15µg/dL as evidence of the
toxic impacts of lead exposure, particularly in children, mounted. In 2005, the CDC considered lowering
the level of concern again but determined against it. In 2010, in the face of additional evidence of
                                                     cognitive and other physiological impacts of BLL
                                                     below 10µg/dL in children, the CDC convened a
  No measurable level of blood lead is               working group that recommended ending the
  known to be without deleterious effects            concept of the level of concern “because no
                                                     measurable level of blood lead is known to be
                                                     without deleterious effects”. Instead of an absolute
level, the working group recommended using a reference value to “characterize individual results as
“elevated” or “not elevated” in comparison to the population average or mean value” and defined
“elevated” for children ages 1-5 as a BLL higher than that of 97.5% of the population averageiii. Based on
data from the National Health and Nutrition Examination Survey (NHANES), this reference level is
5µg/dL.

                                                    4
Damaging Effects of Lead
Symptoms of Lead Exposure
The Agency for Toxic Substances and Disease Registry (ATSDR) Toxicological Profile for Lead states
“Toxic effects of [lead] have been observed in every organ system that has been rigorously studied”,
that adverse effects have been found in these systems at BLL less than 10µg/dL, and that the strongest
evidence is of adverse effects on children’s cognitive function at exposures less than 5µg/dLiv. Short-
term exposure to high levels of lead in children and adults (above 10µg/dL) can lead to a variety of
symptoms including abdominal pain or constipation, tiredness, headaches and irritability, loss of
appetite, memory loss, pain or tingling in the hands and/or feet, and muscle weakness. Very high
exposures can lead to anemia, kidney and brain damage, and even death. Long-term exposure to high
levels of lead can cause depression, distractibility, and nausea and increases risk for high blood pressure,
heart disease, kidney disease, cancer and reduced fertility. In general, the adverse effects of lead
exposure are greater for children than adults, both because children seem to be more sensitive to
similar levels of exposure and because lead has particularly damaging effects on the developing nervous
systemv.

Developmental Effects of Lead Exposure: Cognition
There is substantial literature on the effects of early childhood lead exposure on cognition, as measured
by IQ scores. One particularly impactful study (cited over 2,000 times) found that “IQ declined by 7.4
points as lifetime average blood lead concentrations increased from 1 to 10μg per deciliter”vi. This effect
would be sufficient to move someone of average intelligence (50th percentile) into the bottom third of
the population (31st percentile). More specific effects have been found on attention and executive
function. Elevated BLL have been associated with significantly increased risk of later diagnosis of
Attention Deficit / Hyperactivity Disorder, especially in boysvii, and prenatal exposure to very low levels
of lead (less than 1μg per deciliter) has been shown to result in poorer performance on tests of the
ability to plan/organize and shift tasks, and increased emotional problems, in children assessed at
approximately eight years of ageviii.

Developmental Effects of Lead Exposure: Education
Given the effects of BLL on cognition, it is not surprising that it has effects on children’s academic
performance. Lanphear et al. (2000) reported that reading and arithmetic scores (as measured by
standardized tests) declined as BLL increased, and that reading scores were especially sensitive to lead
                                                                    exposure and “are of particular
                                                                    importance, because they are potent
  Lead remediation has been suggested as a strategy                 predictors of academic achievement” ix.
  to close the racial opportunity gap in education                  Recent studies based on estimated
                                                                    cumulative lead exposure from drinking
                                                                    water in Flint, MI suggest that the mean
exposure during that crisis resulted in 12 to 14 percent declines in the number of elementary students
proficient in reading, and 6 to 9 percent declines in the numbers of students proficient in mathematics,
as measured by state standardized testsx. BLL in the 2-5µg/dL range have negative effects on end-of-
grade test scores with a BLL of 3μg/dL and 4μg/dL having impacts roughly equal to 59% and 90% of the
impact of eligibility for the free or reduced-price lunch program (FRPL), respectivelyxi. Given racial
inequities in lead exposure, lead remediation has been suggested as a strategy to close the racial

                                                     5
opportunity gap in educationxii. BLL have also been demonstrated to have dose-dependent effects on
diagnosis of learning disabilities (LD). Approximately 9% of children with BLL between 0 and 1μg/dL are
diagnosed with LD, compared with 13% of children with BLL between 1 and 1.5μg/dL and 17% of
children with BLL above 1.5μg/dLxiii.

Lead Exposure During Pregnancy and Breastfeeding
The American College of Obstetricians and Gynecologists (ACOG) Committee on Obstetric Practice has
published, and subsequently reaffirmed, guidelines on lead screening that describes the current
understanding of effects of lead exposure during pregnancy and breastfeedingxiv. It cites findings that
approximately 1% of women of childbearing age have elevated BLL, that lead easily crosses the placenta
into the nervous system of the developing fetus, and that lead exposure during pregnancy has adverse
effects for mother and child including
gestational hypertension, spontaneous
abortion, low birth weight, and impaired     Breast milk lead is a significant and important
neurodevelopment. For example, babies        source of infant lead exposure
born to mothers with BLL above
4.9μg/dL showed poorer performance
on neonatal behavioral neurological assessments that were administered when the infants were 3 days
old, in comparison with mothers with BLL below 2.0μg/dLxv. The effects of in utero exposure can persist
with some studies finding effects on IQ and even classroom behavior.

One Canadian study found that children exposed to lead in utero (measured using cord blood samples)
demonstrated greater attentional problems and behaviors consistent with the inattentive subtype of
Attention Deficit Hyperactivity Disorder in ratings assigned by their classroom teachers in elementary
schoolxvi. The research on lead exposure that can result from breastfeeding is less extensive. Longer
breastfeeding duration has been associated with higher BLL in infantsxvii, infant BLL has been shown to
be correlated with maternal breast milk lead levels, and “breast milk lead is a significant and important
source of infant lead exposure accounting for approximately 30% of variation in infant blood lead levels”
xviii
     . A particular concern is that lead that has been absorbed into the mother’s bones during prior
exposure years or even decades earlier can be mobilized into the bloodstream due to increased bone
                                                                               turnover associated with
                                                                               pregnancy and lactation.
                                                                               This lead can then pass
                                                                               across the placenta into the
                                                                               developing fetus. The ACOG
                                                                               guidelines recommend that
                                                                               pregnant or lactating
                                                                               women who have ever had
                                                                               BLL above 5μg/dL receive
                                                                               calcium and iron
                                                                               supplementation to reduce
                                                                               this risk of
                                                                               transgenerational lead
                                                                               exposure.

                                                    6
Sources of Lead Exposure
Leaded Aviation Fuel
Leaded aviation gasoline (avgas) is the largest remaining source of lead emissions in the U.S. Sixteen
million people live, and three million children attend school, within 1,000m of an airport serving planes
using leaded avgasxix. There are 167,000 piston-driven airplanes (typically with six seats or fewer) using
avgas in the United States, while helicopters, turbo-propeller aircraft (typically with more than six seats)
and jet engine planes use unleaded jet fuelxx. A population-level study in Michigan has shown that, after
adjusting for other known sources of lead exposure, child BLL increased dose-responsively in proximity
to airports, declined measurably among children sampled in the months after 9/11, increased dose-
responsively with the flow of piston-engine aircraft traffic, and increased with the percentage of
prevailing wind days in the direction of a child’s residential locationxxi. Modeling and monitoring studies
show increased lead levels approximately 450m beyond the airport property in summer and fallxxii.
There are three airports in Santa Clara
Leaded aviation gasoline is the largest remaining County that serve small airplanes of the
source of lead emissions in the U.S. type that use leaded avgas: Palo Alto
Airport, owned by the City of Palo Alto,
and Reid-Hillview Airport and San Martin
Airport, owned by the County of Santa Clara. Reid-Hillview (RHV) is a significant source of airborne lead
pollution in the Santa Clara Valleyxxiii and is the greatest concern due to its relatively high level of activity
and close proximity to residential areas. A 2008 study by the EPA ranked RHV 25th out of 3,414 airport
facilities across the country with an estimated 580 kilograms of lead emitted annuallyxxiv. Census data
show that over 34,000 people, including more than 2,300 children ages zero to five, live in the seven
census tracts including and adjacent to RHV. In February 2020, the County of Santa Clara commissioned
a study on whether there is a significant relationship between leaded fuel emissions and BLL in children
residing within a ten-kilometer radius of both Reid-Hillview and San Martin airports. The results of that
study are expected in Summer 2021xxv.
Paint
In 1978, the U.S, banned consumer use of lead
paint. Lead paint was used in 24% of homes built
between 1960 and 1978, and 87% of homes built
before 1940xxvi. In many of these homes, the
paint is still present and presents a hazard if the
paint is damaged, chipping, or damp. Areas that
receive significant wear, such as window and
door frames, are particularly problematic.
Additionally, exterior lead paint can contaminate
soil around the around the base of the house.
Approximately 67% of housing in Santa Clara
Countyxxvii, and more than 60% of housing in the
San Jose – Sunnyvale – Santa Clara metropolitan
statistical areaxxviii, was built before 1979 and
may contain lead paint.
7There is no corresponding ban on the industrial use of lead paint, which can be used on a wide variety of
applications including on steel structures such as bridges, ships and playground equipment, in road
markings, and on consumer products like automobilesxxix. This lead can contaminate air, soil and water
as it chips and peels and creates the risk of lead exposure, especially when it is removed during repairs
and repainting. In 2010, nine painters working on Bay Area bridges were found to have been lead
poisoned while working on bridge retrofit projectsxxx. Some automobile paint (particularly red, orange,
and yellow colors on older cars) contains lead and there have been cases of children being lead exposed
after playing in areas contaminated with dust from car paintxxxi.
Drinking Water
Lead in pipes, fixtures and solder can corrode into drinking water and is regulated by the Safe Drinking
Water Act and the Environmental Protection Agency. San Jose Water’s 2019 annual Consumer
Confidence Report (CCR) indicated 2 samples collected at consumer’s taps with lead levels in excess of
the Regulatory Action Level (AL) of 15 parts per billion (15μg/L)xxxii. The City of Gilroy indicated no
samples in excess of the ALxxxiii. System level testing cannot identify lead exposure due to distribution
pipes leading to individual homes or from plumbing and fixtures within buildings, which requires testing
water from each faucet.
Leaded Gasoline
Leaded gasoline, used until 1996, distributed millions of tons of lead dust which is disproportionately
concentrated in the core and inner suburbs of citiesxxxiv. Soil lead and lead dust, which are primarily due
to exhaust from cars using leaded gasoline, are associated with population lead levels in children.
Geographic studies have demonstrated higher levels of soil lead in areas close (within 150 meters) to
freeways and arterial roadsxxxv. Congressional testimony from the manufacturer of tetraethyl lead, the
additive used in leaded gasoline, in 1984 has allowed researchers to develop estimates of the amount of
lead pollution dispersed into US urbanized areas during the peak use of leaded gasoline, from 1950
through 1982xxxvi, which accounts for 86% of leaded gasoline usage from 1927 until 1994xxxvii. In this
study, San Jose was ranked 21 of 90 urban areas for the mass of gasoline lead aerosols, with over 13,000
metric tons of lead emitted from tail pipes into the community, suggesting that this form of
contamination may be of particular concern in Santa Clara County.
Industrial Sites
Lead is, and has been, used in a variety of industrial processes and pollution from these sources can
contaminate both the specific site and surrounding areas. California’s Department of Toxic Substance
Control (DTSC) EnviroStor database lists 92 sites contaminated with elemental or tetraethyl lead in Santa
Clara County, of which 17 are “active”, i.e., an investigation and/or remediation is currently in progress
and that DTSC is actively involved. Six of the 17 active listings are school sitesxxxviii including Mountain
View High School and Los Altos High School in Mountain View-Los Altos High School District, the Agnews
East development in Santa Clara Unified School District, the proposed San Antonio elementary school in
Los Altos School District, Mabel Matos Elementary School in Milpitas Unified School District and South
Valley Middle School in Gilroy Unified School District. Note that the DTSC EnviroStor database is not a
complete list of polluted sites in California as it does not include the State Water Board’s lists of
underground waste storage tanks and solid waste disposal sites where hazardous waste has leaked, sites
contaminated with pollutants that are not hazardous waste (e.g. domestic sewage or food processing
waste) and two additional sites subject to a specific clause in state lawxxxix.
8Artificial Turf
In 2008, the New Jersey Department of Health and Senior Services found that artificial turf made of
nylon could weather and release lead dustxl. In 2010, the State of California entered into a consent
decree with artificial turf manufacturers and installers to stop selling and installing existing turf
immediately and to reduce the levels of lead artificial turf to “negligible levels”xli. While artificial turf is
used in a variety of settings, including indoor and outdoor sports fields, residential landscaping, and dog
runs, the consent decrees specifically mention daycare centers, schools and playgrounds as locations
where these products were used and should be replaced. Artificial turf fields typically last 8 to 10 years
and so it is likely that most fields with high lead levels have been replaced.
9Preventing Lead Exposure
The Need for Prevention Focused Policy
The American Academy of Pediatrics (AAP) Council on Environmental Health policy statement
“Prevention of Childhood Lead Toxicity”xlii provides an overview of the recommended medical approach
to preventing lead exposure in children. It notes that the neurological and developmental effects of lead
exposure occur at much lower doses than overt symptoms, meaning that this damage can occur without
being noticed. Additionally, it acknowledges that there are no treatments for reducing the
developmental adverse effects of lead exposure in children. A series of studies examining the effects of
chelation therapy (using chemicals to bind to lead
circulating in the blood stream and remove it) in 780
children who, at 12 to 33 months of age had BLL between No effective treatments ameliorate
20 and 44μg/dL, found no effects of treatment at 3 years the permanent developmental effects
after exposure or at age 7, despite chelation reducing BLL
of lead toxicity
during the treatmentxliii. Similarly, iron and/or zinc
supplementation did not improve performance on
cognitive tests in lead exposed school childrenxliv. Other approaches, including parent education and
providing households with dust control measures, have also not been successful in reducing children’s
BLLxlv and the policy statement references research that lead screening questionnaires “fail to identify
children who have elevated BLL”.
The AAP policy statement recommended that “the focus of prevention should be on reducing the
sources of childhood lead exposures rather than identifying children who have already been unduly
exposed or attempting to ameliorate the toxic effects of lead exposure”. It recommends a public health
approach focused on blood lead surveillance, community, and residential characteristics (such as the
age of housing or presence of known sources of lead pollution), and analysis of electronic medical
records to identify children who should be screened with a blood lead test.
The California Code of Regulations (17 CCR §
The focus of prevention should be on 37100) implements this prevention-focused
approach by requiring health care providers to
reducing the sources of lead exposures rather inform parents of the risks of lead exposure at
than identifying children who have already children’s 12-month and 24-month well check
been unduly exposed or attempting to visits, to ask the following question: “Does
your child live in, or spend a lot of time in, a
ameliorate the toxic effects of lead exposure
place built before 1978 that has peeling or
chipped paint or that has been recently renovated?”, and by requiring blood lead level tests when
caregivers answer “yes” to this question or when “the child receives services from a publicly funded
program for low-income children … as the child is presumed to be at risk of lead poisoning.”xlvi
10Prevention Resources for Families
Given the emphasis on reducing sources of lead exposure LEAD EXPOSURE PREVENTION
identified in the AAP policy statement referenced above, it is
RESOURCES FOR PARENTS AND
not surprising that resources for families produced by
CAREGIVERS
various public health agencies emphasize information about
sources of lead in their homes. The Santa Clara County’s California Department of Public
Public Health Department Childhood Lead Poisoning Health Childhood Lead Poisoning
Prevention Program webpage has a simple Frequently Asked
Prevention Branch Me and My
Questions (FAQ) list for familiesxlvii. The California
Family webpage
Department of Public Health’s (CDPH) Childhood Lead
Poisoning Prevention Branch (CLPPB) begins their Resources https://www.cdph.ca.gov/Progra
for Staying Lead Safe During COVID-19 page ms/CCDPHP/DEODC/CLPPB/Pages
(https://www.cdph.ca.gov/Programs/CCDPHP/ /me_and_my_family.aspx
DEODC/CLPPB/Pages/COVIDResources.aspx) with “Many
potential sources of lead can be found in or around the
home, such as lead-based paint, dust, and soil”xlviii. This web
Centers for Disease Control and
site also includes a checklist for sources of lead in the
homexlix including paint, house dust, and other sources. In Prevention Childhood Lead
addition to caregiver education, the site contains multi- Poisoning Prevention Program
media resources designed for children, curriculum for Parents and Caregivers webpage
childcare and early elementary providers to use with
https://www.cdc.gov/nceh/lead/a
children, and guides to safe paint removal and renovation.
udience/parents.html
The web site also provides specific steps for caregivers to
take to reduce the risk of lead exposurel including avoiding
letting children chew on painted surfaces; frequent hand
washing; including calcium, iron and Vitamin C in their diet; American Academy of Pediatrics
using water from the cold tap for cooking and drinking; Lead Exposure: Steps to Protect
cleaning dust with a damp cloth; and avoiding bare dirt in Your Family webpage
the garden and bringing soil into the house on shoes or
clothes. Finally, the site emphasizes the importance of blood https://www.healthychildren.org/
lead testing for children who may be at risk for lead English/safety-prevention/all-
exposureli. around/Pages/Lead-Screening-for-
Children.aspx
The Federal government also has caregiver-focused
resources intended to reduce the risk of lead exposure in
children, available at the Centers for Disease Control and Prevention’s Childhood Lead Poisoning
Prevention Program website (https://www.cdc.gov/nceh/lead/default.htm). The Parents and Caregivers
section includes topics on sources of lead, lead poisoning prevention, health effects of lead exposure,
blood lead levels in children, and an FAQ. Similar to the CDPH CLPPB web site, the CDC site lists sources
including lead paint, water pipes, toys, jewelry, candies, traditional remedies, and certain hobbies as
sources of lead, but also includes lead in air and soil from aviation gasoline as a source for children who
live near airportslii. In keeping with other guidance, the “Lead Poisoning Prevention” section of the
website emphasizes removing sources of potential lead exposure from children’s environments and
blood testing for children who may have been exposedliii.
11In addition to its policy statement, the American Academy of Pediatricians (AAP) also provides
information intended for caregivers on lead exposure preventionliv, lead testing, blood lead levelslv, and
lead in tap water and plumbinglvi, via its healthychildren.org website. This information emphasizes the
need to prevent lead exposure by addressing potential sources, that pediatricians should be screening
for possible sources of lead exposure, and that the only way to know if a child has been exposed to lead
is with a blood test.
12Lead Exposure Data in Santa Clara County
Child Demographic Data
Santa Clara County is home to over 400,000 children from a diverse array of ethnic and racial
backgrounds. Table 1 presents data on child population by various age ranges and Table 2 shows the
child populations in various racial and ethnic groups lvii.
Table 1: Santa Clara County Child Population, by Age and Gender
Age Group Female Male Total
Ages 0-2 30,728 32,457 63,185
Ages 3-5 34,632 37,201 71,833
Ages 6-10 61,096 63,285 124,381
Ages 11-13 38,650 40,247 78,897
Ages 14-17 51,245 52,050 103,295
Total for Ages 0-17 216,351 225,240 441,591
Table 2: Child Population by Race/Ethnicity
Number Percentage
African American/Black 8,997 2.0%
American Indian/Alaska Native 1,202 0.2%
Asian American 156,967 36.2%
Hispanic/Latino 139,879 31.7%
Native Hawaiian/Pacific Islander 1,337 0.3%
White 106,375 24.1%
Multiracial 26,834 6.1%
Total Child Population 441,591 100%
Those children are served by over 400 traditional and charter public schools. Table 3lviii shows public
school enrollment by grade in Santa Clara County. In addition, over 2,000 licensed childcare centers and
family childcare homes, with a combined capacity of 74,471 children, provide early care and education
and out-of-school time care to children ages 0-12lix.
Table 3: 2020-21 Enrollment by Grade
Grade Enrollment
K 19,111
1 17,893
2 18,175
3 18,706
4 18,832
5 18,867
6 18,305
7 19,626
8 19,695
9 20,745
10 20,744
1311 20,634
12 22,292
Total 253,625
Blood Lead Levels in Children
California has a Childhood Lead Poisoning Prevention (CLPP) Program within the California Public Health
Department (CDPH)lx that provides regular data updates from a statewide BLL testing program,
administered by the California Department of Health Care Services (DHCS), focused on children under
age 6 years who receive services through a publicly funded health program for low-income children.
These programs include Medi-Cal, CHDP, WIC and any federally- or state-funded program that provides
medical services or preventive health care to children in income-eligible families. The most recent report
from the CLPP program includes county-level data from 2016-2018lxi and shows a statewide decline of
over 50% in the number of children under age 6 with BLL above 4.5μg/dL between 2010 and 2018.
Table 4 compares 2018 data from Santa Clara County against statewide averages for the number and
percentage of children under age 6 with BLL below and above a 4.5μg/dL threshold, the number of
children tested, the estimated number of children under 6 enrolled in Medi-Cal, and the estimated total
number of children under age 6. Santa Clara County falls within the bottom third of local health
jurisdictions on this measure.
Table 4: Number and Percentage of Children Under Age 6 With BLL Above 4.5μg/dL
# < 4.5 % < 4.5 # > 4.5 % > 4.5 # Tested # MediCal Total
under 6
Santa Clara County 18,542 98.53% 277 1.47% 18,819 40,116 141,833
California 473,813 98.52% 7,141 1.48% 480,954 1,354,097 2,922,681
The report also includes data on BLL above 9.5μg/dL. Table 5 compares 2018 data from Santa Clara
County against statewide averages for the number and percentage of children under age 6 with BLL
below and above 9.5μg/dL. Santa Clara County falls within the highest quarter of local health
jurisdictions on this measure.
Table 5: Number and Percentage of Children Under Age 6 With BLL Above 9.5μg/dL
# < 9.5 % < 9.5 # > 9.5 % > 9.5 # Tested
Santa Clara County 18,750 99.63% 69 0.37% 18,819
California 479,663 99.73% 1,291 0.27% 480,954
This report also includes zip code level data, however, following the California Health and Human
Services Agency Data De-Identification guidelines (DDG), these data are only available for 7.3% of zip
codes. Four of the 107 zip codes listed in the report are in Santa Clara County and their data are
presented in Table 6.
14Table 6: Child BLL Data for Identified Santa Clara County Zip Codes, 2020 CLPP Report
Zip Code City School District # > 4.5 % > 4.5 # Tested
94087 Sunnyvale Sunnyvale ESD, 23 5.35% 430
Cupertino SD
95014 Cupertino Cupertino SD 13 4.48% 290
95051 Santa Clara Santa Clara USD 18 2.71% 664
95035 Milpitas Milpitas USD 20 2.55% 783
A separate link on the CDPH CLPP web sitelxii with data from 2012 shows data for 20 zip codes in Santa
Clara County with test results for > 250 children. These data are presented in Table 7 and as a map in
Figure 1 (below).
Table 7: Child BLL Data for Identified Santa Clara County Zip Codes, 2012
Zip Code City School District # > 4.5 % > 4.5 # Tested
95112 San Jose San Jose USD 20 4.21% 475
95110 San Jose San Jose USD 10 3.70% 270
95121 San Jose Evergreen SD 9 3.04% 296
95127 San Jose Alum Rock UESD 26 3.02% 862
95050 Santa Clara Santa Clara USD 7 2.75% 255
95035 Milpitas Milpitas USD 9 2.54% 355
95122 San Jose Alum Rock UESD 27 2.48% 1,087
95117 San Jose Moreland SD 9 2.27% 397
95128 San Jose Campbell USD 7 2.12% 330
95116 San Jose Alum Rock UESD 19 1.93% 985
95111 San Jose Franklin McKinley SD 17 1.81% 939
95051 Santa Clara Santa Clara USD 6 1.71% 350
95020 Gilroy Gilroy USD 16 1.68% 954
95148 San Jose Evergreen SD 4 1.51% 265
95125 San Jose San Jose USD 4 1.41% 283
95126 San Jose San Jose USD 4 1.20% 333
95037 Morgan Hill Morgan Hill USD 4 1.08% 369
95136 San Jose San Jose USD 3 0.83% 363
95123 San Jose Oak Grove SD 4 0.77% 520
94086 Sunnyvale Sunnyvale SD 2 0.63% 315
This difference in the number of zip codes reported is notable and may reflect reduced childhood lead
exposure in Santa Clara County. However, there are two alternative explanations. First, the CLPP 2020
report notes a significant drop in the number of children being tested (from 727,042 in 2010 to 528,813
in 2018) and that it is unclear whether this represents fewer children being considered at-risk or fewer
at-risk children being tested. Second, the DDG (first released in 2016) requires masking of data with
fewer than 11 individuals in a celllxiii, which would prevent 70% of the 2012 data from being reported.
Alone, or in combination, reduced testing and suppression of data in cells with a small number of tests
could create the incorrect impression that fewer children are being exposed to lead and that lead
exposure is more geographically restricted than is the case.
15Figure 1: Map of 2012 Child BLL Data in Identified Santa Clara County Zip Codes
Additional limitations to the state’s BLL testing program were highlighted in a recent critical report by
the State Auditorlxiv. Despite a requirement that all children enrolled in Medi-Cal be tested for elevated
blood levels at ages of one and two years, from 2009-10 until 2018-18 almost half the 2.9 million
children eligible received no testing at all and a quarter received only one of the two required tests. At
the time the report was written, DHCS had only recently begun developing performance standards for
the managed care plans that implement Medi-Cal to ensure that the tests were performed. The report is
similarly critical of the work of CDPH in reducing lead exposure. It cites the lack of published reports on
geographic areas where children are at higher risk for lead exposure, that are required by state law, and
lead remediation efforts that focus on homes where children have already been exposed, rather than
proactive efforts. These flaws in the state’s BLL testing, reporting and remediation efforts suggest that
childhood lead exposure may be more common and more widespread than CDPH data indicate.
Schools Near Reid-Hillview Airport
There are five public elementary schools, traditional and charter, in the seven census tracts including
and adjacent to Reid-Hillview Airport (RHV). Four of the schools are in the Alum Rock Union Elementary
School District: A. J. Dorsa Elementary (365 students), Adelante Dual Language Academy (522 students),
Donald J. Meyer Elementary (320 students) and Sylvia Cassell Elementary (336 students). The fifth
school, Katherine R. Smith Elementary (486 students), is in the Evergreen School Districtlxv.
16Figure 2: Public Elementary Schools Near Reid-Hillview Airport
Demographic information for each school and district, using the most recent data available from the
California Department of Education’s Dataquest portal, is presented in Table 8. These data show that
student demographics in the schools in Alum Rock UESD are comparable to the district averages.
Katherine R. Smith Elementary School has larger proportions of low-income, English Learner, and
students with disabilities, and higher absence rates, than the Evergreen School District average.
Table 8: Demographic information for schools near Reid-Hillview Airport
%FRPL %ELL %with %White Avg. Days
Disabilities Absent
ALUM ROCK UNION ESD 76.4 36.5 11.9 1.6 9.4
A.J. Dorsa Elementary 85.2 47.7 10.4 0.5 8.9
Adelante Dual Language Academy 53.1 32.0 7.3 1.7 7.6
Donald J. Meyer Elementary 75.3 35.6 16.3 0.9 9.2
Sylvia Cassell Elementary 80.7 50.6 13.4 0.0 10.1
EVERGREEN SD 24.6 23.9 8.6 4.9 7.0
Katherine R. Smith Elementary 56.8 60.3 16.5 3.5 10.2
17Glossary of Terms
Blood lead level the concentration of lead in a blood sample
Census tract a stable, geographically contiguous area defined by the U.S.
Census to support statistical comparisons over time
Executive function a set of mental skills that include working memory, flexible
thinking, and self-control
Free/Reduced Price Lunch program a Federal program that can be used as a proxy for children living
in low-income families. Eligibility is typically based on a family
income being less than 185% of the Federal poverty level
IQ an intelligence quotient (IQ) is a relative performance measure
on a set of standardized tests designed to measure human
intelligence. An individual’s performance is transformed to a
scaled score on a normal distribution with a mean of 100 and
standard deviation of 15, resulting in approximately two thirds
of the population scoring between IQ 85 and IQ 115
Lead exposure the presence of lead in a person’s blood
Opportunity gap the ways in which race, ethnicity, socioeconomic status, or
other factors perpetuate lower educational aspirations and
achievement for certain groups of students
Reference level the blood lead concentration above which is considered
“elevated” based on population averages, currently 5µg/dL
Tetraethyl lead a lead-based compound added to gasoline to improve
performance of internal combustion engines
18i
“Lead Exposure in Children”. American Academy of Pediatrics. Retrieved from https://www.aap.org/en-
us/advocacy-and-policy/aap-health-initiatives/lead-exposure/Pages/Lead-Exposure-in-Children.aspx on
05/17/2021.
ii
“Protecting Children From Lead Exposure”. Environmental Protection Agency, October 2018. Retrieved from
https://www.epa.gov/sites/production/files/2018-10/documents/leadpreventionbooklet2018-v11_web.pdf on
05/17/2021.
iii
“Low Level Lead Exposure Harms Children: A Renewed Call for Primary Prevention Report of the Advisory
Committee on Childhood Lead Poisoning Prevention of the Centers for Disease Control and Prevention” retrieved
from https://www.cdc.gov/nceh/lead/ACCLPP/Final_Document_010412.pdf on 03/31/2021.
iv
“Toxicological Profile for Lead”. Agency for Toxic Substances and Disease Registry (June, 2020). Retrieved from
https://www.atsdr.cdc.gov/toxprofiles/tp13.pdf on 6/24/2021.
v
“Health Problems Caused by Lead”. The National Institute for Occupational Safety and Health (June 2018).
Retrieved from https://www.cdc.gov/niosh/topics/lead/health.html on 6/24/2021.
vi
“Intellectual Impairment in Children with Blood Lead Concentrations below 10 μg per Deciliter.” Canfield et al.,
(2003) retrieved from https://www.nejm.org/doi/full/10.1056/NEJMoa022848 on 04/01/2021.
vii
“A Prospective Birth Cohort Study on Early Childhood Lead Levels and Attention Deficit Hyperactivity Disorder:
New Insight on Sex Differences.” Ji et al. (2018) retrieved from
https://www.sciencedirect.com/science/article/pii/S0022347618304888?casa_token=03qEmEEhNKkAAAAA:1Qik6
yOH_txPE3Hjih2yAfePy5akuHmvOKVxmA8fcXdmhFooYg3vT1fP7QGdpnYvyRfLWZOD on 04/02/2021
viii
“Prenatal lead exposure and childhood executive function and behavioral difficulties in Project Viva”. Fruh et al.
(2019). Retrieved from
https://reader.elsevier.com/reader/sd/pii/S0161813X19300907?token=094548597103955FBADC96E431E10E82EE
DF3AAA08D2869FDED0828BCBB430224B08C85683764667495E571D4921A5DC&originRegion=us-east-
1&originCreation=20210402221604 on 04/02/2021.
ix
“Cognitive deficits associated with blood lead concentrations< 10 microg/dL in US children and adolescents.”
Lanphear et al. (2000). Retrieved from
https://www.ncbi.nlm.nih.gov/pmc/articles/PMC1308622/pdf/pubhealthrep00019-0027.pdf on 04/02/2021.
x
“Lead Exposure and Student Performance: A Study of Flint Schools.” Sauve-Syed (2017). Retrieved from
https://jesauve.expressions.syr.edu/wp-content/uploads/2017/10/Sauve-Syed-Job-Market.pdf on 04/12/2021.
xi
“The Relationship between Early Childhood Blood Lead Levels and Performance on End-of-Grade Tests. “
Miranda et al. (2007). Retrieved from https://www.ncbi.nlm.nih.gov/pmc/articles/PMC1940087/ on 04/12/2021.
xii
“Lead Remediation: A Surprising Policy Solution for Reducing the Educational Achievement Gap.” Sorenson et al.
(2019). Retrieved from http://wtgrantfoundation.org/lead-remediation-a-surprising-policy-solution-for-reducing-
the-educational-achievement-gap on 04/13/2021.
xiii
“Blood Lead Levels and Learning Disabilities: A Cross-Sectional Study of the 2003–2004 National Health and
Nutrition Examination Survey (NHANES).” Geier et al. (2017). Retrieved from
https://www.ncbi.nlm.nih.gov/pmc/articles/PMC5664703/ on 04/12/2021.
xiv
“Lead Screening During Pregnancy and Lactation”. American College of Obstetrics and Gynecology Committee
on Obstetric Practice (August, 2012). Retrieved from https://www.acog.org/clinical/clinical-guidance/committee-
opinion/articles/2012/08/lead-screening-during-pregnancy-and-lactation on 6/23/2021.
xv
“Lead exposure at each stage of pregnancy and neurobehavioral development of neonates”. Liu et al. (2014).
Retrieved from
https://www.sciencedirect.com/science/article/pii/S0161813X14000473?casa_token=ENVl5jtMIwAAAAAA:nDBXh
17a7NqeEyzyY70Fuc9NZwgrDr1IwZSIQqo0IgL6WmLkNlDRvyMemc96WcDVqoP_Bk-_ on 6/23/2021.
xvi
“Prenatal Methylmercury, Postnatal Lead Exposure, and Evidence of Attention Deficit/Hyperactivity Disorder
among Inuit Children in Arctic Québec.” Boucher et al. (2012). Retrieved from
https://ehp.niehs.nih.gov/doi/full/10.1289/ehp.1204976 on 6/23/2021.
19xvii
“Higher Infant Blood Lead Levels with Longer Duration of Breastfeeding”. Lozoff et al. (2009). Retrieved from
https://www.sciencedirect.com/science/article/pii/S0022347609003795?casa_token=oBx5lslEfykAAAAA:IG8qmoH
On8hAu6AEgf4mFp9Bo4279OmVU5bn2NcgSnyA0me4qwnDsE3Hj0X6yAkl2SUhgAVa on 6/23/2021.
xviii
“Maternal Blood, Plasma, and Breast Milk Lead: Lactational Transfer and Contribution to Infant Exposure”.
Ettinger et al. (2014). Retrieved from https://ehp.niehs.nih.gov/doi/full/10.1289/ehp.1307187 on 6/23/2021.
xix
“Advance Notice of Proposed Rulemaking and Related Materials on Lead Emissions From Piston-Engine Aircraft
Using Leaded Aviation Gasoline”. Environmental Protection Agency (2010). Retrieved from
https://www.epa.gov/regulations-emissions-vehicles-and-engines/advance-notice-proposed-rulemaking-and-
related-materials on 04/13/2021.
xx
“Fact Sheet – Leaded Aviation Fuel and the Environment”. Federal Aviation Administration (November, 2019),
Retrieved from
https://www.faa.gov/news/fact_sheets/news_story.cfm?newsId=14754#:~:text=Although%20there%20are%20var
ious%20ASTM,100%20MON%20avgas%20(100LL).&text=Jet%20aircraft%20and%20turbine%2Dpowered,not%20co
ntain%20a%20lead%20additive on 5/18/21.
xxi
“The Effect of Leaded Aviation Gasoline on Blood Lead in Children”. Zahran et al. (2017). Retrieved from
https://www.journals.uchicago.edu/doi/full/10.1086/691686 on 04/13/2021.
xxii
“Development and evaluation of an air quality modeling approach to assess near-field impacts of lead emissions
from piston-engine aircraft operating on leaded aviation gasoline.” Carr et al. (2011). Retrieved from
https://www.sciencedirect.com/science/article/pii/S1352231011007333?casa_token=rnSjTX3EtogAAAAA:mH1-
W4_ggmug3zFYropLZ55Axi_dU4BXLaK2jA0snjhXrLN0F8-QBRbUrcs5gbGE_-2_YaIN#bib27 on 04/13/2021.
xxiii
“Airports Business Plan Update”. County of Santa Clara (December, 2018). Retrieved from
http://sccgov.iqm2.com/Citizens/FileOpen.aspx?Type=1&ID=10007&Inline=True on 5/18/2021.
xxiv
“Memorandum on Selection of Airports for the Airport Monitoring Study”. United States Environment
Protection Agency (November, 2010). Retrieved from https://www.epa.gov/regulations-emissions-vehicles-and-
engines/epas-data-and-analysis-piston-engine-aircraft-emissions on 6/17/2021.
xxv
“Reference 103282 : Under advisement from December 4, 2018 (Item No. 19): Receive report from Office of the
County Executive relating to a study of the relationship between leaded fuel emissions and blood lead levels of
children in Santa Clara County”. County of Santa Clara (February, 2020). Retrieved from
http://sccgov.iqm2.com/Citizens/Detail_LegiFile.aspx?ID=99861&highlightTerms=%22reid-hillview%22 on
5/19/2021.
xxvi
“Protect Your Family from Sources of Lead”. Environmental Protection Agency. Retrieved from
https://www.epa.gov/lead/protect-your-family-sources-lead#sl-home on 04/12/2021.
xxvii
“Mapping the Average House Age by County”. Retrieved from
https://personalfinancedata.com/2016/09/11/mapping-average-house-age-county/ on 04/12/2021.
xxviii
“Selected Housing Data”. American Community Survey, U. S. Census Bureau. Retrieved from
https://data.census.gov/cedsci/table?q=Housing&g=310M500US41940&tid=ACSDP1Y2019.DP04&hidePreview=tru
e on 07/07/2021.
xxix
“Time to ban lead in industrial paints and coatings”. Gottesfeld (2015). Retrieved from
https://www.frontiersin.org/articles/10.3389/fpubh.2015.00144/full on 07/08/2021.
xxx
“Lead Poisoning Found in Nine Bridge Workers / State officials alarmed by extent of exposure”. San Francisco
Chronicle (10/10/10). Retrieved from https://www.sfgate.com/health/article/Lead-Poisoning-Found-in-Nine-
Bridge-Workers-2734660.php on 07/08/2021.
xxxi
“Lead in Auto Paints”. Australian Government Department of Agriculture, Water and the Environment.
Retrieved from http://www.environment.gov.au/protection/chemicals-management/lead/lead-in-auto-paints on
07/08/2021.
xxxii
“Annual Water Quality Report 2019”. San Jose Water. Retrieved from
https://www.sjwater.com/sites/default/files/2020-04/CCR.pdf on 04/12/2021.
xxxiii
“Annual Water Quality Report 2019”. City of Gilroy Water. Retrieved from http://ca-
gilroy.civicplus.com/ArchiveCenter/ViewFile/Item/577 on 04/12/2021.
20xxxiv
“Soil is an important pathway of human lead exposure.” Mielke and Reagan (1998). Retrieved from
https://www.ncbi.nlm.nih.gov/pmc/articles/PMC1533263/ on 04/12/2021.
xxxv
“Spatial analysis of bioavailable soil lead concentrations in Los Angeles, California”. Wu et al. (2010). Retrieved
from
https://www.sciencedirect.com/science/article/pii/S0013935110000356?casa_token=eAMB_gTxcZcAAAAA:q8YM
2UkeXe5BZn_W3dDNzP8Px1MvN1DQzltEpXijXYlb5zEBd8LqWOD3hHa8U9djSkP0Kw-3 on 04/12/2010.
xxxvi
“Estimation of leaded (Pb) gasoline's continuing material and health impacts on 90 US urbanized areas”. Mielke
et al. (2011). Retrieved from https://pubmed.ncbi.nlm.nih.gov/20825992/ on 04/12/2021.
xxxvii
“Lead (Pb) legacy from vehicle traffic in eight California urbanized areas: Continuing influence of lead dust on
children's health”. Mielke et al. (2010). Retrieved from
https://www.sciencedirect.com/science/article/pii/S0048969710004900?casa_token=ZbhAj8gldAwAAAAA:Un9VX
R6uvOvxl24-HSzbaA78xxwnK-G-jsJ8ZcBTubT96QpetZuPPZbh7Cw2hhZzb2zQHWp9 on 07/08/2021.
xxxviii
EnviroStor Project Search Results from 04/01/2021 using search terms “Santa Clara County”, “Lead”. Retrieved
from
https://www.envirostor.dtsc.ca.gov/public/search.asp?page=1&cmd=search&business_name=&main_street_nam
e=&city=&zip=&county=SANTA+CLARA&status=&branch=&site_type=&npl=&funding=&reporttitle=PROJECT+SEAR
CH+RESULTS&reporttype=&federal_superfund=&state_response=&voluntary_cleanup=&school_cleanup=&operati
ng=&post_closure=&non_operating=&corrective_action=&tiered_permit=&evaluation=&spec_prog=&national_pri
ority_list=&senate=&congress=&assembly=&critical_pol=30013,%2030343&business_type=&case_type=&searchty
pe=&hwmp_site_type=&cleanup_type=&ocieerp=&hwmp=False&permitted=&pc_permitted=&inspections=&com
plaints=&censustract=&cesdecile=&school_district=&orderby=status%5Fdescription
xxxix
“Cortese List Data Resources”. California Environmental Protection Agency. Retrieved form
https://calepa.ca.gov/SiteCleanup/CorteseList/ on 7/08/2021.
xl
“Update: New Jersey Investigation of Artificial Turf and Human Health Concerns”.
New Jersey Department of Health and Senior Services (2008). Retrieved from
https://www.nj.gov/health/ceohs/documents/eohap/haz_sites/regional_state/art_turf/turf_factsheet_update_au
g08.pdf on 04/15/2021.
xli
“Brown Reaches Settlement to Reduce Children's Lead Exposure in Artificial Turf”. Press release from the State of
California Department of Justice (July 16, 2010). Retrieved from https://oag.ca.gov/new-press-
categories/environment?page=7 on 04/15/2021.
xlii
“Prevention of Childhood Lead Toxicity”. American Academy of Pediatrics (July, 2016). Retrieved from
https://pediatrics.aappublications.org/content/138/1/e20161493 on 6/25/2021.
xliii
“Effect of Chelation Therapy on the Neuropsychological and Behavioral Development of Lead-Exposed Children
After School Entry”. Dietrich et al. (2004). Retrieved from
https://pediatrics.aappublications.org/content/114/1/19?ijkey=a0d5ce65e20755e1a8a0a50e23db3c259aa65344&
keytype2=tf_ipsecsha on 6/25/2021.
xliv
Efficacy of Iron and/or Zinc Supplementation on Cognitive Performance of Lead-Exposed Mexican
Schoolchildren: A Randomized, Placebo-Controlled Trial”. Alatorre Rico et al. (2006). Retrieved from
“https://pediatrics.aappublications.org/content/117/3/e518?ijkey=98280c96750786efdcb2db879aa6acae50ae8a4
7&keytype2=tf_ipsecsha on 6/25/2021.
xlv
“Household interventions for preventing domestic lead exposure in children (Review)”. Yeoh et al. (2012).
Retrieved from https://core.ac.uk/reader/143864237?utm_source=linkout on 6/25/2021.
xlvi
17 CA ADC § 37100 retrieved from
https://govt.westlaw.com/calregs/Document/I2D2D9250D60711DE88AEDDE29ED1DC0A?viewType=FullText&origi
nationContext=documenttoc&transitionType=CategoryPageItem&contextData=(sc.Default) on 6/25/2021.
xlvii
“Protect Your Family”. Santa Clara County Public Health Department. Retrieved from
https://publichealth.sccgov.org/health-information/childrens-health/childhood-lead-poisoning-prevention/lead-
faq-protect-your on 07/09/2021.
21xlviii
“Resources for Staying Lead-Safe During COVID-19”. California Department of Public Health (September 30,
2020). Retrieved from https://www.cdph.ca.gov/Programs/CCDPHP/DEODC/CLPPB/Pages/COVIDResources.aspx
on 07/09/2021.
xlix
“IS YOUR CHILD AT RISK FOR LEAD POISONING?”. California Department of Public Health. Retrieved from
https://www.cdph.ca.gov/Programs/CCDPHP/DEODC/CLPPB/CDPH%20Document%20Library/LeadChecklist(En-
Sp).pdf on 07/09/2021
l
“Protect your child from LEAD”. California Department of Public Health. Retrieved from
https://www.cdph.ca.gov/Programs/CCDPHP/DEODC/CLPPB/CDPH%20Document%20Library/ProtectYourChild_En
_Spanish.pdf on 07/09/2021.
li
“Getting your child tested for lead”. California Department of Public Health. Retrieved from
https://www.cdph.ca.gov/Programs/CCDPHP/DEODC/CLPPB/CDPH%20Document%20Library/CLPPB-
TestingCard.pdf on 07/09/2021.
lii
“Sources of Lead”. Centers for Disease Control and Prevention. Retrieve from
https://www.cdc.gov/nceh/lead/prevention/sources.htm on 07/09/2021.
liii
“Lead Poisoning Prevention”. Centers for Disease Control and Prevention. Retrieved from
https://www.cdc.gov/nceh/lead/prevention/default.htm on 07/09/2021.
liv
“Lead Exposure: Steps to Protect Your Family”. American Academy of Pediatrics (14 June, 2017). Retrieved from
https://www.healthychildren.org/English/safety-prevention/all-around/Pages/Lead-Screening-for-Children.aspx
on 07/09/2021.
lv
“Blood Lead Levels in Children: What Parents Need to Know”. American Academy of Pediatrics (30 August 2017).
Retrieved from https://www.healthychildren.org/English/safety-prevention/all-around/Pages/Blood-Lead-Levels-
in-Children-What-Parents-Need-to-Know.aspx on 07/09/2021.
lvi
“Lead in Tap Water & Household Plumbing: Parent FAQs”. American Academy of Pediatrics ( 25 January, 2016).
Retrieved from https://www.healthychildren.org/English/safety-prevention/at-home/Pages/Lead-in-Tap-Water-
Household-Plumbing.aspx on 07/09/2021.
lvii
Child Population, by Age Group and Gender, Year(s): 2020. Kidsdata.org. Retrieved from
https://www.kidsdata.org/region/59/santa-clara-county/summary#6/demographics on 07/07/2021
lviii
“2020-21 Enrollment by Ethnicity and Grade.” California Department of Education. Retrieved from
https://dq.cde.ca.gov/dataquest/dqcensus/EnrEthGrd.aspx?cds=43&agglevel=county&year=2020-21 on
07/07/2021.
lix
Internal communication. Resource and Referral Department, Santa Clara County Office of Education.
lx
https://www.cdph.ca.gov/Programs/CCDPHP/DEODC/CLPPB/Pages/CLPPBhome.aspx
lxi
“California’s Progress in Preventing and Managing Childhood Lead Exposure”. California Department of Public
Health (2020). Retrieved from
https://www.cdph.ca.gov/Programs/CCDPHP/DEODC/CLPPB/CDPH%20Document%20Library/CLPPBReport2020.p
df on 04/13/2021.
lxii
https://www.cdph.ca.gov/Programs/CCDPHP/DEODC/CLPPB/CDPH%20Document%20Library/zip_code_2012_25
0_tested.pdf
lxiii
California Department of Social Services Data De-Identification Reference Guide. California Department of Social
Services (2019). Retrieved from https://www.cdss.ca.gov/portals/9/Data%20De-
Identification%20Guidelines%20DSS%20Reference%20Guide_FINAL.pdf on 04/14/2021.
lxiv
“Childhood Lead Levels: Millions of Children in Medi‑Cal Have Not Received Required Testing for Lead
Poisoning”. California State Auditor (2020). Retrieved from https://www.auditor.ca.gov/pdfs/reports/2019-105.pdf
on 04/15/2021.
lxv
2020-21 student enrollment information retrieved from California Department of Education DataQuest,
https://dq.cde.ca.gov/dataquest/ on 07/19/2021.
22You can also read


