Regulatory Impact Statement - Budget 2015 package to address child material hardship in New Zealand
←
→
Page content transcription
If your browser does not render page correctly, please read the page content below
Regulatory Impact Statement

Budget 2015 package to address child
material hardship in New Zealand

Department of Prime Minister and Cabinet
Ministry of Social Development

Treasury

April 2015
Agency Disclosure Statement
This Regulatory Impact Statement has been prepared by the Department of Prime Minister
and Cabinet, Ministry of Social Development (MSD), and the Treasury, in consultation with
Inland Revenue. It provides an analysis of a package of policy options developed for
Budget 2015 to address child material hardship in New Zealand.

There are a number of factors that influenced the options identified and the shape of the
final package:

   •   The fiscal envelope available for the package was based on Ministerial
       considerations of New Zealand’s current fiscal position and other competing
       priorities. The Government indicated scalable options should be developed within a
       fiscal range for the package of up to $1 billion over four years ($250m per year).
   •   Because the Government’s overall objective was to take more immediate action to
       reduce material hardship amongst children, Ministers signalled an interest in options
       that would relatively quickly improve the material resources available to a family
       through the package. Interventions that address the deeper causes and
       consequences of poverty and hardship would continue to be addressed through the
       wider work of Ministers across Government.
   •   Ministers expressed a strong preference towards options that could be fully
       implemented within a year of announcement in the Budget.

There are a variety of legitimate ways to think about and measure child poverty. The focus
for this package was on children experiencing material deprivation at the more severe end
of the spectrum.

MSD regularly publishes a range of indicators of child poverty, including robust,
internationally credible measures of material hardship. However, while this data is good for
identifying the numbers of children in varying degrees of hardship, and the groups most at
risk, Government policies do not generally target assistance on the basis of direct material
hardship information provided by households. For one thing, such an approach would be
highly intrusive and administratively complex and costly, requiring much more detailed
information from potential recipients than is currently collected. The main direct financial
levers available relate to raising incomes or reducing direct demands on the family budget
through subsidies or services.

This complexity around suitable policy tools meant that officials have used proxies to direct
assistance toward the primary target group. These proxies included benefit status, income,
and other factors. Because there is no single policy instrument that will perfectly hit the
target group, officials have recommended a balance of initiatives to achieve good coverage
of the target group (at the cost of some spill-over to families outside the target group), and
tightly targeted initiatives that provide more assistance but only to small groups in hardship.

This Regulatory Impact Statement assesses the estimated impact of identified options and
of the proposed package. The analysis of the impact on household incomes is, however,
limited in its ability to accurately model at a population level the aggregate impact of the
package. This is because there is no single model that can incorporate and consider all of
the interventions in the package simultaneously. What the analysis does instead, is model
the impacts of the components of assistance in the final package at a population level
separately (with some analysis done across two major components of the package), and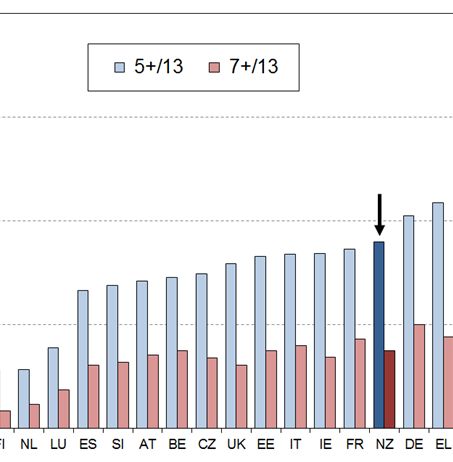
then provides a series of case-study scenarios that illustrate the net impact of the package
for various types of ‘example’ families.

In addition to this impact analysis, MSD will monitor progress in addressing material
hardship for children through MSD’s Deprivation Index (DEP-17), and other measures as
appropriate. The 2017-18 HES will be the first to pick up a full year’s impact of the
package. However, due to the wide range of factors that affect material hardship, it will not
be possible to identify the specific independent impact of this package on levels of material
deprivation.

The changes to regulations required to give effect to most components of this package are
relatively modest, and largely involve changes to rates and thresholds within existing
regulations and legislation.

The changes proposed will not impose additional costs on business, impair private property
rights, market competition, or the incentives on business to innovate and invest, or override
common law principles.

Finally, public consultation on the package was not possible due to Budget secrecy.
However policy responses to child poverty have been widely debated in the public sphere,
particularly through the Children’s Commissioner’s Expert Advisory Group (EAG) on
Solutions to Child Poverty. Agencies involved with the development of the package also
engage on a regular basis with academics, non-government organisations, advocacy
groups, and other key stakeholders on policy responses to child poverty and material
hardship more generally.

Andrew Kibblewhite
Chief Executive
Department of Prime Minister and Cabinet

Brendan Boyle
Chief Executive
Ministry of Social Development

Gabriel Makhlouf
Secretary and Chief Executive
Treasury

                                                                                                3
Table of contents
Agency Disclosure Statement ........................................................................................... 2
Table of contents ............................................................................................................... 4
Status quo and problem definition ..................................................................................... 5
Objectives........................................................................................................................ 14
Options and impact analysis ........................................................................................... 16
Components of the final package .................................................................................... 25
Net impacts of the package ............................................................................................. 27
Consultation .................................................................................................................... 37
Implementation plan ........................................................................................................ 38
Monitoring, evaluation and review ................................................................................... 40
Conclusions ..................................................................................................................... 41
List of figures:
Figure 1: Life for children in the hardship zone ........................................................................ 7
Figure 2: Material deprivation rates for children (0-17 yrs): .................................................... 10
Figure 3: Impact on incomes of the benefit increase.............................................................. 27
Figure 4: Amount gained from the childcare increase ............................................................ 29
Figure 5: Employment rate of mothers: by age group of youngest dependent child .............. 34
Figure 6: Change in employment rate of mothers between 1994 and 2014 .......................... 35
List of tables:
Table 1: Material hardship rates and composition for children in selected groups, using
different material hardship thresholds .................................................................................... 12
[Tables 2 - 7 removed]
Table 8: Average increase for those who gain, by family type ............................................... 28
Table 9: Numbers of families who benefit from main components of the package: ............... 30
Table 10: Numbers of families who are likely to be financially disadvantaged ....................... 30
Table 11: Impact of the package on household budgets ........................................................ 31
Table 12: Costs of the material hardship package ................................................................. 36
Table 13: Implementation costs and proposed timings for the package ................................ 39Status quo and problem definition
The wellbeing of New Zealand’s children across multiple domains is a goal and ongoing
commitment for parents, wider family members, communities, NGOs and governments alike.
Society as a whole invests considerable resources into promoting the healthy development
of each new generation both as a valued outcome in itself and also to “lay the groundwork for
responsible citizenship, economic prosperity, healthy communities and successful parenting
of the next generation”.1
Material wellbeing is one aspect of overall child wellbeing – other domains are generally
taken to include outcomes for physical health and safety, personal development and
education, social and emotional wellbeing. Promoting the material wellbeing of children has
value in its own right and because of its potential impact on other aspects of child wellbeing.
There is a particular public policy interest in children whose material wellbeing is below a
minimum acceptable level – those identified as living in significant material hardship or
deprivation. The Budget 2015 package of initiatives proposes steps to further address child
material hardship, especially for those experiencing more severe hardship.
Household income is often used as an indicator of household material wellbeing. There is no
doubt that income is a very important factor in determining a household’s level of material
wellbeing – especially for those with a minimal stock of basic household goods and
appliances and low or zero cash reserves – but it is not the only factor.
Household Discretionary
income spend / desirable
Resources
available for non-essentials
consumption
Basic needs /
Net worth essentials
(assets less
liabilities)
Other factors Material wellbeing or
eg assistance from outside the household living standards
(family, community, state), high or unexpected
health or debt servicing costs, lifestyle
choices, ability to access available resources
The diagram above provides a framework for thinking through the relationship between
household income, other factors and material wellbeing. For example, it shows how
households with the same income can experience quite different actual day-to-day living
standards because of different asset levels or because of different sets of “other factors”.
1 Shonkoff (2011), “Building a Foundation for Prosperity on the Science of Early Child Development”, Pathways,
Stanford University.
5What is meant by “poverty” and “material hardship”
In the more economically developed countries (MEDCs) poverty is generally understood as
“exclusion from a minimum acceptable way of life in one’s own society because of a lack of
adequate resources”. A household is considered “poor” when its resources are not adequate
to meet its consumption needs for the basics or necessities.
In MEDCs poverty has traditionally been measured using household income as an indicator
of resources with poverty lines set in a variety of ways. In recent years more direct non-
income measures of day-to-day living standards have been developed and are now widely
used to measure hardship (deprivation). “Poverty” is sometimes used as a synonym for
“unacceptably low income”, and sometimes more generally to cover both low income and
material hardship.
Whatever the language used, most would agree that there are children in New Zealand today
whose actual day-to-day living standards are below a minimum acceptable level. It is not just
that these children have less than others who are better off, it is that they are going without
things that the bulk of New Zealand society considers that all children should have and none
should be without.
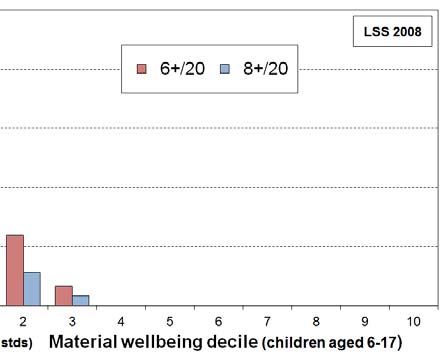
Figure 1 below shows very clearly how different life is for children in households with low
living standards. Households with children are ranked by their material wellbeing (living
standards) from high to low using MSD’s Economic Living Standards Index (ELSI), and the
children from these households are grouped into deciles. Then, for each child in each
household, the number of enforced lacks of basics is counted out of a list made up of 12
child-specific items and 8 general household items not in the index itself.2 The day to day life
experiences of children from poor families / families experiencing material hardship are
typically very different from those of the vast bulk of the children (eg the top 70 to 80%),
whose families report no deprivations at all from the list.
2 Examples of the 12 child specific items are: no waterproof coat, no warm winter clothes, no separate bed,
incomplete school uniform, unable to have friends to birthday party, participation in sport restricted “a lot”
(because of lack of money or the need to use available money for other basics). Examples of the 8 general
household deprivations: inability to keep main rooms warm, dampness and mould a major problem, received
help with food / clothes from a food bank or community group more than once in last 12 months (same
reasons as for child items).Figure 1: Life for children in the hardship
h zone is very different than for the vast majority
m of children: %
with 6+ and 8+ deprivations out off a set of 20 (8 general household, 12 child specific
c)
While the use of material de
eprivation indices as well as income measures is a welcome
advance, there are some fund
damental aspects of the notion of “poverty” th
hat mean that it will
always be an awkward term. For
F example:
• Judgement calls are needed
n to decide where to draw the lines to identify the poor or
those in material hard dship. Different judgements lead to differentt reported levels of
hardship or poverty, th hough the range of plausible thresholds is inn practice relatively
narrow once all the evvidence is considered. This ambiguity can be b dealt with in part
by accepting that pove erty and hardship exist on a spectrum from more
m to less severe,
and by regularly using a range of measures to track progress.
• Whatever else povertyy is understood to be it is in its essence an unacceptable
u state-
of-affairs – it carries with
w it the implication that something should d be done about it.
How best to address child poverty is a vigorously contested are ea where empirical
evidence, social norms, personal values, views on inter-generatio onal equity, political
philosophy and pragm matic compromise all play legitimate parts. Different judgements
on these matters lead to different “solutions” to child poverty.
Rationale for addressing ch
hild poverty and material hardship
While there is a public policcy interest in seeing an overall improveme ent in the material
wellbeing of households of all ages (“raising living standards for all New Zealanders”), there
is a particular interest in impro
oving the lot of children who are living in housseholds where their
material wellbeing is below a minimum acceptable level (ie when “in hardship” or “in
poverty”).
Within the broader context ofo overall child wellbeing, there are three mutually
m reinforcing
reasons for addressing child poverty
p and material hardship:
• to alleviate hardship fo
or children in the ‘here-and-now’
• as an investment to immprove life chances and child wellbeing in oth
her domains
• and to reduce potentia al harm and costs (including economic costs) to society.
7Causes of poverty and hardship
There are many factors that lead to a household with children being “poor” or “experiencing
material hardship”. Causes of poverty and material hardship can be grouped in various ways.
For example, looking at an individual household and its immediate circumstances three types
of cause can be identified:
• the household income is too low, even with good budgeting and discipline
• the special demands on its budget are too high, from things such as: high levels of
debt servicing; high net accommodation costs for renters; unusually high health-
related costs; trying to fill major gaps in the stock of basic household furniture and
appliances; high work-related costs (eg child-care and transport); and so on
• the household’s ability to use its income and other resources efficiently is
compromised by family dysfunction, poor choices, poor mental health or limited skill
sets.
This level of analysis of causes gives some clear pointers for a policy intervention framework.
However, the deeper drivers in behind each of the three types of cause need to be identified
for a proper understanding of the full range of “causes”.
A fuller framework for identifying causes of poverty and hardship is provided in an Appendix.
It underlines the fact that there are a multitude of reasons for families experiencing poverty
and material hardship, going beyond the three household-level aspects above.
In this wider context, causes can be categorised in another way – sometimes referred to as
structural and individual causes. More structural causes range from high housing costs
compared with income, to discrimination, to a constrained supply of suitable jobs that pay
enough to live on, to current settings for main benefit levels and other income support. At an
individual level they can also include low educational attainment, disability and illness, drug
and alcohol abuse, mental health issues, budgeting issues, poor decision making, early
parenthood without a robust support network, and misfortune.
A key driver of child poverty for households with adults on lower wages is too few paid
employment hours in the household to ensure that resources meet needs. Having the
equivalent of one lower-waged adult in full-time employment is not a guarantee that a
household will have sufficient income, even with Working for Families tax credits and the
Accommodation Supplement.
What is the government doing to address child poverty and material hardship?
All governments in MEDCs use a multi-pronged approach to addressing child poverty and
hardship, reflecting the multiple causes outlined above. Governments seek to promote
economic growth across the board and good employment opportunities for all who can be in
paid work. Governments make special efforts to assist unemployed people into paid work.
Substantial resources are committed to achieving good educational and health outcomes for
children in childhood and later, thus improving their life chances of receiving good and
ongoing income from employment as adults.The re-distribution of income through financial support for low-income working families with
children and for those with little or no market income is a central feature of what governments
do to address child poverty and hardship. Governments also provide a range of services,
directly and indirectly, to assist with family dysfunction and other factors, all of which increase
the chances of lower income families experiencing material hardship. Successive New
Zealand governments have used all these elements in their policy suite, and there is no
evidence of New Zealand being an outlier in any of them.
In the 2013/14 financial year, $10.5 billion was spent on welfare benefits and other direct
financial support. This includes $1.3 billion in Sole Parent Support, $2.6 billion on WFF Tax
Credits, $1.1 billion on the Accommodation Supplement, and $186 million on Childcare
Subsidy and OSCAR.
While government policies are a major component of the overall effort to reduce child poverty
and hardship, the work needs the combined resources and energies of parents, wider
families, communities, NGOs and businesses, as well as governments.
What do we know about child poverty and material hardship in New Zealand?
How many children in New Zealand are “in poverty” or “in hardship”?
There is no simple or single figure answer to that question that would command wide respect
and support. As noted above, poverty and hardship exist on a spectrum from more to less
severe. While an element of judgement inevitably comes into all discussions and
assessments of poverty and material hardship, this does not mean that nothing definitive can
be said, nor that any judgement is as good as another. The key to making robust
assessments of the scope of the child poverty or material hardship challenge is to find
relevant reference groups and to apply the same measure to each.
The following summary uses three different reference groups to show how today’s children
are faring, and in that context give an indication of the size of the challenge. The reference
groups are the richer western European countries with whom NZ traditionally compares itself,
earlier cohorts of children in New Zealand in the 1980s, and older New Zealanders today.3
In an international context, New Zealand’s income poverty rates for children are around the
middle of the OECD and the EU rankings using their standard relative income measures.
However, these measures are essentially indicators of income inequality in the lower half of
the income distribution, they do not (indeed cannot) produce international comparisons of the
actual material living conditions that children experience.
3 This summary draws on MSD’s 2014 Household Incomes Report, which is available at
http://www.msd.govt.nz/about-msd-and-our-work/publications-resources/monitoring/index.html and on other
MSD analysis of the 2008 Living Standards Survey
9Using the EU’s 13 item material deprivation index4, New Zealand’s child hardship rate is 18%
using their “standard” threshold (5+/13), a higher rate than almost all the richer western
European nations with which we
w have traditionally compared ourselves (se ee Figure 2 below).
New Zealand also has a relatively high ratio of child hardship rate (1 18%) to population
U’s standard measure. This reflects two facto
hardship rate (13%) on the EU ors:
• The hardship rate for older New Zealanders (aged 65+) ranks Ne ew Zealand with the
best in the EU (3%), and this pulls down the overall population rate
e.
• NZ’s lower GDP per capita (which the relative income povertyy measures do not
reflect in international comparisons).
c
The EU also uses a more strinngent threshold to identify those in “severe material
m deprivation”
(7+/13), and on this measure New Zealand’s child hardship rate is 8%, th he same as the UK,
Ireland and Spain. This is still higher than the overall population rate (6%), but there is no
evidence of New Zealand ha aving a material hardship profile for childrren that is skewed
towards deeper hardship.
Figure 2: Material deprivation rate
es for children (0-17 yrs): New Zealand compared to
o selected European
countries, using the EU’s 13-item index
SE DK NO FI NL LU ES SI AT BE
Sweden Denmark Norwa
ay Finland Netherlands Luxembourg Spain Slovenia Austria Belgium
CZ UK EE IT IE FR DE EL SK PT
Czech Rep UK Estonia Italy Ireland France Germany Greece
e Slovakia Portugal
4 The current official 9 item index is in
i the process of being replaced by the revised and mo
ore robust 13-item
index.Using incomes after adjusting for housing costs and looking just at New Zealand figures,
three findings stand out:
• Poverty and hardship rates for children are much higher than those for older
New Zealanders.
• Using relative measures, child poverty rates over the last two decades have on
average been higher than in the 1980s (roughly double), reflecting the fact that
housing costs for many low-income families are now much higher relative to income.
• Around 40% of children identified as poor come from families with at least one adult
in full time work or self-employed. The issue of “the working poor” is one that most
OECD countries face.
There is evidence from the recent SoFIE-based5 research that highlights that there is a mix
of mobility and immobility for families with children over the seven years of the survey. For
example, 40% of children in families in the lower three deciles in 2002 were in the higher-
income zone seven years later, though 60% remained. Unsurprisingly, the SoFIE research
confirmed other international findings that the longer a family experiences low income, the
higher is their reported material hardship. Overall, the results highlight the important of
focusing on alleviating persistent low income.
Which children are more likely to be in families experiencing more severe hardship?
DEP-17 is a 17 item deprivation index used by MSD for measuring material hardship and for
better understanding which groups of children are experiencing deeper hardship. The left-
hand panel in Table 1 shows the child hardship rates for children in selected groups and
using various hardship thresholds for DEP-17 (7+/17, 8+/17, and so on). The bottom row of
the left-hand panel shows the overall child hardship rates and the corresponding number of
children below various hardship thresholds. For example there are around 100,000 children
(aged under 18 years) who live in families with a hardship score of 9+/17.
The right-hand panel shows the composition of those identified as being in hardship. It
shows, for example, that the bulk of those in deeper hardship are from beneficiary families or
from those moving between benefit and employment. Nevertheless one in three in more
severe hardship are from working families (who received no main benefit income at all).
5 SoFIE is Statistics New Zealand’s longitudinal Survey of Family Income and Employment (2002 to 2009).
11Table 1: Material hardship rates and composition for children in selected groups, using different material
hardship thresholds (Living Standards Survey 2008)
Hardship rates Composition
What % of this group of children What % of all children in
are in hardship? hardship are in this group?
6+ 7+ 8+ 9+ 11+ 6+ 7+ 8+ 9+ 11+
Family type
Sole parent 46 40 32 27 16 48 53 58 65 70
Two parent 17 12 8 5 2 52 49 42 35 30
Benefit/work status (previous 12 months)
Benefit (no move) 61 52 43 35 20 40 44 48 54 55
Some movement 42 35 29 23 13 10 10 11 12 12
Paid work (no benefit income) 15 11 7 5 2 50 46 41 35 33
Ethnicity (children) (total, re-based to sum to 100%)
European 18 14 10 8 3 42 41 37 35 33
Maori 39 33 27 19 11 29 31 33 33 33
Pacific 51 43 36 30 19 20 22 24 28 31
Asian and Other 19 12 8 4 3 9 7 7 6 5
All (0-17 yrs) - % 23 18 14 10 6 39 41 42 47 48
All (0-17 yrs) – numbers 240k 180k 150k 100k 60k
The household incomes of those experiencing material hardship
Household income is an important factor in determining the material wellbeing of a
household. It is however not the only factor, as indicated in the high level framework on the
first page and in the more detailed one in the Appendix.
It is not surprising therefore that the overlap between low-income households and
households experiencing material hardship is much less than 100%. Some income-poor
households do not experience hardship, and similarly some who do experience hardship
have incomes above the usual income poverty thresholds. These differences occur because
of the very different non-income factors and circumstances faced by different households.
Looking at the bottom quintiles (20%) of both low-income households and households in
hardship, the overlap is only around 45%, although for some groups the overlap is higher (eg
around 60-70% for sole-parent households).
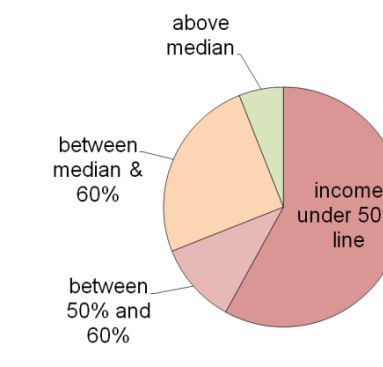
The pie chart below shows the distribution of household incomes (after deducting housing
costs) for the 100,000 children experiencing deeper hardship. Around seven in ten (69%) are
from households whose incomes are below the 60% of median income threshold. A few (6%)
have incomes above the median.The table below shows the pe ercentage overlap between those in hardship and those in four
different income bands. It sho
ows that for those in deeper hardship, the ovverlap with those in
low-income households is higher.
# of deprivations (out of 17) 6+ 7+ 9+ 11+
# of children 240k 180k 100k 60k
Income bands….
under 50% of median AHC line 47 51 58 58
between 50% and 60% lines 9 10 11 12
between 60% line and median 31 29 25 24
above the median 11 10 6 6
Child material wellbeing and
d their wider wellbeing across multiple do
omains
The material wellbeing of ch hildren is one aspect of their more genera
al wellbeing across
multiple domains. When loo oking at material wellbeing for children an
nd wellbeing more
generally, there is clear eviden
nce that:
• emotionally warm, co ognitively stimulating and physically safe home
h environments
matter greatly for posittive child development
• no single factor on itss own determines poorer outcomes for child dren, but rather it is
when multiple challeng ges or disadvantages are faced that poorer outcomes
o are much
more likely
• material wellbeing (in ncluding affordable and good quality hou using), sustainable
employment, good ed ducation, and the development of life skillss all play important
roles in current and futture child wellbeing
• many initiatives to adddress child poverty and material hardship can
n also have a direct
positive impact on othe er dimensions of child wellbeing.
13Objectives
The Government’s overall objective for this package is to take immediate action to reduce
material hardship amongst children, particularly those living in deeper levels of material
deprivation, while taking into account other related policy objectives, including:
• supporting financial incentives and workforce attachment for households with children
• supporting children’s development
• managing fiscal cost and ensuring value for money for tax-payers.
To achieve the stated objectives, a set of criteria has been established to assess the options.
These include:
• effectiveness of targeting: due to the fact that we cannot target directly on the basis of
material deprivation, the key criterion is the extent to which the option achieves a balance
between:
o extent of coverage – portion of children experiencing greater levels of material
hardship affected by the policy change
o depth of impact – how effective the option is in reducing severe material
hardship amongst the group of children it targets
o value for money – coverage and depth of impact relative to the cost of the
intervention, and extent to which the option minimises the spillover of benefits
to families who are not in material hardship.
• impact on work incentives/employment outcomes: the extent to which the option will
promote incentives for beneficiaries to take up and enter employment, or otherwise affect
their employment outcomes.
• timeliness and administrative complexity: the extent to which the option is timely,
efficient and effective to implement, and administratively simple.6
Other key considerations within the context of this package were:
• how quickly each intervention would take effect - Ministers expressed a strong
preference towards options that could be fully implemented within a year of Budget
2015), and;
• the costs of each intervention - the fiscal range for the full package was up to $250m
per year).
6 Part of these criteria will include an assessment of operational costs.• whether there was already work underway or planned by Government agencies in the
same policy area - this became a relevant consideration in terms of whether to
proceed with initiatives and put a premium on ensuring that any changes made as a
part of the package did not cut across other work streams.7
7 Significant examples of this were housing (where it was important that any initiatives that were part of the
package did not cut across the Government’s broader housing reform initiative), and Childcare Assistance
(where it was important to be mindful of initiatives in the Early Childhood Education space - such as the
Advisory Group on Early Learning set up at the end of 2014). In addition there were a number of areas
where it was unlikely that proposals could be developed in time for decisions as part of Budget 15 because
of their complexity or their interaction with other policies (e.g. ideas for the relief of debt to the Government,
or more complicated changes to the Working for Families tax credits).
15Options and impact analysis
This section provides analysis on the broad package of policy options considered to reduce
more severe child material hardship.
Officials considered a wide range of policy options that would quickly improve the
material resources available to a family.
Because the Government’s overall objective was to take more immediate action to reduce
material hardship amongst children in the ‘here and now’, officials focused on policy options
that could be quickly developed to:
• increase a family’s income
• decrease the outgoing demands on a family’s budget
• assist families to manage within the resources that are available to them.
There are a wider range of interventions that would address the deeper causes and
consequences of poverty and hardship. Ministers signalled that these factors would instead
be addressed through wider work across Government.
Ministers indicated a fiscal range for the package of up to but not exceeding $1 billion over
four years ($250m per year), with scope to scale if circumstances require.
In designing the package, officials considered a number of different types of interventions.
These options included:
• increases to incomes through:
o Working for Families tax credits
o benefit rates
• reducing demands on the family budget through:
o increases to the Accommodation Supplement or other support for high
housing costs
o additional assistance with the costs of childcare/early childhood education
(ECE)
o assistance to alleviate problem debt
o assistance with other costs eg through hardship assistance
A number of sub-options were considered in each of these categories, as outlined in the
tables that follow.
Ministers also requested advice on introducing new obligations to promote
employment or parenting that could be introduced alongside these options
Government also requested advice on new work search or parental obligations that could be
introduced as part of any extension in assistance. The primary purpose of these obligations
was to complement any increase in financial assistance by helping to ensure it goes only to
those eligible for it, and to balance increased financial assistance with mutual obligations to
improve income and circumstances. Officials examined a range of options, ranging from
increased work expectations, new requirements to be introduced alongside existing ‘social
obligations’, and measures to ensure entitlement and enhance the integrity of the benefit
system.
[Tables removed]Constructing the package
An important design consideration was how these options could be combined to best
support the overall objective of the package, while also being consistent with other
policy objectives (work incentives, children’s development). In particular, a balance
was needed between providing assistance to those out of work (who comprise a
significant portion of the more materially deprived) and maintaining workforce
attachment and incentives to work, recognising that paid employment is a very
important and sustainable path out of material hardship in most cases.
As we cannot target interventions directly on the basis of material deprivation, in
order to ensure that the package achieved high coverage of materially deprived
children, officials proposed that any package should contain as its ‘centrepiece’ an
option or options for directly increasing incomes for low-income households. Four
main policy ‘levers’ were considered suitable for this:
• Family Tax Credit
• Accommodation Supplement
• benefit rates
• In-Work Tax Credit
With regard to the central, broad coverage options, officials’ view was that:
• There is potential for meaningful increases through the FTC within the fiscal
envelope indicated, but due to these fiscal constraints this is only if they are
weighted towards families with pre-school aged children. Targeting increases
at younger children aligns with evidence that the early years are the most
important for child development, and minimises potential labour market
impacts as this group is typically less responsive to financial incentives.
However the resulting FTC options exclude significant numbers of families
experiencing more severe material deprivation, and would also mean a
household experienced a sudden drop in income once a child turns three
years old.
• Increases to the Accommodation Supplement would be well targeted,
particularly in light of evidence of high levels of housing stress and low
residual incomes amongst families receiving the AS and particularly among
beneficiaries. On the other hand, there remains no clear consensus about the
degree to which increasing AS may result in higher rents generally, and
therefore the degree to which the gains to target families would be eroded.
Changes to AS are also complicated to communicate and take-up is
imperfect.
• An increase in benefit rates is relatively well-targeted to families in material
hardship, but misses working families in material hardship and could reduce
financial incentives to work which in turn would reduce workforce attachment.
• On its own, the In-Work Tax Credit is limited to working families, and not well-
targeted to those in deeper material hardship, as entitlement continues to
families on relatively high incomes.
The issues with increasing benefit rates could in part be addressed by increasing
benefits and the In-Work Tax Credit at the same time, and accompanying the IWTC
changes with an increase to the abatement rate to target the increases to low-income
working families. The option of a benefit increase and an IWTC increase has bettercoverage of families in deeper material hardship than the FTC options, is simpler to
communicate and avoids the risk of landlord capture. Any concerns about incentives
and workforce attachment could be further ameliorated by other options, namely
increases to childcare assistance and an expansion of work search obligations for
beneficiaries.
Mutual obligations
In considering greater work search obligations for beneficiaries, officials’ preferred
approach was a combination of stronger obligations and measures to ensure people
are receiving the right support. This includes:
• Applying work availability obligations to parents on benefit when their
youngest dependent child turns 3 (currently they apply when the youngest
dependent child is 5). This aligns with expectations about children’s
participation in ECE, reflects patterns in the wider labour market, and targets
a group who have responded well to work preparation support to date.
• Increasing the base part-time work-test requirement from 15 to 20 hours per
week, while retaining the ability for case managers to exercise some
flexibility around suitable employment and the exact hours of work that are
required, to fit with what is available, and what is suitable for a client’s
circumstances. At 20 hours work a week, sole parents are generally better off
leaving benefit, because they become eligible for Working for Families tax
credits.
• Introducing an annual benefit reapplication for SPS clients. This provides an
opportunity to check clients are receiving the right support and are accessing
relevant services to help them to meet their obligations.
Changes to parental obligations were considered across a range of areas and were
ultimately rejected.
Childcare
Greater Childcare Assistance for working families was seen as a critical part of the
package as it would reduce pressure on family budgets, align with the work
expectations for beneficiary parents, and improve labour market outcomes. It would
also allow children to be exposed to quality childcare and ECE, which has proven
benefits, in particular for children from disadvantaged families.
To ensure increases were well targeted at those in deeper material hardship, and to
fit within the fiscal envelope of the package, officials examined various options for a
new lower-income threshold and higher assistance rate.
Officials identified a possible risk of childcare providers responding by increasing
prices and ‘capturing’ the gains for families. These risks were lower with options that
were more targeted and/or did not attempt to meet the full cost of childcare.
More targeted measures
Officials also considered a range of more targeted options. While not having the
same breadth of coverage (ie some in material hardship would miss out), these
23options could achieve good levels of assistance, with relatively low spillover to
groups not in material hardship. These were however ultimately discounted for
different reasons:
• Some of the lower cost, more targeted AS options could also have been
included in the package, but concerns about the risk of landlord capture of the
assistance and fiscal cost led to them being set aside.
• Officials also considered that additional SNGs for newborns and school-costs
should be included as they directly provide essential items for children from
the poorest families. However, they were ultimately set aside because of
fiscal cost, and concerns about the inability to implement them before
November 2016. In addition, there are already a wide range of SNGs in
existence.
• As longer-term work on the prevention of debt was being progressed by other
Ministers, officials considered proposals for public debt forgiveness. However,
all the conceivable options were unable to be ready in time for Budget 2015.
They were also likely to be administratively complex and involve significant
moral hazard and equity issues. On balance, officials recommended
addressing debt through preventive work instead.Components of the final package
The main components of the final package are:
• an increase of $25 per week (after tax) in benefit rates for families with children,
giving 108,000 beneficiaries an average gain of $23.10, and 26,000 working
families an average gain of $7.76 (due to consequential impacts on other
assistance)
• increases to incomes for low-income working households through Working for
Families, including a $12.50 per week increase in the $60 rate of the IWTC,
benefiting approximately 203,000 families with an average weekly in-the-hand
gain of $8
• an increase in the abatement rate for Working for Families tax credits of 1.25
percentage points, to 22.5%, to better target these payments towards low-income
families
• increases to childcare assistance for low-income working families, by introducing
a new lower income threshold combined with a higher assistance rate, providing
18,000 families on average an additional $22.96
• an expansion of work availability obligations for beneficiary parents, by:
• lowering the age of the youngest child point at which beneficiaries’ part
time work search obligations begin from five to three years
• changing the hours of the part-time work sought from 15 to 20 hours a
week (while retaining discretion around the exact hours required)
• introducing a requirement for Sole Parent Support recipients to reapply
for the benefit and reconfirm eligibility on an annual basis
There are also a range of consequential changes that will occur as a result of these
new policy settings, including:
• an increase of around $12 to the Minimum Family Tax Credit to retain the
margin between benefit and work for around 4,000 people
• changes which occur as a result of the formula used to calculate
Accommodation Supplement entitlement, as the entry threshold and the
abatement threshold are both linked to the benefit rate
• an increase in the rent that social housing tenants receiving a benefit will pay8
• an increase to Student Allowances of $25 for those with children, to match the
benefit increase
• a number of other smaller flow-on changes, including:
• adjustments to Temporary Additional Support
8 The Income Related Rent charged to social housing tenants is set at 25% of their income up to a
threshold based on New Zealand Superannuation rates. An increase in benefit rate will therefore result
in an increase in the Income Related Rent that social housing tenants who are in receipt of a main
benefit are charged. For a person receiving only benefit income, the rent increase would be $6.25. The
increases are expected to result in savings of $22.968 million over four years to the appropriation for
providing “Part Payment of Rent to Social Housing Providers.”
25• small increases in child support payments for some working parents
that are liable
• adjustments to rates of supplementary assistance that are linked to
benefit rates – such as drought assistance to farmers and bridging
finance for people entering work
• a reduction in TAS for a small number of recipients.
The package also contains changes and small funding bids to manage some of the
flow on effects of the core options and support the implementation of the package.
The additional changes include:
• increases to Out of School Care and Recreation Programme funding for
providers as a result of cost pressures for providers caused by increased
demand as a result of the CCA increase
• a transitional payment for a small number of households who will be financially
disadvantaged as an unintended consequence of the package
• adjustments to the income thresholds used to determine eligibility for the
Community Services Card.9
9 The Community Services Card thresholds include the In Work Tax Credit as income, and without
these changes some families who receive a boost in income through this package would lose eligibility
for the Card. The package therefore includes an increase to the relevant thresholds by the same amount
as the In Work Tax Credit increase. As these increases are designed to retain the current population
eligible for the Card, they are not expected to have any significant impact on household resources, nor
any fiscal costs.Net impacts of th
he package
The following section analyses the impacts of the package, with a parrticular focus on
the impact on household incomes, and on measured material hardship p.
The analysis begins with distributional analyses of each component of the package
on its own, and then considers the net impact of the changes in combination.
Benefit increase
ncrease, 108,000 families with children on benefit
Due to the $25 benefit in b will gain
$23.10 per week on averaage, with most receiving $20-$30 extra from the
t increase.
Due to the flow-through effects
e of the increase in benefit rate, aroun
nd 26,000 non-
beneficiaries will also see
e average gains in weekly income of $7.76.. This is mainly
due to the impact on the formula used to calculate Accommodatio on Supplement
hreshold and the abatement threshold are bo
entitlement, as the entry th oth linked to the
benefit rate.
As a result of the benefit rate change, around 4,000 non-beneficiary households will
see a small decrease in weekly
w income from the Accommodation Su upplement, as a
result of the increased enntry threshold (many of this group will, howe
ever, be eligible
for the In-Work Tax Creditt or Childcare Assistance, and receive an ove
erall increase in
income as a result).
Figure 3: Impact on incomees of the benefit increase (including impact on
n
supplementary benefit asssistance)
* Many of this group
p will, however, be eligible for the increases through the IWTC
C and/or CCA
Table 8 (below) shows th hat sole parent families will benefit more tha
an couples from
the benefit increase. Thiss is consistent with the objectives of the paackage, as sole
parent families are at grea
ater risk of experiencing more severe hardshiip.
27Table 8: Average increase for those who gain, by family type
Family type No. of children No. of families Average gain per family type
Couple 1 8,593 $14.36
2 8,376 $13.35
3 3,977 $14.72
4+ 2,805 $16.95
Sole parent 1 55,846 $21.58
2 32,824 $20.56
3 13,087 $21.70
4+ 6,932 $22.85
Increases to Working for Families tax credits
Officials have modelled the impacts of increasing the base rate of the In-Work Tax
Credit from $60 to $72.50 a week, and increasing the abatement rate for Working for
Families tax credits from 21.25 to 22.5c/$1.
According to information from Treasury’s micro-simulation model Taxwell, the
changes will mean approximately 203,00010 families will gain more through Working
for Families, with an average gain of $8. Families on lower incomes gain more on
average from the In-Work Tax Credit changes than those on higher incomes (due to
changes in the abatement settings). For example, families earning under $50,000 per
year gain an average of $10 per week, while those earning over $75,000 per year
gain an average of $2 per week.
Officials have used administrative data from Inland Revenue to estimate the number
of financially disadvantaged households, They estimate that there is a group of
around 18,000 medium and high income families who are likely to be financially
disadvantaged.
There is also a further group of up to around 10,000 families who could potentially
have a small increase or decrease in weekly incomes as a result of the package.
These households earn over the abatement threshold of $36,350 and have partial
year entitlement to the IWTC (they will gain or lose depending on whether the IWTC
increase outweighs the loss from the higher abatement)
Information from Taxwell also indicates that this group of 10,000 families are not
likely to be a significant contributor to the numbers of financially disadvantaged
families. This suggests that the actual number of disadvantaged families is likely to
be closer to 18,000.
10 These results were modelled in Treasury’s microsimulation model, Taxwell, based on the Household
Economic Survey. Access to the Household Economic Survey data was provided by Statistics New
Zealand under conditions designed to give effect to the security and confidentiality provisions of the
Statistics Act 1975. The results presented here are the work of Treasury, not Statistics New Zealand.Increases to childcare as
ssistance
The average weekly ga ain across all eligible households receivving Childcare
Assistance (childcare subsidy or out of school care and recreation sub
bsidy) is $22.96
per week. The total numb ber of households that benefit from the policy change at a
point in time is around 18,000.
Figure 2 (below) shows how h the gains from the childcare assistancce changes are
distributed. The larger gains accrue to people with more than two child
dren.
Figure 4: Amount gained frrom the childcare increase
29Summary of impact
The table below summarises how the different components of the package will
benefit families.
Table 9: Numbers of families who benefit from main components of the package:
Intervention Number who will benefit Average gain per
week
Benefit rate increase for families with children 108,000 beneficiary families with children $23.10
26,000 working families with children $7.76
In Work Tax Credit increase 203,000 working families with children $8.00
Increase to childcare assistance 18,000 working families with children $22.96
Automatic adjustment to Minimum Family Tax Credit 3,500 working families with children $12.00
Table 10: Numbers of families who are likely to be financially disadvantaged
Household characteristics Number of Reason
families
Families who receive WFF tax credits and earn over 13,700 The abatement rate increase more than offsets
around $88,000 per year the increase in the In-Work Tax Credit.
Families who do not receive IWTC or benefit, but are 4,500 The abatement rate increase will reduce their
eligible for the FTC and earn over the abatement Family Tax Credit, but they will not receive any
threshold of $36,350 per year. increase from the In-Work Tax Credit or
benefit rate rises.
Across the benefit and Working for Families changes, families that are financially
disadvantaged will see an average reduction in assistance of around $4 per week.Aggregate net impact by family type
Because an overall distributional analysis of the aggregate (‘net’) impacts of the
package is not possible, the approach taken in this RIS is to model the net impacts
on the level of individual families. We have modelled the net impact for different
family types in the hypothetical scenarios in table 11 below. In all cases, the wage
rate is assumed to be $15 per hour and the family is based in South Auckland,
paying a close to median rent for suitably sized accommodation. The table illustrates
the impact of the package both by component of the package, and overall.
Table 11: Impact of the package on household budgets
Family type Couple with 4 children Couple with 2 children (ages Sole parent with 2 children
(ages 16, 14, 4 & 2) 10 & 8) (ages 8 & 4)
Employment 40 hrs 40 hrs + 20 Job 20 hrs + 40 hrs + Sole Sole 30 hrs
hours/benefit hrs Seeker 20 hrs 20 hrs Parent Parent
type Support Support Support
Accommodation Private Private Private Private Private Private Social Private
type rental rental rental rental rental rental (IRRS) rental
Benefit +$25.00 +$25.00 +$25.00
In Work Tax +$12.50 +$12.50 +$12.50 +$12.50 +$12.50
Credit
Minimum Family +$12.00
Tax Credit
Family Tax Credit -$2.52 -$2.52
Accommodation +$5.00 +$9.00 +$5.00 +$9.00
Supplement
Income Related -$7.56
Rent Subsidy
Temporary -$7.50 -$7.50
Additional
Support
Childcare +$30.60 No +$20.40
Assistance change
Net increase in $17.50 $49.58 $17.50 $17.50 $18.98 $17.50 $17.44 $44.90
household budget
31Estimated impact of the package on measured material hardship
Based on the measured impact of the introduction of the Working for Families (WFF)
package from 2004 to 2008, the impact of the proposed package is likely to be of the
order of a one percentage point reduction using the more severe hardship threshold
of 9+/17 (10% hardship rate).
A one percentage point decrease from a base of 10% (~100,000 children) drops the
rate to 9% (90,000), a 10% reduction in the numbers. This is an order of magnitude
estimate only, not a precise modelled figure.
The impact for many individual recipient families will be significant, and their average
depth of hardship will decrease, even if the improvements do not get them all over
the line for headcount purposes.
While the overall impact of this package on survey-based measures is likely to be
small in the first year, the cumulative impact over time will be greater. In addition
there are longer-term changes that will also have a positive cumulative impact. For
example: a growing economy; an improving labour market; and extra support for sole
parents moving into employment will all help. MSD’s ongoing reporting on trends in
low-income (poverty) rates and hardship rates will reflect this cumulative impact
rather than the impact of the separate components.
Effects on labour market participation
There are a range of factors that can affect an individual’s employment decisions (to
enter work, remain in work, or to work more or fewer hours). These include:
• the financial return from work
• in-work costs such as childcare and transport, which reduce the financial
return from work
• the availability of jobs and the nature of those employment opportunities (e.g.
temporary or zero hour contract jobs are unlikely to be suitable for sole
parents)
• the support that is available out of work
• individual preferences, particularly caring and family responsibilities
• the presence of barriers to work (e.g. childcare availability).
For people receiving a benefit, the presence or absence of work search obligations,
and other requirements associated with benefit recipient, can also add a “push” factor
toward employment.
While the financial return from work and the support available while on benefit can
affect work decisions, often people have imperfect information, and signals can also
have a strong (but often temporary) impact on behaviour.
There is a robust international literature on the impact of financial incentives and
other factors on work decisions. In a nutshell, the evidence suggests that financial
incentives to work are correctly viewed as just one factor that affects work decisions,
and while they can impact those decisions, the impacts are usually modest, withYou can also read