Economic recovery after disaster strikes - volume two - When communities face flood, fire and hail - Suncorp Group
←
→
Page content transcription
If your browser does not render page correctly, please read the page content below
Economic recovery after
disaster strikes - volume two
When communities face flood, fire and hail

A REPORT FOR SUNCORP
                                             Economic recovery after disaster strikes - volume two   1
© SGS Economics and Planning Pty Ltd 2020

This report has been prepared for Suncorp. SGS Economics and Planning has taken all
due care in the preparation of this report. However, SGS and its associated consultants
are not liable to any person or entity for any damage or loss that has occurred, or may
occur, in relation to that person or entity taking or not taking action in respect of any
representation, statement, opinion or advice referred to herein.

SGS Economics and Planning Pty Ltd ACN 007 437 729
www.sgsep.com.au

Offices in Canberra, Hobart, Melbourne, and Sydney, on Ngunnawal, muwinina,
Wurrundjeri, and Gadigal Country
Contents

Glossary											                                             5

Executive Summary									                                      6

01 Introduction										                                       8

02 Economic modelling								                                   10

03 Disaster case studies								                                14

3.1 Disaster Recovery									                                  14

3.2 Townsville Floods (January 2019)						                      16

3.3 Black Summer bushfires (December – January 2020)			         22

3.4 East Coast Hailstorms (multiple states) (January 2020)			   31

04 Conclusion										                                         37

Appendix A											                                           38
List of figures
FIGURE 1: SCALE OF DISASTER BASED ON TOTAL INSURED LOSSES AND NUMBER OF CLAIMS1 		      9
FIGURE 2: ECONOMIC MODELLING OVERVIEW							                                            11
FIGURE 3: PHASES OF RECOVERY FOLLOWING A DISASTER						                                 15
FIGURE 4: TOWNSVILLE FLOOD-AFFECTED AREAS							                                        17
FIGURE 5: ECONOMIC IMPACT OF TOWNSVILLE FLOODS – GROSS DOMESTIC PRODUCT ($ BILLION)		   18
FIGURE 6: ECONOMIC BENEFIT OF INSURANCE FROM THE TOWNSVILLE FLOODS				                  19
FIGURE 7: ECONOMIC IMPACT OF TOWNSVILLE FLOODS ON GDP – TOWNSVILLE SA3			               19
FIGURE 8: MAP OF SUNCORP CLAIMS & RECOVERY ACTIVITY – TOWNSVILLE FLOODS			              20
FIGURE 9: SUNCORP CLAIMS & RECOVERY ACTIVITY – TOWNSVILLE FLOODS				                    20
FIGURE 10: SUNCORP CLAIMS & RECOVERY ACTIVITY BY BRAND – TOWNSVILLE FLOODS			           21
FIGURE 11: BLACK SUMMER FOREST FIRE DANGER INDEX (FFDI) LEVELS					                     23
FIGURE 12: FIRE STATISTICS FROM BLACK SUMMER BUSHFIRES						                            23
FIGURE 13: ECONOMIC IMPACT OF BUSHFIRES – GROSS DOMESTIC PRODUCT ($ BILLION)			         25
FIGURE 14: ECONOMIC BENEFIT OF INSURANCE FROM THE BUSHFIRES					                        27
FIGURE 15: ECONOMIC IMPACT OF BUSHFIRES ON EAST GIPPSLAND GDP ($ BILLION)			            27
FIGURE 16: ECONOMIC IMPACT OF BUSHFIRES ON SHOALHAVEN GDP ($ BILLION)			                27
FIGURE 17: ECONOMIC IMPACT OF BUSHFIRES ON SOUTH COAST GDP ($ BILLION)			               27
FIGURE 18: SUNCORP CLAIMS & RECOVERY ACTIVITY – BUSHFIRES					                          28
FIGURE 19: SUNCORP CLAIMS & RECOVERY ACTIVITY BY BRAND – BUSHFIRES				                  28
FIGURE 20: MAP OF SUNCORP CLAIMS & RECOVERY ACTIVITY – BUSHFIRES				                    29
FIGURE 21: MAP OF SUNCORP CLAIMS & RECOVERY ACTIVITY – BUSHFIRES – NSW SOUTH COAST		    29
FIGURE 22: BREAKDOWN OF TOTAL INSURANCE CLAIMS BY STATE					                            32
FIGURE 23: ECONOMIC IMPACT OF HAILSTORMS – GDP ($ BILLION)					                         33
FIGURE 24: ECONOMIC IMPACT OF HAILSTORMS – GDP ($ BILLION) – ACT AND MELBOURNE		        33
FIGURE 25: SUNCORP CLAIMS & RECOVERY ACTIVITY – HAILSTORMS					                         34
FIGURE 26: SUNCORP CLAIMS & RECOVERY ACTIVITY BY BRAND – HAILSTORMS				                 34
FIGURE 27: MAP OF SUNCORP CLAIMS & RECOVERY ACTIVITY – HAILSTORMS, VICTORIA			          35
FIGURE 28: MAP OF SUNCORP CLAIMS & RECOVERY ACTIVITY – HAILSTORMS, ACT			               36
FIGURE 29: MAP OF SUNCORP CLAIMS & RECOVERY ACTIVITY – HAILSTORMS, QUEENSLAND		         36
FIGURE 30: OVERVIEW OF MODELLING FRAMEWORK							                                       38

List of tables
TABLE 1: DISASTER ECONOMIC MULTIPLIERS								                                          12
TABLE 2: REGIONAL ECONOMIC MULTIPLIERS FOR EACH INSURANCE PAYMENT TYPE			               13
Glossary

Term                          Definition                                                                                                               Abbreviation

Australian Statistical        The Australian Statistical Geography Standard is the Australian Bureau of Statistics' geographical
                                                                                                                                                       ASGS
Geography Standard            framework.

Bureau of Meteorology         The Bureau of Meteorology is Australia's national weather, climate and water agency                                      BOM

CBD                           Central Business District                                                                                                CBD

Gross Domestic Product        Is the measure of income generated by an economy.                                                                        GDP

Natural Disaster Relief and   Through the NDRRA, the Australian Government provides financial assistance directly to the states to
                                                                                                                                                       NDRRA
Recovery Arrangements         assist them with costs associated with certain disaster relief and recovery assistance measures

Statistical Areas             Statistical Areas (1,2,3 or 4) are geographic units defined by the Australian Bureau of Statistics.                      SA

Suncorp insurance             Refers to all brands including: AAMI, GIO, Suncorp Insurance, Vero, Apia, Shannons, CIL and Bingle                       ..

UTAS                          University of Tasmania                                                                                                   UTAS

                                                                                                                  Economic recovery after disaster strikes - volume two   5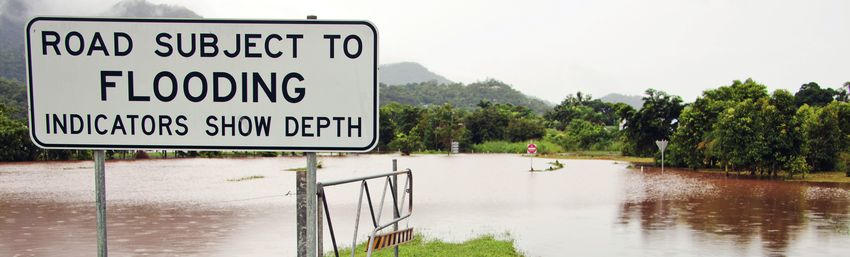
Executive Summary

Three economies impacted by recent natural                       Insurance provides a way to mitigate the adverse economic      Insurance plays a significant role in mitigating adverse
disasters had an estimated $4.0 billion economic                 impact of natural disasters. The income from insurance         outcomes and helping to restore normal economic
                                                                 payments helps to stabilise the economy following the          activities, particularly in regional areas which have a
boost from insurance claims and recovery activity.               initial shock from the disaster, and the economic stimulus     narrower economic base (often dominated by capital-
The Townsville floods, Black Summer bushfires,                   from claims payments and recovery activity promotes            intensive sectors like resources and agriculture) and have
and East Coast hailstorms across multiple states                 a quicker return to normal economic activity. Without          limited employment opportunities compared to larger
                                                                 insurance, a regional economy may never fully recover          urban areas.
had a devastating – and potentially permanent                    from a natural disaster as damage leads, in some cases, to a
– effect on local economic activity. This report                 permanently impaired productive capacity in the long term.     The Black Summer bushfires and East Coast hailstorms
considers what role insurance played in restoring                                                                               case studies confirm this finding. The economic impact of
                                                                 As an example, the economic impact of the Townsville           the bushfires is estimated to be $4.6 billion, or a 1.8 per
local economic activity and reducing the long-                   floods in 2019 was estimated to be a $2.5 billion reduction    cent reduction in the affected regions GDP. Following the
term impacts of these natural disasters.                         in Gross Domestic Product (GDP). This represents a             bushfires, as of August 2020, the insurance industry had
                                                                 0.8 per cent decrease in GDP of the areas impacted by          paid out $2.4 billion, $244 million of which has been paid
This report examines three severe natural disaster events        the Townsville floods. The 2019 GDP of communities             out by Suncorp and its brands on insurance claims and
in Australia between 2019 and 2020: the Townsville floods,       significantly impacted by flooding, such as the Townsville     recovery activity. These insurance payments across the
Black Summer bushfires, and East Coast hailstorms. Events        urban area, would have been reduced by as much as 20 per       industry have helped to add $2.5 billion (1 per cent) to the
of this kind are becoming increasingly common and present        cent without the recovery aided by insurance payouts.          affected local economies and reduced the economic impact
a real challenge for communities across the country. Natural                                                                    of the bushfires.
disasters damage and destroy homes, business premises,           During 2019, the claims and recovery activity from the
vehicles and essential infrastructure. They also destroy         insurance industry boosted the economy by over $1.4            Following the East Coast hailstorms in January 2020, as
crops and physical capital, close businesses, and disrupt        billion, compared to a scenario of no insurance payments       of August 2020, the insurance industry had paid out $1.6
normal economic production as workers cannot get to work         (0.4 per cent). In the following year, an additional $0.9      billion, including $370 million paid out by Suncorp through
or access required materials, leaving factories to sit idle.     billion was added to GDP (0.3 per cent). The cumulative        claims and recovery activity. Motor claims accounted for
                                                                 economic impact from insurance payments being injected         over 60 per cent of Suncorp claims, and building claims
                                                                 into the local economy over three years from 2019 to 2021      accounting for 34 per cent. The claims and recovery activity
                                                                 is estimated to be $2.9 billion.                               payments by the insurance industry boosted the economy
                                                                                                                                of the affected areas by over $1.4 billion in 2020.

6        Economic recovery after disaster strikes - volume two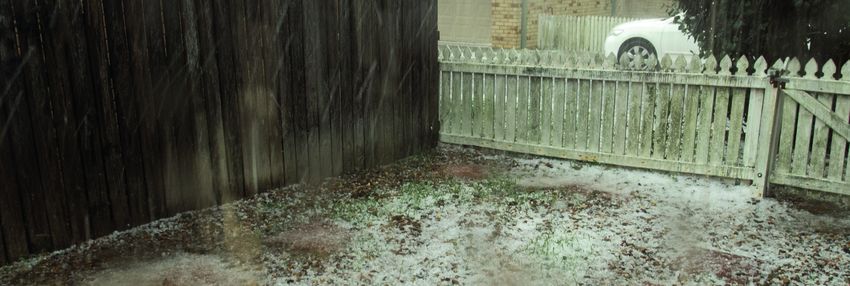
KEY FINDINGS
Without insurance, some communities will never recover from a natural
disaster.

This is especially the case in regional Australia, where there is increased risk of
disasters and communities have a narrower economic base.

Insurance helps to stabilise the economy following the disaster, and the
economic stimulus promotes a more rapid return to normal economic activity.

KEY STATISTICS

Initial GDP contribution from total insurance payments being injected into the
local economy is $4.0 billion.

•   Townsville floods $1.4 billion.
•   Black Summer bushfires $1.2 billion.
•   Hailstorms $1.4 billion.

Cumulative GDP contribution over 3 years is $6.8 billion.

•   Townsville floods $2.9 billion.
•   Black Summer bushfires $2.5 billion.
•   Hailstorms $1.4 billion.

WORST IMPACTED COMMUNITIES

•   Townsville (QLD) 20% reduction in GDP in 2019 from the Townsville floods
•   East Gippsland (VIC) 19% reduction in GDP in 2020 from the summer
    bushfires
•   Shoalhaven (NSW) 12% reduction in GDP in 2020 from the summer
    bushfires
•   South Coast (NSW) 12% reduction in GDP in 2020 from the summer
    bushfires
•   Adelaide Hills (SA) 3% reduction in GDP in 2020 from the summer bushfires
•   Boroondara and Stonnington (VIC) 2% reduction in GDP in 2020 from the
    hailstorms
                                                                                      Economic recovery after disaster strikes - volume two   7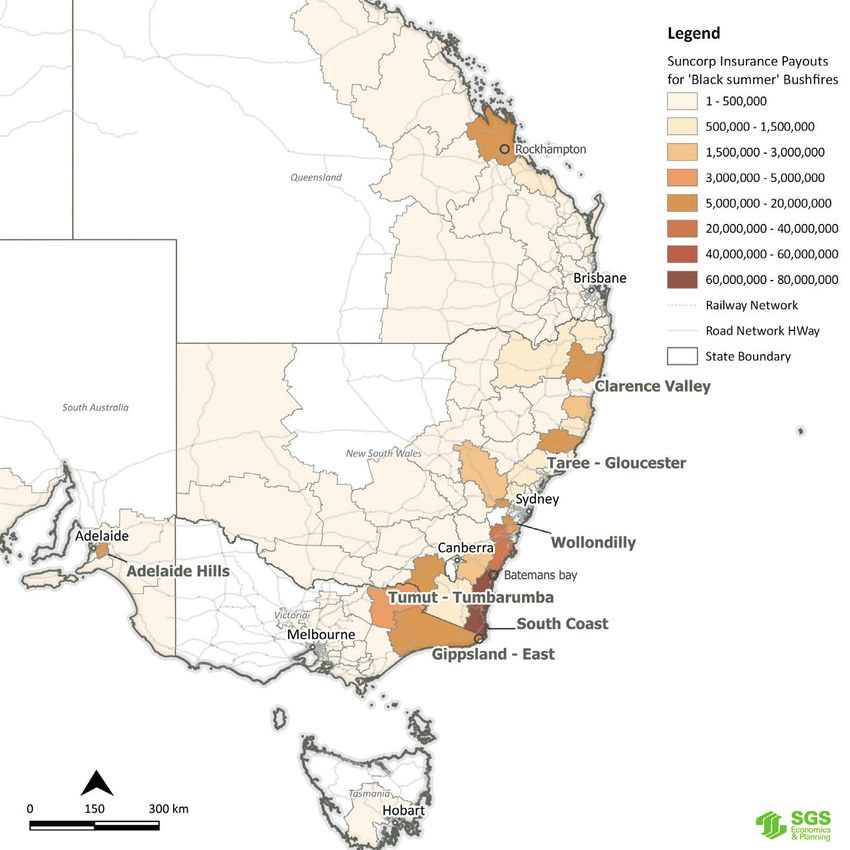
01 Introduction
Insurance provides communities with the                          Australia’s economic performance could be undermined by         Figure 1 shows the total insured losses for each disaster and
resilience to deal with natural disasters. This is               the increasing prevalence and severity of natural disasters.    the number of claims lodged across all insurance providers.
                                                                 Household and business insurance, along with mitigation         The Insurance Council of Australia (ICA) estimated the cost
particularly important in areas of high economic                 strategies, provide communities with the resilience to deal     of insurance claims from the summer bushfires was $2.4
activity or low socioeconomic status exposed to a                with natural disasters. This is especially important in areas   billion, with over 38,000 claims lodged. The estimated cost
high level of risks from natural hazards.                        of high economic activity or low socioeconomic status           of insurance claims for the East Coast hailstorms was $1.6
                                                                 exposed to a high level of risk from natural hazards.           billion, with 125,000 claims lodged. For the Townsville
Natural disasters, such as bushfires, floods, and tropical                                                                       floods in 2019, the estimated cost of insurance claims was
cyclones, are an enduring part of the Australian                 This report considers the economic impacts of natural           $1.3 billion, with over 30,000 claims lodged.
environment. They are a traumatic experience for the             disasters and the benefit that insurance played over 2019-
community and harm the local economy by destroying and           2020 by assessing three severe natural disaster events:         These three events were selected as they vary in geography,
damaging homes, business premises, and economic and                                                                              demographics, the type of impact, the magnitude of
social infrastructure.                                           •   Townsville floods: January 2019                             insured losses and claims lodged, and are major disasters
                                                                 •   Black Summer bushfires: December-January 2020               that have occurred within the last 18 months. Considered
In addition to the loss of physical capital, natural disasters   •   East Coast hailstorms (multiple states): January 2020       together, they provide a useful comparison of the economic
disrupt the normal economic production within a region.                                                                          impact of disasters based on size, type of impacts (e.g.
Retail businesses are closed, workers cannot get to the          Events of this kind are becoming increasingly common            property, motor or business), urban versus rural, and
office, crops are destroyed, and factories sit idle without      and present a real challenge for communities across the         densely populated versus more sparsely populated areas.
raw material. Depending on the scale of the natural disaster,    country. This report builds on previous work examining
people may choose to leave a region rather than rebuild.         the impact of Cyclone Debbie in 2017, the Tathra bushfires      Suncorp is one of Australia’s largest general insurance
This loss of population then impacts on the productive           and the Hobart floods in May 2018. There were common            companies, with over eight million customers across
capacity of the economy.                                         findings between the studies on the importance of income        Australia. Its brands include AAMI, GIO, Suncorp Insurance,
                                                                 from insurance payments helping to stabilise the economy        Apia, Shannons, Vero, CIL and Bingle. Suncorp provided
                                                                 following the initial shock from the disaster.                  support for customers affected by the three natural disaster
                                                                                                                                 events analysed in this report: the Townsville floods, Black
                                                                                                                                 Summer bushfires and the East Coast Hailstorms.

8        Economic recovery after disaster strikes - volume two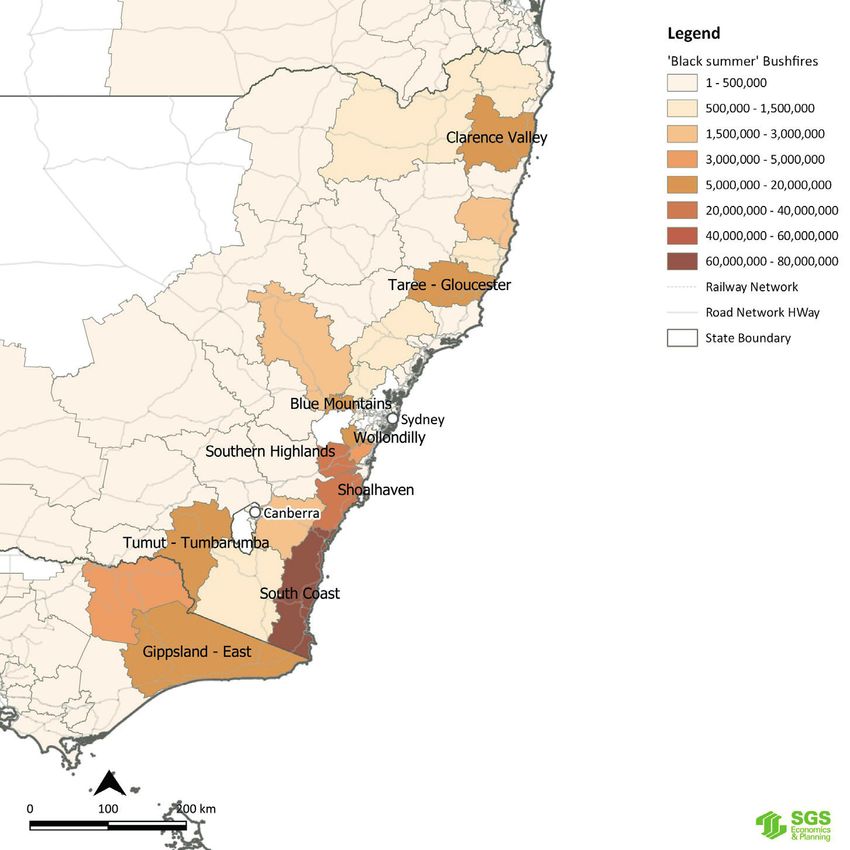
It is important to note that many of the communities FIGURE 1: SCALE OF DISASTER BASED ON TOTAL INSURED LOSSES AND NUMBER OF CLAIMS1
affected by these disasters are still recovering. Following a
disaster, there are three main stages of recovery. Recovery
begins with the emergency response stage, which takes
place immediately after the disaster. Following the recovery
stage is the restoration stage, which includes restoring
basic services, clearing debris and making buildings and
structures safe. This stage is where damages are assessed,
and insurance claims lodged to begin the process of
recovery. The assessments spark a reconstruction phase,
where buildings and infrastructure are repaired or rebuilt.
The reconstruction stage can take years depending on the
extent of the damage to properties and infrastructure.
The methodological approach for this report is outlined
in the following chapter. At a high level, SGS has created
two scenarios of GDP for the regions impacted by these
disasters. The first scenario assumes the stimulus of
insurance claims and recovery activity flowed through the
economy and the second scenario assumes there was no
stimulus. This approach allows the impact of insurance to
be isolated for each case study.
Analysis has been conducted at the Statistical Area 3 (SA3)
level. Statistical Areas are geographic units defined by the 1
As at October 2020
Australian Bureau of Statistics (ABS). SA3s are the third Source: Insurance Council of Australia Data
smallest Statistical Area and represent regions of between
approximately 30,000 and 130,000 people. Analysis at
the SA3 level is particularly insightful for these large-scale
disasters, that impacted large parts of Queensland, New
South Wales, Australian Capital Territory, South Australia
and Victoria.
Economic recovery after disaster strikes - volume two 9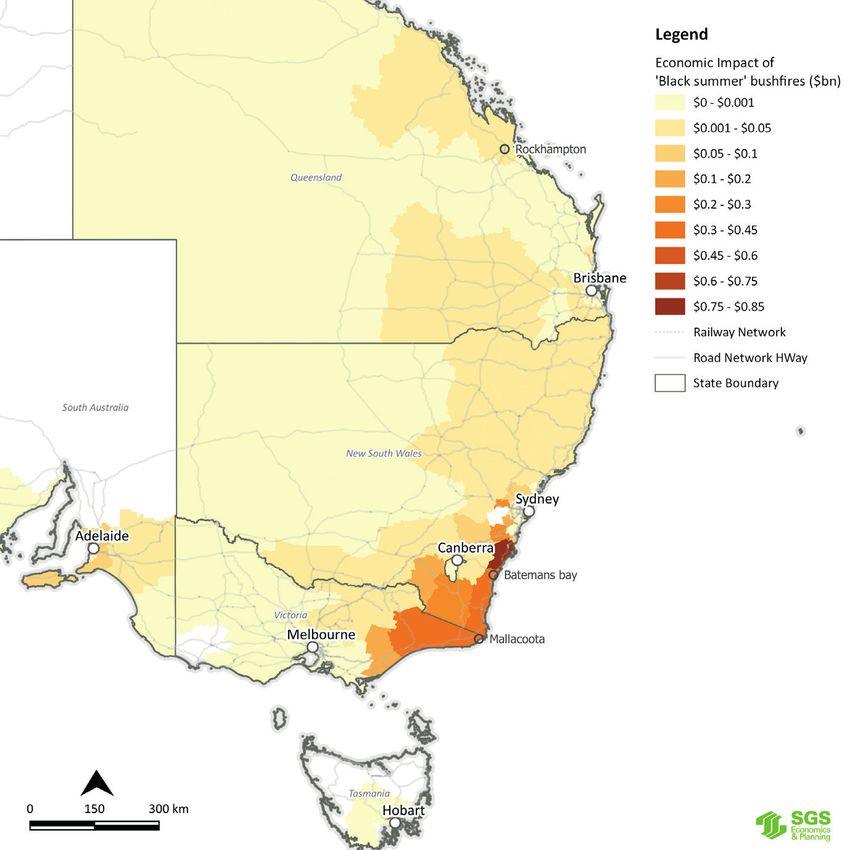
02 Economic modelling
Economic modelling estimates the size of the                           This section briefly outlines the economic modelling used              This simplifying assumption means that the economic
economic impact of three natural disaster events                       to estimate the size of the economic impact of the natural             benefits of insurance might be understated. The stimulus of
                                                                       disasters and the economic benefit of insurance provided               insurance payouts could be having a greater effect in areas
during 2019 and 2020 and the economic benefit of                       by Suncorp. It should be noted that other benefits such as             which are heavily impacted by COVID-19. For example, the
insurance provided by Suncorp.                                         improved mental health outcomes, reduced alcohol and                   East Gippsland tourism sector has been impacted due to
                                                                       drug use and changes to school academic outcomes are not               COVID-19 restrictions and hence insurance payouts in this
It is important to understand the difference between                   included in the economic modelling.2                                   area could have a greater multiplier effect.
insurance losses and economic loss. Insurance losses
related to natural disasters capture the losses accruing to            The COVID-19 pandemic represents the most significant                  The first input is insurance claims and recovery activity data
insured assets (e.g. homes, motor vehicles and business                challenge to the Australian economy since the Great                    from Suncorp3. This is provided for each disaster case study
premises).                                                             Depression. The social distancing restrictions that have shut          and broken down into the following categories:
                                                                       down large parts of the economy are unprecedented, and
Economic losses relate to the loss of economic production              Australia’s GDP has contracted significantly during the 2020           •    Home insurance (split into buildings and home
because of natural disasters. For example, businesses forced           calendar year.                                                              contents)
to close will miss daily takings, workers cannot reach their                                                                                  •    Motor Vehicle Insurance
workplace, and factories remain idle without required                  The uncertainty surrounding the COVID-19 recession means               •    Commercial Insurance (split into motor vehicle,
materials. Depending on the scale of the natural disaster,             forecasting GDP growth in 2021 and beyond is very difficult,                buildings and commercial insurance).
people may choose to leave a region rather than rebuild.               especially at the small area level. Given the aim of this
This loss of population then impacts the economy in the                report is to understand the impact of the natural disaster
longer term.                                                           in question and not the impact of COVID-19, it has been
                                                                       assumed that future growth in 2021 will return to normal
                                                                       trend levels. The with and without disasters scenarios are
                                                                       then compared to understand the economic benefits of
                                                                       insurance.

2
 For more information about these less viable costs see
http://australianbusinessroundtable.com.au/assets/documents/Report%20-%20Social%20costs/Report%20-%20The%20economic%20cost%20of%20the%20social%20impact%20of%20natural%20disasters.pdf
3
 This includes AAMI, GIO, Suncorp Insurance, Vero, Apia, Shannons, CIL and Bingle brands

10        Economic recovery after disaster strikes - volume two
FIGURE 2: ECONOMIC MODELLING OVERVIEW
Legend
Suncorp Data
Insurance Claims and
Recovery Assistance by
Type ICA Data
SGS Data
Total Insurance
Market Share Data Claims & Recovery
Activity from External Data
Disaster
Insurance Council of
Australia Benchmarks Timing of Payments
Impact of Disaster
Disaster Impact
Under Insurance Ratio Multipliers
Regional GDP
Total Economic
Impact of Disaster
Economic Multipliers
Economic Benefit of
Suncorp Insurance
Source: SGS Economics & Planning
Economic recovery after disaster strikes - volume two 11The data was provided at the post code level and was For example, if insured losses from a bushfire is estimated TABLE 1: DISASTER ECONOMIC MULTIPLIERS
then aggregated to the Statistical Area 3 level. The date at at $1 million and the estimated multiplier is 3 then total
which the insurance is paid has also been provided for each economic cost would be estimated at $3 million. Disaster Average Lower Upper
disaster. Type Multiplier Used Bound Bound
Table 1 presents the multiplier used for each of the case Townsville 2 2 10
Suncorp’s insurance claims and recovery activity data is study disasters. Also presented is the upper and lower Flood
the total for all Suncorp brands up to August 2020 (AAMI, bounds provided in the previous research. The disaster
GIO, Suncorp Insurance, Vero, Apia, Shannons, CIL, and multiplier for the hailstorms is set to 1 as, despite their ‘Black 3 3 5.3
Bingle). Estimates of total insurance payouts for claims intensity, the hailstorms did not impact economic activity in summer’
and recovery assistance figures for an event are based off the days following the disaster. Bushfire
Suncorp insurance and market share data combined with Hailstorms 1 1 3
benchmark data from the Insurance Council of Australia The economic stimulus from Suncorp’s insurance claims
for total insurance payouts. An adjustment is then made and recovery activity categories (buildings, home contents, Source: SGS Economics & Planning and Deloitte Access Economics
to account for households and businesses who are self- motor vehicle) are allocated to different expenditure
insured. There is a lack of data on the level of self-insurance categories with different economic multipliers that vary by
however, best estimates indicate a very low percentage of region (as shown in Table 2). A 2015 report by Deloitte Access Economics
the population are self-insured. After conversations with found that the intangible costs of disasters
the Insurance Council of Australia, SGS assumed that 10 per These multipliers reflect supply chains within each region
– including increased family violence,
cent of households / businesses are self-insured. and how much expenditure is lost from the local area. Cities
have higher multipliers than regional areas because they mental health impacts, chronic disease,
Previous research undertaken by the Bureau of capture more stimulus and motor vehicles have multipliers alcohol and drug use, short and long
Infrastructure, Transport and Regional Economics and below one because cars are imported from overseas and term unemployment, changes to school
Deloitte Access Economics has examined the relationship therefore have a reduced impact on an economy. academic outcomes, and crime – are at
between insurance payouts and the loss of economic
least equal to, if not greater than, tangible
production. This research produced disaster multipliers
which can be used to convert insurance payouts to costs.
economic loss.
12 Economic recovery after disaster strikes - volume twoA GDP scenario without insurance was estimated for each SA3 TABLE 2: REGIONAL ECONOMIC MULTIPLIERS FOR EACH INSURANCE PAYMENT TYPE
impacted by the case study disasters. Given each disaster occurred
roughly in the middle of the year, the financial year estimates of Region Building Contents Motor Vehicles
GDP were converted to calendar year estimates. This methodology Greater Sydney 1.34 1.15 0.75
ensures a more accurate assessment of the economic impact, rather
Rest of NSW 1.20 1.06 0.54
than presenting an impact for one or two months at the end of the
financial year. Greater Brisbane 1.29 1.07 0.72
Rest of Qld 1.18 1.01 0.56
This report estimates the economic impact of three case study Greater Hobart 1.09 1.10 0.59
disasters using insurance claims figures from the ICA and Suncorp.
Two scenarios of GDP were prepared, one with the stimulus of Rest of Tas 1.09 1.10 0.59
insurance claims and recovery activity flowing through the economy, Greater Melbourne 1.30 1.15 0.72
and the second with no stimulus. This allows the impact of insurance Rest of Vic 1.13 1.04 0.47
to be isolated for each case study. More detail on the method used to
Canberra 1.09 1.10 0.59
estimate small area GDP is provided in the appendix.
Source: SGS Economics & Planning
Economic recovery after disaster strikes - volume two 1303 Disaster case studies
Disaster response has three distinct phases: 3.1 Disaster Recovery Suncorp has refined and developed its claims response with
emergency response, restoration of basic services each disaster that has affected its customers. Following an
Natural disasters are a traumatic experience for the affected event, dedicated Suncorp teams are established and sent
and reconstruction. How communities respond community. A community’s recovery pathway following to an area affected by a natural disaster to meet customers,
to the disaster depends on the nature of the a natural disaster depends on the scale of the natural assess claims, and work with local authorities and services
disaster and characteristics of the region. This disaster, the resilience of the community and the speed of to rectify the situation for each customer as quickly as
the recovery process. possible.
report examines three case studies, Townsville
floods, Black Summer bushfires and East Coast Following a natural disaster, there are three main stages of Reconstruction is the phase when many buildings have
hailstorms, to understand the disaster response recovery: been repaired / rebuilt and infrastructure repaired. This
reconstruction stage lasts longer than the emergency
process. • Emergency response – takes place immediately after response and restoration stages and can take years4.
the disaster.
• Restoration – work begins on restoring basic services, Insurance is an important component of natural disaster
clearing rubble and debris, and making buildings and recovery. Natural disasters can destroy the productive
the built environment safe. Assessments are made of capacity of economies, and slow economic recovery can
the damage and insurance claims are lodged. drive residents and businesses to leave impacted regions.
• Reconstruction – management of insurance claims and A successful recovery is measured by a communities ability
associated reconstruction begins. to rapidly regain what they have lost and catch up to where
they could have progressed to. Insurance payouts for claims
and recovery activity provide an economic stimulus that
speeds up the rate of recovery for regional economies and
limits further losses of economic activity.
R. W. Kates, C. E. Colten, S. Laska, S. P. Leatherman, Reconstruction of New Orleans after Hurricane Katrina: A research perspective (2006) http://www.pnas.org/content/103/40/14653
4
14 Economic recovery after disaster strikes - volume twoFIGURE 3: PHASES OF RECOVERY FOLLOWING A DISASTER
Source: SGS Economics & Planning based on Kates (2006)
Economic recovery after disaster strikes - volume two 153.2 Townsville Floods (January 2019) Townsville’s high risk of flood stems from being built on This large and quick expulsion of water inundated
natural floodplains of the lower reaches of Bohle and Ross Townsville’s suburban area with further damages. Figure 4
Overview of disaster River (JBA, 2019). Hence, houses were typically built on shows several areas that were affected by significant rainfall
low lying areas. The flood maps before this weather event and flooding. There was significant damage particularly in
Between 27 January and 8 February 2019, monsoonal identified that suburban areas, such as Oonoonba and Rosslea, Hermit Park and Idalia.
rainfall fell across 39 Local Government Areas (LGA) in Idalia, were not at risk during this flood. However, flooding
Queensland, causing widespread flooding. The one in a occurred in these areas due to the sudden release of water
hundred-year flood saw many parts of Queensland declared from the Ross River Dam (The Australia, 2019).
as disaster zones and forced thousands of residents to The 2019 Townsville flooding has been
evacuate. The Ross River Dam (RRD) received 850,000 megalitres regarded as the worst natural disaster
of rainfall. This equates to 3.8 times the dam’s capacity, event to impact the region to-date.
Townsville was at the epicentre of this downpour, with one which was found through a hydrological analysis exceeding
year’s worth of rain inundating the town over a few days. a one-in- 1,000-year event. The RRD capacity peaked at
Townsville is classified as a flood area and has endured 20 43m at 247 per cent capacity, which required authorities to
major flood events since the 1860s. urgently discharge water from the dam into the Ross River
at the rate of 1,900 m3/sec.
The 2019 flooding is regarded as the worst natural disaster
event to impact the region. During this weather event,
a record high of 1,391 mm of rain was recorded at the
Townsville Airport weather station.
16 Economic recovery after disaster strikes - volume twoHealth impacts DEFINING PROPERTY DAMAGE
The Townsville flooding resulted in the loss of four lives, with two Minor damage relates to broken windows, damaged fences, gutters, and carports. It can also
bodies discovered in floodwaters, and two lost from melioidosis. One include minor roof or water ingress failures.
has remained missing since this event transpired. In addition, there
were at least ten people hospitalised due to a bacterial infection. Moderate damage relates to more significant roof or water ingress failures, minor structural
issues which do not require temporary accommodation for the occupant.
There were also further impacts that occurred beyond infrastructure
damage. For example, it was estimated that 500,000 cattle perished Severe damage relates to roofing and other structural failures which means the occupant will
in the floodwater. It was also noted that there was severe erosion need temporary accommodation.
on the banks of the Ross River, with structural damage to pathways
and boardwalks. In one section of the pathway, the flooding caused
the supporting rocks and concrete to cave under, which created a
dangerous hazard for pedestrians.
This weather event required the assistance of multiple rescue and FIGURE 4: TOWNSVILLE FLOOD-AFFECTED AREAS
recovery agencies, including the State Emergency Service, Queensland
Government, Townsville City Council, Queensland Rural Fire Service,
Red Cross, Australian Defence Force and Disaster Relief Australia5.
To assist emergency services, many locals volunteered in evacuating
trapped residents from their flooded homes by boat.
Property damages
Regarded as one of Queensland’s worst natural disasters, it has been
estimated that 3,300 properties were damaged based on a post-event
onsite study. 2,063 properties were classified with minor damage,
1,101 properties suffered moderate damage and the remaining 135
with severe damages. Of these 3,300 properties, approximately half
were rendered uninhabitable6. A total of 30,000 insurance claims were
filed, equating to an estimate of $1.3 billion of damages. Roughly 91
per cent of total claims were residential properties, with commercial
claims making up the remainder 9 per cent.5
Previously known as Team Rubicon Australia
5
https://www.jbarisk.com/flood-services/event-response/a-retrospective-of-townsville-flooding/
6
Source: JBA Risk Management, 2019
Economic recovery after disaster strikes - volume two 17Economic impact of disaster FIGURE 5: ECONOMIC IMPACT OF TOWNSVILLE FLOODS – GROSS DOMESTIC PRODUCT ($ BILLION)
In 2019, the economic impact of the Townsville floods
was estimated to be a $2.5 billion reduction in GDP. This
represents a 0.8 per cent decrease in GDP of the areas
impacted by the Townsville floods, including the regions
surrounding Townsville such as Ayr, Charters Towers, Cairns,
Whitsundays, Mackay and Outback QLD. This is the result
of disruption to normal economic production, loss of crops
and delayed mineral exports, transfer of household and
business expenditure from other uses to disaster recovery
and the loss of economic infrastructure.
The majority of this economic impact occurred in the
Townsville urban area (SA3), where the economic impact
amounted to a 20 per cent decrease in GDP in 2019. Figure
5 shows the economic impact of the Townsville floods by
SA3, highlighting the impacts felt across QLD.
During 2019, total insurance claims and recovery activity
boosted the economy (compared to a scenario of no
insurance payments) of the areas impacted by the
Townsville floods by $1.4 billion (see Figure 6). In the
following year, as the stimulus of the payouts continue to
flow through local economies, an additional $0.9 billion
was added to GDP. This improved economic performance
is expected to continue to at least 2021, with the economy
being $0.6 billion higher because of the total insurance
industry claims and recovery activity. The cumulative
economic impact over three years from 2019 to 2021 is
estimated to be $2.9 billion.
Source: SGS Economics & Planning
18 Economic recovery after disaster strikes - volume twoFigure 7 compares Townsville’s GDP under two scenarios, FIGURE 6: ECONOMIC BENEFIT OF INSURANCE FROM THE TOWNSVILLE FLOODS
one showing the economic impact of the event on the local
economy (event impact) and one showing the economic
impact of insurance (insurance impact). This shows the
sharp decline in GDP that would have occurred without
insurance. With insurance payouts the decline in GDP was
lessened and the economy is expected to return to the long
term trend by 2021/22.
While the economy does recover (unaffected businesses
re-open, infrastructure is repaired, government assistance
stimulates) without insurance there is a long term impact
on the economy. Even three years after the event, the
Townsville economy would be 7 per cent ($830 million)
smaller without insurance which is effectively a permanent
decline in the productive capacity of the city. This decline
would be because of businesses not re-opening without
the help of insurance payouts and a loss of population as Source: SGS Economics & Planning
people leave the area due to property damage and loss of
employment opportunities. FIGURE 7: ECONOMIC IMPACT OF TOWNSVILLE FLOODS ON GDP – TOWNSVILLE SA3
In addition to the insurance payouts there was also
considerable government support following the floods,
including:
• Small Business Disaster Recovery Grants of up to
$10,000 to assist in recovery
• Restocking, Replanting and On-farm Infrastructure
Grants of up to $400,000 for primary producers
• Disaster Recovery Payment (one off payment of $1,000
for adults and $600 for children)
These payments were in addition to the normal spending
on repairing damaged infrastructure following the floods.
Source: SGS Economics & Planning
Economic recovery after disaster strikes - volume two 19Impact of Suncorp insurance
Suncorp Group’s insurance brands played a substantial role in assisting the process of economic recovery in the aftermath of the Townsville floods. Figure 8 below shows the spatial
distribution of Suncorp’s insurance claims and recovery activity following the disaster.
In total, Suncorp Group’s insurance brands paid over $424 million in insurance claims, with household insurance claims accounting for 80 per cent of the total ($339 million). Commercial
claims amounted to $58 million (14 per cent of the total) and motor insurance claims amounting to $25 million (6 per cent of the total) (see Figure 9).
FIGURE 8: MAP OF SUNCORP CLAIMS & RECOVERY ACTIVITY – FIGURE 9: SUNCORP CLAIMS & RECOVERY ACTIVITY – TOWNSVILLE FLOODS
TOWNSVILLE FLOODS
Source: Suncorp
Source: Suncorp
20 Economic recovery after disaster strikes - volume twoFigure 10 presents the breakdown of payouts for the FIGURE 10: SUNCORP CLAIMS & RECOVERY ACTIVITY BY BRAND – TOWNSVILLE FLOODS
Townsville floods by the major Suncorp brands. Suncorp
Insurance accounted for almost 60 per cent of total
payouts. The majority of Suncorp’s payments were building
and home contents related, while Vero Insurance policies
focused on commercial property insurance. Other Suncorp
brands with significant payouts for the Townsville Floods
included AAMI, Vero, APIA, and Shannons. These payouts
were largely for building and home contents insurance.
These claims and recovery activity resulted in the repair
and reconstruction of homes, buildings and infrastructure,
allowing the economy to recover towards pre-flood levels.
Source: Suncorp
CUSTOMER CASE STUDY
Townsville Floods | Suncorp Customer
Suncorp customer Darrel Sard lives in Idalia, Townsville and during the monsoonal rains in February 2019 Darrel’s home was inundated with approximately 60cms of flood water.
The damage to the home was extensive and resulted in the interior of the home needing to be completely stripped out and rebuilt.
Using his policy’s temporary accommodation feature Darrel secured accommodation close to his home allowing key decisions on flooring, wall tiles and cabinetry to be made
quickly and easily. Darrel was able to refurnish his home from local retailers, purchasing then storing key items while the house was repaired and quickly moving them in when
work was completed. This ensured the insurance benefit provided by Suncorp supported the local economy which had also been severely impacted by the floods.
Suncorp was able to restore Darrel’s home to a high quality and standard because he had the correct level of coverage on the Suncorp home policy. Darrel unfortunately knows
others in the community were not as fortunate and has become a keen advocate for understanding the level of cover you need and the importance of preparing your home ahead
of storm season.
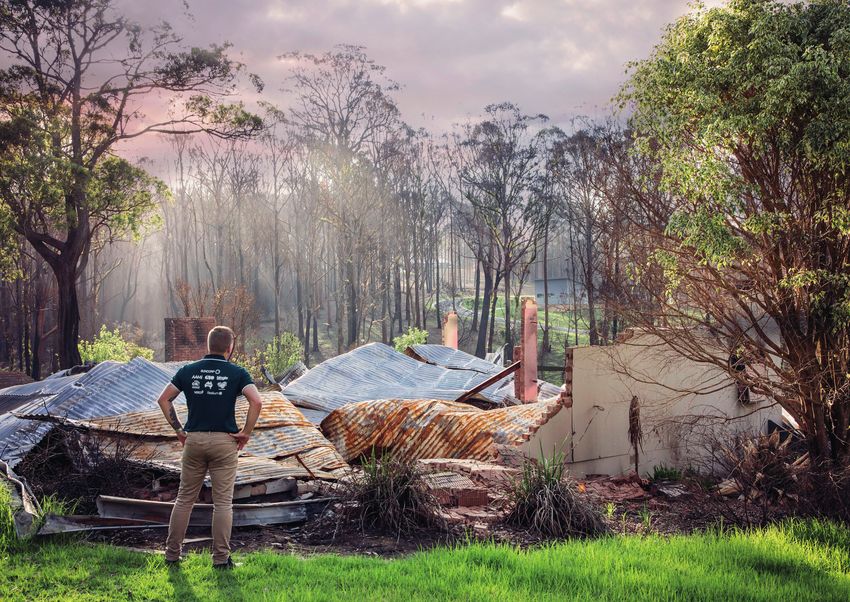
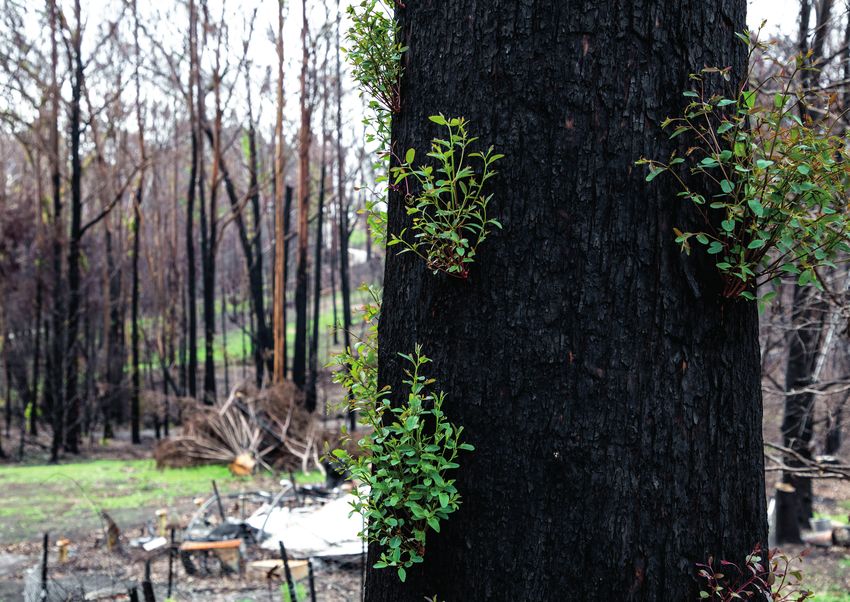
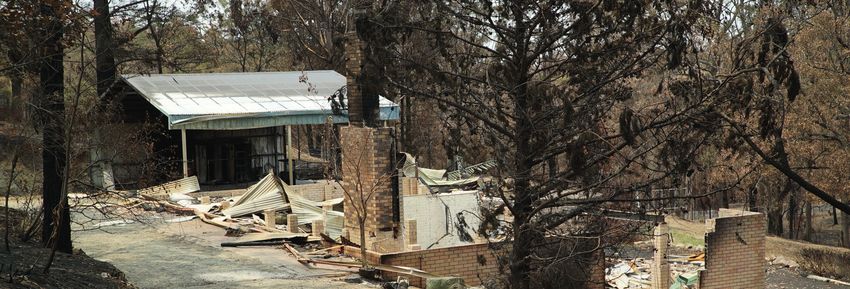
Economic recovery after disaster strikes - volume two 213.3 Black Summer bushfires (December – January One of these fires was categorised as the largest forest Spring was also the driest spring in Australia’s record and
2020) fire in Australia’s history. Victoria had the highest number the fifth warmest. Overall rainfall measured at 277.6mm
of fires, area burned, and the second-highest number of for the annual mean. Low rainfall coupled with record
Overview of disaster houses lost during the fire season. South Australia lost the high temperatures, contributed to an accelerated rate
highest number of houses in the last two decades. Not only of evaporation which further diminished available water.
The 2019-2020 Australian bushfire season was a period of did the bushfires impact Australia, but it confronted the Across large areas of Australia, the low rainfall produced low
unprecedented and intense bushfires across large parts of world with the accelerating danger of climate change with moisture soil. A very strong positive Indian Ocean Dipole
Australia. The bushfire season started in September 2019 the smoke travelling to other countries and continents. was the major contributor to the very low rainfall and low
and by March 2020, the Black Summer fires burnt almost This signalled significant concerns from the effects of more humidity environment experienced throughout Australia in
19 million hectares, destroyed over 3,000 houses and killed frequent and intense bushfires in the future, not only for 2019.
33 people. The bushfire season peaked during December Australia but globally.
2019 to January 2020. The effects were irreversible in its The Black Summer bushfires peaked
destruction across large areas of the country. 2019 was classified as Australia’s warmest year on record.
It broke records of the average mean temperature and the during December 2019 to January 2020,
The mega-fires that occurred in NSW burnt through the mean maximum temperatures. causing irreversible destruction across
largest area of any fire season within the last 20 years. large areas of the country.
22 Economic recovery after disaster strikes - volume twoIn June 2019, the Queensland Fire and Emergency Service alerted a potential early start to the bushfire season which normally starts in August. By spring, 95 per cent of Australia had a Forest
Fire Danger Index (FFDI) that was much higher than average. 60 per cent of the country showed a record high, which indicated a high risk of fire danger in Australia’s forests. A combination of
high temperature, rainfall deficits and prolonged drought increased fuel availability which triggered a series of bushfires around Australia.
FIGURE 11: BLACK SUMMER FOREST FIRE DANGER INDEX (FFDI) LEVELS FIGURE 12: FIRE STATISTICS FROM BLACK SUMMER BUSHFIRES
State Burned area, ha Number of fires Houses lost Lives lost
VIC 1,505,004 3,500 396 5
NSW 5,595,739 10,520 1
2,475 25
QLD 2,500,000 NA 48 0
TAS 36,000 NA 2 0
WA 2,200,000 NA 1 0
SA 286,845 2
1324 186 3
NT 6,800,000 NA 5 0
ACT 60,000 NA 0 0
Total 18,983,588 15,344 3113 33
NA - data is not available
Source: Filkov & et al, 2020
Source: Filkov & et al, 2020
Economic recovery after disaster strikes - volume two 23State impacts Health and biodiversity impacts
New South Wales had the most amount of disruptions from for the 4,000 tourists and residents to evacuate on 30 The bushfires created an array of detrimental impacts,
the bushfires. There was a total of 10,520 fires across the December. By the 31st, the fire was burning the outskirts including on health. The Global Fire Emissions Database
state, burning a total of 5.5 million hectares, with 2,475 of Mallacoota. On 2 January, Victoria declared a state of estimated that the bushfires contributed to 900 million
houses and 25 lives lost. Two mega-blazes were created in disaster for the first time in history. The roads to Mallacoota metric tons of carbon dioxide. The bushfire smoke was
NSW, which included the Gosper Mountain fire and fires were blocked for over a month due to bushfires and fallen responsible for 417 deaths, 1,124 hospitalisations for
on the NSW and Victoria border. The Gosper Mountain trees, which required the people to be evacuated on naval cardiovascular problems, 2,027 respiratory problems
fires burnt through approximately 512,626 hectares of land vessels. There were at least 300 homes lost to these fires. and 1,305 for asthma (Arriagada as cited in Filkov, 2020).
and were recorded as one of the largest fires in Australia’s Canberra had the worst air quality in the world during
history. The second mega-fire burned through 895,744 South Australia had a series of 1,324 bushfires that saw the height of the bushfires. In Sydney particulate matter
hectares and was created by three fires on the border of 286,845 hectares of land burnt, 186 homes and three was four-times higher than the World Health Organisation
NSW and Victoria. lives lost. The worst bushfires started from a succession of (WHO) guidelines which created toxic air quality for most of
lightning strikes. Three days after the fires were announced the city.
Sydney was also affected indirectly by the bushfires. There as contained, a further cycle of lightning caused additional
were 81 days of poor or hazardous air quality in 2019. From fires. This merged with existing fires and created the The fires killed over one billion animals according to
the shutdowns and the disruptions caused by the smoke, catastrophic Kangaroo Island Fires. conservative estimates from the University of Sydney’s Chris
Sydney lost approximately $12-$50 million of GDP each Dickman (as cited in Filkov, 2020). These figures did not
day7. The Kangaroo Island fires burned for more than three include the loss of invertebrates, such as frogs and insects.
weeks and burnt more than 210,000 hectares. There was There are concerns that some of these endangered species
In Victoria, there was a total of 3,500 fires recorded during a significant loss of livestock and the fires burnt between may be driven to extinction. In an intense fire, the risk of
the Black Summer bushfires which contributed to 1.5 $100-900 million worth of plantation timber. This resulted animals surviving is low when an entire area is destroyed.
million hectares of land burnt, 396 houses and five lives in the loss of 89 homes and hundreds of buildings, most There is also a whole array of on-going mortality issues
lost. with links to tourism such as the world-renowned Southern post-fires, not separate to starvation, lack of shelter and
Ocean Lodge. The Adelaide Hills fires also destroyed attacks from predators. It was estimated that half of the
The most destructive fire was the Mallacoota fire which valuable infrastructure and stock. These fires burnt through koala population and a quarter of Ligurian honeybees on
transpired from a small fire 30km east of town on 29 world- famous viticulture and winery areas and reached the Kangaroo Island had been killed.
December. Mallacoota is known as an iconic tourist capital city.
destination and, by Christmas, the regular population The impacts from the Black Summer fires are irreversible; It
of 1,000 residents increased by 8-fold. Emergency will take many years to restore the economy, infrastructure,
Management Victoria announced that it was too late animal and vegetation biodiversity.
https://www.smh.com.au/national/nsw/the-economic-cost-of-bushfires-on-sydney-revealed-up-to-50-million-a-day-and- rising-20191212-p53jbq.html
7
24 Economic recovery after disaster strikes - volume twoEconomic impact of disaster FIGURE 13: ECONOMIC IMPACT OF BUSHFIRES – GROSS DOMESTIC PRODUCT ($
BILLION)
The total economic impact of the Black Summer bushfires was
estimated to be a $4.6 billion reduction in GDP. This represents
a 1.8 per cent decrease in GDP of the areas impacted by the
bushfire. The effect on local economies varied across the state,
with greater impacts felt in eastern Victoria and southern NSW.
During 2020, total insurance claims and recovery activity
boosted the economy (compared to a scenario of no insurance
payments) of the areas impacted by the summer bushfires by
$1.2 billion (see Figure 14).
The impact of COVID-19 has meant that some of the disaster
recovery had been slower than usual. This has meant that
some bushfire affected areas are still within the recovery and
reconstruction phase despite almost a year passing since the
start of the bushfire period.
The economic modelling has assumed that future GDP growth
will return to normal trend levels in 2021. This simplifying
assumption means that the economic benefits of insurance
might be understated. For example, the East Gippsland tourism
sector has been impacted due to COVID-19 restrictions and
hence insurance payouts in this area could have an even greater
multiplier effect.
In 2021, as the stimulus of the payouts continue to flow through
local economies, an additional $1.2 billion is expected to be
added to GDP. This improved economic performance from
the insurance payouts flowing through the local economy is
expected to continue in 2022 at a lower level. The cumulative Source: SGS Economics & Planning
economic impact over three years is estimated to be $2.5 billion,
which has helped the local economies affected by the bushfires
to reduce the severity of the economic impacts from such a
large-scale disaster.
Economic recovery after disaster strikes - volume two 25The scale of the bushfires varied across Australia, with not With insurance payouts the decline in GDP was lessened to The Shoalhaven and South Coast regions in NSW
only the level of damage varying but also the scale of the a degree. However the economy still experienced a sharp experienced damage from the summer bushfires and
economic impact. These variations are due to the range in decline and is expected to return to its long-term trend by received a significant amount of insurance payouts for
severity of the disaster and the varying characteristics of 2021/22. Without insurance the East Gippsland economy building and home contents damage. Figure 16 and Figure
the regions. would not have returned to stable levels for several more 17 show the two scenarios of GDP impacts, one showing
years. the economic impact of the event on the local economy and
Regional and remote communities more severely impacted one showing the economic impact of insurance for each
by the bushfires have a different recovery profile to more Even three years after the event, the economy of East region (SA3).
urban and peri-urban areas. Three regional examples are Gippsland would be 4 per cent (almost $100 million) smaller
provided below for East Gippsland in Victoria, Shoalhaven without insurance – which is effectively a permanent The Shoalhaven region experienced a decline in GDP from
in NSW (regions include Nowra and Jervis Bay) and South decline in the productive capacity of the region. the event, which the insurance stimulus helped to lessen in
Coast in NSW (regions in Batemans Bay to Merimbula). 2020 and returned the economy back to its long term trend
The decline would be because of businesses not re- by 2021.
The economic impact of the disaster is more pronounced opening without the help of insurance payouts and a loss
in locations where key economic assets were destroyed by of population as people leave the area due to property The South Coast region experienced a decline in GDP from
the disaster. The East Gippsland SA3, which includes the damage and loss of employment opportunities. the economic impacts of the event, however the insurance
towns of Mallacoota and Lakes Entrance, was one of the stimulus helped the economy to remain stable in 2020 and
hardest-hit regions. Much of its road network connecting to This is often the situation for regional areas which have continue to grow in 2021.
other regions, and the tourism infrastructure on which its a narrower economic base (often dominated by capital
economy relies, was destroyed. intensive sectors like resources and agriculture) and more
limited employment opportunities compared to larger
Figure 15 compares East Gippsland’s GDP under two urban areas. As such, insurance plays a more significant
scenarios, one showing the economic impact of the event role in mitigating adverse outcomes and helping to restore
on the local economy (event impact) and one showing the normal economic activities.
economic impact of insurance (insurance impact). This
shows the sharp decline in GDP from the impact of the
disaster that would have occurred without insurance.
26 Economic recovery after disaster strikes - volume two
FIGURE 14: ECONOMIC BENEFIT OF INSURANCE FROM THE BUSHFIRES FIGURE 16: ECONOMIC IMPACT OF BUSHFIRES ON SHOALHAVEN GDP ($ BILLION)
Source: SGS Economics & Planning Source: SGS Economics & Planning
FIGURE 15: ECONOMIC IMPACT OF BUSHFIRES ON EAST GIPPSLAND GDP ($ FIGURE 17: ECONOMIC IMPACT OF BUSHFIRES ON SOUTH COAST GDP ($ BILLION)
BILLION)
Source: SGS Economics & Planning Source: SGS Economics & Planning
Economic recovery after disaster strikes - volume two 27Impact of Suncorp insurance
As a result of the bushfires, Suncorp’s insurance brands paid out $244 million in insurance claims and recovery activity. Home insurance claims account for 88 per cent of all claims ($215
million), commercial insurance claims amounted to $23 million (10 per cent of total) and motor insurance claims amounted to $6 million (2 per cent of total).
Figure 19 presents the breakdown of payouts for the bushfires by the Suncorp brands. The three largest brands in terms of payouts for the bushfires were AAMI (31 per cent of total), GIO (21
per cent of total) and Apia (15 per cent of total). The majority of payments from these brands were building and home contents related.
Other Suncorp brands with significant payouts for the bushfires included Vero, Shannons and Suncorp Insurance. These payouts were largely for building and home contents insurance.
The claims and recovery activity resulted in the repair and reconstruction of homes, buildings and infrastructure, allowing the economy to recover towards pre-bushfire levels.
Suncorp’s insurance brands played a substantial role in assisting the process of economic recovery in the aftermath of the bushfires. Figure 20 and 21 show the spatial distribution of
Suncorp’s insurance claims and recovery activity following the disaster.
FIGURE 18: SUNCORP CLAIMS & RECOVERY ACTIVITY – BUSHFIRES
FIGURE 19: SUNCORP CLAIMS & RECOVERY ACTIVITY
BY BRAND – BUSHFIRES
Source: Suncorp Source: Suncorp
28 Economic recovery after disaster strikes - volume twoFIGURE 20: MAP OF SUNCORP CLAIMS & RECOVERY ACTIVITY – BUSHFIRES FIGURE 21: MAP OF SUNCORP CLAIMS & RECOVERY ACTIVITY – BUSHFIRES – NSW SOUTH
COAST
Source: Suncorp
Source: Suncorp
Economic recovery after disaster strikes - volume two 29CUSTOMER CASE STUDY Bushfires | Vero Customer On December 31, 2019, bushfires swept through Malua Bay, on the South Coast of New South Wales, destroying businesses and homes in the idyllic coastal region. The Malua Bay bowls clubhouse was caught up in the destruction being completely destroyed, yet remarkably the bowling greens were left largely untouched. This allowed the 4,000 strong members of the club to be back on the greens less than a week after the fires, reigniting the spirit of the community. The bowls club was insured with Vero. Vero secured partner builders using local trades to construct a temporary clubhouse while the new facility is being built to provide the community with a safe meeting place to come together and connect. “We’re all just getting back to normal, and trying to move on, put the past behind us and focus on the future now. Most members have been here for years,” she said. “It’s not just a club that we’re running, it’s a home for people. Without them we wouldn’t be a club.” Christine Howarth - Club Manager, Malua Bay Bowls Club “This bowls club is like a second home to the members. There’s about 4,000 in total, so while it is a bowls club, it is very much a place for the community as well. Bowls is a part of it, of course, but it is only a part of it. It’s a strong community.” Peter Hutchinson - VP Men’s Bowls, Malua Bay Bowls Club 30 Economic recovery after disaster strikes - volume two
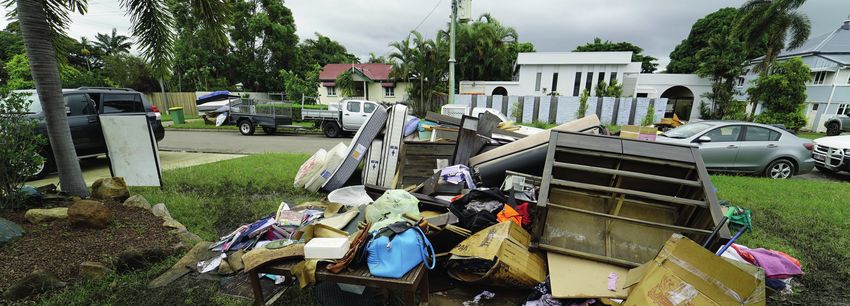
3.4 East Coast Hailstorms (multiple states)                            Typically, South-East Queensland and northern New South         Two tourists were hospitalised after being injured by
(January 2020)                                                         Wales are regarded as Australia’s giant hail hot-spots and      lightning. There were over 50,000 insurance claims lodged
                                                                       usually experience one to two severe hailstorms per region      for ACT alone, costing more than $500 million. It also
Overview of disaster                                                   per year. In Canberra, hailstorms occur approximately once      destroyed years of research, severely damaging 65 CSIRO
                                                                       in every five years. The PERILS report regarded the storms in   experimental greenhouses and damaging the Australian
On 19 January 2020, storms raged through the East Coast                Canberra as more than a run-of-the-mill storm, noting that      Academy of Science’s Shine Dome.
of Australia. This storm continued for three days until 21             they were significantly severe.
January and wreaked destruction in Victoria, New South                                                                                 The storm travelled north bringing thunderstorms and bad
Wales, Queensland and the Australian Capital Territory. The            State impacts                                                   weather to Sydney and then onto Queensland. Hailstones
conditions were made worse with the timing coinciding                                                                                  battering the outer suburbs were recorded at 4.3 cm.
with the Black Summer bushfires. The volatile weather                  Storms hit Victoria on 19 January with hail the size of golf    The strong winds damaged cars in the Sutherland area
events brought thunderstorms and giant hail across                     balls in some parts of the state. Intense weather put a         in Sydney. Across the southern-east part of Queensland,
parts of Australia that were already experiencing drought              pause on firefighting efforts in fire-ravaging zones, such      the storm brought down power to 20,000 homes and
apocalyptic dust storms.                                               as north-east Victoria and East Gippsland, with concerns        businesses. It forced two train lines out of action during
                                                                       of flash flooding. The eastern suburbs including Glen Iris,     peak-hour as the storm battered the state.
The January 2020 hailstorms were brought on by a large-                Warrandyte, Malvern East and Templestowe were the worst
scale weather pattern, which was the result of a broad                 hit. There was a rush of calls to Victoria State Emergency      There have been over 125,000 insurance claims lodged,
low-pressure system which carried warm and moist air                   Service with more than 1,300 people asking for assistance.      equating to a total insurance cost of $1.6 billion8. Figure
from Queensland’s Coral Sea down to Victoria. This mixed                                                                               22 shows the breakdown of the claims by the top states.
with cooler upper-level temperatures provided unstable                 In the ACT, ACT emergency services received over 2,000          Most of the damage occurred in Australia’s south-east,
conditions for multiple thunderstorm cells to be formed.               calls for assistance when the storm hit on January 20. It       particularly in the ACT and Victoria.
                                                                       took out power for over 1,000 homes across the territory.
Particularly for Canberra, it allowed for very dangerous               The storm was declared a catastrophe by the Insurance
                                                                       Council of Australia. In the Parliamentary Triangle, hundreds
“supercell” thunderstorms. Reported by PERILS (as cited in                                                                                The January 2020 hailstorms is likely to
Insurance Journal, 2020), the January 2020 hailstorms is               of animals perished, including 300 protected flying foxes.
                                                                       Winds reached a peak of 117 km/h coupled with golf ball-           rank as the fourth largest hail event in
likely to rank as the fourth largest hail event in Australia for
the past 20 years, surpassing the Brisbane November 2014               sized hail destroying buildings and cars.                          Australia for the past 20 years.
hailstorms, and the Sydney December 2018 hailstorms. This
report noted that these weather events had an unusual set-
up based on its national scale.

ICA Data https://www.insurancecouncil.com.au/media_release/plain/575
8

                                                                                                                                            Economic recovery after disaster strikes - volume two    31
You can also read