Gold Coast Broadwater Economic Assessment and Monitoring - Baseline Report - Gold Coast City Council
←
→
Page content transcription
If your browser does not render page correctly, please read the page content below
Gold Coast Broadwater
Economic Assessment and
              Monitoring
    Baseline Report - Gold Coast City Council

                                     May 2012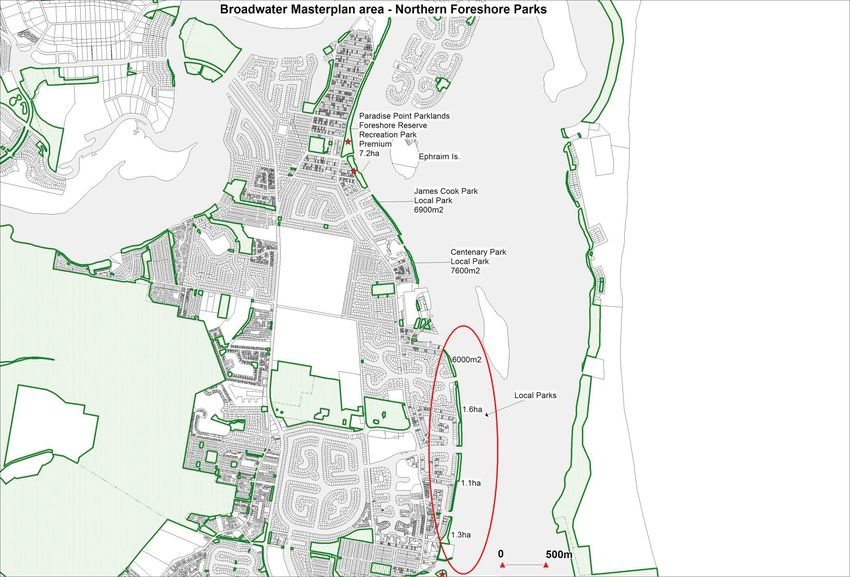
URBIS STAFF RESPONSIBLE FOR THIS REPORT WERE:

Director                    Malcolm Aikman
Consultant                  Paul Riga,
Research Analyst            Scott Hinds
Job Code                    BPE0427
Report Number               1
xdisclaime rx

© Urbis Pty Ltd
ABN 50 105 256 228

All Rights Reserved. No material may be reproduced without prior permission.
While we have tried to ensure the accuracy of the information in this publication,
the Publisher accepts no responsibility or liability for any errors, omissions or
resultant consequences including any loss or damage arising from reliance in
information in this publication.

URBIS
Australia Asia Middle East
urbis.com.au
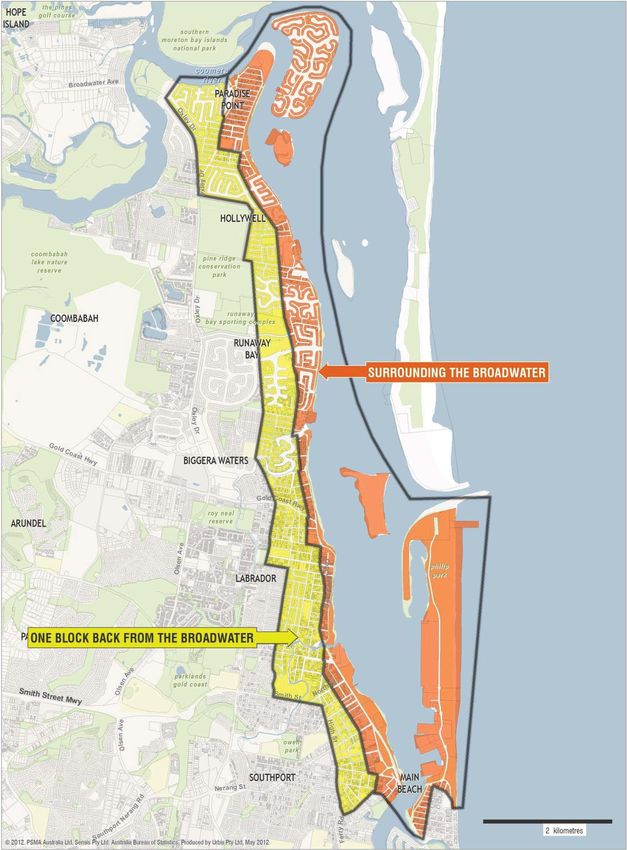
TABLE OF CONTENTS

Executive Summary ............................................................................................................................ 1
    Introduction and study purpose...................................................................................................... 1
    Study Approach............................................................................................................................. 1
    Economic Baseline Assessment .................................................................................................... 2
    Economic Monitoring Scoreboard .................................................................................................. 3

1      Introduction ................................................................................................................................. 1
       1.1   Background ........................................................................................................................ 1
       1.2   Study Purpose .................................................................................................................... 1
       1.3   Gold Coast Broadwater History ........................................................................................... 1
       1.4   Report Limitations ............................................................................................................... 3

2      Approach ..................................................................................................................................... 4
       2.1  Total Economic Value (TEV) ............................................................................................... 4
       2.2  Study Approach .................................................................................................................. 6
       2.3  Identification of Value Components ..................................................................................... 6
       2.4  Value Component Measure Assessment............................................................................. 8

3      Value Component Analysis ...................................................................................................... 11
       3.1   Current Economic Value Components .............................................................................. 11
       3.1.1 Property Value .................................................................................................................. 11
       3.1.2 Marina Values................................................................................................................... 14
       3.1.3 Additional Amenity and Brand Value ................................................................................. 15
       3.1.4 Value of Open Space........................................................................................................ 16
       3.1.5 Value of Environmental Lands .......................................................................................... 17
       3.1.6 Facilitating Recreational Infrastructure .............................................................................. 18
       3.1.7 Waste Treatment .............................................................................................................. 19
       3.1.8 Employment ..................................................................................................................... 19
       3.1.9 Summary of Economic Value Components ....................................................................... 20
       3.2   Annual Economic Returns................................................................................................. 21
       3.2.1 Property Revenues ........................................................................................................... 21
       3.2.2 Open Space ..................................................................................................................... 23
       3.2.3 Amenity and Brand ........................................................................................................... 24
       3.2.4 Recreational Value ........................................................................................................... 27
       3.2.5 Waste Treatment .............................................................................................................. 28
       3.2.6 Congestion ....................................................................................................................... 28
       3.3   Economic Baseline Assessment ....................................................................................... 28

4      Economic Monitoring ................................................................................................................ 30
       4.1  Economic Monitoring Scoreboard ..................................................................................... 30
       4.2  Conclusion........................................................................................................................ 31

Appendix A               Property Value – Maps & Method .......................................................................... 33

Appendix B               Open Space - Maps ................................................................................................ 36

References ........................................................................................................................................ 39

URBIS
REP-BPE0427-FINAL-310512-BROADWATER MASTER PLAN V2
Executive Summary
INTRODUCTION AND STUDY PURPOSE
The Gold Coast Waterways Steering Committee (GCWSC) is undertaking a Master Plan of the Gold
Coast Broadwater. To inform the Master Plan from an economic perspective the GCWSC commissioned
Urbis to prepare an Economic Baseline & Contextual Assessment Study (Economic Assessment).
The Economic Assessment incorporates the following key components:
Identification of economic value components of the Gold Coast Broadwater
An Economic Baseline Assessment that estimates the current economic value of the Broadwater
Development of an Economic Monitoring tool to measure economic changes from year to year, and
those resulting from proposed Master Plan projects.
STUDY APPROACH
The approach adopted for this study aims to derive Total Economic Value of the Gold Coast Broadwater
through the identification of Direct and Indirect Use and Non-use Values. Recognised economic value
techniques are applied to determine these values including opportunity cost, shadow pricing, replacement
cost, and willingness to pay.
Economic value components for the Gold Coast Broadwater were identified through research, case
studies, and consultation with stakeholders and the Project Steering Committee. These were assessed in
terms of their significance to the Total Economic Value of the Broadwater, the practicality in measuring
them, and the degree to which they represent economic value
This generated the following list of economic value components.
VALUE COMPONENT MEASURE
Property value - Residential, Commercial The uplift in property value presented by the Broadwater.
(including businesses operating on Calculated by deducting Site Value of property one block
foreshore) back from the Broadwater with property within one block
of Broadwater.
Value of Marina’s
Property revenue - Residential, Rates revenue
Commercial
Value of open space parks Alternative land value (site value)
Annual maintenance cost (minus inflation)
Additional amenity value, brand values Tourist visitation numbers - Events
Boats on B/W
Car Traffic on Spit
Area of Recreational Land
Recreational value Cost of dredging
URBIS
REP-BPE0427-FINAL-310512-BROADWATER MASTER PLAN V2 EXECUTIVE SUMMARY i
VALUE COMPONENT MEASURE
Boating/Paddling Boats on B/W
Sail/swim
No. of Marina berth/moorings
Pedestrians
Traffic counts (the spit)
Cycling
Facilitating Recreational Infrastructure Replacement Cost
Waste Treatment Alternative Cost
Stormwater Disposal
Discharge Volumes
Wastewater Discharge
Employment x No. of workers (Business site Survey)
Direct (eg. Jetboat)
Indirect (eg. Personal Trainers)
Congestion – Waterway, Traffic Boats on B/W
Car Traffic on Spit
Having identified the Economic value components for assessment, economic value techniques were
applied to derive value estimates and the assessment of an overall Economic Baseline.
ECONOMIC BASELINE ASSESSMENT
The Value Component analysis identified and provided measures of a range of value components
incorporating overall economic value and annual economic impacts. From this analysis an Economic
Baseline for the Gold Coast Broadwater has been compiled (as reflected in the table below). The
intention is that this is in a format that can be updated annually.
ECONOMIC BASELINE VALUE COMPONENT ESTIMATED VALUE OR VOLUME
Residential and Non Residential Property Values $1,158,189,690
Marina Values $126,381,000
Open Space Value $818,351,581
Environmental land value $1,557,576,934
Infrastructure Values $152,400,746
Waste Water Treatment $350,000,000
TOTAL VALUE $4,162,899,950
Employment Numbers – Dependent on Broadwater 2,500 Full time Equivalents
ii EXECUTIVE SUMMARY
URBIS
REP-BPE0427-FINAL-310512-BROADWATER MASTER PLAN V2
ECONOMIC BASELINE VALUE COMPONENT ESTIMATED VALUE OR VOLUME
Area of Open Space 353,500sq.m
Area of Environmental Land 942,000 sq.m
Based on this assessment an overall monetary value of $4.16 billion is estimated as the Economic
Baseline value of the Gold Coast Broadwater in 2012. In addition to this the Broadwater is estimated to
sustain 2,500 FTE direct jobs, and 35 hectares of open space and 94 hectares of environmental
land.
ECONOMIC MONITORING SCOREBOARD
The analysis of the Economic Value components and preparation of the Economic Baseline form the
basis for the compilation of an Economic Monitoring Scoreboard for the Gold Coast Broadwater. A set of
principles were derived by the Project Steering Committee in conjunction with Urbis to determine which
measures were most appropriate for inclusion in the Economic Monitoring Scoreboard. These principles
are:
Capture the core elements of economic value such as employment and income;
Reflect Financial value, Economic growth, and Community value; and
Able to be relatively easily measured and updated regularly.
The Scoreboard identifies eight key measures to monitor Financial Value, Economic Growth, and
Community Value components. The Scoreboard is translated into an assessment tool through the
application weightings for each measure and derivation of weighted scores which sum to a total score. An
example of how this tool works is shown in the following table.
Gold Coast Broadwater Economic Monitoring Tool
Project Name:
Economic Value
Metric/measure % Change Weighting Score
Component
Increase (or decrease) in Residential and
Commercial property value relative to
Financial Value surrounding land 5 20% 1.00
Increase (or decrease) in marina property
value 5 5% 0.25
Increase (or decrease) in direct jobs 3 20% 0.60
Increase (or decrease) in indirect jobs 3 10% 0.30
Economic Growth
Increase in Gross Regional
Product/Value Added expenditure 1.5 15% 0.23
Visitation – Boats, Motor Vehicles;
Pedestrians; Event attendances 2 10% 0.20
Associated infrastructure investment
Community Value 2 5% 0.10
required by Government
Increase (or decrease) in Open Space and
Environmental land -3 15% - 0.45
Total 19 100% 2.23
The preparation of the Economic Baseline Assessment and Economic Monitoring Scoreboard to measure
the value and potential impacts on the Gold Coast Broadwater has been a valuable exercise that can be
used to provide significant economic insights for the Broadwater Master Plan. These tools can contribute
URBIS
REP-BPE0427-FINAL-310512-BROADWATER MASTER PLAN V2 EXECUTIVE SUMMARY iii
to the effective monitoring of the overall performance of the Master Plan and also have applications for
the economic assessment and monitoring of other natural assets within the Gold Coast and Queensland
more broadly.

iv   EXECUTIVE SUMMARY
                                                                                                                  URBIS
                                                                     REP-BPE0427-FINAL-310512-BROADWATER MASTER PLAN V2
1 Introduction
The Gold Coast Broadwater is an important asset for Queensland and particularly the Gold Coast,
forming a key part of the region’s brand and image. It is an attractor for residents, visitors, commercial
activities, and an important part of the region’s ecological footprint. The Gold Coast City Council in
conjunction with the State Government has commissioned an Economic Assessment of the Broadwater
to inform the Master Plan being undertaken to sustain and protect the Broadwater as an asset for the
region. This study presents the approach and results to provide an ongoing economic assessment of the
Gold Coast Broadwater.
1.1 BACKGROUND
The Gold Coast Waterways Steering Committee is undertaking a Master Plan of the Gold Coast
Broadwater. The Master Plan is intended to “establish a coordinated and consistent long term approach
to sustainable planning, development and management of the Broadwater” (Study Brief, Gold Coast City
Council, 2012). The Master Plan should identify planning priorities for fringing land and waterway areas
and develop a range of agreed actions (GCCC, 2012).
To inform the Master Plan a range of technical studies has been commissioned. The Gold Coast
Waterways Steering Committee (GCWSC), which is a collaborative effort between Gold Coast City
Council (GCCC), the Queensland Government Department of Employment, Economic Development and
Innovation (DEEDI), and Maritime Safety Queensland (MSQ), has commissioned Urbis to prepare an
Economic Baseline & Contextual Assessment Study (Economic Assessment).
1.2 STUDY PURPOSE
Through the direction of the Consulting Brief and discussions with the Project Team the key objectives of
the Economic Assessment can be summarised into the following three points:
To document the economic profile and function of the Broadwater and immediately surrounding land
Identify and understand the economic value components of the Broadwater to inform the Master Plan
Develop a set of indices or performance measures to monitor the Broadwater over time and allow
assessment of the Broadwater Master Plan and specific Broadwater projects.
1.3 GOLD COAST BROADWATER HISTORY
The history of the development of the Southport area and the Gold Coast Broadwater reflects an area of
multiple uses. Leisure and tourism has been an important use from its earliest days for activities such as
theatre, sailing, tourist accommodation, themed attractions, and marinas. However, over time the value of
the Broadwater has been reflected in other uses such as education, retailing, and nature management.
The following time line tracks the key events in the development of the Broadwater from its early role as a
tourism location in the 1850s to its much wider role today:
1850s – Southport area emerges as a major tourism destination
1875 – Area re-named Southport after English seaside resort town
1898 – Railway built from Brisbane to Southport (closed 1964)
1901 – The Southport School founded on banks of Nerang River
1914 - Building of cement Jetty at Southport (location for future Pier Theatre)
1925 – Opening of new road linking Brisbane to Southport opens Gold Coast to much larger market
1925 – Opening of Jubilee Bridge connecting Southport and Main Beach
URBIS
REP-BPE0427-FINAL-310512-BROADWATER MASTER PLAN V2 INTRODUCTION 1 1927 – Pier Theatre built in Southport Broadwater parkland area and became centre of entertainment
on the Gold Coast
1932 – Pier Theatre burnt down, then rebuilt (demolished in the 1960s)
1934 – Southport Bathing Pavilion built and now listed on Queensland Heritage Register
1946 – Southport Yacht Club founded on South Stradbroke Island with clubhouse opening on current
site in 1956
1959 – State Government proclaims City of Gold Coast
1960s – Opening of Southport Pool on banks of Broadwater, later renamed Gold Coast Aquatic
Centre
1967 – Major cyclone ravages Gold Coast beaches. A million cubic metres of sand dredged from
Broadwater and pumped to replenish the beaches
1969 – Sundale Shopping Centre opens at Southport facing the Broadwater including Qld’s first Big
W, a cinema, restaurants, and 45 specialty shops (Closed 1989 after opening of nearby Australia
Fair)
1970 – First major tourist attraction, Ski Land and Marineland (now Seaworld) developed on the Spit
1972 – Runaway Bay canal development commences
1974 – Brisbane and Gold Coast floods dam sea entrance
1977 – Broadwater Plan promoted by Keith Williams including establishment of a Marina/Cruise
Terminal Island in the Broadwater
1979 – Gold Coast Waterways Authority established by State Government
1980 – Gold Coast Waterways Authority forms plan (following consultation) for Seaway. Cost
intended to be offset by tourism/residential development on Wavebreak Island and the Spit
1984 – Construction commences on entrance dredging and on training walls for Gold Coast Seaway
as means of stabilising Nerang River entrance and facilitating recreational and commercial boating on
the Gold Coast
1985 – Seaway opened resulting in development of new marina facilities in the Broadwater
1988 – Sea World Nara Resort opens
1991 – Gold Coast Waterways Authority disbanded by State Government
2002 – Review of Gold Coast Seaway and Sand By-passing System
2003-2008 – Planning for development of Spit with marinas and cruise ship terminal (2006 election
commitment to “no cruise ship terminal”)
The history of the development of the Gold Coast Broadwater highlights the breadth of economic, social,
and biophysical value that the Broadwater represents as an asset to the Gold Coast region and
Queensland more broadly. This goes beyond the obvious tourism and property benefits to unique values
in waste water treatment and disposal, education, and environmental protection. These factors are
investigated in detail in following sections of this report.
2 INTRODUCTION
URBIS
REP-BPE0427-FINAL-310512-BROADWATER MASTER PLAN V21.4 REPORT LIMITATIONS As the report involves projections, it can be affected by a number of unforseen variables. It represents for the party to whom it is addressed, the various estimates of Urbis Pty Ltd but no assurance is given by Urbis Pty Ltd that the projections will be achieved. The assessment undertaken has been done on the basis of information available at this time. Our assessment may be impacted by changes to this information or by market factors which cannot be foreseen at this stage. Urbis Pty Ltd will not accept liability or responsibility to any third party relying on information provided in this advice. URBIS REP-BPE0427-FINAL-310512-BROADWATER MASTER PLAN V2 INTRODUCTION 3
2        Approach
There are a range of methods that can be used to assess the economic value of natural assets such as
the Gold Coast Broadwater. Economic value is assessed in terms of human welfare benefits. These
benefits are measured through consumer’s surplus and market value where goods and services are
traded (The Victorian Coastal Council, Department of Sustainability and Environment, 2007).

2.1      TOTAL ECONOMIC VALUE (TEV)
An environmental and recreational asset such as the Gold Coast Broadwater can contribute value to
those who use the asset (Use Values) and also to non-users who may value the asset because they
know it can be used by others or merely because it exists (Non-use Values). The combination of Use and
Non-use Values is termed Total Economic Value (TEV).

Use Values reflect interaction with the asset which can be Direct or Indirect. Direct values are where
individuals make actual use of the asset. Indirect values recognise associated benefits or situations
where an individual or group benefits from services provided by the asset. Direct and Indirect values can
have both Market and Non-market components. Market components are those that can be measured by
a market such as property values, whilst Non-market values have no commercial market such as
ecological preservation.

Use Values also have an Option value which reflects the value an individual or group place on the future
use of the asset for their own benefit. An example of this may be the research potential of a natural asset
for improvements in medical applications.

Non-use Values reflect the value derived from the knowledge that the asset will continue to exist and
provide ongoing benefits for others currently (Existence Values) and future generations (Bequest Values).
These are both Non-market values as they cannot be traded or sold in a current market situation.

Source: URS Australia Pty Ltd for Victorian Coastal Council – Department of Sustainability and
Environment.

The components of Total Economic Value are shown graphically in the following diagram.

FIGURE 1 – TOTAL ECONOMIC VALUE CHART

The Total Economic Value framework above can be applied to the Gold Coast Broadwater to investigate
different components of value and potential measurement techniques to measure these components.

4 Approach                                                                                                          URBIS
                                                                       REP-BPE0427-FINAL-310512-BROADWATER MASTER PLAN V2
TOTAL ECONOMIC VALUE TYPE EXAMPLE MEASUREMENT TECHNIQUE
Use Value
Direct Market Private land (residential lots) Property Valuation
Non-market Recreational land, Production Function Technique – based on estimated value to marketed outputs (eg.
Conservation land Input-Output analysis)
Cost of Alternatives Technique – replacement cost approach
Shadow Project Cost Technique – cost of providing comparable benefit elsewhere
Revealed Preference Techniques – Willingness to pay based on access costs (eg. Travel
Cost method)
Stated Preference Techniques – Willingness to pay based on hypothetical estimates of
what impacted stakeholders would pay (eg. Contingent Valuation Surveys)
Indirect Market Views from property Property Valuation differences
Non-market Storm Protection As above
Option Market/Non- market Future Direct & Indirect Qualitative Assessment
Uses
Non-Use Value
Bequest Non-Market Future Generations Benefits Qualitative Assessment
Existence Non-Market Satisfaction that asset exists As per Non-market techniques above
URBIS
REP-BPE0427-FINAL-310512-BROADWATER MASTER PLAN V2 APPROACH 52.2 STUDY APPROACH
There are numerous approaches to assessing economic value of natural assets. These include:
Market Techniques – using market prices
Input-Output Analysis – The application of industry wide factor prices and derived multipliers for
employment, expenditure, and value added
Replacement Cost Techniques – the cost of alternative techniques or options
Shadow Project Cost Techniques – cost of providing comparable benefits elsewhere
Preference Techniques – Stated or Revealed which applies Willingness to Pay techniques either from
access costs or surveyed estimates of what impacted stakeholders would pay for the benefit or to
avert the cost.
The benefits and success of these approaches depends on the type and scale of the project being
assessed, the availability of data, and the level of objectivity that can be applied to the assessment.
Drawbacks of these approaches include the difficulties in measuring changes over time, the potential to
have overlapping costs, and the incorporation of subjective assessments of costs and values.
These drawbacks are problematic for this study as key functions of this study are ‘the need to be able to
assess the economic value of the Broadwater over time’ and also ‘to provide independent assessments of
Master Plan projects as they are proposed’. Given these factors, this study has formulated a Scorecard
Approach to the economic assessment of the Gold Coast Broadwater whereby a range of economic value
components are identified that represent the majority of the economic value of the Broadwater. These
factors need to be objectively measured each year and able to be combined to provide a comprehensive
assessment of the range of economic value of single projects proposed for the Broadwater.
This Scorecard Approach allows the incorporation of measures of Direct and Indirect value. It allows a
like for like comparison to other areas and assets. It presents measures that can be easily understood by
the community. Finally it allows measurement over time including annual updates. It does not, however,
provide an overall value estimate of the Broadwater. Given the key objectives of this analysis the project
team has agreed that this is not a critical output of this study.
The first step then is to identify the range of economic value components comprising the Broadwater and
then through the application of key criteria refine these to a robust list of components that comprise the
Gold Coast Broadwater Economic Assessment Scorecard.
2.3 IDENTIFICATION OF VALUE COMPONENTS
A key component of assessing the TEV of the Gold Coast Broadwater is the identification of the different
economic value components of the Broadwater. This assessment focuses principally on the Economic
value of the Broadwater and does not aim to assess the Social, Environmental, or Ecological value of the
Broadwater. There are however elements of overlap between Economic, Social, and Environmental and
where appropriate these have been incorporated into the Economic assessment.
Urbis worked with the Broadwater Masterplan Project Management Team to identify the range of
Economic Value components of the Broadwater and potential measures to assess these value
components. The following table presents the list of economic value components identified by the project
team and associated measures.
6 APPROACH
URBIS
REP-BPE0427-FINAL-310512-BROADWATER MASTER PLAN V2VALUE COMPONENT (IMPACTS) MEASURE
Property value UILV (block back vs. on the Broadwater)
(Residential, Commercial) Site Value
Marina’s
Property revenue Rates revenue
(Residential, Commercial)
Value of open space parks Annual maintenance cost (minus inflation)
Businesses operating on B/W Foreshore UILV
Rates revenue
Additional amenity value, brand values Tourist visitation numbers
Conservation Land
Area of Recreational Land
Recreational value Cost of dredging
Boating/Paddling
Marina berth/moorings
Sail/swim
Fishing Day trip utilisation
Diving/Snorkelling Traffic counts (the spit)
Pedestrians
Cycling
Facilitating Recreational Infrastructure Replacement Cost
Waste Treatment Alternative Cost
Stormwater Conveyance and Treatment
Effluent Discharge
Economic Costs x Alternative Cost or Replacement Cost
Increased Flooding
Increased Insects (Mosquitos)
Employment x Employment numbers
Direct
- Fishing (Commercial)
- Charters (Fishing, Whale watching, etc.)
- Marine Industry (Servicing)
- Tourism/Recreation (Jetboat, Jetskis, etc.)
Indirect (Personal Trainers)
Congestion x Estimates of boats, cars, people – through survey
URBIS
REP-BPE0427-FINAL-310512-BROADWATER MASTER PLAN V2 APPROACH 7Waterway and observation methods
People
Traffic
Events Visitation
Media coverage
2.4 VALUE COMPONENT MEASURE ASSESSMENT
Having identified the range of value components comprising the economic value of the Gold Coast
Broadwater it is important to filter these through a range of criteria in order to generate the most relevant
and practical set of indicators of economic value. Following a workshop with the Project Team the
following criteria were identified to apply to the value components:
Significance - Estimated significance of the value component to the Total Economic Value of the
Broadwater
Practicality – Ease of measurement of the identified indicators, including availability of data
Economic Representation – the degree to which the value component represents economic value
(the consideration being would the component be assessed in another technical study).
The following table presents the assessment of the identified Value Components against the above
criteria:
VALUE COMPONENT MEASURE SIGNIFICANCE PRACTICALITY OF ECONOMIC
MEASUREMENT REPRESENTATION
Property value - Site Value of High Practical High
Residential, Commercial property within one
(including businesses block of Broadwater
operating on foreshore)
Value of Marina’s Low-Medium Moderate-Difficult High
Property revenue - Rates revenue Medium Practical High
Residential, Commercial
Value of open space parks Alternative land High Practical Medium
value (site value)
Annual Medium-High Practical Medium
maintenance cost
(minus inflation)
Additional amenity value, Tourist visitation High Practical Medium-High
brand values numbers - Events
Boats on B/W High Moderate Medium-High
Car Traffic on Spit Medium Moderate Medium
8 APPROACH
URBIS
REP-BPE0427-FINAL-310512-BROADWATER MASTER PLAN V2 Day trip visitation High Difficult Medium-High
Area of Recreational High Practical Medium
Land
Media Exposure Medium Difficult Medium
Recreational value Cost of dredging Medium Practical Medium
Boating/Paddling
Boats on B/W High Moderate Medium-High
Sail/swim
Pedestrians
No. of Marina High Practical Medium
Cycling
berth/moorings
Day trip visitation High Difficult Medium
Traffic counts (the Medium Moderate-Difficult Medium
spit)
Facilitating Recreational Replacement Cost Medium-High Moderate Difficult Medium-High
Infrastructure
Waste Treatment Alternative Cost Medium-High Moderate-Practical Medium
Stormwater Disposal
Discharge Volumes Medium-High Practical Low
Wastewater Discharge
Economic Costs (Flooding, x Flood mitigation Medium Difficult Medium
Insects) costs
x Insect Spraying Low Moderate-Difficult Low
costs
Employment x No. of workers High Moderate High
Direct (eg. Jetboat) (Business site
Survey)
Indirect (eg. Personal
Trainers)
Congestion – Waterway, Boats on B/W Medium Moderate Medium-Low
Traffic
Car Traffic on Spit Medium Moderate Medium-Low
The application of a traffic light colouring system to the different criteria for the identified value
components allows the easy identification of which value component measures are most appropriate to
include in the Economic Assessment tool for the Gold Coast Broadwater. Those measures that are rated
as Practically Difficult to measure are recommended for exclusion unless they are considered to be High
in Significance and Economic Representation. On this basis we recommend the exclusion of the following
measures:
Day Trip Visitation – though it is noted that this is rated as High in Significance and Medium High in
Economic Representation
URBIS
REP-BPE0427-FINAL-310512-BROADWATER MASTER PLAN V2 APPROACH 9 Media Exposure – rated Medium on the other two criteria
Flood Mitigation Costs/Benefits – Difficult to measure and of Medium Significance and Economic
Representation
Insect Spraying Costs – whilst this is only rated Moderately Difficult to measure it is also rated as of
Low Significance and Low Economic Representation (more significant as an Ecological Measure) and
has thus been recommended for exclusion.
10 APPROACH
URBIS
REP-BPE0427-FINAL-310512-BROADWATER MASTER PLAN V23 Value Component Analysis
Having identified the Value Components and associated measures to assess the Economic Value of the
Gold Coast Broadwater it is necessary to differentiate between measures that represent current economic
value and those that represent annual economic returns. Those measures that represent current
economic value combine to form the Economic Baseline for the Broadwater. This section of the report
presents the measures of economic value of the Gold Coast Broadwater separated into current economic
value components and annual economic returns.
3.1 CURRENT ECONOMIC VALUE COMPONENTS
Current Economic Value Components incorporate those measures that represent an asset’s value at a
point in time. In relation to the Gold Coast Broadwater Economic Assessment these components and
measures are identified in the following table.
VALUE COMPONENT MEASURE
Property value - Residential, Commercial (including Site Value of property within one block of
businesses operating on foreshore) Broadwater
Value of Marina’s
Additional amenity value, brand values Area of open space Land in Broadwater
foreshore
Value of open space land in Broadwater foreshore Alternative land value (site value)
areas
Facilitating Recreational Infrastructure Replacement Cost
Waste Treatment - Stormwater Disposal; Wastewater Alternative Cost
Discharge
Employment - Direct (eg. Jetboat); Indirect (Personal x No. of workers (Business site survey)
Trainers)
The value of these components is estimated in the following sections through the compilation of
quantitative measures of value for each of the identified values.
3.1.1 PROPERTY VALUE
The value of property benefiting from proximity to the Broadwater is reflective of the value of the
Broadwater. This is considered to be a direct use value which can be traded through a market
mechanism such as a property market. The economic value of the property benefiting from the
Broadwater can be measured as the difference between the value of land in proximity to the Broadwater
and equivalent land that does not benefit from Broadwater proximity. The difficulty with discerning this is
that there are a wide range of factors that influence the value of land and finding directly equivalent
parcels can be extremely difficult and when trying to do this across the whole Broadwater foreshore, this
becomes virtually impossible. For the purposes of this assessment we have considered the property
value measure for the Broadwater to be the site value of land within one block of the Broadwater.
The benefits of this measure are:
It is consistent across locations
URBIS
REP-BPE0427-FINAL-310512-BROADWATER MASTER PLAN V2 VALUE COMPONENT ANALYSIS 11 It is a relatively consistent measure over time (this will be the case more so going forward as the
recent change from Unimproved Capital Value to Site Value will limit historical comparisons over
time)
It is able to be calculated for residential, and commercial premises and also for different precincts
It is updated either annually or every two years.
The major shortfalls of this measure are:
The conservative nature of Site Value estimates which are likely to underestimate the true value of
land (and subsequently the Broadwater)
The limited ability to compare historical values (due to change from Unimproved Capital Values to
Site Values).
To assess the property value component of the economic value of the Gold Coast Broadwater an area
surrounding the Broadwater has been compared to an area extending one block from the Broadwater
foreshore, as identified within the Broadwater study area (see map in Appendix A).
Gold Coast City Council then provided site value estimates and land size assessed by land use type
(Residential and Non-Residential) for land by suburb. The resultant valuation per square metre for the
‘Surrounding the Broadwater’ precinct has had the value per square metre for the ‘One block back’
precinct subtracted, with the difference being the uplift in value created by the Broadwater. These values
are shown in the following tables.
3.1.1.1 RESIDENTIAL
Values Summary - Residential
BROADWATER MASTERPLAN - DEFINED AREAS - 2011/12
Surrounding Broadwater 1 Block Back Difference
Valuation Catchment Size (m²) Valuation ($ per m²) Valuation Catchment Size (m²) Valuation ($ per m²) Value of Broadwater (m²)
1
Areas 2011/12 2011/12 2011/12 2011/12
Paradise Point $782,881,293 1,012,584 $773 $286,449,789 444,906 $644 $129
Hollywell $134,523,977 137,355 $979 $247,035,802 490,989 $503 $476
Runaway Bay $442,256,665 440,379 $1,004 $278,967,500 570,436 $489 $515
Biggera Waters 2 $127,189,169 58,802 $2,163 $282,022,777 434,832 $649 $1,514
3
Labrador $147,925,102 45,968 $3,218 $336,571,110 609,874 $552 $2,666
Southport $209,451,022 56,873 $3,683 $293,484,443 424,095 $692 $2,991
4
Main Beach $210,900,000 79,671 $2,647 $692 $1,955
The Spit - - - - - - -
Total $2,055,127,228 1,831,632 $1,122 $1,724,531,421 2,975,132 $580 $542
1. A reas do no t represent the actual suburbs. The area names are used purely to reference the defined areas in A ppendix B
2. Valuatio n fo r B iggera Waters based o n 'To urist & Residential' Land Use in additio n to 'Residential'
3. Valuatio n fo r Labrado r based o n 'To urist & Residential' Land Use in additio n to 'Residential'
4. M ain B each has had So uthpo rt 1B lo ck B ack applied as the co mparable.
So urce : Go ld Co ast City Co uncil (GCCC); Urbis
Residential land surrounding the Gold Coast Broadwater was estimated to be valued at $2.055
billion for the 2011/12 year.
Based on a catchment size of around 1.83 million square metres, this equates to a value per square
metre of $1,122 recorded for 2011/12
Residential land one block back from the Gold Coast Broadwater was estimated to be valued at
$1.725 billion for the 2011/12 year.
Based on a catchment size of around 2.975 million square metres, this equates to a value per
square metre of $580 recorded for 2011/12
Residential values for properties surrounding the Broadwater have seen a decline in value of around
$83.5 million between 2010/11 and 2011/12, representing a variation of just under 4%. Residential
12 VALUE COMPONENT ANALYSIS
URBIS
REP-BPE0427-FINAL-310512-BROADWATER MASTER PLAN V2values for properties one block back from the Broadwater have seen a decline in value of around $8
million between 2010/11 and 2011/12, representing a variation of around 0.5%.
Due to the geographic borders of our precincts, Main Beach did not have a comparable ‘One block back’
catchment. Based on the locality characteristics, a nominal value equal to that of Southport has been
applied.
3.1.1.2 NON-RESIDENTIAL
Values Summary - Non-Residential
BROADWATER MASTERPLAN - DEFINED AREAS - 2011/12
Surrounding Broadwater 1 Block Back Difference 5
Valuation Catchment Size (m²) Valuation ($ per m²) Valuation Catchment Size (m²) Valuation ($ per m²) Value of Broadwater (m²)
Areas 1 2011/12 2011/12 2011/12 2011/12
Paradise Point $25,836,266 20,055 $1,288 $3,996,666 4,053 $986 $302
Hollywell $13,673,333 88,871 $154 - - - $237
Runaway Bay - - - $37,725,961 125,234 $301 $237
2
Biggera Waters $775,000 1,768 $438 $11,998,333 25,984 $462 $237
Labrador - - - $476,666 1,509 $316 $237
3
Southport $230,969,564 209,487 $1,103 $245,887,035 295,212 $833 $270
Main Beach $20,700,000 3,806 $5,439 - - - $237
4
The Spit - - - -
Total $291,954,163 323,987 $901 $300,084,661 451,992 $664 $237
1. A reas do no t represent the actual suburbs. The area names are used purely to reference the defined areas in A ppendix B
2. Valuatio n fo r B iggera Waters has been remo ved based o n limited size and type o f co mparable, the average has instead been applied
3. Valuatio n fo r So uthpo rt based o n 'Other' Land Use in additio n to 'Co mmercial'
4. The Spit has been remo ved fo r no n-co mparable purpo ses
5. The difference o f the to tal catchment ($ 237) has been applied where no difference was no co mparable was available
So urce : Go ld Co ast City Co uncil (GCCC); Urbis
Non-Residential land surrounding the Gold Coast Broadwater was estimated to be valued at $404.5
million for the 2011/12 year. With The Spit removed from these calculations, Non-Residential land
surrounding the Gold Coast Broadwater was estimated to be valued at $292 million
Excluding the 670,900 square metres of The Spit, the catchment of just under 324,000 square metres
equates to a value per square metre of $901 recorded for 2011/12
Non-Residential land one block back from the Gold Coast Broadwater was estimated to be valued at
$300 million for the 2011/12 year.
Based on a catchment size of just around 452,000 square metres, this equates to a value per
square metre of $664 recorded for 2011/12
Non-Residential values consist largely of commercial properties; however community use and ‘other’
uses have also been included.
Non-Residential values for properties surrounding the Broadwater have seen a proportionately larger
decline in value than purely residential property, representing a variation of over 14%. This equates to
a difference of around $68 million between 2010/11 and 2011/12. Non-Residential values for
properties one block back from the Broadwater have seen a proportionately larger decline in value
than purely residential property, representing a variation of over 14%. This equates to a difference of
around a $49 million between 2010/11 and 2011/12.
Due to the variety and mix of land uses within suburbs for each catchment, it was impossible to ascertain
comparable values per square metre. Consequently, for the suburbs of Hollywell, Runaway Bay, Biggera
Waters, Labrador and Main Beach, a nominal figure equal to the total difference in surrounding
Broadwater value to One block back value per square metre ($237) has been applied. In addition to this,
and primarily based on its land use and size, The Spit has been excluded from the table above, with its
total featuring in section 3.1.1.3 below.
URBIS
REP-BPE0427-FINAL-310512-BROADWATER MASTER PLAN V2 VALUE COMPONENT ANALYSIS 133.1.1.3 VALUES SUMMARY
The table below progresses from both tables in sections 3.1.1.1 and 3.1.1.2 by applying the value per
square metre for each land use by the associated land surrounding the Broadwater, thus capturing the
‘value’ component provided by the Broadwater.
Values Summary
BROADWATER MASTERPLAN - DEFINED AREAS
Value - Difference ($ per m²)6 Catchment Size (m²) Value of Broadwater
Precinct Land Use 2011/12 2011/12
Paradise Point Residential $129 1,012,584 $130,935,774
Non-Residential $302 20,055 $6,060,017
Hollywell Residential $476 137,355 $65,415,295
Non-Residential $237 88,871 $21,081,391
Runaway Bay Residential $515 440,379 $226,892,577
Biggera Waters 2 Residential $1,514 58,802 $89,051,444
Non-Residential $237 1,768 $419,393
3
Labrador Residential $2,666 45,968 $122,556,746
Southport4 Residential $2,991 56,873 $170,093,471
Non-Residential $270 209,487 $56,484,322
Main Beach 5 Residential $1,955 79,671 $155,765,657
Non-Residential $237 3,806 $902,834
The Spit Non-Residential - 670,900 $112,530,769
Total 2,826,519 $1,158,189,690
1. A reas do no t represent the actual suburbs. The area names are used purely to reference the defined areas in A ppendix B
2. Valuatio n fo r B iggera Waters based o n 'Co mmunity' Land Use, 'To urist & Residential' Land Use in additio n to 'Residential'
3. Valuatio n fo r Labrado r based o n 'To urist & Residential' Land Use in additio n to 'Residential'
4. Valuatio n fo r So uthpo rt based o n 'Other' Land Use in additio n to 'Co mmercial'
5. M ain B each has had So uthpo rt 1B lo ck B ack applied as the co mparable.
6. The difference o f the to tal catchment ($ 227) has been applied where no difference was no co mparable was available
So urce : Go ld Co ast City Co uncil (GCCC); Urbis
Value uplift created by the Broadwater ranged from $129 per square metre to $2,991 per square
metre for Residential land use, and from $237 per square metre to $302 per square metre for Non-
Residential land use.
Based on the total catchment and both residential and non-residential values, the property related
value of the Broadwater is $1.158 billion. This is essentially the value created by the Broadwater
for sites in its direct surrounds.
3.1.2 MARINA VALUES
The value of marina berths for boats that access the Broadwater is considered to be a component of the
overall economic value of the Broadwater. The value of these has been estimated from information on
current asking prices for marina berths on the Broadwater and in close proximity. Maritime Safety
Queensland has provided estimates of the number of marina berths with a direct relationship to the
Broadwater. We have applied average values per lineal metre of marina berths to these figures to
estimate the overall value of marina berths benefiting from the Broadwater (shown below).
14 VALUE COMPONENT ANALYSIS
URBIS
REP-BPE0427-FINAL-310512-BROADWATER MASTER PLAN V2Gold Coast Marina Prices
BROADWATER LOCALITIES - 2011/2012
Location Length (metres) Price Price per metre Additions
Coomera River 14 $225,000 $16,071 Shed
Coomera River 15 $169,000 $11,267
Coomera River 14 $160,000 $11,429
Coomera River 16 $270,000 $16,875 Shed
Southport YC 16 $159,000 $9,938
Hope Island 30 $449,000 $14,967
Average $13,424
Base Average $10,878
So urce : www.bo atso nsale.co m.au; Urbis
We acknowledge this is a limited sample to estimate marina berth values and subsequently we have
calculated a Base Average rate which eliminates inconsistencies associated with very large marina berths
and berths that have additional factors such as sheds. The Base Average reflects a rate of $10,878 per
metre. Given this is an asking price and not a sale price which would more accurately reflect true value
we have discounted this figure by 5%. This provides an average lineal metre rate of $10,334, say $10,300
per metre. This figure has then been applied to the volume of marina berths identified as benefiting from
the Broadwater.
Gold Coast Marina Berths - Summary
BROADWATER LOCALITIES and GOLD COAST TOTAL - 2011/2012
Berths (#)
Customer Name Suburb < 12 metres 12 - 18 metres > 18 metres Total
Bayview Harbour Yacht Squadron Runaway Bay 125 69 5 199
Idjit Pty Ltd Paradise Point 4 0 0 4
Ephraim Island PBC - CTS33951 Paradise Point 71 38 7 116
Sovereign Island Marina Paradise Point 0 20 0 20
Runaway Bay Shopping Village Runaway Bay 7 1 0 8
Southport Yacht Club Inc Main Beach 87 186 13 286
Mariner's Cove Main Beach 33 58 8 99
Palazzo Versace Main Beach 16 48 25 89
Marina Mirage Main Beach 0 29 44 73
Gold Coast Fishermans Co-Op Main Beach 0 18 0 18
Howard's Landing Southport 3 2 0 5
(1) Total Broadwater Marina Berths 346 469 102 917
(2) Assumed Average metres per Berth (m) 10 14 22
(1) x (2) = (3) Estimated total Berth metres (m) 3,460 6,566 2,244
(4) Base Average ($/m) $10,300 Price per metre based on Average Sales Rates
(3) x (4) = (5) Base Average Value of Broadwater Marinas $35,638,000 $67,629,800 $23,113,200 $126,381,000
So urce : www.bo atso nsale.co m.au; M aritime Safety Queensland,Urbis
The total Value of Broadwater Marinas is estimated to be around $126 million. This has been based
on assumed average marina berth lengths with the application of a base average price per metre.
3.1.3 ADDITIONAL AMENITY AND BRAND VALUE
The amenity value of the Broadwater is reflected in a number of factors including property values, marina
values, and number of visitors to the Broadwater. There is also amenity value above these factors that is
not easily measured. This is also partly reflected in the strength of the Gold Coast brand. In economic
URBIS
REP-BPE0427-FINAL-310512-BROADWATER MASTER PLAN V2 VALUE COMPONENT ANALYSIS 15terms these are considered non-use values that do not have market values. They can be considered as
existence values and bequest values. There are no easily available direct measures of these factors
however an indirect measure can be considered the scale of open space within the Broadwater foreshore
precinct. This is a notable measure that is readily available and can be measured on an annual basis.
Impacts to the scale and quality of this land can also be assessed.
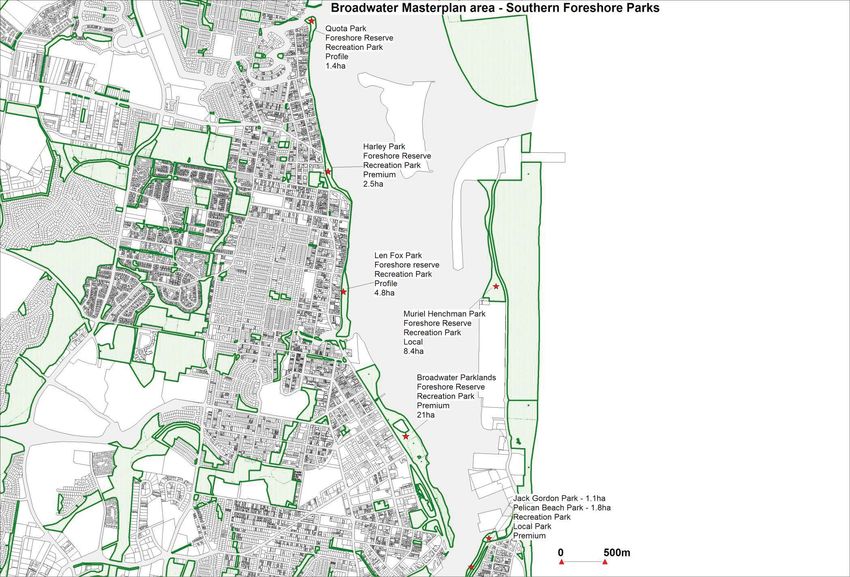
Information on the scale of the different forms of open space in the Broadwater foreshore precinct have
been provided by Gold Coast City Council Parks division. These estimates are displayed below, with
maps available in Appendix B.
Open Space Provisions
BROADWATER MASTERPLAN - DEFINED AREAS - 2010-11
Provision Type/Quality Size (m²)
James Cook Park Local 6,900
Centenary Park Local 7,600
Central Broadwater 1 Local 6,000
Central Broadwater 2 Local 16,000
Central Broadwater 3 Local 11,000
Central Broadwater 4 Local 13,000
Muriel Henchman Park Local 84,000
Jack Gordon Park Local 11,000
Paradise Point Parklands Premium 72,000
Harley Park Premium 25,000
Broadwater Parklands Premium 210,000
Pelican Beach Park Premium 18,000
Quota Park Profile 14,000
Len Fox Park Profile 48,000
Total 542,500
So urce : GCCC P arks; Urbis
3.1.4 VALUE OF OPEN SPACE
Open space land has been identified by the State Government and the Gold Coast City Council to be
preserved for the community’s use. There are a number of economic techniques for measuring non-
market goods. Shadow pricing is a common approach to measuring the value of such public goods where
a market equivalent is readily available. In this instance the residential or commercial site value. This can
be considered the opportunity cost of keeping the land as open space. In this situation the alternative
value of the land for residential or commercial use is considered to be of lower value than the value of the
land for open space otherwise the community would have chosen to use the land for these uses. Thus
the shadow price of the open space land is acknowledged as being a conservative estimate of the value
of this land.
With this in mind we have calculated the land value per square metre for each precinct based on a mix of
residential and commercial uses and multiplied this by the amount of open space in the relevant
Broadwater area. The calculation for land value per square metre is shown below.
16 VALUE COMPONENT ANALYSIS
URBIS
REP-BPE0427-FINAL-310512-BROADWATER MASTER PLAN V2Precinct Areas Size Summary BROADWATER MASTERPLAN - DEFINED AREAS - 2010-11 Areas 1 Approximate Size (sq.m)² Value of Area $/sq.m Paradise Point 1,032,639 $808,717,559 $783 Hollywell 226,226 $148,197,310 $655 Runaway Bay 440,379 $442,256,665 $1,004 Biggera Waters 60,570 $127,964,169 $2,113 Labrador 45,968 $147,925,102 $3,218 Southport 266,360 $440,420,586 $1,653 Main Beach 83,477 $231,600,000 $2,774 The Spit 670,900 $112,530,769 $168 1. A reas do no t represent the actual suburbs. The area names are used purely to reference the defined areas in A ppendix B 2. A ppro ximate sze has a 30% pro visio n subtracted fo r rao ds and water pro visio ns So urce : GCCC; Urbis This dollar per square metre rate has been established by dividing the total size (both residential and non- residential land uses) by the total value of each suburb, with all information provided by the Gold Coast City Council. The land value per square metre for each precinct has then been multiplied by the amount of open space in the relevant Broadwater area. This calculation is seen below. Open Space - Value DEFINED AREAS - 2010-11 - VALUE Provision Type/Quality Suburb Size (m²) Adopted Value James Cook Park Local Hollywell 6,900 4,520,088 Centenary Park Local Hollywell 7,600 4,978,648 Central Broadwater 1 Local Runaway Bay 6,000 6,025,582 Central Broadwater 2 Local Runaway Bay 16,000 16,068,220 Central Broadwater 3 Local Runaway Bay 11,000 11,046,901 Central Broadwater 4 Local Runaway Bay 13,000 13,055,429 Muriel Henchman Park Local The Spit 84,000 14,089,409 Jack Gordon Park Local Main Beach 11,000 30,518,586 Paradise Point Parklands Premium Paradise Point 72,000 56,387,241 Harley Park Premium Labrador 25,000 80,450,042 Broadwater Parklands Premium Southport 210,000 347,230,527 Pelican Beach Park Premium Main Beach 18,000 49,939,504 Quota Park Profile Biggera Waters 14,000 29,577,322 Len Fox Park Profile Labrador 48,000 154,464,081 Total 542,500 $ 818,351,580.63 So urce : GCCC P arks; Urbis The total Value of open space (parklands) has therefore been calculated at around $818 million for areas within the defined Masterplan area. It is important to note that this is a minimum value as the highest opportunity cost (Residential/Commercial land) has been used as a proxy of the next highest value use. 3.1.5 VALUE OF ENVIRONMENTAL LANDS Environmental land includes natural open space areas that have been retained for their environmental value. This includes National parks, State parks and forests, and Conservation parks and areas. These are considered to be of higher value than open space land (agreed by Project Steering Committee and consistent with community principles and values). The areas identified as Environmental lands in the Gold Coast Broadwater Study area are: Wave Break Island = 37 ha Mangrove area of Broadwater Parklands (south western edge) = 1.2 ha Southern point of South Stradbroke Island = 56 ha URBIS REP-BPE0427-FINAL-310512-BROADWATER MASTER PLAN V2 VALUE COMPONENT ANALYSIS 17
The principle of opportunity cost of non-developed land, such as open space, was established in the
previous Value of Open Space section. This applies an alternative land use value (residential or
commercial), that can be measured in the market, to the open space. In this case, the environmental
land. An alternative method is the cost of creating and maintaining such land (Replacement Cost
method). In the case of the Mangrove area of the Broadwater Parklands the cost to create and maintain
this land have been identified by the Gold Coast City Council as $1.3 million for 1.2 hectares of land. This
includes the costs for civil, landscape, and marine works as well as dredging costs. This equates to a cost
of $108.3/m2. Notably this cost is substantially less than the alternative use value of this land for
residential development which is in the order of $577/m2. Thus applying a replacement cost approach
substantially undervalues the economic value of Environmental land within the Broadwater. With this in
mind the opportunity cost approach of applying proxy values (shadow prices) to the environmental lands
has been adopted.

Utilising the Open Space proxy values, the minimum value of the Broadwater based environmental lands
can be estimated as outlined in the following table.

Environmental Lands - Value
DEFINED AREAS - 2010-11 - VALUE
Environmental Land                                          Assumed $/m²        Size (m²)                Adopted Value

Wave Break Island                                             Southport          370,000                    611,787,118
Broadwater Parklands (Mangrove Area - South Western Edge)     Southport          12,000                      19,841,744
South Stradbroke Island (Southern Point)                      Southport          560,000                    925,948,071

Total                                                                            942,000            $     1,557,576,934
So urce : GCCC P arks; Urbis

The total value (minimum) of environmental lands within the Gold Coast Broadwater Master Plan area is
estimated at $1.558 billion.

3.1.6           FACILITATING RECREATIONAL INFRASTRUCTURE
A further economic value component of the Gold Coast Broadwater is the value of recreational
infrastructure such as boat ramps, marine walls, jetties and wharves that facilitate and enhance business
and recreational activities on the Broadwater. Traditional market values are generally not applicable for
these forms of infrastructure as they are not generally tradeable items. Thus an appropriate method to
value these components is the replacement cost method whereby components are valued as what they
would cost to be replaced as new.

The Gold Coast City Council has provided replacement cost estimates for identified facilitating
infrastructure within the Gold Coast Broadwater foreshore areas, as outlined below.

Value of Infrastructure
BROADWATER MASTERPLAN - DEFINED AREAS - 2010/11

Component                                                                                    Value ($)

Transport and Main Roads - TSD                                                              $98,539,603

Transport and Main Roads - MSQ                                                              $38,648,675

Gold Coast City Council                                                                      $3,665,111

Sand Bypass System                                                                          $11,547,357

Total                                                                                       $152,400,746
1. Co sts are based o n NP V no t replacement co sts.
So urce: GCC; Urbis

18      VALUE COMPONENT ANALYSIS
                                                                                                                        URBIS
                                                                           REP-BPE0427-FINAL-310512-BROADWATER MASTER PLAN V2
You can also read