Large-Scale Grain Producers' Application of Land Conservation Technologies in China: Correlation Effects and Determinants - MDPI
←
→
Page content transcription
If your browser does not render page correctly, please read the page content below
sustainability

Article
Large-Scale Grain Producers’ Application of
Land Conservation Technologies in China:
Correlation Effects and Determinants
Xiaojuan Luo 1 , Shuyi Feng 2, *, Hongbin Liu 3 and Bo Zhao 1
 1    Jiangxi Economic Development Research Institute, Jiangxi Normal University, Nanchang 330027, China;
      lxj918@126.com (X.L.); zhaobo507@yeah.net (B.Z.)
 2    College of Public Administration, Nanjing Agricultural University, Nanjing 210095, China
 3    College of Land and Environment, Shenyang Agricultural University, Shenyang 110866, China;
      liuhongbinsy@syau.edu.cn
 *    Correspondence: shuyifeng@njau.edu.cn; Tel.: +86-136-051-56775

 Received: 30 November 2018; Accepted: 10 January 2019; Published: 16 January 2019

 Abstract: The quality of cultivated land has been seriously degraded due to the overuse of chemical
 fertilizer in China. Land conservation technologies (LCTs) have been proven to effectively address
 land degradation and improve land productivity. In this study, a multivariate probit model is applied
 to empirically analyze the correlation effects and determinants of the application of LCTs application
 using cross-sectional data collected on 690 large-scale grain producers from the Jiangsu and Jiangxi
 provinces in the middle and lower reaches of the Yangtze River. The sample farmers were individually
 investigated by face-to-face questionnaires in the field that included around 400 questions. The results
 revealed that there are significant complementary relationships among farm manure application,
 commercial organic fertilizer use, and green manure plantation, and between formula fertilization
 and straw returning. Regarding the determinants, highly educated farmers and farmers with a
 large farm size and high incomes are more likely to adopt LCTs. The land size variable shows
 an inverted U-shaped relationship with formula fertilization, with an inflection point at 153 mu
 (10.20 ha), while showing an U-shaped relationship with commodity organic fertilizer use and green
 manure plantation technologies, with the turning points at 207 mu (13.80 ha) and 124 mu (8.27 ha),
 respectively. The results also indicate that extension services from agricultural technicians, agricultural
 technical information, and policy knowledge variables have positive effects on the application of
 LCTs, while the subsidy policy variable does not appear to have the expected effect. To promote the
 application of LCTs, suggestions include improving the extension system, selecting targeted farmers
 for extension training, expanding environmental policy advocacy to increase farmers’ knowledge
 about land degradation, and adjusting subsidies.

 Keywords: land conservation technologies; correlation effect; multivariate probit model; large-scale
 grain producers

1. Introduction
     Land degradation caused by the excessive use of chemical fertilizer has been particularly serious in
China due to aggressive urbanization and intensive agriculture development over the last few decades.
According to the National Bureau of Statistics of China, the average amount of chemical fertilizer
application was 359.08 kg/ha in crop production in 2016 [1], which was nearly 1.60 times the international
safety threshold (225 kg/ha) [2]. However, the absorptivity of nitrogenous fertilizer, phosphate fertilizer,
and potash fertilizer were just 30%, 10~25%, and 35~50%, respectively, which were much lower than the
nutrient absorption rates of up to 60~70% in developed countries [3,4]. The excessive application but

Sustainability 2019, 11, 441; doi:10.3390/su11020441                       www.mdpi.com/journal/sustainability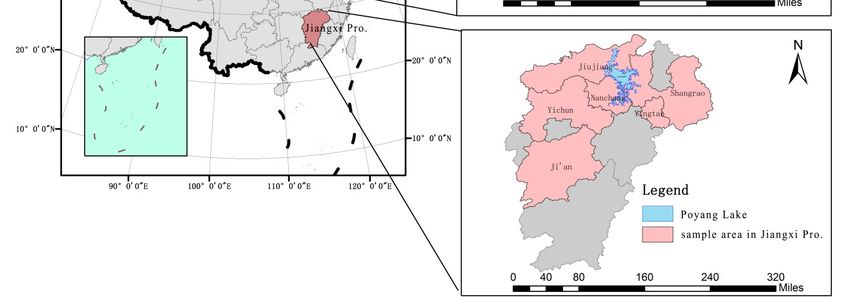
Sustainability 2019, 11, 441 2 of 17
low absorptivity of chemical fertilizer has not only led to to land degradation such as soil acidification [5]
and soil fertility reduction [6], but also the eutrophication of rivers and lakes [7,8], and even greenhouse
gas emissions [9].
In order to reduce chemical fertilizer use intensity and protect cultivated land, a series of
protection policies and measures are promulgated in China [10–12]. “The action plan for protecting
and promoting the quality of cultivated land” and “The action plan of zero growth in fertilizer
application until 2020”, which were issued by the Ministry of Agriculture and Rural Affairs, point out
that land conservation measures and technologies in terms of applying farm manure, straw returning,
formula fertilization, and green manure plantation can effectively increase the organic matter content
in soil and land productivity.
Although the above measures and techniques have achieved remarkable effects in experiment
and pilot areas, the progress of extension at the large scale is very slow. As a result, questions arise
regarding the difficulties during the process of extending LCTs, and which factors mainly determine
the application of LCTs. The answers to these two questions are of great interest to policymakers.
As the end adopters, farmers play an important role in land conservation [13–15]. Most of
the previous studies have treated farmers’ application of LCTs as mutually independent behavior,
while less literature has paid attention to the interaction among various LCTs application. Related to
empirical studies, the binary choice model is usually approached in examining the determinant
of LCTs application [16–18]. The extent of application is often investigated using truncated Tobit
models or Cragg’s double-hurdle model [19–21], while the frequency of application is analyzed by an
ordered probit model or multinomial logit model [22,23]. Generally, available research studies make
individual estimations and ignore the interactions among different applications of LCTs. However,
in real production, farmers often choose multiple LCTs at the same time, and there may be close
relationships among different applications of LCTs. Therefore, if unobserved variables affect the
application of different technologies simultaneously, the individual estimation of each technology
applying the traditional binary model may produce biased estimates. The multivariate probit model
might be a good method to address these problems.
Moreover, previous studies have mainly paid attention to the application behavior of small-scale
farmers regarding LCTs. In order to enhance agricultural modernization, the central government has
advocated agricultural-scale management in recent years in China. Meanwhile, many preferential
policies of agriculture are inclined to large-scale agricultural operators in terms of large and specialized
agricultural businesses, family farms, farmer cooperatives, and agribusinesses. According to the
statistics of the Ministry of Agriculture and Rural Affairs, the number of large-scale agricultural
operators exceeded 3.5 million, and their operated cultivated land area exceeded 0.2 billion ha,
accounting for close to 1/3 of the total contracted cultivated land area in 2016 [24].
Therefore, the objective of this paper is to empirically examine the correlation effects and
determinants of large-scale grain producers’ (note: According to the official identification in southern
China, large-scale grain producers are those whose total sown area of grain is equal or more than
3.33 ha.) application of various LCTs using cross-sectional data collected on 690 large-scale grain
producers from Jiangsu and Jiangxi provinces in the middle and lower reaches of the Yangtze River.
Specially, we aim to answer the following two questions: whether there are complementary or
substitute relationships among individual LCTs’ application; and whether are there any differences in
the application determinants of various LCTs. A better understanding of the barriers to the application
of LCTs may help policymakers and extension staff more effectively promote LCTs.
2. Data and Description of Technologies Application
2.1. Data Collection
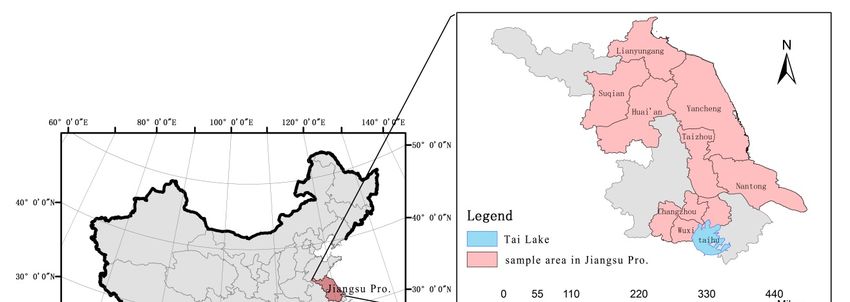
The paddy of the middle and lower reaches of the Yangtze River is one of the most important
grain-producing areas in China. However, excessive fertilizer application results in many problemsSustainability 2019, 11, 441 3 of 17
in terms of2019,
Sustainability soil 11,
acidification, land fertility reduction, and heavy metal pollution [5,6,25,26]. This
x FOR PEER REVIEW 3 of is
16
the main reason to select this area as study region, and specially choose Jiangxi Province and Jiangsu
Province as
Province as survey
survey areas
areas (see
(see Figure
Figure 1).
1). On one hand, the two sample provinces are both both in in the
the
ecologically sensitive basin
ecologically basin areas.
areas.Jiangxi
JiangxiProvince
Provinceis is
perched
perched onon
Poyang
PoyangLake, which
Lake, is not
which onlyonly
is not the
biggest
the biggestfreshwater
freshwater lake in in
lake China,
China,but also
but alsothe
thebiggest
biggestecological
ecologicalwetland
wetland in
in Asia, while Jiangsu
Jiangsu
Province is
Province is located
located inin Taihu
TaihuLakeLakeBasin,
Basin,which
whichisisthe
thesecond
secondlargest
largestfreshwater
freshwaterlake
lakein
inChina.
China. On On the
the
otherhand,
other hand,thethe twotwo sample
sample provinces
provinces respectively
respectively represent
represent the developing
the developing regions
regions and and the
the developed
developed
regions regionsDifferences
in China. in China. Differences
among theamong the large-scale
large-scale producers’producers’ application
application of LCTs
of LCTs under under
different
different economic
economic development development
levels canlevels
also becan also be explored.
explored.
Figure 1.
Figure 1. Location of the study areas
areas in
in Jiangsu
Jiangsu and
and Jiangxi
Jiangxi provinces,
provinces, China.
China.
The
The data
data used
used in
in this
this study
study were
were collected
collected from
from aa sampling
sampling survey
survey of of 690
690 large-scale
large-scale grain
grain
producers in survey areas from July to September 2016. The stratified random
producers in survey areas from July to September 2016. The stratified random sampling was adopted sampling was adopted
in
in samples
samples selection. First of all, eight sample counties (districts) were selected
selection. First selected according
according to to the
the
economic
economic situation and cultivated land area in each province. From each selected
and cultivated land area in each province. From each selected county, two to four county, two to
four sample
sample towns towns
werewere randomly
randomly selected
selected based
based ononthethe proportionofofcultivated
proportion cultivatedland
land area.
area. We
We then
then
randomly
randomly selected
selected2020famers
famersaccording
accordingtotothe theroster
rosterofoflarge-scale
large-scalegrain
grainproducers
producers inineach
eachtown.
town.AsAs a
result, a total of 704 large-scale grain producers in 40 towns from two provinces
a result, a total of 704 large-scale grain producers in 40 towns from two provinces were individually were individually
investigated
investigated through
through aa face-to-face
face-to-face questionnaire
questionnaire survey by trained interviewers consisting of PhD,
Masters,
Masters, andand undergraduate
undergraduate students
students majoring
majoring in in agricultural
agricultural and and resource
resource economy.
economy. We finallyfinally
used 690 samples
used 690 samples after eliminating samples with insufficient information and without grain planting.
AA structured
structured questionnaire
questionnaire with with three
three sections
sections was
was used
used in in this
this survey
survey that
that included
included about
about 400
400
questions, nearly half of which were open
questions, nearly half of which were open questions. questions. The first section collected information regarding
regarding
the
the characteristics
characteristics of of the
the individual
individual large-scale
large-scale grain
grain producer
producer and and his/her
his/her household,
household, suchsuch as the age,
education
education level,
level, cultivated
cultivated areas,
areas, off-farm
off-farmemployment,
employment,among amongothers.
others. The
The second
second part
part related
related to
to the
the
application of LCTs. The third section involved gain
application of LCTs. The third section involved gain production, production, including inputs (i.e., labor input,
fertilizer
fertilizer intensity,
intensity,pesticide
pesticideused)used)and
andoutputs.
outputs.Sustainability 2019, 11, 441 4 of 17
2.2. Technologies Application
The LCTs in this study mainly include farm manure application, commercial organic fertilizer
use, formula fertilization, green manure plantation, and straw-returning technology (see Table 1).
Specifically, farm manure application mainly refers to using the manure of human and livestock
as fertilizer. Farm manure contains large amount of organic matter that is difficult to decompose,
resulting in the nutrients being difficult to be absorbed or utilized by the crops directly. It’s said that
farm manure needs at least three to five years to be fermented and decomposed [27]. Farm manure
application is a labor-intensive traditional technology because of the large amount of application and
the high cost of collection and transportation.
Table 1. Characteristics of the five land conservation technologies (LCTs).
Commercial Formula Green Manure Straw
Farm Manure
Organic Fertilizer Fertilization Plantation Returning
Environment-friendly √ √ √ √ √
technology √ √ √
New technology
√ √
Traditional technology
√
Short-term investment
√ √ √ √
Long-term investment
Commercial organic fertilizer actually consists of farm manure processed by fertilizer
manufacturers, and its organic matter is fully decomposed into humus, which is easier to be
absorbed [28]. Moreover, the nutrient ratio of commercial organic fertilizer can be adjusted according to
different soil conditions, so the nutrient proportion is more reasonable than original farm manure [28].
Obviously, the price of commercial organic fertilizer is much higher than farm manure. Overall, it is a
labor and capital-intensive technology, as well as a new technology.
Formula fertilization is a new technology that refers to arranging the application quantity and
proportion of nitrogen, phosphorus, potassium, and other medium elements according to the crops’
growth stage and nutrient demands [29,30]. Compared to organic fertilizer, the technically-based
formula fertilization is much more effective on major nutrient supply to crops, but does not provide any
ground for organic matter conservation and increase in soils. Formula fertilization can reduce fertilizer
application and increase the yield, but it needs more labor input due to site-specific management [30].
Green manure belongs to biological fertilizer with complete nutrients. The stems and leaves
of green manure crops are rich in nutrients, which can greatly increase the organic matter, nitrogen,
phosphorus, potassium, and various trace elements in the soil after it is decomposed [31,32].
Green manure crops not only have great effects on the improvement of soil fertility, but also prevent or
reduce the loss of water, soil, and fertility due to lush stems and leaves covering the ground. Compared
to the other LCTs, green manure needs only a small amount of seeds and fertilizer, which has lower
labor and transportation costs. Therefore, green manure plantation is a traditional technology that is
not high in the demand of labor or capital.
Straw returning technology is a new technology that refers to applying the straw to the field as
fertilizer by chemical decaying or mechanical pulverization, which can not only increase the content of
organic matter in soil, but also avoid the air pollution caused by straw burning. Previous studies have
indicated that straw returning significantly improved soil structure and increased soil nutrients content
in terms of soil organic matter, total nitrogen, available phosphorus, and potassium after continuous
application for several years [33,34]. In our study area, straw returning is generally comminuted by
machine, which is a new capital-intensive technology due to renting the machine.
Figure 2 shows the number of adopters of each LCT in the sample areas. In view of the
overall technology application, the application rate of straw returning technology is the highest,
reaching 72.75%, while the application rates of farm manure application, commercial organic fertilizer
use, and green manure plantation are less than 15%. Specially, the application rate of the formulaSustainability 2019, 11, 441 5 of 17
Sustainability 2019, 11, x FOR PEER REVIEW 5 of 16
fertilization is only 21.45%, which has been the key popularized project tactic by the government since
fertilization is only 21.45%, which has been the key popularized project tactic by the government
2005. In view of the regional differences in technology application, the application rate of farm manure
since 2005. In view of the regional differences in technology application, the application rate of farm
application, commercial organic fertilizer use, and straw returning technology in Jiangsu Province
manure application, commercial organic fertilizer use, and straw returning technology in Jiangsu
were higher than that in Jiangxi Province. Meanwhile, the adoption of formula fertilization and straw
Province were higher than that in Jiangxi Province. Meanwhile, the adoption of formula fertilization
returning technology were the opposite.
and straw returning technology were the opposite.
700 Number of farmers
Jiangsu sample
600
Jiangxi sample
502 (72.75%)
500 Total sample
400 353
300
200 149 148 (21.45%)
52 (7.54%) 94 81 (11.74%) 94 (13.6%)
100 54 59 57
37 22 37
15
0
Straw returning Green manure Formula Commercial Farm manure
technology plantation fertilization organic fertilizer application
use
Figure 2.
Figure 2. Numbers
Numbers and proportion of
and proportion adopters of
of adopters of land
land conservation
conservation technologies
technologies (LCTs) in sample
(LCTs) in sample
areas. Note:
areas. Note: The
The percentage
percentage in
in the
the parenthesis
parenthesis above
above the
the third
third bar per category
bar per means the
category means the proportion
proportion
of the
of the corresponding
corresponding LCT
LCT adopters
adopters in
in the
the total
total sample.
sample.
3. Methodology
3. Methodology
3.1. Empirical Model
3.1. Empirical Model
Large-scale
Large-scale grain
grainproducers
producers may simultaneously
may simultaneously selectselect
multiple LCTs. LCTs.
multiple If we individually estimate
If we individually
each technology application applying traditional binary model and ignoring the correlation
estimate each technology application applying traditional binary model and ignoring the correlation between
the error terms
between of different
the error terms ofmodels, wemodels,
different might get
webiased
mightestimates.
get biasedTo avoid thisTo
estimates. problem, a multivariate
avoid this problem, a
probit model is a good choice, which allows the existence of correlation among
multivariate probit model is a good choice, which allows the existence of correlation among thethe error terms of
error
different equations [35]. For cross-sectional data, the multivariate probit model can
terms of different equations [35]. For cross-sectional data, the multivariate probit model can be be expressed
as follows:as follows:
expressed
Y∗j = β j X + µ j (1)
*
j
Y X
1, I f Y j > 0
j ∗ j
(1)
Yj = (2)
0, others
*
1,If
Y
where Yj * is an unobserved latent variable consisting
j Y 0
(2)
j
0of
,multiple
others binary dependent variables; meanwhile,
j = 1, 2, 3, 4, and 5, respectively indicate the application of farm manure, commercial organic fertilizer,
where Yfertilization,
formula j* is an unobserved
green manure latentplantation,
variable consisting of multiple
and straw returning binary dependent
technology. Meanwhile,variables;
Yj is the
meanwhile,
final result variable; Yj *4,>and
j = 1, 2,if3, 0, Yj 5, respectively
is 1, indicate
indicating that the application
large-scale of farm
grain producers manure,
adopt commercial
the corresponding
organic fertilizer,
technology, formula
otherwise, it isfertilization,
0. X is a vectorgreen ofmanure plantation,
variables that may andaffect
straw returning application,
technology technology.
Meanwhile,
including Yj is
the the final
farmer andresult variable;
household if Yj > 0, Yj is 1,
*
characteristics, indicating
land that large-scale
endowment, technologygrain producers
information,
adopt
and the corresponding
policy cognition; β is atechnology, otherwise,
vector of unknown it is 0. Xtoisbeaestimated;
parameters vector of µ~N
variables
(0, σ2)that may
refers to affect
those
technology application, including the farmer and household characteristics,
factors that are not included in the model, such as measurement errors and left-out explanatory variables.land endowment,
technology information, and policy cognition; β is a vector of unknown parameters to be estimated;
μ~N (0, σ2) refers to those factors that are not included in the model, such as measurement errors and
left-out explanatory variables. The covariance ψ conforms to the multivariate normal distribution
covariance. The covariance matrix is as follows:Sustainability 2019, 11, 441 6 of 17
The covariance ψ conforms to the multivariate normal distribution covariance. The covariance matrix
is as follows:
1 ρ12 ρ13 ρ14 ρ15
ρ
21 1 ρ23 ρ24 ρ25
ψ = ρ31 ρ32 1 ρ34 ρ35
(3)
ρ ρ ρ 1 ρ
41 42 43 45
ρ51 ρ52 ρ53 ρ54 1
where the non-diagonal elements represent the unobservable links among the random perturbation
terms of the five models. The non-zero value of the non-diagonal elements means that there is a
correlation between the two random perturbations of the corresponding equations, which indicates
that it is suitable to apply the multivariate probit model. The positive value of the element shows that
there is a complementary effect between the applications of the two technologies, while the negative
value implies the substitute effect.
3.2. Variable Definition and Descriptive Statistics
Previous studies on the determinants of environment-friendly agricultural technologies have
grouped factors affecting technology application into five categories, namely: farmer characteristics
(Age, Education, Cadre, and Risk), farm household characteristics (Hsize, Hincome, and Off-Farm),
land endowment (Lscale, Fragmentation, Road, and Lsecurity), technology information and policy
variables (Extension, Tinformation, Policy, and Subsidy). Table 2 summarizes the definitions,
descriptive statistics and expected effects of the variables.
It’s worth noting that the risk attitude of farmers was investigated by asking the following
seven measure events based on a five-point Likert scale, in which one was labeled strongly disagree,
three indicated neither agree nor disagree, and five meant strongly agree. (1) No risk, no income;
(2) I am willing to take more risk to gain more income; (3) I would like to invest something without risk;
(4) I do not invest in some new products because of the risk; (5) I would prefer a riskless investment;
(6) I would invest heavily in some profitable investment and even take out a loan from others for this
investment; (7) I like to attend the lottery due to the chance of gaining lots of money unexpectedly.
Secondly, we unified the risk attitude direction of each question due to a higher score meaning risk
preference in some events and risk aversion in other events. Then, we calculated the risk index based
on the average score of the seven measure events. Regarding the farmer and household characteristics
variables, most of the surveyed large-scale grain producers are at the age of 40~50 years, and have
a middle school education, which is consistent with most of the farmers in China being middle-age
with limited education [36] (see Table 2). Three percent of the survey respondents undertook a post of
village cadres. Most of the samples tended to be risk-averse. The average number of family members
of the surveyed grain producers was nearly five, and their average household annual gross income was
RMB 450,000 (USD 65,880), with an off-farm income share at about 23%. This is quite different from the
ordinary small-scale farmers in rural China, whose off-farm income proportion is around 40% [37,38].
Regarding land management characteristics variables, due to the respondents being large-scale grain
producers, the mean cultivated land is 264.06 mu (17.6 ha), but only 13% of the respondents obtained a
certificate for management rights on rented land. However, each household had on average 90 plots,
resulting in the serious fragmentation of land holdings (0.19 ha per plot). Related to technical
information and policy variables, 77% of the samples received agricultural technology information
from various media, which included an agricultural technology extension station, TV, and network,
among others. Most of the respondents know a little about the zero growth policy of chemical fertilizer,
and approximately 76% of the samples get related subsidies to large-scale grain producers.Sustainability 2019, 11, 441 7 of 17
Table 2. Definition and descriptive statistics of the variables.
Variables Definition Mean S.D.
Dependent variables
T1 1 = Farmer applied farm manure; 0 = otherwise 0.14 0.34
T2 1 = Farmer applied commercial organic fertilizer; 0 = otherwise 0.12 0.32
T3 1 = Farmer applied formula fertilization; 0 = otherwise 0.21 0.41
T4 1 = Farmer planted green manure; 0 = otherwise 0.08 0.26
T5 1 = Farmer applied straw returning technology; 0 = otherwise 0.73 0.44
Independent variable
Age of household head, 1 = less than 30 years; 2 = 31–40 years;
Age 3.58 0.86
3 = 41–50 years; 4 = 51–60 years; 5 = older than 60 years
Education of household head, 1 = primary school or below;
Education 2.02 0.83
2 = middle school; 3 = high school; 4 = college or above
Cadre 1 = household head is a village cadre; 0 = otherwise 0.03 0.16
Risk attitude of household head, 1 = risk averse;
Risk 2.89 0.56
5 = risk preference. Risk preference is rising from 1 to 5
Hsize Family members in total 4.86 1.91
Hicome Household annual income, 10 thousand Yuan 45.00 78.11
Off-farm Share of off-farm income to total income, % 0.23 0.23
Lscale a Land scale, Mu (ha) 264.06 (17.60) 474.62 (31.64)
Fragmentation Number of land plots 90.44 190.03
Road construction in field: 1 = very bad; 2 = bad; 3 = medium;
Road 3.38 1.03
4 = good; 5 = very good
Rotation 1 = single cropping; 0 = double cropping 0.23 0.42
Lsecurity 1 = obtained certificate; 0 = otherwise 0.13 0.33
Extension Assess to extension service: 1 = no; 2 = medium; 3 = yes 2.35 0.86
Obtained agricultural technology information from various
Tinformation 0.77 0.42
media: 1 = yes; 0 = no
Knowledge on zero growth of chemical fertilizer policy:
Policy 1 = never heard of; 2 = a little; 3 = basically understand; 2.30 1.18
4 = understand well; 5 = full knowledge
1 = get related subsidies to large-scale grain producers;
Subsidy 0.76 0.43
0 = otherwise
Region Region dummy: 1 = Jiangsu; 0 = Jiangxi 0.52 0.50
Note: In the empirical model, the square term of the land management scale is introduced to capture the possible
nonlinear relationship between land area and the application of LCTs.
4. Results
4.1. Correlation Effects
Stata14.0 is used to estimate the multivariate probit model for the application behavior of
large-scale grain producers for the various technologies, and Table 3 shows the covariance matrix
of the regression equation. The results show that the chi-square value of the model is 49.14 with
p = 0.000, indicating that correlation indeed exists among the random perturbation terms of various
equations, and it is appropriate to use the multivariate probit model in this study. There are four
covariances in the matrix that passed the significance test, and all of them had a positive correlation,
which shows that there are significant complementary relationships among the application of farm
manure, commercial organic fertilizer use, and green manure plantation, and between formula
fertilization and straw returning technology.Sustainability 2019, 11, 441 8 of 17
Table 3. Covariance matrix of regression for the multivariate probit model.
Commercial Formula Green Manure Straw
Farm Manure
Organic Fertilizer Fertilization Plantation Returning
Farm manure — — — — —
Commercial organic fertilizer 0.237 *** (0.083) — — — —
Formula fertilization −0.057 (0.078) 0.027 (0.084) — — —
Green manure plantation 0.451 *** (0.082) 0.364 *** (0.094) −0.111 (0.096) — —
Straw returning technology 0.037 (0.090) 0.013 (0.094) 0.269 *** (0.080) 0.083 (0.105) —
Note: The null hypothesis of the likelihood ratio test: ρ21 = ρ31 = ρ41 = ρ51 = ρ32 = ρ42 = ρ52 = ρ43 = ρ53 = ρ54 = 0,
chi-square = 49.14, and p-value = 0.000. The parenthesis is standard error. *, **, *** denote statistical significance at
10%, 5%, and 1%.
4.2. Estimation Results
Table 4 and Figure 3 show the estimation results of multivariate probit regression. Generally,
the fitting degree of the model is good, and the key explanatory variables basically pass the significance
test with expected directions. The multicollinearity of the regression variables is examined by the
variance inflation factor (VIF). The mean VIF is 5.63, which is less than the threshold value 10 [39].
The only variable close to the threshold is land scale and its square, due to the latter being derived
directly from the former. Therefore, there is no evidence of multicollinearity in the analysis. What’s
more, heteroskedasticity robust standard errors are applied in the regressions.
Table 4. Regression results for the multivariate probit model.
Commercial Formula Green Manure
Farm Manure Straw Returning
Organic Fertilizer Fertilization Plantation
Age −0.006 (0.080) 0.049 (0.083) −0.066 (0.072) −0.039 (0.086) −0.118 (0.088)
Education 0.140 * (0.084) 0.237 *** (0.083) 0.063 (0.075) 0.011 (0.102) 0.012 (0.097)
Cadre −0.124 (0.372) 0.055 (0.393) 0.660 ** (0.321) −0.164 (0.472) 0.441 (0.469)
Risk −0.219 ** (0.108) −0.222 * (0.119) 0.114 (0.099) −0.038 (0.128) 0.108 (0.122)
Hsize −0.027 (0.167) 0.304 * (0.172) 0.288 * (0.156) −0.119 (0.209) 0.007 (0.199)
Hicome 0.006 (0.097) 0.130 (0.094) −0.082 (0.090) 0.170 (0.107) 0.201 * (0.108)
Off-farm −0.114 (0.415) −0.342 (0.398) 0.377 (0.365) 0.403 (0.491) −0.602 (0.492)
Lscale −0.266 (0.340) −0.640 *** (0.328) 0.624 * (0.372) −0.646 * (0.391) 0.383 (0.377)
Lscale ˆ 2 0.017 (0.033) 0.057 * (0.032) −0.062 * (0.034) 0.067 * (0.036) −0.037 (0.037)
Fragmentation −0.053 (0.050) 0.028 (0.051) 0.187 *** (0.052) 0.036 (0.068) 0.062 (0.078)
Road 0.107 * (0.061) −0.006 (0.065) −0.018 (0.058) 0.054 (0.071) 0.102 (0.069)
Rotation −0.084 (0.177) 0.051 (0.210) −0.416 *** (0.157) −0.234 (0.182) 0.141 (0.147)
Lsecurity 0.179 (0.177) 0.169 (0.181) 0.175 (0.164) 0.358 * (0.194) −0.521 ** (0.222)
Extension 0.009 (0.078) 0.013 (0.086) 0.162 ** (0.073) 0.136 (0.099) 0.251 *** (0.075)
Tinformation 0.594 *** (0.190) 0.193 (0.193) 0.238 * (0.145) 0.455 ** (0.218) 0.393 *** (0.147)
Policy −0.010 (0.051) 0.126 ** (0.054) −0.043 (0.049) 0.026 (0.064) 0.124 * (0.065)
Subsidy −0.122 (0.150) 0.401 ** (0.174) −0.251 * (0.131) −0.185 (0.164) 0.118 (0.158)
Region −0.009 (0.188) 0.445 ** (0.199) −0.406 ** (0.180) −0.852 *** (0.247) 2.672 *** (0.258)
Constant −0.419 (1.413) −2.724 * (1.545) −2.029 (1.407) −1.856 (1.650) −4.205 *** (1.564)
Note: Log likelihood = −1163.84, Wald X2 (126) = 479.62, and p-value = 0.000. The parenthesis is robust standard
error. *, **, *** denote statistical significance at 10%, 5%, and 1%.Sustainability 2019, 11, 441 9 of 17
Sustainability 2019, 11, x FOR PEER REVIEW 9 of 16
0.8
0.6
0.4
Model coefficient
0.2
0
-0.2
-0.4
-0.6
-0.8
Farm manure Commercial organic fertilizer Formula fertilization
Green manure plantation Straw returning
Figure
Figure 3.
3. Determinants
Determinants of
ofLCTs’
LCTs’ application
application for
for large-scale
large-scale grain
grain producers.
producers. The
The bars
bars are
are independent
independent
variables
variables with
with significant
significant effect
effect (p < 0.1),
(p < 0.1), showing
showing thethe impact
impact direction
direction (positive
(positive or
or negative)
negative) and
and
magnitude (length of the bar).
magnitude (length of the bar).
4.2.1. Farmer
4.2.1. Farmer Characteristics
Characteristics
Among the
Among the variables
variables related
related to to human
human capital,
capital, the
the formal
formal education
education of of the
the household
household head head plays
plays
a positive role on the application of soil fertility improvement technology
a positive role on the application of soil fertility improvement technology or environment-friendly or environment-friendly
agricultural technology
agricultural technology [22,40].
[22,40]. AsAs expected,
expected, the the coefficients
coefficients of of education
education on on all
all ofof the
the LCT
LCT models
models
are positive,
are positive, and
and the
the coefficients
coefficients of of farm
farm manure application and
manure application and commercial
commercial organic
organic fertilizer
fertilizer use
use
appear significant at 10% and 1%, respectively, which implies that higher
appear significant at 10% and 1%, respectively, which implies that higher education can promote the education can promote the
application of
application of LCTs
LCTsforforlarge-scale
large-scalegrain grainproducers
producers (see Figure
(see Figure3 and Table
3 and 4). It4).
Table is It
because farmers
is because with
farmers
higher education are more aware of environmental protection and
with higher education are more aware of environmental protection and more easily accept the more easily accept the advanced
scientific ideas
advanced and technologies.
scientific ideas and technologies.
The village
The village cadre
cadre variable
variable is is positively
positively related
related to to the
the adoption
adoption of of formula
formula fertilizer.
fertilizer. A A possible
possible
explanation is that the village cadres are the main participants involved
explanation is that the village cadres are the main participants involved in soil testing and formula in soil testing and formula
design, which
design, whichare arethe
themost
most important
important processes
processesof formula fertilizer
of formula production.
fertilizer Therefore,
production. the farmers
Therefore, the
with village
farmers withcadre positions
village cadre knowpositionsmore aboutmore
know this technology, resulting in aresulting
about this technology, higher possibility
in a higher of
application. It is in accordance with the conclusion that the farmers’ policy
possibility of application. It is in accordance with the conclusion that the farmers’ policy arena plays arena plays an important
roleimportant
an in the adoption
role in oftheinnovations
adoption ofand technical and
innovations extensions
technical [41].
extensions [41].
Available studies have indicated that farmers with
Available studies have indicated that farmers with risk preference are risk preference are more
more likely
likely toto adopt
adopt new
new
agricultural technology [42–44]. As shown in Table 4 and Figure 3, risk preference
agricultural technology [42–44]. As shown in Table 4 and Figure 3, risk preference shows a significant shows a significant
negative correlation
negative correlationwith with thethe
twotwotraditional
traditionaltechnologies.
technologies.More More
concretely, keepingkeeping
concretely, the otherthe variables
other
constant, a one-point growth in the risk preference score is associated with a
variables constant, a one-point growth in the risk preference score is associated with a decrease in the decrease in the probability
of adopting farm
probability manure application
of adopting farm manure and commercial
application organic
and fertilization
commercialbyorganic approximately 0.219 and
fertilization by
0.222, respectively.
approximately 0.219However,
and 0.222, risk attitude hasHowever,
respectively. no effect on theattitude
risk application of new
has no effecttechnologies such as
on the application
formula
of fertilization such
new technologies and straw returning
as formula technology.
fertilization and straw returning technology.
4.2.2. Farm
4.2.2. Farm Household
Household Characteristics
Characteristics
Household size
Household sizerepresents
representsthethe reserve
reserve of human
of human resource.
resource. According
According to thetoliterature,
the literature,
labor
labor constraints may influence farmers’ technology adoption [45,46], especially constraints
constraints may influence farmers’ technology adoption [45,46], especially constraints regarding regarding
the
the application of a labor-intensive technology [47]. As a result, the household size has a significant
application of a labor-intensive technology [47]. As a result, the household size has a significant role
rolepromoting
in in promotingthe the application
application of of commercial
commercial organicfertilizer
organic fertilizeruse
useand
and formula
formula fertilization,
fertilization,
suggesting that the more abundant the labor force, the more conducive the adoption
suggesting that the more abundant the labor force, the more conducive the adoption of labor- of labor-intensive
technology,
intensive which is inwhich
technology, accordance with the conclusions
is in accordance of Thangataofand
with the conclusions Alavalapati
Thangata [48]. Specifically,
and Alavalapati [48].
Specifically, while the other variables are fixed, a one-person increase in family members is associatedSustainability 2019, 11, 441 10 of 17
while the other variables are fixed, a one-person increase in family members is associated with a growth
in the probability of adopting commercial organic fertilizer and formula fertilization by approximately
0.304 and 0.288, respectively.
Previous studies have indicated that farm income affects the ability to adopt innovations due to
farmers with higher farm incomes having access to more resources to purchase inputs and acquire
information prerequisites in order to adopt a new technology [41]. As observed in Table 4 and
Figure 3, the coefficient of this variable just shows a significantly positive impact on the straw returning
technology application model. A possible explanation is that the farmers who adopt this technology
need to spend extra RMB 20~80 per mu (USD 44~176 per ha) on hiring machinery to smash the straw
before putting it into the field, and the farmers with higher income are more capable of adopting the
higher cost technology. Meanwhile, the impacts of household income on the other four technologies
are not statistically significant, indicating that the economy is not the main constraint on the application
of these technologies by large-scale grain producers.
4.2.3. Land Endowment and Infrastructure
Farmers with large land scale will benefit from economies of scale when using more inputs as the
returns will be larger, and this also occurs in the application of new agricultural technologies. That is,
a large land scale would increase the probability of adopting new agricultural technologies [42,49–51].
However, the results reveal significantly non-monotonous effects of land scale on commercial organic
fertilization, formula fertilization, and green manure plantation, which indicate that the expansion of
land scale does not necessarily lead to the rise or decline of the technology application rate. On one hand,
land scale has a significant inverted U-shaped relationship to the application of formula fertilization
with an inflection point at 153 mu (10.20 ha). One possible explanation is that at the beginning
of land-scale expansion, the application rate of formula fertilization may rise due to the obvious
economies of scale (cost reduction and profit increase). However, with the further expansion of land
scale, high transaction costs regarding supervision and management lead to the gradual decrease
of the application of labor-intensive technologies. This result is similar to the conclusion obtained
by Liu et al. [52]. On the other hand, the land-scale variable appears to have a significant U-shaped
relationship to both commercial organic fertilization and green manure plantation, with turning points
at 207 mu (13.80 ha) and 124 mu (8.27 ha), respectively. This is in accordance with the results of
Man et al. [53] and Guastella et al. [54], who indicated that the technology investment would not be
worth it below the land threshold, especially on medium or long-term investments [53]. Therefore,
large-scale grain producers may have the threshold of land scale when they select some medium
or long-term investment such as organic manure and green manure plantation, and the possibility
of adopting such kinds of technologies would be greatly improved upon only reaching a certain
land scale.
Land fragmentation refers to farmers that have more pieces of land that are also small in size and
scattered in different places. Land fragmentation has shown to pose a challenge in labor allocation [55]
and management [42], which is detrimental to the adoption of some soil improvement technologies [56].
Unexpectedly, land fragmentation has positive impacts on the application of most LCTs, and is
statistically significant at 1% in the formula fertilization model. After controlling for the other variables,
a one-plot increase leads to the probability of formula fertilization application rising by about 0.187.
A possible explanation is that farmers are eager to compensate for the efficiency loss caused by
land fragmentation through adopting LCTs, which can improve the soil fertility in the short term.
Formula fertilizer is a kind of chemical fertilizer that can achieve this aim, while the other four
technologies belong to long-term investments.
Available researchers have concluded that stable land property rights effectively stimulate farmers’
land conservation investment, especially some long-term investments [57–59], because farmers are not
willing to invest in land that possibly belongs to someone else next year [60,61]. As a result, there is a
significant positive correlation between land tenure security and green manure plantation. It is saidSustainability 2019, 11, 441 11 of 17
that farmers obtained the certificate of rented land’s management right, meaning that stable land
property rights are more favorable for applying medium or long-term agricultural technology, such as
green manure plantation. This result is in accordance with the conclusion of previous studies [57,58,62].
However, unexpectedly, land tenure security and straw returning technology show a significant
negative correlation. The possible explanation is that the straw returning technology is still imperfect
at present in China. Many respondents observed that the machine cannot smash the straw completely,
which hindered the operation of the land plough, as well as irrigation and fertilization in the later
period. What’s worse, soil microorganism breed from straw decay would snatch nutrients against crop
seedling, resulting in crop malnutrition and even death. Liu et al. [52] also found similar conclusions.
Perfect infrastructure in the field results in lower transportation cost, and is conducive to applying
those technologies that need massive transportation, such as organic fertilizer. Normally, the application
amount of chemical fertilizer purity is around 0.36 t/ha, while the amounts of commercial organic
fertilizer and farm manure for rice are approximately 4~6 t/ha and 15~22.5 t/ha, respectively. Therefore,
road construction is expected to have a positive effect on the application of farm manure and commercial
organic fertilizer. Unexpectedly, the result appears to have no relationship between road construction
and the application of LCTs, except regarding the application of farm manure. A possible explanation
may be that the massive application amount of farm manure is mainly transported by tracts, which are
highly dependent on road infrastructure in the field, while the other LCTs rely on road construction
less due to their comparable smaller use amount farm manure application.
4.2.4. Extension Service and Technical Information
The extension service is used to deliver a good experience when applying agricultural technology
to farmers. It is investigated that the farmers who maintained frequent contact with extension workers
were better able to adopt the extended technology [22]. Similarly, the role of the extension service
in effecting land-enhancing technology adoption was noted by Baidu-Forson [63]. As expected,
the extension service has had promoting effects on the application of all of the LCTs. The coefficients
regarding the formula fertilization and straw returning technology models turned out to be positive
and statistically significant at 5% and 1%, respectively. This revealed that it is very important to build a
wide-reaching and functional extension system. Therefore, the farmers can easily access a technical
guidance service, which is helpful for improving their understanding of the technological strength of
the applications, and then transferring it into action.
Agricultural information plays an important role in applying LCTs [22,64]. If the farmers have
access to accurate agricultural technical information, they can adequately understand the technical
benefits and thus improve the possibility of technology application. As expected, the coefficients of
technical information on five LCTs are positive, four of which are statistically significant. This reveals
that the farmers who acquire technical information on good agricultural practices from various sources
can enhance their application of LCTs. It is worth mentioned that most of the technical information is
collective from TVs, networks, and especially mobile phones. As noted by the studies of Mittal and
Tripathi [65] and Baumuller [66], telecommunication is becoming an important mode of agricultural
information delivery and sharing among farmers.
4.2.5. Policy Knowledge and Subsidy
Agricultural policy knowledge has a great impact on environment-friendly technology
adoption [67]. It is hypothesized that the large-scale grain producers with higher knowledge of
land conservation policies such as the zero growth of chemical fertilizer have a greater possibility of
adopting LCTs. As a result, the policies knowledge variable appears to have a significantly positive
relationship with the use and application of commercial organic manure and straw returning technology.
Specifically, keeping the other variables constant, after a one-grade improvement of policy knowledge,
the application probabilities of commercial organic manure use and straw returning technology would
increase 0.126 and 0.124, respectively.Sustainability 2019, 11, 441 12 of 17
Receiving governmental grants or subsidies is another effective factor for the application of LCTs,
which can supply initial capital and reduce the technology cost [42,61]. The government has adjusted
agricultural subsidies aiming to support land conservation and large-scale grain production in China
since 2015. However, the results are quite different from expectations. Except for commercial organic
fertilizer, subsidies have either no impacts or negative effect on the LCTs. The possible explanation is
mainly related to the complex types of subsidies, but the integrated disbursement mode of subsidies
in China. Specifically, large-scale grain producers can receive many types of agricultural subsidies,
including subsidies on land fertility protection, land scale management, straw returning, green manure
plantation, and subsidies on environmental fertilization such as organic fertilizer and formula fertilizer
(see Appendix A). However, all kinds of agricultural subsidies are dispensed together through a bank
card named the “one-card-pass”; thus, the farmers are not clear about the exact type and amount of
different subsidies. Therefore, it is difficult to observe the driving effect of relevant subsidy variables
on the application of LCTs.
5. Discussion and Conclusions
This paper empirically analyzes the correlation effect and determinants of the application of
LCTs using a multivariate probit model based on survey data collected in the middle and lower
reaches of the Yangtze River in China. Our empirical results show that the overall application of
LCTs is not very high, which was expected. The application rate of straw returning technology is the
highest, reaching 72.75%, while the application rates of farm manure application, commercial organic
fertilizer use, and green manure plantation are all less than 15%. More efforts are needed by the
technology promotion system to realize food security and environmental sustainability. The estimated
results indicate that there are significant complementary relationships among farm manure application,
commercial organic fertilizer use, and green manure plantation, as well as between formula fertilization
and straw returning technology. Regarding the determinant of LCTs’ application, highly educated
farmers and farmers with a large farm size and high incomes are more likely to apply LCTs. The land
management scale appears to have an inverted U-shaped relationship to formula fertilization, with an
inflection point at 153 mu (10.20 ha), while showing an U-shaped relationship with commodity organic
fertilizer use and green manure plantation, with the turning points at 207 mu (13.80 ha) and 124 mu
(8.27 ha), respectively. The results also show that extension services from agricultural technicians,
the agricultural technical information that is available, and policy knowledge variables have positive
effects on LCTs application, while the subsidy policy does not appear to have the expected effect.
The following policy implications can be derived from this study. Firstly, to increase the application
of LCTs, more extension services and technical information should be offered by local public extension
agencies. However, the Chinese extension system has low efficiency due to inadequate capital
investment and technicians. As noted by Li et al. [68], there were only 11 technicians to supply
extension services for 20,000 farmers in one county in China. We suggest increasing the investment
in extension infrastructure as well as building the capacity of the extension technicians on new
and environment-friendly technologies, including dissemination strategies, in order to increase the
application of LCTs. Another important implication for policymakers is to encourage bottom–up
participation. Secondly, it calls for propaganda for environmental sustainability and relative policies to
enhance farmers’ cognition of land conservation and their policy knowledge. Moreover, we should
broaden and diversify the channels for delivering technology information and environmental policy
to large-scale grain producers, and let them play a demonstration role to the small-scale farmers.
For technology extension tools, training and in-field guidance, television, radio, and cell phones
are also important effective media for technology extension. Thirdly, we should make good use of
the complementarity relationship among the LCTs, and bindingly propagate the complementary
technologies during their extension. On the one hand, we can accurately select the training targets
based on the complementary relationship to improve the application rate. On the other hand,
compared with the individual technical extension, bundling promotion can improve the attraction ofSustainability 2019, 11, 441 13 of 17
LCTs to large-scale grain producers. For example, formula fertilization can increase profits by around
RMB 50 per mu (USD 110 per ha), while straw returning technology can raise profits by about RMB 30
per mu (USD 66 per ha). If the two technologies are adopted together, it can improve by RMB 4000
(USD 587) in total for a farmer with 50 mu of land area (3.33 ha). Regarding the selection of training
target farmers, education, farm size, and land scale are also strongly related to the adoption of LCTs,
as indicated earlier. This suggests that the extension should be classified in accordance with the specific
technical characteristics and farmers’ characteristics in order to improve the possibility of adopting
the LCTs. Last but not least, the existing subsidy policies have not achieved the expected effect on
promoting the adoption of LCTs, because of the diversification and confusion of the subsidy system.
Therefore, how to mobilize the relevant subsidy policies to play a joint effect and improve the extension
efficiency is still a practical problem that is worthy of further study.
Author Contributions: Conceptualization, X.L. and S.F.; Formal Analysis, X.L., S.F. and H.L.; Funding Acquisition,
X.L., S.F. and B.Z.; Data Curation, X.L. and S.F.; Methodology, X.L. and S.F.; Writing-Review & Editing, X.L. and S.F.
Funding: This research is supported by National Natural Science Foundation of China, under Grant: 71503113;
71673144; 71503174; Jiangxi Province Social Science planning Foundation, under Grant: 18GL08; National Special
Project on Science and Technology Statistics of China, under Grant: NSTS201713; 333 High Level Talents
Training Project of Jiangsu Province; Six Talents Peak High Level Talent Project of Jiangsu Province, under Grant:
2016-NY-067; PhD project launched by Jiangxi Normal University; Tender Project of Jiangxi Economic Development
Research Institute; Tender Project of Jiangxi Industrial Transformation and Upgrading Research Center.
Conflicts of Interest: The authors declare no conflict of interest.
Appendix A
See Table A1.
Table A1. Parts of agricultural subsidies to farmers in China.
Type Aim Object Standard
Farmland should not be Farmers with the Single crop RMB 105 per mu
1. Land fertility
abandoned, and soil fertility right to contract for (USD 232 per ha); double crop
protection
should be improved. management RMB 175 per mu (USD 386 per ha)
Encourage scale planting, Farmers with RMB 60 per mu (USD 132 per ha),
2. Large-scale
especially for grains (rice operated area over and upper limit at RMB 12,000
management
and wheat) 50 mu (3.33 ha) (USD1765) for each farm
Encourage using organic
3. Organic Farmers use organic
manure to increase soil RMB 200 per ton (USD29 per ton)
fertilization manure in pilot areas
fertility
Farmers use formula
4. Formula
Formula fertilizer extension fertilizer in RMB 300 per ton (USD44 per ton)
fertilization
pilot areas
Encourage planting green
5. Green manure Farmers plant green
manure to increase soil Give green manure seeds for free
plantation manure
fertility
Ban straw burning, and
6. Straw return straw to land to Farmers adopt straw Range RMB 20–50 per mu
returning increase soil fertility and returning technology (USD44~110 per ha)
prevent air pollution
Note: All the subsidies come from national finance, and the subsidy standard may slightly differ among various
regions according to land scale, numbers of farmers, and local budget.Sustainability 2019, 11, 441 14 of 17
References
1. National Bureau of Statistics of China. China Statistical Yearbook in 2017. Available online: http://www.stats.
gov.cn/tjsj/ndsj/2017/indexeh.htm (accessed on 8 October 2017).
2. Zhang, L.X.; Huang, J.K.; Fang, Q.B. Economic assess and analyze of farmers’ fertilization. In Policy for Reducing
Non- Point Pollution from Crop Production in China; Zhu, Z.L., David, N., Sun, B., Eds.; China Environmental
Science Press: Beijing, China, 2006; pp. 81–100. (In Chinese and English)
3. Mo, F.L.; Liao, B.; Lin, W. Present status and counter measures of agricultural non-point source pollution.
Environ. Sci. Surv. 2009, 28, 51–54. (In Chinese)
4. Jin, L.S.; Wang, J.N. Impact Analysis of Chinese Agricultural Development on Environment. Environmental Policy
(Vol.1); China Environmental Science Press: Beijing, China, 2004; pp. 74–105. (In Chinese)
5. Guo, J.H.; Liu, X.J.; Zhang, Y. Significant acidification in major Chinese croplands. Nature 2010, 327, 1008–1010.
[CrossRef] [PubMed]
6. Cai, R. Agri-chemicals inputs and its impact on environment. China Pop. Res. Environ. 2010, 20, 107–110.
(In Chinese)
7. Gao, Y.X.; Gao, X.B.; Liang, X.H. Fertilization technology and agricultural sustainable development.
Chin. Rural Econ. 1999, 10, 28–33. (In Chinese)
8. Yan, X.; Jin, J.Y.; He, P. Recent advances in technology of increasing fertilizer use efficiency. Sci. Agric. Sin.
2008, 41, 450–459. (In Chinese)
9. Huang, J.K.; Huang, Z.; Jia, X. Long-term reduction of nitrogen fertilizer use through knowledge training in
rice production in China. Agric. Syst. 2015, 135, 105–111. [CrossRef]
10. Zhang, J.J.; Fu, M.C.; Zhang, Z.Y.; Tao, J.; Fu, W. A trade-off approach of optimal land allocation between
socio-economic development and ecological stability. Ecol. Model. 2014, 272, 175–187. [CrossRef]
11. Deng, X.Z.; Gibson, J.; Wang, P. Management of trade-offs between cultivated land conversions and land
productivity in Shandong Province. J. Clean. Prod. 2017, 142, 767–774. [CrossRef]
12. Liu, X.W.; Zhao, C.L.; Song, W. Review of the evolution of cultivated land protection policies in the period
following China’s reform and liberalization. Land Use Policy 2017, 67, 660–669. [CrossRef]
13. Jones, S. A Framework for understanding on-farm environmental degradation and constraints to the adoption
of soil conservation measures: Case studies from highland Tanzania and Thailand. World Dev. 2002, 30,
1607–1620. [CrossRef]
14. Awoyinka, Y.; Awoyemi, T.; Adesope, A. Determinants of farmers’ perception of land degradation and
adoption of soil conservation technologies among rice farmers in Osun-State, Nigeria. J. Environ. Ext. 2006,
5, 45–50. [CrossRef]
15. Hou, D.; Liu, K. Farmers’ Perception and Adaptation Behavior Concerning Land Degradation: A Theoretical
Framework and a Case Study in Northwest China. In Proceedings of the EGU General Assembly Conference,
Vienna, Austria, 23–28 April 2017.
16. Mbaga-Semgalawe, Z.; Folmer, H. Household adoption behaviour of improved soil conservation: The case
of the North Pare and West Usambara Mountains of Tanzania. Land Use Policy 2000, 17, 321–336. [CrossRef]
17. Nunez, J.; Mccann, L. Crop Farmers’ Willingness to Use Manure. In Proceedings of the American Agricultural
Economics Association Annual Meeting, Denver, CO, USA, 1–4 August 2004.
18. Wiredu, A.N.; Martey, E.; Fosu, M. Describing adoption of integrated soil fertility management practices in
northern Ghana. Presented at the Conference on International Research on Food Security, Natural Resource
Management and Rural Development, Prague, Czech Republic, 17–19 September 2014.
19. Akinola, A.A.; Alene, A.D. Determinants of adoption and intensity of use of balance nutrient management
systems technologies in the northern Guinea savannah of Nigeria. Q. J. Int. Agric. 2010, 49, 25–45.
20. Asfaw, S. Agricultural technology adoption, seed access constraints and commercialization in Ethiopia.
J. Dev. Agric. Econ. 2011, 9, 436–447.
21. Kassie, M. Understanding the adoption of a portfolio of sustainable intensification practices in eastern and
southern Africa. Land Use Policy 2015, 42, 400–441. [CrossRef]
22. Mponela, P.; Tamene, L.; Ndengu, G. Determinants of integrated soil fertility management technologies
adoption by smallholder farmers in the Chinyanja Triangle of Southern Africa. Land Use Policy 2016, 59,
38–48. [CrossRef]You can also read