Golf Course Environmental Profile
←
→
Page content transcription
If your browser does not render page correctly, please read the page content below
Golf Course
        Environmental Profile
                                                          Volume III
             Nutrient Use and Management on U.S. Golf Courses

With Forewords by Greg Norman, World Golf Hall of Fame Member, and
          Mark D. Kuhns, CGCS, 2009 GCSAA President

    The Environmental Institute for Golf is the philanthropic organization of the Golf Course Superintendents Association of America.
Golf Course Superintendents Association of America

    Golf Course Environmental Profile
       Nutrient Use and Management
           on U.S. Golf Courses
                     Volume III

                  Funded by:
       The Environmental Institute for Golf
                      and
            The Toro Giving Program

         Copyright ©2009 GCSAA. All Rights Reserved.
Table of Contents
Mission Statements..................................................................... 4
Acknowledgments....................................................................... 5
Forewords................................................................................ 6-7
     E Greg Norman, World Golf Hall of Fame Member........... 6

     E Mark D. Kuhns, CGCS, 2009 GCSAA President............ 7

Executive Summary................................................................ 8-10
Introduction............................................................................. 11
Methodology....................................................................... 12-13
Objectives................................................................................. 14
Survey Results...................................................................... 15-29
     E Nutrient Use................................................................. 15

     E Trends in Nutrient Use................................................. 20

     E Nitrogen Use by Time of Year....................................... 21

     E Nitrogen Fertilizer Sources............................................ 22

     E Soil Amendments.......................................................... 23

     E Turfgrass Supplements.................................................. 24

     E Nutrient Management Plans......................................... 25

     E Fertilizer Restrictions.................................................... 26

     E Nutrient Application Decisions..................................... 27

     E Soil Testing................................................................... 28

     E Fertilizer Storage........................................................... 29

     E Fertilizer Equipment Calibration................................... 29

Recommendations.................................................................... 30
Conclusions......................................................................... 31-32
Literature Cited........................................................................ 33
Appendix............................................................................. 34-42
Our Mission

GCSAA is dedicated to serving its members, advancing their profession and
   enhancing the enjoyment, growth and vitality of the game of golf.

  The Environmental Institute for Golf is committed to strengthening the
     compatibility of the game of golf with our natural environment.

                                                                            4
Acknowledgments
      The Golf Course Superintendents Association of America and
         The Environmental Institute for Golf wishes to thank:

The Toro Giving Program for providing a grant to help fund this research.

The thousands of golf course superintendents who took the time and effort
                         to complete the survey.

       Golf ’s allied associations for their support in this endeavor.

                                                                            5
Foreword
In today’s world of golf, the safe and efficient application of nutrients is not an option, it is
essential. Essential to the health of the ecosystems in which the game is played; essential to
delivering a playing experience using sustainable practices that provide economic value to a
community; and essential to ensuring the protection of the quality of our water supply.

The “Nutrient Use and Management on U.S. Golf Courses” report, the third in the series
from the Golf Course Environmental Profile, demonstrates the practical and careful use of
nutrients by professional superintendents in every day applications. Perhaps most impor-
tantly, the report sets a benchmark for improving performance in the future. The research,
education, resources and outreach programs funded by The Environmental Institute for Golf and the Golf
Course Superintendents Association of America are all critical components of water quality and compliance with
the laws intended to protect water sources from nutrient runoff.

Along with water conservation, water quality is of utmost importance for the golf course industry. As we learned
from the last survey, superintendents are responsible users of water. The same can now be said about the use of
nutrients. Consider these facts:

• Superintendents apply nutrients within the ranges recommended by university scientists.
• Superintendents calibrate fertilization equipment frequently to ensure nutrients are applied effectively,
  efficiently and appropriately.
• Superintendents consider many variables when making nutrient use decisions. Integrating multiple factors helps
  ensure quality turfgrass and environmental protection.

While we know that golf can continue to improve and perform better, the data provided by the Golf Course
Environmental Profile provides us a position of strength. Based on the data, we have the power to develop new
tools, research and education to ensure the protection of the environment, improve golf’s economics and provide
a safe place for young and old alike to enjoy the game, and teach its many values and life lessons. You can be as-
sured that the golf course industry is assessing and measuring its practices for the essential health and sustainable
growth of the game for today and tomorrow.

Regards,

Greg Norman
Advisory Council Chair
The Environmental Institute for Golf

                                                                                                                        6
Foreword
When the concept of measuring and documenting the profile of golf courses first arose,
Golf Course Superintendents Association of America (GCSAA) and The Environmental
Institute for Golf (EIFG) leadership and staff knew the task would be arduous. There had
never been a national, comprehensive survey of golf courses that would establish baseline
information for the golf industry. We were entering uncharted waters and did not fully
know what to expect.

We quickly learned from the first survey that provided insight on land use and environ-
mental stewardship activities on golf courses that the industry had quite an appetite for the
information, and that GCSAA golf course superintendents were responding impressively to our request for data.
Furthermore, we found that the information had great value in communicating with a variety of constituents
including lawmakers, media, environmental community, citizen groups, etc. The availability of hard data went a
long way in focusing discussions and enhancing communications.

This report is the third in a series of five that will establish a baseline for the management of golf courses in the
U.S. The aforementioned property profile and environmental stewardship report was followed by a water use
and conservation report released in January 2009. This report, “Nutrient Use and Management on U.S. Golf
Courses,” examines how facilities manage fertilization programs. The next two reports — one on pesticide use
and the other on energy use and environmental practices — will be released in 2010. To measure change, the
five surveys will be repeated in the future.

These reports build upon each other, and with each set of data the picture becomes clearer. We have found that
golf facilities, supported by the efforts of GCSAA members, are incorporating environmental stewardship prac-
tices. Leveraging the data, we have been able to go out with that message and clarify some of the environmental
criticisms that have plagued the industry for years. We are encouraged that the last two reports will provide ad-
ditional opportunities to further strengthen golf courses as community assets, delivering tangible social, environ-
mental and economic benefits. Certainly such an undertaking requires significant resources, and we thank The
Environmental Institute for Golf and The Toro Giving Program for making this project possible.

While we are encouraged by the information, we acknowledge the fact that improvements or changes in behav-
ior will be necessary. It might sound trite to say “we don’t know what we don’t know,” but with this information
decisions can be made with greater confidence. I not only look forward to the final two reports of this first phase,
but to the day when we repeat the surveys to measure change and, hopefully, our progress.

Lastly, I want to thank the more than 2,500 superintendents who completed this survey. These requests are
quite detailed and require significant time in compiling the data. The high return rate reflects positively on our
members as they seek to communicate and enhance their stewardship efforts. Through their dedication, the golf
industry and the environment will benefit.

Sincerely,

Mark D. Kuhns, CGCS
2009 GCSAA President
                                                                                                                        7
Executive Summary
For the first time the golf course management          The objectives of the nutrient use and manage-
industry has accurate data on nutrient use             ment survey were to determine:
on golf courses in the U.S. The Golf Course            E the amount of nutrients applied to golf courses
Environmental Profile developed by GCSAA and           E the sources of the nutrients applied
the EIFG provides data that give new insight           E how superintendents make decisions about
into property features, management practices             nutrient applications
and inputs associated with golf courses across the     E whether superintendents use written nutrient
U.S. The first two reports are on golf facility land     management plans or operate under govern-
use and environmental stewardship and water              mental restrictions
use and conservation and can be found at www.          E how fertilizers are stored and how often fertil-
eifg.org. The third volume, “Nutrient Use and            izer application equipment was calibrated
Management on U.S. Golf Courses,” provides a
baseline for comparison with results from future       Methodology
surveys to document changes in nutrient use and        Superintendents at all golf facilities in the U.S.
management practices over time. This informa-          (16,386) were invited to participate in this survey.
tion can help guide the agronomic and environ-         A total of 2,561 completed surveys were returned,
mental initiatives of the golf course management       yielding a 15.6% return rate. Analysis of the
industry.                                              returned surveys indicated a representative sample
                                                       of golf facilities was received with the exception of
                                                       facility type. Responses from private facilities ac-
                                                       counted for 40% of the returned surveys but made
                                                       up 29% of golf facilities. Therefore, proportions
                                                       of the collected sample were weighted to resemble
                                                       known golf course demographics. The data were
                                                       analyzed and compared across facility types, main-
                                                       tenance budgets and agronomic regions.

                                                       Results and Recommendations
                                                       Nutrient Use
                                                       Summed over all golf course components and all
                                                       golf courses, in 2006 a total of 101,096 tons of
                                                       nitrogen were applied to 1,311,000 acres (154
                                                       pounds of nitrogen per acre); 36,810 tons of
                                                       phosphate were applied to 1,131,000 acres (65
                                                       pounds of phosphate per acre); and 99,005 tons
                                                       of potash were applied to 1,260,000 acres (157
                                                       pounds of potash per acre). These application
                                                       rates are within the guidelines recommended by
                                                       university scientists.

                                                                                                               8
To offer context, it is helpful to compare the rate       tions. Restrictions were most likely in the North
of fertilizer applied to turfgrass on golf courses        Central (16%) and Pacific (10%) agronomic
with agricultural crops like corn and tomatoes.           regions.
Corn is a widely grown agronomic crop and
tomatoes are a high-value, intensely maintained           Recommendation for Nutrient
vegetable crop. Turfgrass on golf courses is fertil-      Management Plans.
ized at a slightly higher rate than corn and at a         GCSAA recommends that all golf facilities use
slightly lower rate than tomatoes.                        guidelines developed by university scientists to
                                                          develop written nutrient management plans based
Nitrogen Fertilizer Sources                               on the characteristics and expectations unique to
For 18-hole golf facilities nationally, slow-release      each facility.
nitrogen sources accounted for 64% of the nitro-
gen applied, and quick-release nitrogen sources           Nutrient Application Decisions
accounted for 36%. Organic nutrient sources               Superintendents consider multiple factors when
were applied to 66% of 18-hole golf facilities in         making nutrient application decisions. Integrating
2006. Organic sources of nutrients comprise 24%           many variables into their decisions leads to effec-
of the total annual amount of nutrients applied           tive applications for the turfgrass while protect-
on 18-hole golf facilities.                               ing the environment. The most common factors
                                                          superintendents used to make decisions about
Soil Amendments and Turfgrass Supplements                 nutrient applications and the percentage of
In 2006, 43% of 18-hole facilities did not use            18-hole golf facilities using that factor were: visual
soil amendments. The highest use of soil amend-           observations of turfgrass (85%), previous product
ments was in the Southwest, where it is common            performance (84%), soils/soil analysis (84%) pre-
for soil and irrigation water to have a high sodi-        cipitation/temperature/weather (83%), turfgrass
um content. A much larger percentage of respon-           species (81%) and disease pressure (79%).
dents, 74%, use a turfgrass supplement such as
biostimulants, humates and amino acids/proteins.          Recommendation for Nutrient
                                                          Application Decisions.
Nutrient Management Plans and                             In order to foster sustainability at the golf
Fertilizer Restrictions                                   facility, superintendents should consider the
Of 18-hole golf facilities, 49% had a written             location, climate and condition of the turfgrass as
nutrient management plan or written fertilizer            well as the rate, time of year and products to be
program in 2006, but only 6% of facilities were           used when making nutrient management
required by government or tribal authorities to           decisions.
have such a plan. A higher maintenance budget
correlates with the likelihood that a golf facility       Soil Testing
would use a written nutrient plan or fertilizer           From 2002 to 2006, 95% of 18-hole golf facili-
program. Nationally, only 9% of 18-hole golf              ties performed soil testing on greens, 75% on
facilities reported restrictions on fertilizer applica-   tees, 80% on fairways and 26% on rough.

                                                                                                                   9
Recommendation for Soil Testing.                      Recommendation for Fertilizer Storage.
GCSAA recommends that superintendents rou-            GCSAA recommends that golf facilities that store
tinely conduct soil tests on the rough, because it    fertilizer should use a dedicated fertilizer storage
receives the greatest total amount of phosphate       area designed for that purpose.
and potash. Soil testing has the potential to cur-
tail costs and promote fertilizer programs that       Conclusions
meet, but do not exceed, the nutritional needs of     The Golf Course Environmental Profile surveys
the turfgrass.                                        have established the percentage of facilities that
                                                      are carrying out particular management practices,
Fertilizer Storage and Equipment Calibration          making it possible for GCSAA and the EIFG to
On average, superintendents at 18-hole golf           communicate results and make recommendations
facilities calibrated their fertilizer application    for improving golf course management practices
equipment before 67% of applications, thereby         throughout the country. Additional recommenda-
improving the accuracy of their fertilizer            tions will be made as the results of the remaining
applications.                                         surveys are published.

Nationally, 91% of 18-hole golf facilities stored
fertilizer on site for three consecutive calendar
days or more in 2006. Half of those golf facilities
used a dedicated storage facility.

                                                                                                             10
Introduction
“Nutrient Use and Management on U.S. Golf Courses” is the third of five reports that make up the
Golf Course Environmental Profile. This report includes data about many facets of nutrient use on
golf courses — from the amounts of nutrients applied to fertilizer storage data and equipment calibra-
tion. These data complement the two previous reports that provide information on property features,
land-use acreage, turfgrass species, water use and water conservation practices. Future reports will
provide data on pesticide use, integrated pest management, stewardship practices and energy use.
Since 2004, golf course superintendents, golf be repeated to measure changes on golf courses
industry leaders, golf association leaders, environ- and in golf course maintenance practices over
mental advocates, university turfgrass scientists time. The first survey was conducted in 2006 and
and environmental regulators have participated in its manuscript, “Golf Course Profile Describes
meetings, symposiums and conferences hosted by Turfgrass, Landscape and Environmental Steward-
The Environmental Institute for Golf to discuss ship Features,” was published in November 2007
environmental issues facing the golf industry and in Applied Turfgrass Science, a peer-reviewed scien-
to identify future research, education and out- tific journal (4). Its companion report, “Property
reach opportunities. The group reached several Profile and Environmental Stewardship of Golf
important conclusions about the environmental Courses,” was also produced in November 2007.
aspects of golf including: The second survey of the series was conducted in
late 2006 and its manuscript, “Golf Course
E Thegolf industry did not have comprehensive Environmental Profile Measures Water Use,
national data on the property features, manage- Source, Cost, Quality and Management and
ment practices and inputs associated with golf Conservation Strategies,” was published in
courses and golf course maintenance. Applied Turfgrass Science in 2008 (10). Its compan-
E Although many individual golf courses are ion report, “Water Use and Conservation Prac-
environmentally proactive, no systematic pro- tices on U.S. Golf Courses,” was also produced
cess was in place to document current practices in 2008. In 2007, the third survey of the series
or track changes that the golf industry nation- was completed and its manuscript, “Golf Course
wide has made to protect and enhance the Environmental Profile Measures Nutrient Use and
environment. Management and Fertilizer Restrictions, Storage
and Equipment Calibration,” was published in
Applied Turfgrass Science in 2009 (11). Its
In 2006, the Golf Course Superintendents Asso- companion report, “Nutrient Use and Manage-
ciation of America (GCSAA) initiated a project, ment on U.S. Golf Courses was also published
funded by The Environmental Institute for Golf in 2009. All of the published Golf Course En-
through a grant from The Toro Giving Program, vironmental Profile reports and journal articles
to collect data nationally on the property features, are available on The Environmental Institute for
management practices, and inputs associated with Golf ’s Web site, www.eifg.org. For more informa-
golf courses and golf course maintenance. To tion on the Golf Course Environmental Profile,
collect the data, a series of five surveys was con- please contact The Environmental Institute for
ducted from 2006 through 2009. The surveys will Golf at 800-472-7878.
11Summary of Methodology
Input on the survey questions was collected from golf, environmental, academic and regulatory sources.
GCSAA staff drafted survey questions, which were reviewed and revised by a group of golf course su-
perintendents, golf association leaders and environmental advocates.
The National Golf Foundation (NGF) was con- superintendents at golf facilities in the U.S. to
tracted to conduct the survey, manage the recruit- complete the nutrient use survey. Surveys were
ment of participants and complete the analysis sent beginning March 19, 2007 by e-mail or mail
of data in collaboration with GCSAA. The NGF and accepted until May 9, 2007. Several remind-
adheres to The Code of Marketing Research Stan- ers to complete and submit the survey were sent
dards developed by the Marketing Research As- by e-mail and mail.
sociation (5). The NGF refined and formatted the
survey instrument for online and paper versions.
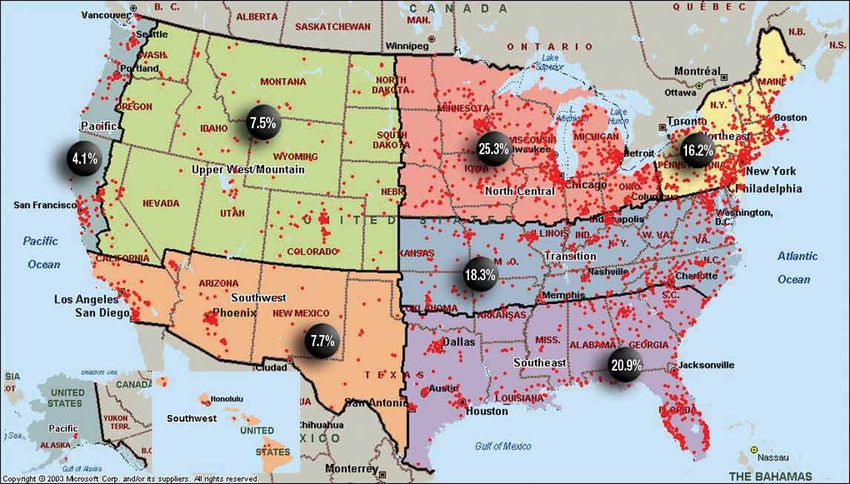
Figure 1. Percentage of the total number of
The same survey procedures were used for this completed surveys by agronomic region. Small
survey as were used in the previous two surveys red dots indicate locations of golf facilities
(4,10). An attempt was made to recruit 16,386 responding to the survey.
12Of the 16,386 superintendents contacted, 2,561 of the golf course.” In the mathematical sense,
completed and returned surveys, yielding a 15.6 “significant” means that differences are important,
percent return rate. The analysis classified the golf distinct and too great to be caused by chance.
courses by agronomic region, course type (daily
fee, municipal or private) and number of holes.
Agronomic regions were determined by group- The nutrient use data have been analyzed and
ing geographic areas with similar climatic and compared across facility types, maintenance bud-
agronomic characteristics, and boundaries were gets and agronomic regions. The facility type was
drawn using county borders (3,9). Analysis of the characterized as private or public. Private facilities
returned surveys indicated a representative sample require a membership, and public facilities allow
of golf facilities was received with the exception anyone to play for a fee. Golf facilities were divided
of facility type. Responses from private facilities into three annual maintenance budget categories:
accounted for 40 percent of the returned surveys more than $1 million, $500,000 to $1 million and
but made up 29 percent of golf facilities. There- less than $500,000. The final major comparison
fore, proportions of the collected sample were was by agronomic region. The continental U.S. was
weighted to resemble the known golf course de- divided into seven agronomic regions: Northeast,
mographics. Weighted data are presented in this North Central, Transition, Southeast, Southwest,
report (Figure 1, Table A1). Upper West/Mountain and Pacific. The regional
analysis identifies variation in nutrient use and
management across the U.S.
Data were analyzed to run descriptive statistics
and explore relationships among the variables
such as agronomic region, course type and num- Where 18-hole equivalent data are presented, data
ber of holes. The words “significant” and “signifi- within a region were averaged over facility type and
cantly” are used frequently in the report to de- budget. The number of 18-hole equivalents in the
scribe statistical differences. For example, “Private U.S. is 14,969, and was determined by taking the
golf facilities were significantly more likely than total number of golf holes and dividing by 18 (7).
public facilities to test the soil on all components
13Survey Objectives
The objectives of the third survey, “Nutrient Use and Management of U.S. Golf Courses,” were to
determine the amount of nutrients applied to golf courses, how superintendents make decisions about
nutrient applications, and whether they use written nutrient management plans or operate under gov-
ernmental restrictions. The survey also inquired about the sources of the nutrients applied, how fertil-
izers are stored and how often fertilizer application equipment was calibrated.
For the purposes of this survey, nutrients are any The nitrogen content of fertilizer is expressed
substances used or required by an organism for food as nitrogen (N), the phosphorus content is ex-
and can be categorized as micronutrients or macro- pressed as phosphate (P2O5), and the potassium
nutrients. Plants, including turfgrasses, require at content is expressed as potash (K2O). Fertilizer
least 18 elements for proper growth. Each element recommendations, fertilizer rates and the annual
has a unique function and is required in different amount of fertilizer applied are usually expressed
amounts by the various turfgrass species. A deficien- as nitrogen, phosphate (rather than phosphorus),
cy of any one element can limit plant growth, but and potash (rather than potassium). The terms
most elements are supplied to turfgrasses by natural phosphate and potash will be used in this report
soil processes (From Rosen and Horgan) (8). when referring to fertilizers containing phospho-
rus and potassium applied by survey respondents.
Superintendents were asked to indicate the rate of
Three elements — nitrogen, phosphorus and po- application of nitrogen, phosphate and potash to
tassium — are considered primary macro-nutrients greens, tees, fairways, rough, practice areas, turf-
because they are often required in larger quanti- grass nurseries, grounds and no-mow/native areas.
ties than are readily available through natural soil Superintendents generally express nutrient appli-
processes. Deficiencies of the other nutrients are cation rates in pounds per 1,000 square feet, and
relatively rare and are generally associated with it is expressed in this manner in the report. Total
unusual soil conditions such as acid, alkaline or ex- use of nutrients is expressed in pounds per acre
tremely sandy soil (From Rosen and Horgan) (8). (1 acre = 43,560 square feet).
14Survey Results
Nutrient Use E Private 18-hole golf facilities applied higher
Nutrient Use Application Rate by rates of nutrients than public 18-hole golf
Facility Characteristics facilities.
The annual rate of nitrogen, phosphate and E Eighteen-hole golf facilities with maintenance
potash applied to each golf course component budgets greater than $1 million and from
(greens, tees, fairways and roughs) varies depend- $500,000 to $999,999 applied higher rates of
ing on the total number of holes, facility type nutrients than facilities with maintenance bud-
(public or private) and annual maintenance gets below $500,000.
budget (Table A2).
E The nutrient application rate was highest on Figure 2. The average annual rate of
golf facilities with 27 or more holes. Eighteen- nitrogen (N), phosphate (P2O5) and
hole golf facilities applied higher rates of nutri- potash (K2O), in pounds per 1,000 square feet,
ents than 9-hole golf facilities. applied in 2006 to an average 18-hole golf
course in the U.S.
Greens
N - 5.2
P2O5 - 2.0
K2O - 6.7
Rough
N - 3.1 Practice areas
P2O5 - 1.4 N - 4.1
K2O - 3.1 P2O5 - 1.7
K2O - 4.1
Turf nursery
N - 4.6
P2O5 - 1.9
K2O - 6.2
No-mow/natural areas
Tees N - 1.7
N - 4.6 P2O5 - 1.0
P2O5 - 1.8 K2O - 1.8
K2O - 4.7 Fairways Grounds
N - 3.8 N - 3.2
P2O5 - 1.5 P2O5 - 1.4
K2O - 3.8 K2O - 3.1
15Nutrient Application Rate by Nutrient Application Rate by
Golf Course Component Agronomic Region
Greens, tees and fairways require the highest The specific rate of each nutrient applied to all
turfgrass quality for the game of golf and are the golf course components within each agronomic
highest priority for play. Generally, these areas region is described in Table A2. To simplify the
receive the nutrients needed to produce high- comparison of nutrient use across regions, the
quality playing surfaces. average rate of nitrogen, phosphate and potash
used for the entire golf course was calculated. The
E The annual rate of nitrogen, phosphate and rate comparison, total amount applied and total
potash applied to greens, tees, fairways, practice acres fertilized are discussed separately for each
areas and turfgrass nurseries is higher than the nutrient. In general, the nutrient rate applied
rate applied to rough, no-mow/natural areas varies significantly among regions because of the
and grounds on 18-hole golf facilities (Figure 2, differences in length of growing season, turfgrass
Table A2). species grown, and winter overseeding practices.
E The nutrient rate applied to turfgrass nurseries
reflects the rate needed to produce high-quality
turfgrass to replace damaged turfgrass on a
green, tee or fairway.
163.2*
6,355†
91.7‡ 2.4*
3.2* Washington
16,015† 2.5*
3,406† 301.7‡ 9,858†
49.2‡ Montana North
Dakota
Maine
178.7‡
Vermont
Oregon Minnesota
Pacific Idaho South
New
Hampshire
Wisconsin Massachusetts
Dakota
New York
Upper West/Mountain Wyoming Michigan
Northeast Connecticut
North Central Rhode Island
Nevada Iowa Pennsylvania
Nebraska New Jersey
Indiana Ohio
Illinois Delaware
Maryland
Utah
California Colorado West
Kansas Virginia Virginia
Missouri
Kentucky 2.9*
Transition
Arizona Tennessee
North Carolina
15,576†
Southwest
243.3‡
Oklahoma
Arkansas South
New Mexico Carolina
Georgia
Mississippi Alabama
5.4* Southeast
15,728† Texas
Louisiana
132.9‡ Florida
5.0*
34,157†
313.4‡
Figure 3. Nitrogen applications to U.S. golf courses by agronomic region.
*Average amount of nitrogen applied per 1,000 square feet.
†Total nitrogen applied in tons per year.
‡Total area (in thousands of acres) that receives nitrogen.
Nitrogen E The annual rate of nitrogen applied is highest in
Adequate nitrogen produces vigorous growth and the Southeast, Southwest, Transition and
green color in turfgrass plants. Too little or too much Pacific regions, in part, because those regions
nitrogen can cause problems. Too little available have longer growing seasons (Figure 3).
nitrogen leads to slow growth, increased chance of E Bermudagrass is a widely used species in the
some diseases, yellowing of plants and a thin turfgrass Southeast and Southwest regions and requires a
stand, resulting in increased weed pressure. Too much higher annual nitrogen rate than other turfgrass
nitrogen leads to excessive leaf growth, reduced root species grown on golf courses (2,4,6).
growth, low carbohydrate reserves, poor tolerance of E The practice of winter overseeding contributes
environmental stresses and increased susceptibility to to the high annual nitrogen application rates in
some diseases (From Rosen and Horgan) (8). the Southeast and Southwest agronomic regions
(Table A2). The winter overseeded grass requires
E Nitrogen is the primary nutrient applied by golf fertilization throughout the fall, winter and
course superintendents to manage the growth mid-spring.
and performance of turfgrass. In general, E The estimated total amount of nitrogen applied
fertilizer programs are designed around the to all golf courses in 2006 was 101,096 tons.
application of nitrogen. The total number of acres fertilized with nitro-
E Nationally, the average rate of nitrogen applied gen was 1,311,000 (Figure 3, Table A3).
is 3.5 pounds per 1,000 square feet.
171.4*
2,358†
78.0‡ 0.9*
1.3* Washington
4,625† 1.1*
1,324† 239.1‡ 3,669†
47.7‡ Montana North
Dakota
Maine
158.1‡
Vermont
Oregon Minnesota
Pacific Idaho South
New
Hampshire
Wisconsin Massachusetts
Dakota
New York
Upper West/Mountain Wyoming Michigan
Northeast Connecticut
North Central Rhode Island
Nevada Iowa Pennsylvania
Nebraska New Jersey
Indiana Ohio
Illinois Delaware
Maryland
Utah
California Colorado West
Kansas Virginia Virginia
Missouri
Kentucky 1.4*
Transition
Arizona Tennessee
North Carolina
7,009†
Southwest
222.0‡
Oklahoma
Arkansas South
New Mexico Carolina
Georgia
Mississippi Alabama
2.6* Southeast
6,351† Texas
Louisiana
111.0‡ Florida
1.9*
11,475†
275.3‡
Figure 4. Phosphate applications to U.S. golf courses by agronomic region.
*Average amount of phosphate applied per 1,000 square feet.
†Total phosphate applied in tons per year.
‡Total area (in thousands of acres) that receives phosphate.
Phosphate determine whether the turfgrass requires additional
Phosphorus is important in stimulating root phosphorus (From Rosen and Horgan) (8).
growth and promoting plant development dur-
ing establishment of turfgrass from seed, sod or The phosphorus content of fertilizers is expressed
stolons, but established turfgrass generally shows as phosphate (P2O5). Annual phosphate applica-
little response to phosphorus fertilization unless tion rates follow trends similar to nitrogen ap-
unique soil conditions exist that do not provide plication rates across agronomic regions (Figure 4,
adequate phosphorus for the plants. Soils natu- Table A2).
rally high in phosphorus are apt to provide suffi-
cient phosphorus for vigorous turfgrass growth for E The average rate of phosphate applied nationally
many years without adding fertilizers containing is 1.5 pounds per 1,000 square feet.
phosphorus (From Rosen and Horgan) (8). E The estimated total amount of phosphate ap-
plied to all golf courses in 2006 was 36,810
A soil testing laboratory can determine the cur- tons, which was applied to 1,131,000 acres
rent level of phosphorus in a particular soil. This (Figure 4, Table A3).
inexpensive procedure is the best way to accurately
182.9*
5,342†
85.2‡ 2.1*
2.9* Washington
13,046† 2.3*
3,047† 284.0‡ 8,605†
47.9‡ Montana North
Dakota
Maine
172.9‡
Vermont
Oregon Minnesota
Pacific Idaho South
New
Hampshire
Wisconsin Massachusetts
Dakota
New York
Upper West/Mountain Wyoming Michigan
Northeast Connecticut
North Central Rhode Island
Nevada Iowa Pennsylvania
Nebraska New Jersey
Indiana Ohio
Illinois Delaware
Maryland
Utah
California Colorado West
Kansas Virginia Virginia
Missouri
Kentucky 2.9*
Transition
Arizona Tennessee
North Carolina
15,042†
Southwest
237.0‡
Oklahoma
Arkansas South
New Mexico Carolina
Georgia
Mississippi Alabama
5.3* Southeast
14,577† Texas
Louisiana
126.6‡ Florida
5.9*
39,347†
306.5‡
Figure 5. Potash applications to U.S. golf courses by agronomic region.
*Average amount of potash applied per 1,000 square feet.
†Total potash applied in tons per year.
‡Total area (in thousands of acres) that receives potash.
Potash important. Soil tests are essential to determine the
Potassium is important in the synthesis or creation potassium level of a soil and to develop a potassium
of some plant components and the regulation fertility program (From Rosen and Horgan) (8).
of many physiological processes including more
efficient use of nitrogen by the plant. Potassium The potassium content of fertilizers is expressed as
deficiencies in turfgrass may reduce tolerance to potash (K2O). The annual potash application rates
environmental stress (From Rosen and Horgan) (8). follow trends similar to nitrogen application rates
across agronomic regions (Figure 5, Table A2).
Potassium is held on the surfaces of soil particles
and is not likely to move in most soils, though it E The average rate of potash applied nationally is
can gradually move out of the root zone in sandy 3.6 pounds per 1,000 square feet.
soils. Where soils are high in native potassium, E The estimated total amount of potash applied to
supplemental potassium fertilization may be all golf courses in 2006 was 99,005 tons applied
unnecessary; however, where soils are low in na- to a total of 1,260,000 acres (Figure 5,
tive potassium, supplemental applications are very Table A3).
19Trends in Nutrient Use
Survey participants were asked to state whether
their nutrient use had increased, decreased, or
stayed the same from 2002 to 2006. The percent- Table 1. Percentage of average 18-hole golf
age of those reporting increases, decreases or stayed facilities for which the total annual amount
the same varied by component of the golf course, of nitrogren, phosphate and potash applied
nutrient and region of the country. Nationally, for to each component of the golf course in 2002
all components of the golf course except putting had increased, stayed the same or decreased in
greens, 50% to 70% of respondents at 18-hole golf 2006.
facilities reported that they fertilized
with the same amount of nitrogen,
Amount of nutrients applied annually
phosphate, and potassium in 2006 Golf course
component/nutrient Increased Stayed the same Decreased
as in 2002 (Tables 1, A4). A more
% of average 18-hole facilities
detailed explanation of specific Greens
increase or decrease in nutrient use Nitrogen 24 46 29
from 2002 to 2006 for 18-hole golf Phosphate 17 51 32
Potash 48 39 13
facilities is described below.
Tees
Nitrogen 30 53 17
Greens Phosphate 18 59 23
E Thirty-two percent of golf facilities Potassium 38 51 11
decreased the amount of phos- Fairways
Nitrogen 24 50 25
phate applied, while 17% in- Phosphate 15 56 29
creased the amount of phosphate Potash 33 50 17
applied to greens. Rough
Nitrogen 22 52 26
E Forty-eight percent of golf facili-
Phosphate 14 57 29
ties increased the amount of pot- Potash 24 55 21
ash applied, while 13% decreased Practice areas
the amount of potash applied to Nitrogen 31 54 15
Phosphate 19 60 21
greens. Potash 33 56 12
Turf nursery
Tees Nitrogen 24 58 18
Phosphate 18 51 21
E Thirty percent of golf facilities
Potash 33 56 10
increased the amount of nitrogen No-mow/native areas
applied, while 17% decreased the Nitrogen 8 66 26
amount of nitrogen applied to tees. Phosphate 6 66 29
E Thirty-eight percent of golf facili- Potash 9 67 25
Grounds
ties increased the amount of potash Nitrogen 19 70 11
applied, while 11% decreased the Phosphate 12 70 17
amount of potash applied to tees. Potash 21 70 10
20Fairways Grounds
E Twenty-nine percent of golf facilities decreased ETwenty-one percent of golf facilities increased
the amount of phosphate applied, while 15% the amount of potash applied, while 10%
increased the amount of phosphate applied to decreased the amount of potash applied to
fairways. grounds.
E Thirty-three percent of golf facilities increased
the amount of potash applied, while 17% de- Nitrogen Use by Time of Year
creased the amount of potash applied to fair- Survey respondents were asked to identify the
ways. time of year they apply nitrogen to golf course
turfgrass. Nationally, average 18-hole golf facilities
Rough apply a high percentage of the nitrogen — 87% of
E Twenty-nine percent of golf facilities decreased the yearly total amount — from March through
the amount of phosphate applied, while 14% October (Table A5).
increased the amount of phosphate applied to
rough. E More nitrogen is applied from May through
June and from September through October.
Practice areas
E Thirty-one percent of golf facilities increased
the amount of nitrogen applied, while 15%
decreased the amount of nitrogen applied to
practice areas.
E Thirty-three percent of golf facilities increased Turfgrass Species
the amount of potash applied, while 12% Cool-Season
decreased the amount of potash applied to prac- Kentucky bluegrass
tice areas. Annual bluegrass
Rough bluegrass
Turf nursery Creeping bentgrass
E Thirty-three percent of golf facilities increased Fine fescue
the amount of potash applied, while 10% Tall fescue
decreased the amount of potash applied to turf Perennial ryegrass
nurseries. Intermediate ryegrass
No-mow/native areas Warm-Season
E More facilities decreased than increased the an- Bermudagrass
nual amount of nitrogen, phosphate and potash Zoysiagrass
applied to no-mow/native areas. Seashore paspalum
21E These periods of application reflect the active higher rates and have a lower potential to burn or
growing seasons of both cool- and warm-season dry up the leaves of the grass plant. Slow-release
grasses when turfgrass requires nitrogen for fertilizers are particularly beneficial on sandy
optimal performance. soils (From Rosen and Horgan) (8).
E The seasonal application of nitrogen differed by
agronomic region because of the differences in Slow-Release and Quick-Release Nitrogen Use
length of the growing season. Survey respondents were asked what percentage
E In January and February, significantly more of the nitrogen used at their facilities came from
nitrogen was applied in the Southwest and in slow-release or quick-release formulations. For
the Southeast regions than in the other regions 18-hole golf facilities nationally, slow-release
because these regions have the largest acreage of nitrogen sources accounted for 64% of the nitro-
winter-overseeded turfgrass (4). gen applied, and quick-release nitrogen sources
accounted for 36% (Table A6).
Nitrogen Fertilizer Sources
Slow-Release and Quick-Release E Eighteen-hole golf facilities with maintenance
Nitrogen Fertilizers budgets of less than $500,000 applied a sig-
Quick-release or soluble forms of nitrogen are nificantly higher percentage of nitrogen from
available to turfgrass plants soon after application. slow-release sources than golf facilities with
Ammonium nitrate, ammonium sulfate and urea maintenance budgets of $500,000 to $999,999,
are quick-release forms of nitrogen commonly which applied significantly more nitrogen from
used in turfgrass fertilizers. Fertilizers containing slow-release sources than golf facilities with a
these forms of nitrogen produce a rapid response maintenance budget of more than $1 million.
in turfgrass growth and color, and they are gener- E The percentage of nitrogen applied from slow-
ally less expensive than slow-release forms of release sources is higher in the North Central
nitrogen (From Rosen and Horgan) (8). (69%) and Northeast (67%) agronomic regions
and significantly lower in the Southwest (47%)
Slow-release forms of nitrogen depend on chemi- (Table A6).
cal and physical processes that occur in soil to
gradually break down the fertilizer particles and Organic Nutrient Use
release nitrogen for use by plants. When nitrogen Golf course superintendents have many fertilizers
is properly applied, losses through leaching are to choose from to meet the nutritional needs
usually minimized. The length of time during of turfgrass. To gain a better understanding of
which one application of slow-release nitrogen fertilizers applied on golf courses, respondents
will release nitrogen varies considerably with the were asked about the use of organic and synthetic
type of fertilizer, soil temperature and moisture, nutrient sources.
and activity of soil microorganisms. When com-
pared with quick-release forms of nitrogen, the Organic fertilizers generally contain nutrients
slow-release forms last longer, can be applied at from either plant or animal products, whereas
22E Nationally, 18-hole golf facilities showed a net
increase of 35% in the amount of nutrients ap-
Organic sources of nutrients comprise 24% plied from organic nutrient sources from 2002
of the total annual amount of nutrients to 2006.
applied on 18-hole golf facilities.
Soil Amendments
The soil amendments considered in this survey
were limestone, sulfur, gypsum and calcium chlo-
synthetic fertilizers generally contain nutrients ride. The optimal soil pH (a measure of acidity
that have been synthesized or created by reacting and alkalinity) for turfgrass is 6.0 to 7.0. Turfgrass
various elements and compounds. For the purpos- will survive and can perform well outside of the
es of this survey, an organic nutrient source was optimal range, but as soil pH moves away from
defined as “materials derived from either plant or the optimum, turfgrass performance may decline.
animal products containing one or more elements
(other than carbon, hydrogen, or oxygen) which Limestone is applied to raise soil pH. Limestone
are essential for plant growth” (1). increases soil alkalinity to offset acidic conditions
and move the soil toward a more neutral and
Survey respondents were asked whether organic preferred condition. Sulfur is applied to lower
sources of nutrients were used on the golf pH. Sulfur increases soil acidity to offset alkaline
facility. If organic nutrient sources were used, the conditions so the soil reaches a more neutral pH.
respondents were asked to indicate how much of
the total annual nutrient applications
were derived from organic sources Figure 6. The percentage of 18-hole golf facilities that
(Table A6). In addition, they were used various soil amendments in 2006.
asked to identify the source of the or-
ganic product such as animal waste or
commercial sewage sludge (Table A7). Gypsum 40%
Limestone 24%
E Organic nutrient sources were ap-
plied to 66% of 18-hole golf facilities Sulfur 9%
in 2006.
E Organic sources of nutrients com-
Calcium Chloride 6%
prise 24% of the total annual
amount of nutrients applied on 18- Other 11%
hole golf facilities.
E In 2006, the most-used organic None Used in 2006 43%
nutrient sources were animal waste
0 10 20 30 40 50
(59%) and commercial sewage prod-
ucts (40%) (Table A7).
23In soil, sodium in excess of calcium and magne- Turfgrass Supplements
sium breaks down soil structure (the organization Turfgrass supplements include a broad range of
of soil particles and spacing between them). Poor products applied to improve turfgrass quality.
soil structure leads to poor water infiltration, low Turfgrass supplements may contain one or more
levels of oxygen, and poor performance and death of the following: biostimulants, humates or humic
of turfgrass plants. Sulfur, gypsum and calcium acid, amino acids or proteins, sugar, microbial or-
chloride can be applied to overcome the negative ganisms, compost, biocontrol agents and compost
effects of sodium on soil structure. teas. The benefits of many turfgrass supplements
are poorly defined or unknown. For this survey,
Survey respondents were asked to identify the soil fertilizers and soil amendments are not considered
amendments applied at their golf facility (Figure turfgrass supplements.
6, Table A8).
E In 2006, 74% of golf course superintendents
E For 18-hole golf facilities, 43% did not apply applied one or more types of turfgrass supple-
soil amendments, 40% applied gypsum, 24% ments at 18-hole golf facilities in the U.S.
limestone, 9% sulfur, 6% calcium chloride, and (Table A9).
11% applied other amendments. E The most common types of turfgrass supple-
E Soil amendment use was most common on pri- ments applied were biostimulants (50%), hu-
vate 18-hole golf facilities with a maintenance mates (49%) and amino acids/proteins (46%).
budget higher than $1 million. E Private 18-hole golf facilities with a mainte-
E Eighteen-hole golf facilities with a maintenance nance budget greater than $1 million were most
budget of $500,000 to $999,999 were more likely to use turfgrass supplements.
likely to apply soil amendments than facilities E The specific turfgrass supplement applied varied
with a maintenance budget below $500,000. by agronomic region, with golf course superin-
tendents in the North Central (40%) region the
least likely to apply turfgrass supplements.
24Nutrient Management Plans number of holes, facility type or maintenance
Survey respondents were asked whether they budget.
utilize a written nutrient management plan or E Eighteen-hole golf facilities in the Upper West/
a written fertilizer program at the golf facility. Mountain (11%), Transition (9%), Northeast
Written nutrient management plans or written (8%) and Pacific (8%) agronomic regions were
fertilizer programs were used at 49% of 18-hole most likely to be required to have a written
golf facilities in the U.S. (Table A10). The use of nutrient management plan.
these written plans or programs was more com-
mon at golf facilities with 27+ holes (60%) than Seventeen percent of 18-hole golf facilities had a
at 18-hole (49%) or 9-hole (40%) golf facilities. written nutrient management plan because they
Use of written plans or programs is nearly equal voluntarily participated with a non-regulatory
at public (50%) and private (49%) golf facilities. organization such as a watershed protection or
A higher maintenance budget correlated with the environmental conservation group (Table A10).
likelihood that a golf facility would use a written E Participation rates in voluntary programs are high-
nutrient plan or fertilizer program. er for public (18%) than private (14%) facilities.
E Participation rates were higher for facilities with
E Between 2002 and 2006, only 6% of 18-hole higher maintenance budgets.
golf facilities were required by a federal, state, E The participation rate of 18-hole golf facilities
local, or tribal authority to have a written nutri- in the Pacific (31%) region was significantly
ent management plan (Table A10). higher than the participation rates in the other
E Golf facilities that were required to have written agronomic regions.
nutrient management plans did not differ by
25Fertilizer Restrictions E phosphorus (62%) including the yearly total
Superintendents indicated whether their golf and/or amount per application
facility operated under fertilizer restrictions and E required use of buffer strips (33%)
whether those restrictions were enacted by a fed- E nitrogen (27% ) including the yearly total and/
eral, state, local or tribal authority. Nationally, only or amount per application
9% of 18-hole golf facilities reported restrictions E no-fertilizer application zones (23%)
on fertilizer applications (Table A10), and those
restrictions were most likely in the North Central Respondents reported the effects of fertilizer
(16%) and Pacific (10%) agronomic regions (Table restrictions on their nutrient application
A10). program as:
E minimal (50%)
The most common fertilizer restrictions encoun- E some (26%)
tered by 18-hole golf facilities are listed below E none (16%)
(Figure 7): E significant (8%)
Figure 7. The percentage of 18-hole golf facilities operating under various types of
fertilizer application restrictions.
Phosphorus* 62%
Required Buffer Strips 33%
Nitrogen* 27%
No-Apply Zones 23%
Regional/State Stormwater Management Plan 19%
Potassium* 9%
Date Restrictions for Applications 5%
Other Nutrients 2%
Other 10%
* Total yearly amount or amount per application
26Nutrient Application Decisions The most common factors used to make decisions
Superintendents consider many factors when about nutrient applications and the percentage of
making decisions about nutrient applications 18-hole golf facilities using that factor (Figure 8):
(Table A11). The relative importance of a specific E visual observations of turfgrass (85%)
factor differed by agronomic region reflecting the E previous product performance (84%)
vast differences in conditions among agronomic E soils/soil analysis (84%)
regions. E precipitation/temperature/weather (83%)
E turfgrass species (81%)
E disease pressure (79%)
Figure 8. The percentage of 18-hole golf facilities that use the listed factor in making
nutrient application decisions in 2006.
Visual Observance/Scouting 85%
Previous Product Performance on Established Turfgrass 84%
Soils/Soil Analysis 84%
Precipitation/Temperature/Weather 83%
Turfgrass Species 81%
Disease Problems/Pressure 79%
Traffic/Wear 72%
Length of Growing Season 70%
Golfers’ Expectations for Turfgrass Performance 68%
Golf Events Calendar 57%
Cost of Fertilizer 56%
Clipping Production 51%
Regulatory Requirements 32%
Turfgrass Growth Prediction Models 30%
Tissue Analysis 29%
Consultant/ Service Provider Recommendations 25%
University Recommendations 24%
Manufacturer Recommendations 21%
Nutrient Content of Reuse Water Source 20%
Adjacent Property Owner Maintenance Standards 11%
27Soil Testing
Superintendents were asked how often they con-
duct soil testing at the golf facility. Since 2002,
95% of 18-hole golf facilities have performed soil
testing on greens, 75% on tees, 80% on fairways
and 26% on rough (Figure 9, Table A12).
E With the exception of soil testing on greens,
facilities with more than 27 holes were sig-
nificantly more likely to soil test than 18- and
9-hole golf facilities.
E Private golf facilities were significantly more
likely than public facilities to test soil on all Soil testing by a professional laboratory will
components of the golf course. help superintendents make appropriate deci-
E Facilities with a maintenance budget of more sions about nutrient applications.
than $1 million conducted significantly Photo by Pat Gross, USGA
more soil tests than facilities with a budget
of $500,000 to $999,999. Both of the higher
budget categories soil test all golf course com-
ponents significantly more than facilities with
maintenance budgets below $500,000.
E Soil testing is performed least often in the
North Central region (Table A12).
Figure 9. The percentage of 18-hole golf facilities that conducted soil testing on
various components of the golf course since 2002.
Greens 95%
Tees 75%
Fairways 80%
Rough 26%
0 20 40 60 80 100
28maintenance budget of $500,000 to $999,999
(54%) and those with budgets below $500,000
(41%)
E Eighteen-hole golf facilities in the Southeast
(59%) and Pacific (58%) regions were more
likely to have fertilizer storage than 18-hole golf
facilities in other agronomic regions (44% to
51%)
An example of a fertilizer and pesticide storage
facility.
On average, superintendents at 18-hole golf
Fertilizer Storage facilities calibrated their fertilizer applica-
On a national basis, 91% of 18-hole golf facili- tion equipment before 67% of applications.
ties stored fertilizer on site for three consecutive
calendar days or more in 2006. Half of the golf
facilities that stored fertilizer for more than three
consecutive days had a dedicated storage area for
fertilizer that included an impervious floor, venti-
lation, containment features, locks and restricted Fertilizer Equipment Calibration
access. Respondents were asked how often they calibrated
their fertilizer application equipment before mak-
Of 18-hole golf facilities with a facility designed ing applications to greens, tees, fairways or rough.
for fertilizer storage: More frequent calibration of fertilizer application
E Private facilities (55%) outnumbered public equipment increases the accuracy of nutrient ap-
facilities (48%) plication. On average, superintendents at 18-hole
E Golf facilities with a maintenance budget above golf facilities calibrated their fertilizer application
$1 million (63%) outnumbered those with a equipment before 67% of applications.
29Recommendations
Environmental Stewardship that superintendents routinely conduct soil tests on
The results of the nutrient use survey indicate that the rough to determine phosphorus and potassium
golf course superintendents use a variety of nutrient fertilizer needs. This practice has the potential to cur-
sources. Quick-release and slow-release nitrogen tail costs and promote fertilizer programs that meet,
sources and synthetic and organic nutrient sources not exceed, the nutritional needs of the turfgrass.
are applied to most golf courses in the U.S. No
matter the nitrogen source (quick- or slow-release, Fertilizer Storage
synthetic or organic), superintendents decide the In 2006, 50% of the 18-hole golf facilities that
rate applied, the frequency of application, the time stored fertilizer for more than three consecutive days
of year applications are made and the product used used a dedicated storage area. GCSAA recommends
and are therefore responsible for producing the that all golf facilities that store fertilizer do so in an
desired affect on the turfgrass without negatively area that is specifically designed for that purpose.
affecting the environment.
Nutrient Management Plans
GCSAA recommends that superintendents evaluate Approximately 50% of golf facilities nationally use a
all sources of nutrients based on their agronomic written nutrient management plan or a written fertil-
performance, cost, potential impact on water qual- izer program. A written nutrient management plan
ity and other environmental concerns and choose or a written fertilizer program provides the means to
products that foster sustainability of the golf facility. achieve goals and should be used by all golf facili-
By itself, the source of nutrients (quick-release, slow- ties. The GCSAA recommends that all golf facilities
release, synthetic, organic) is not an indicator of the use guidelines developed by university scientists to
environmental stewardship of the golf facility. The develop written nutrient management plans based
potential for nutrients to move from the application on the characteristics and expectations unique to
site is influenced by application rate, frequency of each facility.
application, time of year, product applied, soil type,
soil moisture content, temperature, turfgrass density
and the intensity and amount of rainfall/irrigation
following application. Understanding and adjusting
to the influence of these factors is the responsibility
of a golf course superintendent.
Soil Testing
Since 2002, only 26% of 18-hole golf facilities have
conducted soil tests on the rough. On an average 18-
hole golf facility, the rough comprises 50 acres (4),
more than any other component of a golf course.
Since the greatest total amount of phosphate and
potash are applied to rough, GCSAA recommends
30You can also read