Carbon and water footprint assessment of the Mauritian sugar cane sector - revised version
←
→
Page content transcription
If your browser does not render page correctly, please read the page content below
Carbon and water footprint
                     assessment of the Mauritian
                          sugar cane sector
                                       - revised version -

Carbon and water footprint assessment of the Mauritian sugar cane sector 2020   Page 1 of 26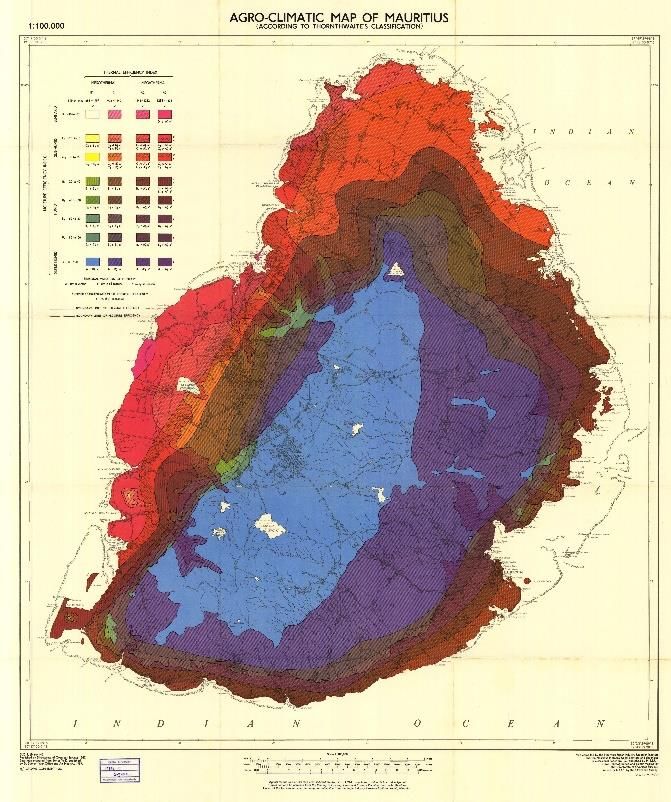
Title              Carbon and water footprint assessment of the
                                   Mauritian sugar cane sector: revised version

                                   Inka Sachse, Eric Kowalewski
                Author
                                   Analysis: Sivan van Leerzem

                                   Previous version: July 2020
                Date
                                   Revised version: February 2021

                Copyright          No part of this publication may be reproduced in any
                                   form by print, photo print, microfilm or any other
                                   means without mentioning of Soil & More Impacts.

                Disclaimer         Neither Soil & More Impacts, nor its partners, accepts
                                   any liability whatsoever for any direct or consequential
                                   loss however arising from any use of this document or
                                   its contents or otherwise arising in connection
                                   herewith.

                Contact            Soil & More Impacts B.V
                address            Buttstraße 3
                                   22767 Hamburg
                                   Germany

                                   www.soilandmore.com

                                   Courtesy to use front Picture:
                                   Mauritius Sugar Syndicate

Note about the revised version:

The previous version of this report partially contained preliminary results for the agricultural
stage of the carbon footprint of cane sugar. This led to minor discrepancies in the final results
as displayed in the previous version of this report from the results actually calculated. The
authors are indebted to the attentive reader who made us aware of this mistake, which we
corrected in this revised version.

Carbon and water footprint assessment of the Mauritian sugar cane sector 2020                 Page 2 of 26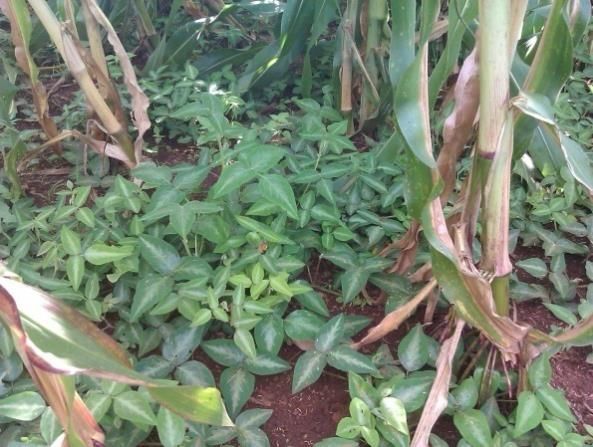
Content
1     Summary ....................................................................................................................... 4
2     General information ...................................................................................................... 6
      2.1 Introduction ...............................................................................................................6
      2.2 Sector Profile ..............................................................................................................6
      2.3 Goals of the assessment and definitions ....................................................................6
      2.4 Functional Unit ...........................................................................................................7
3     Methodology ................................................................................................................. 8
      3.1 General methodology.................................................................................................8
      3.2 System boundary and scopes .....................................................................................8
             3.2.1 System boundaries ......................................................................................... 8
             3.2.2 Scopes ............................................................................................................ 9
      3.3 Farm clustering for a representative sample ............................................................10
4     Greenhouse Gas Inventory and Results ........................................................................ 13
      4.1 Common practices of sugar cane cultivation in the 3 clusters .................................13
      4.2 Carbon Footprint of Mauritian sugar cane cultivation .............................................16
      4.3 Carbon footprint of sugar processing .......................................................................18
      4.4 Overall carbon and water footprint..........................................................................19
      4.5 Assumptions made and system limitations ..............................................................23
5     Recommendations for mitigating the footprints ........................................................... 24
6     References .................................................................................................................. 26

Carbon and water footprint assessment of the Mauritian sugar cane sector 2020                                             Page 3 of 26
1 Summary
This study assesses the product carbon and water footprint (WF) of Fairtrade sugar cane
production and cane sugar products from Mauritius for the year 2019. The scope comprises
greenhouse gas (GHG) emissions associated with the agricultural production of sugar cane,
transport to refineries, local processing, and transport to the harbor. As an additional step,
emissions caused by ocean transport to Europe were calculated. The WF was performed on an
agricultural and processing level.

                                                                                                  The cane sugar product carbon
                                                Average GHG emissions for sugar production
                                                                                                  footprint amounts to 0.36 kg
                                                 (including agricultural production of sugar
                                                                                                  CO2e per kg of both refined and
                                           0.40                     cane)
                                                                                                  special sugars delivered to Port
                                                                                                  Louis, Mauritius. Of the total
                                                            0.8%
                                                                                                  emissions, 27.0% can be
                                                  1.2%                                            attributed to sugar cane
                                           0.35                       0.2%
                                                                                                  cultivation, 6.0% to the transport
                                                            3.1%
                                                                                                  from the farms to the refineries,
                                                  0.2%
                                                                                                  55.6% to processing in the
                                                                      0.5%
                                                                                                  refineries, and 0.8% to the
                                                                                                  transport from the refineries to
                                           0.30                                                   the harbor, respectively. The
                                                                         Transport to harbour
                                                                                                  remaining 10.6% are embodied
                                                            31.0%
                                                                         Processing aids
                                                                                                  GHG emissions of plantation
                                                                                                  white sugar from 2018 and from
                                                                                                  Medine refinery.
 kg CO2e / kg refined and special sugars

                                           0.25                          Packaging
                                                                                                  In    terms     of     agricultural
                                                                         Waste material           production, soil-build up and
                                                                                                  erosion prevention constitute
                                                            6.6%                                  the greatest opportunities for
                                                                         Diesel
                                           0.20                                                   improving the overall product
                                                                         Bagasse combustion       impact while generating valuable
                                                            12.8%        (electricity + steam)    co-benefits.
                                                                         Steam
                                                              Processing      contributes      the
                                           0.15             4.2%
                                                              largest share of emissions,
                                                                         Coal-based electricity

                        6.3%
                                                              mainly due to the substantial
                                    Grid Electricity          quantity of steam consumed.
                        6.0%
                                                              However, associated with the
     0.10                           PWS  from  Medine  (incl. processing      stage      is    the
                                    transport)
                                                              generation       of      renewable
                                    PWS from 2018
                                                              electricity from sugar cane
                                                              derived       waste       products,
                                    Sugar cane transport to
                                    refineries
                                                              displacing  national grid electricity
     0.05              27.0%                                  and thus emissions of -0.53 kg
                                    Sugar cane (agricultural
                                    production)               CO2e per kg sugar. The large
                                                              positive impact of renewable
                                                              electricity    generation       thus
     0.00                                                     exceeds the negative climate
                                                              impact of the entire cane sugar
production process by 0.17 kg CO2e per kg sugar from cradle to national harbour. Beyond that,

Carbon and water footprint assessment of the Mauritian sugar cane sector 2020                                              Page 4 of 26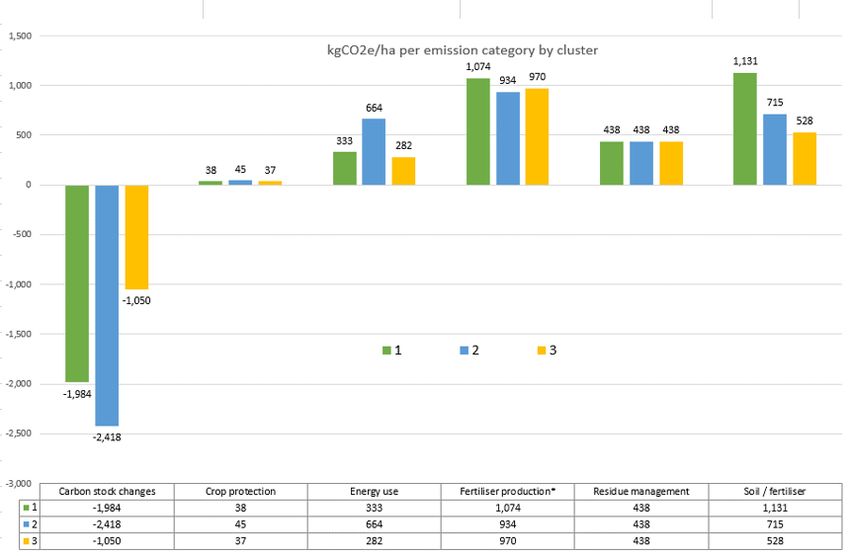
efforts are under way to advance the circular production process, which should further reduce
emissions. Ocean shipping to Europe would add another 0.24 kg CO2e per kg sugar.

On average, 6.8 liters of surface and groundwater are used in agricultural production for 1 kg
of sugar cane, with purely rain fed farms being considered as zero water usage production
systems. Due to its overall low reliance on these sources, the blue WF of Mauritian Fairtrade
sugar cane compares well globally. The water consumption average of irrigated farms is 21.4
liters/kg.
When related to processed sugar, water consumption attributable to the cultivation stage
amounts to 67.0 liters per kg sugar, or 53.3 litres per kg sugar when accounting for the
wastewater of the refineries used for irrigation of sugar cane. The average water consumption
of the two sugar refineries assessed results in a blue water footprint of the processing stage of
9.8 liters per kg processed sugar. Combined, these two stages generate a blue water footprint
of 76.8 liters per kg sugar, or 63.1 litres corrected for irrigation with wastewater.

Carbon and water footprint assessment of the Mauritian sugar cane sector 2020          Page 5 of 26
2 General information
2.1     Introduction
Fairtrade International is the international non-profit, multi-stakeholder organization behind
the FAIRTRADE Brand. Fairtrade currently works with over 1,240 producer groups across 75
countries, reaching some 1.66 million smallholder farmers and plantation workers.
As part of the Fairtrade Sourcing Ingredient program, the Fairtrade sugar cane sector in
Mauritius (amongst others) and Fairtrade certified SPOs (small producer organizations) in
Mauritius (>30) are beneficiaries of additional support in areas that increase their sustainability.
Partners in Mauritius showed an interest that a study measuring the carbon and water footprint
of the sector is carried out, that should not only measure the footprint but also propose
mitigation and adaption strategies. Thereafter, any Fairtrade & non Fairtrade income could be
strategically invested for adaption and mitigation measures.
This footprint study was carried out by Soil & More Impacts B.V. (hereafter referred to as “SMI”)
with the support of members of the Mauritius Fairtrade Cooperative Federation.

2.2     Sector Profile
Sugarcane is presently cultivated on about 50,000 hectares, representing 75% of the arable
land in Mauritius. On average, 325,000 tonnes sugar is produced annually with most being
exported to the European Union. Sugar production remains an important contributor to the
country's economy with sugar exports representing a little less than 20% of foreign exchange
earnings and 1% of the country’s Gross Domestic Product (GDP). Milling operations have been
progressively centralised, as a result of which only 3 mills remain in activity now. Mauritius
contributes to 0.2 % to the world’s total sugar production. With the abolishment of the sugar
beet production quota in the EU in 2017, market access into the EU and a drop of 20% in sugar
prices has brought revenue for all sugar suppliers, whether beet or cane producers, lower than
the costs of production1.

Still, the agricultural sector, and its sugarcane cluster in particular, is forecasted to remain a
source of wealth for the Mauritian economy, one of the country’s development pillars, and
plays a vital multifunctional role in the socio-economic fabric of Mauritius. Structural reforms
and improvement of resilience towards the impact of climate change are needed. The Fairtrade
premium helps Mauritius sugar farmers to work in a profitable way. Currently, 5,254.717 ha of
Mauritian sugar cane surface is Fairtrade certified.

2.3     Goals of the assessment and definitions
This study aims to calculate the CO2e (carbon dioxide equivalent) and Water footprint of cane
sugar from Mauritius from the agricultural and from the processing perspective. Focus is on
Fairtrade Certified farms, but some non-certified farms are also included. The study shows the
biggest emission sources and sinks and give recommendations for improvement.

The term “carbon footprint” stands for the total sum of all greenhouse gas emissions caused
by a product’s life cycle. The system boundaries of the footprint are defined in section 2.2.
The carbon footprint serves to identify the environmental performance of a specific product or
facility as to greenhouse gas emissions, thus assessing its impact on climate change.
Greenhouse gases (GHGs) absorb and emit radiation in the thermal infrared range of the
electromagnetic spectrum and thus trap heat in the Earth’s atmosphere. Their resulting global
warming potential is expressed by a coefficient specific to each GHG determined by the
Intergovernmental Panel on Climate Change (IPCC). This study includes different greenhouse
gases that are emitted during different stages of a product’s life cycle: carbon dioxide (CO 2),

Carbon and water footprint assessment of the Mauritian sugar cane sector 2020             Page 6 of 26
methane (CH4), and nitrous oxide (N2O), CFCs and HCFCs. The Global Warming Potential (GWP)
of methane and nitrous oxide is higher than the one of carbon dioxide, meaning that they are
stronger greenhouse gases. In the following footprint, all identified greenhouse gases are
converted into CO2e (Carbon dioxide equivalents) by multiplying them with the GWP value.

 Type of gas                           Chemical formula                         GWP 100
 Carbon dioxide                        CO2                                      1
 Methane                               CH4                                      25
 Nitrous oxide                         N2O                                      298
Greenhouse gasses included in this study with their GWP value.

The term “water footprint” as defined by the Water Footprint Network measures the amount
of water used to produce a goods or service. It can be measured in cubic metres per tonne of
production, per hectare of cropland, per unit of currency and in other functional units. The
water footprint helps us understand for what purposes our limited freshwater resources are
being consumed and polluted. The impact it has depends on where the water is taken from and
when. If it comes from a place where water is already scarce, the consequences can be
significant and require action. The water footprint has three components: green, blue and grey.
Together, these components provide a comprehensive picture of water use by delineating the
source of water consumed, either as rainfall/soil moisture or surface/groundwater, and the
volume of fresh water required for assimilation of pollutants.

2.3.1.1     The three water footprints:
           2.3.1.1.1        Green water footprint is the amount of rainwater required
              (evaporated or used directly) to produce a unit. It is particularly relevant for
              agricultural, horticultural and forestry products.

            2.3.1.1.2      Blue water footprint is the amount of surface water and groundwater
              required (evaporated or used directly) to produce a product. Irrigated agriculture,
              industry and domestic water use can each have a blue water footprint.

            2.3.1.1.3       Grey water footprint is the amount of fresh water required to
               assimilate pollutants to meet specific water quality standards. The grey water
               footprint considers point-source pollution discharged to a freshwater resource
               directly through a pipe or indirectly through runoff or leaching from the soil,
               impervious surfaces, or other diffuse sources. The most critical pollutant sets the
               benchmark for the rest.

Source: Components of agricultural water footprint: green, blue and grey (from SAB Miller and
WWF, 2009) from https://waterfootprint.org/en/water-footprint/what-is-water-footprint/

2.4     Functional Unit
For this carbon and water footprint assessment, the functional unit was identified to be 1 kg
final product. i.e. refined and special sugars, from cradle to harbour.
Therefore, all greenhouse gas emissions and water footprint caused by the primary production
stage, the processing stage as well as transportation stage are broken down to the quantified
unit of 1 kg final product.

Carbon and water footprint assessment of the Mauritian sugar cane sector 2020             Page 7 of 26
3 Methodology 3.1 General methodology The assessment has been done in line with the requirements of the GHG Protocol22 developed by the World Resource Institute and the World Business Council for Sustainable Development. The calculation models and tools used for this assessment have been developed by SMI or have been provided by reliable service providers such as the Sustainable Food Lab respectively the Cool Farm Institute, using the Cool Farm Tool (https://coolfarmtool.org/) to assess the farming level emissions and Defra emission factors (www.gov.uk/government/collections/government- conversion-factors-for-company-reporting) to model the processing and transport emissions. For the water footprint, the model CropWat 8.0 and ClimWat 2.0 database was used (based on FAO 56 standard)3 and the guidelines of the Global Water Footprint Network were followed4. The required primary data was collected by local Fairtrade representatives during on-site visits in November 2019. The data was uploaded to SMI’s database and evaluated using our own models based on above-mentioned tools. Additionally, two processing mills were remotely interviewed by Soil & More Impacts and the data was manually evaluated. For the transport, generic distance and vehicle data was used. 3.2 System boundary and scopes The term boundary specifies which processes are part of the assessment and are therefore accounted for in the carbon and water footprint. Once the system boundary has been defined, the greenhouse gas emissions and water footprint arising during the different stages of the product’s life cycle or a facilities resource use will be identified and assigned to three different scopes, as introduced by the WRI (World Resource Institute) and the WBCSD (World Business Council for Sustainable Development) in their GHG Protocol. 3.2.1 System boundaries The carbon footprint includes the greenhouse gas emissions that are released during different stages of the life cycle of cane sugar. The inputs and outputs are analyzed for every production stage, process or activity and the related emissions are calculated. The time boundary of the assessment is the year 2019. Carbon and water footprint assessment of the Mauritian sugar cane sector 2020 Page 8 of 26
The following stages in the life cycle of cane sugar are included:

     •    Stage 1: Farming
              o Energy consumption: diesel for tractors and other equipment
              o Soil emissions
              o Crop residue management
              o Fertilization
              o Crop protection
              o Irrigation
              o Transport to next stage

     •    Stage 2: Local processing
              o Energy consumption: electricity and diesel/petrol use
              o Packaging materials and waste
              o Water use and wastewater
              o Transport to next stage

3.2.2 Scopes
In line with the requirements of the GHG Protocol, the emissions identified within the system
boundary and the different stages are assigned to three different scopes as follows:

     ▪    Scope 1: Scope 1 emissions include the direct GHG emissions of a company or process.
          These emissions arise from sources that are owned or controlled by the process
          owners, e.g. a diesel use in the field.

     ▪    Scope 2: Scope 2 emissions include indirect GHG emissions arising from energy used in
          the production process. These are emissions from the generation of purchased
          electricity, heat or steam. Purchased electricity is defined as electricity that is
          purchased or otherwise brought into the organizational boundary of the process
          owner. Scope 2 emissions physically occur at the facility where electricity is generated.

     ▪    Scope 3: Scope 3 emissions include other indirect GHG emissions of the product. These
          emissions are a consequence of the process but occur at sources owned or controlled
          by external providers. Examples are purchased materials such as fertilizers or
          packaging, or transport emissions.

Carbon and water footprint assessment of the Mauritian sugar cane sector 2020            Page 9 of 26
3.3 Farm clustering for a representative sample
A total number of 4000 sugar cane farms was grouped into the main influential characteristic
clusters by region connected to main climatic and geologic conditions. Other factors such as
certification, farm size, productivity and grade of mechanization were rather inhomogeneous
and therefore not explicitly grouped. A total of 38 farms was assessed.
The climate patterns in Mauritius show a
clearly distinguishable pattern, whereas
the soil types differ also within the defined
centre-North-South clusters.
Three small producer organizations
(SPOS), representing the three regions,
were involved in choosing participating
farms and in the respective data
collection.
Farm size, certification and mechanization
level was included in all of the cluster's
questionnaires.
Carbon and water footprint assessment of the Mauritian sugar cane sector 2020 Page 10 of 26Clustering of farmer groups for the assessment
Cluster no. 1 2 3
High precipitation Low precipitation and flat Low precipitation and
GeoClimate and hilly terrain terrain hilly terrain
Names of
regions/SPOS Centre North South
involved Petit Paquet MCS Century CCS Surinam Souillac CCS
n° and names L Soil (Low Humic Latosols LBF- Lactosolic Brown
of prevailing Lactosolic Brown and Latosolic Reddish Forest, HL- Humic
soil types Latosol Prairie) Latosol
n° of farmers
involved 268 114 132
n° of hectares
involved 311 99 242
soil pH pH 4.5-5.6 pH 5.15-5.20 pH 4.5-5.5
% small scale
farms (70 -
75 TCH ) 25 85,5 98,65
% average
prod. Farms
70 - 75 TCH 75 10 0
% low prod.
Farms (Data sources Wherever possible, primary data was used to carry out this carbon footprint. In case such primary data wasn’t available, secondary data was used. In case the sources of this secondary data proved to be unreliable, assumptions were made. In the case of uncertainty or several different data sources, the most conservative approach was chosen. That means the value causing the highest amount of emissions was taken for the calculation. In general, it is advisable to use as much primary data as possible. Doing so, the actual emissions can be quantified in a more understandable way, and opportunities to improve efficiency can be easily identified. For this assessment, all primary activity data was collected by local Fairtrade technicians on selected representative farms Mauritius at farming level, and remote questionnaires answered by the sugar mills on processing level. Secondary data was used for the modelling of the transport as well as packaging material. The secondary data was taken from official databases e.g. DEFRA UK. Assumptions are mentioned at the end of the results chapter. Carbon and water footprint assessment of the Mauritian sugar cane sector 2020 Page 12 of 26
4 Greenhouse Gas Inventory and Results
4.1     Common practices of sugar cane cultivation in the 3 clusters
Sugar cane is grown in a 7-year-cycle, with harvest taking place from June to December every
year. Despite Mauritius having historically favoured green cane harvesting, the changing global
economic environment has resulted in some farmers (around 15%) burning sugarcane before
harvesting to remove leaves, weeds and other trash that delay harvesting and milling in order
to avoid the costs associated with manual leaf stripping. In the course of Fairtrade trainings,
however, farmers are sensitized as to the importance of green cane harvesting, which is more
beneficial for soil biology. All investigated farms work conventionally, independent of whether
or not they are Fairtrade certified.

Productivity and farm size
Productivity ranges from 40 to 100 tons/ha, whereas 70 - 75 t/ha can be considered as the
viability threshold. The average size of the assessed farms is 1.1 hectares and the average yield
is 71,2 t/ha. Farms in cluster 2 are the smallest, with an average of 0,8 hectares whereas the
yields are the largest with an average of 92,8 t/ha.

                                                 Dominating Soil                SOM   Soil     Irrigation
               Average                           soil type  drainage                  humidity
               crop      Average
 Cluster:      area/farm Yield t/ha
 1                  1,34      57,35                      clay            poor   low      moist           0
 2                  0,76      92,76                     mixed            good mixed      moist     9 of 11
 3                  1,23      69,95                        silt          good mixed       dry      3 of 11
 Grand
 Total                 1,14           71,25

Soil organic matter (SOM) in %
Generally, SOM is rather low.
- Cluster 1: majority below 1.72
- Cluster 2: some below 1.72 AND some 1.72 to 5.16
- Cluster 3: all 1.72 to 5.16
On average, cluster 3 has the highest SOM and cluster 1 lowest. Cluster 2 is evenly mixed.
This correlates with soil type, cluster 1 is mostly clay and cluster 3 is mostly silt. Again, cluster
2 has got mixed silt/clay soils.

Nearly all farms in cluster 1 indicate to have poor soil drainage, 2 & 3 all indicate good drainage.
pH is generally low (nearly 75% below 5.5).

Sugar grows well in deep, well-drained humid soils of medium fertility of sandy loam soil
textures with a pH range from 6.0 to 7.7. The optimum soil pH is about 6.5 but sugarcane can
tolerate considerable degree of soil acidity and alkalinity. Waterlogged, acidic and poorly
drained soils are not suitable, which partly explains the lower productivity in Cluster 1.

Fertilization
No organic fertilizers are used. Nearly all farms indicate to use an NPK with an N=17%,
P2O5=18%, K2O=25%. Fertilizer use is on average 599 kg / ha, but it is around 80 kg / ha higher

Carbon and water footprint assessment of the Mauritian sugar cane sector 2020                    Page 13 of 26
in cluster 2. The lower carbon footprint of fertilizer production in Cluster 2 will be further
discussed in chapter 3.1.
Tillage
According to IPPC, practice changes of the past 20 years can be taken into account when it
comes to agricultural practices which impact soil management. The great majority of farms
have gone from conventional to reduced till, on average 10 years ago on 84% of the crop area.
3 Farms, all in cluster 3, went from reduced to conventional till on average 11 years ago on 55%
of the crop area. This has a huge impact on overall emissions and is the main determinant of
the agricultural emissions analysed.
Pesticides and herbicides
Only post-emergence pesticides are used with an average of 2 doses per year. No big difference
here between clusters. The assessment did not distinguish between pesticides and herbicides
usage, but as common practice it is assumed that also herbicides are being used in the sugar
cane.
On-farm energy use
The only fuel used on farm is diesel. The average amount of diesel used / ha is a lot higher in
cluster 2 with 247 liters /ha/year resulting in the highest carbon footprint on energy use. The
others are around 120 liters/ha/year. Most (> 95%) planters’ canes are manually harvested.
However, around 50% is mechanically loaded. Irrigation mostly happens per gravity which does
not influence the carbon footprint. One item not assessed by this footprint is that, even if
irrigation enters farms by gravity (from a higher up basin for example), still often the water is
pumped into that basin. This is now not accounted for, but this data might also not be
accessible to the farmers.
Irrigation and agricultural water footprint
Cane cultivation zones vary from dry to superhumid, and 12 of 38 farms have irrigation, most
of them in Cluster 2.
Cluster Erosion Green Blue WF/ Grey WF/ pot. Measures
risk* WF/natural irrigation water
water use contamination
C1 high 1076,4 mm 0 mm 1,818 l/kg Increase productivity
C2 low 1004,4 mm 221,1 mm sugar cane Use efficient irrigation
systems
C3 medium 1273,5 mm 123,5 mm
* Estimated from available data
In C1, rainfall is sufficient for the crop most of the year. Only from mid-August to early
November some irrigation can improve yield, but it depends also on the size of the sugarcane
at that point. Therefore it makes sense that these farms have no irrigation, it also means that
the farm-level blue water footprint equals 0. The green water footprint can be reduced by
increasing productivity, which is mostly related to soil structure improvement. When soil
structure is improved, available water can be used more efficiently also in the dryer season.
Erosion potential is high due to the hilly terrain and high amount of rainfalls.
Carbon and water footprint assessment of the Mauritian sugar cane sector 2020 Page 14 of 26In C2, there are 9 farms with irrigation - average of 12,197 liters/ha (2 farms have indicated
very high water use and increased the average quite a lot)
- 4 drip, 2 pivot, 3 rain gun
Interestingly the drip irrigation users are the biggest water users of all (10,000 to 30,000 liters
/ha). Also the pivot users have higher water use (around 7,500 l/ha). Rain gun users have low
water use (around 3,000 l/ha) due to water use restrictions, which do not apply to farms with
drip irrigation. Being in a much drier area, crop water requirements exceed rainfall
approximately from early April to late November. For those who do not have irrigation, this
leads to lower yields but no blue water footprint. For those who have irrigation, the blue water
footprint is 221.1 mm. Green water footprint is 1004.4 mm.
In C3, there are 3 farms with irrigation:
- average 2389 L / Ha
- all rain gun, low water use (around 2000 liters/ha)
In Cluster 3, precipitation is a little higher, but climatic circumstances also cause the crop
evaporation to be higher. Therefore, the picture is comparable to Cluster 2. Farms without
irrigation have no blue water footprint, otherwise it is 123.5 mm. Green water footprint is
1273,5 mm.
No clear trend can be found between blue water footprint and productivity.
The average green WF for Fairtrade sugar cane production
Green and blue WF of
in Mauritius is 178 litres per kg and the blue WF is 6.8 litres
sugar cane
per kg sugar cane. While the green WF is similar to that of
the US and China and therefore higher than the global
500.0
weighted average of around 140 litres per kg, the blue WF is
similar to sugar cane production in Brazil, China and
450.0 Colombia and thus significantly lower than the global
average of around 50 litres per kg (Gerbens-Leenes and
400.0 Hoekstra, 2011)5. The reliance of Mauritian Fairtrade cane
sugar production on surface and groundwater is thus
350.0 generally comparatively small. Excluding the grey WF, the
total WF of the agricultural production of Fairtrade sugar
300.0 cane in Mauritius is slightly lower than the global weighted
average.
m3/tonne
250.0
The grey WF of the agricultural production is 1,818 l/kg
sugar cane and 19,239 l/kg processed sugar. That means
200.0
that this amount of water is needed to dilute the pollutants
to acceptable levels. The most critical agent with the highest
150.0 value for the agricultural grey water footprint was DMA6,
2,4-D Sel Amine. There was no differentiation regarding grey
100.0 WF between the different clusters. Finding suitable grey WF
studies for the sake of comparison is challenging due to the
50.0 extreme variability of results depending on the types of
chemicals considered and, in this case, no suitable studies
0.0 could be identified.
Blue Water Footprint
Green water footprint
Carbon and water footprint assessment of the Mauritian sugar cane sector 2020 Page 15 of 264.2 Carbon Footprint of Mauritian sugar cane cultivation
Emissions by category:
1) Carbon stock changes – accumulation or release of C in soil or biomass
2) Crop protection – emissions derived from applying pesticides
3) Energy use – emissions from diesel
4) Fertilizer production - emissions from NPK fertilisers*
5) Residue management - emissions from decomposition of residues in the field
6) Soil/fertilizer emissions – deriving from soil respiration in interaction with fertilizers
Overall Carbon footprints per ha and category for the 3 clusters
Average GHG emissions Average GHG emissions Average GHG emissions /kg
Cluster /kg CO2e ha-1 /kg CO2e kg-1 sugar cane CO2e kg-1 processed sugar
1 1030.2 0.018 0.180
2 378.0 0.002 0.020
3 1205.4 0.019 0.190
Average across clusters 871.2 0.013 0.130
Emissions per ha and kg
Per hectare, C2 has the lowest emissions with 378 kg CO2e/ha. C1 and C3 have 1030.2
respectively 1205.4 kg CO2e/ha respectively.
As Cluster 2 is also most productive, with an average yield of 93 tons/ha, the agricultural
emissions per kg are lowest with 0,002 kg CO2e/kg. C1 and C2 have emissions of 0,018 and
0.019 kg CO2e/ha. Sugarcane is a highly productive crop, leading to very low emissions per kg.
Carbon and water footprint assessment of the Mauritian sugar cane sector 2020 Page 16 of 26*Fertilizer production and emissions The biggest source of GHG emissions is fertilizer, both production and (de)nitrification processes that cause NO2 emissions. Most farmers indicate no source, but those who do indicate China. Production emissions from fertilizer is a big impact, therefore important to consider where it comes from. As currently not all producers were indicating its origin and the Cool Farm Tool allocates lower standard emission factors to NPK fertilizers with unclear origin than for those produced in China, the result showing differentiated fertilizer production emissions per cluster may be a little unprecise. It is safe to say that all clusters have approximately equal emissions from fertilizer production, possibly C2 even slightly higher due to higher fertilizer use, and that it may be useful to choose other origins than i.e. China. Interesting observation is that emissions from soil/fertilizer are much higher in C1 and lowest in C3. The explanation can be found in the state of the soil. Soil characteristics such as SOM are generally much better in C3 than C1, whereas C2 is in the middle. This likely causes differences in NO2 emission which play an important role. Residue management Crop residues are left on the field after harvest. This induces soil respiration in the form of CO2 and NO2 but also helps to build up soil organic matter which is reflected in the carbon stock changes. Carbon stock changes The main explanation for the carbon footprint differences between the clusters is not necessarily found in the emissions, but more in carbon sequestration. All 3 clusters show a negative value regarding Carbon stock, which means that they do store carbon in the soil. Tillage change during the past 20 years plays a big role, whereas changing from conventional to reduced or even no-till results in more C sequestration in the soil. In Cluster 2, most land has undergone a conversion from conventional to reduced tillage followed by Cluster 1. In Cluster 3, some farmers have actually done the opposite, going from red to conv till. Therefore, less carbon sequestration took place in C 3. SOM also plays a role in C sequestration – the more SOM in the soil, the faster biomass can be incorporated. Overall, Cluster 2 performs best on productivity and footprinting level. The reasons for productivity may be summarized in good soil quality, high inputs (mechanization, irrigation and fertilizers), combined with a well-drained soil with reasonable SOM which is able to sequester more carbon. Please note the chapter “Assumptions made and system limitations” further below. Carbon and water footprint assessment of the Mauritian sugar cane sector 2020 Page 17 of 26
4.3                                         Carbon footprint of sugar processing
As is the case for many other food items that require considerable processing, the latter can
represent a substantial portion of the climate and water related impacts in the production of
cane sugar. Considering the processing stage is therefore essential when attempting to obtain
a complete picture of the impact of Fairtrade cane sugar production in Mauritius. In order to
quantify the contribution of the processing stage to the overall carbon and water footprint, the
Alteo and OMNICANE refineries, both Mauritius-based producers of Fairtrade cane sugar, were
investigated. Emissions from transport of the finished product to the harbour from which it is
shipped overseas was included in the processing stage, as the refineries are in charge of that
transport. The transport of sugar cane from farms to the refineries is considered later on when
the overall footprint of Fairtrade cane sugar from Mauritius is presented.

Processing Carbon Footprint

                                             0.25      GHG emissions of sugar processing
                                                                                            For both refineries, the extraction and
                                                                                            refining process of an entire year was
                                                                                            analysed for potentially relevant
                                                                                            sources of GHG emissions. The needed
                                                                                            data was then collected directly from
                                                                                            the processing companies. The
                                                                    Transport to harbour    assessment is based on data for the
                                              0.2
                                                                                            calendar year 2019. Using conversion
  kg CO2e / kg refined and special sugars

                                                                    Processing aids         factors provided by the UK Department
                                                                                            for Environment, Food and Rural Affairs
                                                                    Packaging
                                                                                            (Defra), the International Energy
                                                                    Waste material          Agency (IEA) as well as additional
                                                                                            sources, the emissions for each source
                                             0.15                   Diesel                  were calculated. These were then
                                                                                            allocated to the output of refined white
                                                                    Bagasse combustion
                                                                    (electricity + steam)
                                                                                            and special sugars based on their share
                                                                    Steam                   of the overall revenue generated from
                                                                                            the refinery products. The revenue
                                                                    Coal-based              from refined and special sugars
                                                                    electricity             amounted to roughly 95% of the overall
                                              0.1
                                                                    Grid Electricity        revenue of sugar cane derived
                                                                                            products, so that 95% of emissions
                                                                    PWS from Medine
                                                                    (incl. transport)       were attributed to these final products.
                                                                    PWS from 2018           The emissions resulting from trucking
                                                                                            the sugar to the harbour were entirely
                                                                                            allocated to sugar.
                                             0.05
                                                          The figure to the left shows the
                                                          weighted average processing emissions
                                                          by source per kg refined and special
                                                          sugars of the refineries. It is quite clear
                                                          that the consumption of coal-based
           0                                              steam, a by-product of electricity
                                                          generation in the adjacent bagasse- and
coal-fired cogeneration plants, is the largest single source of processing-related GHG emissions.
The emissions associated with steam and electricity consumption would be even higher if it
were not for the large share of the cane-crushing by-product bagasse in electricity and steam

Carbon and water footprint assessment of the Mauritian sugar cane sector 2020                                            Page 18 of 26
generation, which merely causes a small amount of N2O emissions. All of the CO2 released in
the combustion of bagasse and cane trash has recently been captured by sugar cane production
and is therefore considered carbon neutral. The emissions embodied in bagasse are already
accounted for in the agricultural production component.
4.4 Overall carbon and water footprint
In order to obtain representative carbon and water footprints for Fairtrade cane sugar from
Mauritius, the climate and water performance metrics of the three clusters and of the two
sugar processing plants assessed were averaged. For the latter, a weighted average was used
based on the sugar output of the refineries.
Carbon footprint
The figure below shows the
carbon footprint of Fairtrade Average GHG emissions for sugar production
cane sugar from Mauritius. At 0.40 (including agricultural production of sugar cane)
0.36 kg CO2e per kg sugar (see
table below) it is significantly 0.8%
better compared to footprints 1.2%
generated for cane sugar from 0.35 3.1% 0.2%
Australia (>0,5 kg CO2e per kg 0.2%
cane sugar) (Renouf et al., 2008) 0.5%
6
and a generic carbon footprint
for cane sugar (0.43 kg CO2e per 0.30
kg cane sugar) (Rein, 2010)7. The Transport to harbour
31.0%
additional emission reduction by Processing aids
displacement of grid electricity
kg CO2e / kg refined and speical sugars
due to renewable energy 0.25 Packaging
generated from bagasse in
Waste material
surplus of the refineries’ own
demand is not accounted for in 6.6%
Diesel
these numbers. This positive 0.20
Bagasse combustion
aspect of cane sugar production
12.8% (electricity + steam)
in terms of climate impact, i.e. the Steam
combustion of bagasse for
renewable energy generation, 0.15 4.2% Coal-based electricity
will be discussed in the following 6.3% Grid Electricity
section.
6.0% PWS from Medine (incl.
0.10 transport)
PWS from 2018
Sugar cane transport to
refineries
0.05 27.0% Sugar cane (agricultural
production)
0.00
Carbon and water footprint assessment of the Mauritian sugar cane sector 2020 Page 19 of 26Table 1 Farm to harbour emissions of sugar cane derived Faitrade refined and special sugars from
Mauritius by source.
Source Emissions/ kg CO2e per kg sugar
Transport to harbour 0.003
Grid Electricity 0.046
Coal-based electricity 0.024
Steam 0.111
Bagasse combustion (electricity + steam) 0.002
Diesel 0.001
Packaging 0.004
Processing aids 0.011
Waste material 0.001
PWS from Medine (incl. transport) 0.015
PWS from 2018 0.023
Sugar cane transport to refineries 0.022
Sugar cane (agricultural production) 0.097
Total 0.358
Surplus electricity from bagasse -0.526
System Expansion
The displacement of conventional electricity is an important benefit of an integrated cane sugar
production process where the renewable energy embodied in the fibrous remains of the sugar
cane plants are used in an efficient way. Not only can the energy released from bagasse be fed
back into the industrial process itself, but it also contributes to climate change mitigation
beyond that.
Bagasse, the most important by-product of sugar cane processing, as well as cane trash can be
combusted for energy generation. As renewable biomass serves as the feedstock input, the
energy produced from them is
Caused and displaced emissions associated
categorized as renewable and can as
0.4 with cane sugar production
such be accounted for in the carbon
footprint of refined sugar by using the
system expansion method. This is
kg CO2e / kg refined and special sugars
0.2
commonly applied when one or more
co-products of a production process is
used in a way that other materials,
resources or energy sources with 0
higher emission factors can be Emissions of cane
displaced. The difference in emissions sugar production
between those caused by the -0.2 (including agricultural
displaced material or energy source production)
and that associated with the use of the Displaced emissions
co-product can then be subtracted -0.4 due to renewable
from the main product’s footprint. The electricity from
bagasse
efficient use of bagasse by the two
refineries assessed leads to a negative -0.6
overall carbon footprint when
Carbon and water footprint assessment of the Mauritian sugar cane sector 2020 Page 20 of 26applying the system expansion method, meaning that more emissions are avoided by displacing
mainly fossil fuel-based energy sources for electricity generation than are emitted in sugar cane
production, processing and inland transport combined. The diagrams show quite clearly that
the emission reductions that can be attributed to renewable electricity generation from the co-
products of cane sugar production outweigh by far the overall emissions released within the
defined system boundaries. Based on the data and information that was made available for this
assessment, the displacement of emissions outweighs emissions caused by all stages occurring
in Mauritius combined by 0.17 kg CO2e per kg sugar.
Ocean Shipping
As an additional step to the core scope of the study, the emissions associated with the ocean
transport of sugar to Europe were determined. An unweighted average across the most
important shipping routes from Mauritius to Europe via the Suez Canal and transport on a
container vessel was assumed to
Average GHG emissions of sugar cane
calculate these emissions. The following 0.7 from cradle to harbour
European ports of destination were
considered: Felixstowe, Genoa, Antwerp,
Hamburg, Las Palmas, Rotterdam, 0.6
Liverpool, Malmoe. With 0.24 kg CO2e per
kg sugar, ocean transport from Mauritius
to Europe would constitute the single 0.5
largest emission source considered in this
kg CO2e / kg refined and special sugars
assessment. Adding this to the carbon
footprint of sugar results in a total 0.4
footprint of around 0.59 kg CO2e per kg,
exceeding the 0.53 kg CO2e of emissions
displaced on average by bagasse-based 0.3
electricity.
0.2
0.1
0.0
Average ocean transport emissions
Cradle to harbour
Carbon and water footprint assessment of the Mauritian sugar cane sector 2020 Page 21 of 26Total water footprint
Data and information regarding the chemical status of the wastewater generated is insufficient
for calculating a grey WF for the processing stage and only the agricultural production stage
entails a green WF, which is why the total water footprint can only be carried out for the blue
WF.
The graph to the right shows the
distribution of the overall blue BLUE WATER FOOTPRINT OF
water footprint of Fairtrade cane FAIRTRADE CANE SUGAR FROM
sugar from Mauritius. On average, MAURITIUS
water consumption (mainly river
water) of the processing stage
amounts to 10 litres per kg sugar. Processing
16%
Agricultural production of sugar 63 litres
cane has a blue water footprint 6.8 per kg
sugar
litres per kg of sugar cane, which is
equivalent an average of 67 litres
per kg sugar. However, since all of Sugar cane
roduction
the wastewater leaving the
84%
refineries is utilized for the
irrigation of sugar cane crops, this
lowers the net irrigation of sugar
cane to around 53 litres per kg
sugar. All of the wastewater exiting the refineries is used for irrigating sugar cane, resulting in
a circular system that ensures efficient use of water resources. The documentation procedures
are still in development so that in the future, more robust data might be available. The net
overall blue water footprint is therefore around 63 litres per kg sugar, 84% of which are due to
sugar cane cultivation. Therefore, the largest potential for decreasing the water footprint is to
use irrigation as efficiently as possible and implement other good agricultural practices.
Carbon and water footprint assessment of the Mauritian sugar cane sector 2020 Page 22 of 264.5 Assumptions made and system limitations
Agriculture
The biogenic mass of the aboveground growing sugar cane is not accounted for, as it is removed
from the field and processed.
The model currently does not account for the potential soil SOM build-up by the decomposition
and re-growth of the roots after each harvest. This would potentially have a positive effect in C
sequestration which is currently not being accounted for due to the limitations of the used
online tool.
Literature states that sugar cane can effectively store high amounts of stable C in the soil in the
form of ‘plantstone carbon’. As the Cool Farm Tool does not have a corresponding algorhythm,
0,66 tonnes CO2e per hectare have been added to the carbon stock based on the article from
Southern Cross University stating that this amount is sequestered for sugarcane specifically (1).
This reduces the emission calculated by the Cool Farm Tool by about 40%.
One farm from Cluster 1, Mahabir Taramatee, has been excluded from calculations due to a
crop area size that is way too big compared to entered productivity levels. This data was
obviously not realistic, disturbed the outcomes too much and could not be corrected in
hindsight. Therefore a total of 38 farms has been analysed.
Processing
Several assumptions had to be made for calculating the GHG emissions of the processing and
transport to harbour in order to fill data gaps and for the sake of feasibility:
- Emission factors could not be found for all processing aids, so that general products
in the use category or similar chemicals were used, which is common practice.
- The freight capacity of the HGVs used to transport sugar cane from the farms to the
refineries was not provided. Therefore, a freight of 10 tonnes per HGV was
assumed. Furthermore, the return trip of the empty HGVs to the farms was
accounted for as well, as it was assumed that the single purpose of the HGV trips
was to deliver sugar cane to the refineries.
- Even though not all of the sugar output of the refineries is shipped to the harbour
for export, it was assumed that all the refined sugar is transported to the harbour as
the footprint of 1 kg sugar from production until the harbour was the subject of the
assessment. In this case, transport was assumed to be one way from the refineries
to the harbour in HGVs that can carry 25 tonnes of sugar. It was also assumed that
the HGVs are always fully loaded.
Carbon and water footprint assessment of the Mauritian sugar cane sector 2020 Page 23 of 265 Recommendations for mitigating the footprints Green cane harvesting The first step for increasing the resilience of the system has already been taken: through the introduction of production indicators in the Fairtrade standards and awareness campaigns on good agricultural practices, a significant reduction of cane burning was achieved despite the incentive of avoiding the extra costs associated with manual leaf stripping. This positive trend should be continued towards a complete implementation of green sugar cane harvesting. Reducing tillage Sugar cane grows better on a non-compacted soil, but whenever possible tillage should be reduced and replaced by other types of loosening via biomass or cover crops. This accounts particularly for Cluster 3, as their emissions have worsened due to returning to conventional tillage. Reduced tillage also helps to maintain soil organic matter levels, which in return can help soil structure, making conventional tillage less necessary. Keeping soil always covered Leaving the crop residues on the field instead of burning them may induce some soil emissions but is mandatory in order to feed the soil micro-organisms and to build up soil organic matter. In the dry season, the crop residues protect the soil as a mulch layer; keeping weeds down and remaining moisture in the soil. If they’re still left when the rainfalls arrive, they protect the soil from erosion via runoff, capping and from excessive evaporation. Introduce organic fertilization by returning residues from sugar mills to the soil Brazilian examples have shown that spraying vinasse as fermented by-product of cane processing onto the residues increases residue degradation and soil microbial activity due to its rich sugar and mineral content. Test results to date indicate that there are no harmful impacts to the soil and ground water at doses below 300 m³ / ha.8 However, care should be taken and soils should be tested for its effect as vinasse has got a low pH and may contain unwanted residues from processing like sulfates. Also, the incorporation of presscake (scum) can have positive effects and add to soil build-up and replacement of NPK fertilizers. In the case of Mauritius Fairtrade sugar cane farmers, scum availability is very limited and has to be purchased commercially. Erosion prevention Farms with hilly terrain, high precipitation and high rainfall are prone to soil water erosion. Especially C1 is expected have problems as soils are reported to have bad drainage. Structural liming helps to improve the structure of clay soils and raises the pH to a higher level. C3 also encounters higher precipitation and hilly terrain, whereas the soils may be absorbing the water easier due to their high organic matter content. Other classical erosion prevention methods are mulching, reducing tillage, increasing SOM, cover crops, terracing, ploughing/planting across the slope, and installing i.e. vetiver grass hedges as natural water barrier. Keeping soil surface possibly rooted It may be worth trying out a perennial leguminous undersown crop. Introducing low-growing desmodium varieties after tillage / with planting can act as a living mulch as it suppresses weeds, adds nitrogen, protects the soil from erosion, keeps the moisture, and repels pests such as the stem borer. It will also loosen the soil and enrichen it with organic matter via its root system. Desmodium needs well-drained soils with a pH higher than 5 and is quite shade- tolerant. Carbon and water footprint assessment of the Mauritian sugar cane sector 2020 Page 24 of 26
This practise is successfully used with in a mulch
                                                          and push-pull system in maize, with napier grass
                                                          at the sides to attract pests away from the crop
                                                          itself. Cover crops would have to be installed
                                                          directly after ploughing along with the planting, so
                                                          that the roots can penetrate into and stabilize the
                                                          loosened soil.
                                                          Also integrating deep-rooting and/or leguminous
                                                          crops after a sugar cane life cycle, either in a full
                                                          crop rotation or as intercrop, will be helpful to add
                                                          to the soil organic matter. Crop residues and
   Picture: PIP manual from COLEACP                       especially roots should always be left in the field
                                                          and possibly incorporated.
Raise the pH to approx. 6,5
The pH of most farms is below 5,5. Sugar cane tolerates low pH, but certain nutrients such as
P, K, C and Mg are more likely to be available at a higher pH. It will not help to add them via
fertilization as long as the pH stays low. Increasing SOM will also buffer the pH levels, but to
start off with liming will be required if pH is less than 5,0.
What’s more, in acid soils conditions (pH less than 5,2), Aluminium replaces Calcium on cation
exchange capacity and Al toxicity may occur. In sandy soils having a very low cation exchange
capacity, lower concentrations of Al in the soil solution may already cause toxicity problems.
High applications of K may induce Ca deficiency in acid soil containing low Ca levels 9. Better
than replacing one single soil mineral nutrient is to increase the buffer capacity of the soil by
liming and adding organic matter. Individual soil testing will help to give a more detailed advice
here.

Pay attention to salinity
Sugarcane is regarded as a relatively salt sensitive plant which should be considered when it
comes to irrigation. In the case of Mauritius this is apparently not a problem.

Check and change fertilizers origins
The production of synthetic N fertilizer is very energy-intensive. According to the origins of the
fertilizers and the assumed respective energy sources, the emission factors per pk product
change. It could be verified if choosing a more local origin or an origin from a country using a
high percentage of renewable energy would make a difference.

Carbon and water footprint assessment of the Mauritian sugar cane sector 2020                       Page 25 of 26
6 References
1
ESRA study on raw materials:
http://www.sugarrefineries.eu/uploads/media/ESRA_study_raw_materials_2019.pdf
2
Product Life Cycle Accounting and Reporting Standard:
https://ghgprotocol.org/sites/default/files/standards/Product-Life-Cycle-Accounting-
Reporting-Standard_041613.pdf
3
SCU-School of Environment, Science and Engineering 2007: Sugarcane the champion crop at
carbon sequestration:
https://epubs.scu.edu.au/cgi/viewcontent.cgi?article=1783&context=esm_pubs
4
Water Footprint manual:
https://waterfootprint.org/media/downloads/TheWaterFootprintAssessmentManual_2.pdf
5
Gerbens-Leenes and Hoekstra, 2011:
https://waterfootprint.org/media/downloads/Gerbens-Hoekstra-2012-
WaterFootprintSweeteners-and-Bioethanol_1.pdf
6
Renouf et al., 2008: https://www.sciencedirect.com/science/article/pii/S0961953408000561
7
Rein, 2010:
https://www.researchgate.net/publication/290806471_The_carbon_footprint_of_sugar
8
Re-using sugar mill by-products as fertilizer:
https://www.novacana.com/cana/uso-vinhaca-cultura and
https://www.researchgate.net/publication/26349582_Recuperacao_do_nitrogenio_15N_da_
ureia_e_da_palhada_por_soqueira_de_cana-de-
acucar_Saccharum_spp/link/546de5710cf2a7492c562ad7/download
9
Soil requirements for sugar cane: http://www.sugarcanecrops.com/soil_requirement/
Carbon and water footprint assessment of the Mauritian sugar cane sector 2020 Page 26 of 26You can also read