Estimated effect of the permafrost carbon feedback on the zero emissions commitment to climate change
←
→
Page content transcription
If your browser does not render page correctly, please read the page content below
Biogeosciences, 18, 4937–4952, 2021
https://doi.org/10.5194/bg-18-4937-2021
© Author(s) 2021. This work is distributed under
the Creative Commons Attribution 4.0 License.

Estimated effect of the permafrost carbon feedback on the zero
emissions commitment to climate change
Andrew H. MacDougall
Climate & Environment, St. Francis Xavier University, Antigonish, B2G 2W5, Canada

Correspondence: Andrew H. MacDougall (amacdoug@stfx.ca)

Received: 21 May 2021 – Discussion started: 26 May 2021
Revised: 6 August 2021 – Accepted: 7 August 2021 – Published: 10 September 2021

Abstract. Zero Emissions Commitment (ZEC), the expected          ing carbon budget”, which in turn quantifies the total emis-
change in global temperature following the cessation of an-      sions compatible with meeting a given temperature change
thropogenic greenhouse gas emissions, has recently been          guardrail (e.g. Rogelj et al., 2018; Matthews et al., 2021),
assessed by the Zero Emissions Commitment Model Inter-           such as those set out in the Paris Agreement (United Nations,
comparison Project (ZECMIP). ZECMIP concluded that the           2015). ZEC was recently the focus of a model intercom-
component of ZEC from CO2 emissions will likely be close         parison project organized through the Coupled Model Inter-
to zero in the decades following the cessation of emissions.     comparison Project phase 6 (CMIP6) (Jones et al., 2019).
However, of the 18 Earth system models that participated in      The project, formally called the Zero Emissions Commit-
ZECMIP only 2 included a representation of the permafrost        ment Model Intercomparison Project (ZECMIP) (Jones et al.,
carbon feedback to climate change. To better assess the po-      2019), gathered simulations from 18 Earth system models of
tential impact of permafrost carbon decay on ZEC, a series       full and intermediate complexity (MacDougall et al., 2020)
of perturbed parameter experiments are here conducted with       and assessed the CO2 component of ZEC. For the tier-one
an Earth system model of intermediate complexity. The ex-        idealized experiment where 1000 Pg C of CO2 was emit-
periment suggests that the permafrost carbon cycle feedback      ted to the atmosphere before cessation of emissions, ZEC
will directly add 0.06 [0.02 to 0.14] ◦ C to the benchmark the   ranged from −0.36 to 0.29 ◦ C with a model ensemble mean
ZEC value assesses 50 years after 1000 Pg C of CO2 has been      of −0.07 ◦ C 50 years after emissions ceased. However, only
emitted to the atmosphere. An additional 0.04 [0 to 0.06] ◦ C    2 of the 18 models that participated in ZECMIP had a rep-
is likely to been added relative to the benchmark ZEC value      resentation of the permafrost carbon feedback to climate
from the thaw-lag effect unaccounted for in the ZECMIP ex-       change, a feedback process that is expected to release CO2
periment design. Overall I assess that the permafrost carbon     and CH4 into the atmosphere for centuries after emissions
feedback is unlikely to change the assessment that ZEC is        cease (Schuur et al., 2015; McGuire et al., 2018). Thus the
close to zero on decadal timescales; however, the feedback       effect of the permafrost carbon feedback on ZEC has yet to
is expected to become more important over the coming cen-        be well quantified.
turies.                                                             The soils of the Northern Hemisphere permafrost region
                                                                 are estimated to contain between 1100 and 1500 Pg C of or-
                                                                 ganic matter (Hugelius et al., 2014), about half of which is
                                                                 held in the perennially frozen zone of these soils (Hugelius
1   Introduction                                                 et al., 2014). As climate warms and permafrost thaws, or-
                                                                 ganic matter in permafrost-affected soils is exposed to in-
The Zero Emissions Commitment (ZEC) is the change in             creased periods of time where local temperature is above
global temperature expected to occur following the cessation     freezing, and hence to enhanced rate of decay releasing CH4
of anthropogenic emissions of greenhouse gases and aerosols      and CO2 to the atmosphere (e.g. Schuur et al., 2015). A re-
(Hare and Meinshausen, 2006; MacDougall et al., 2020).           cent informal (non-CMIP) model intercomparison exercise
ZEC is one of five metrics needed to compute the “remain-

Published by Copernicus Publications on behalf of the European Geosciences Union.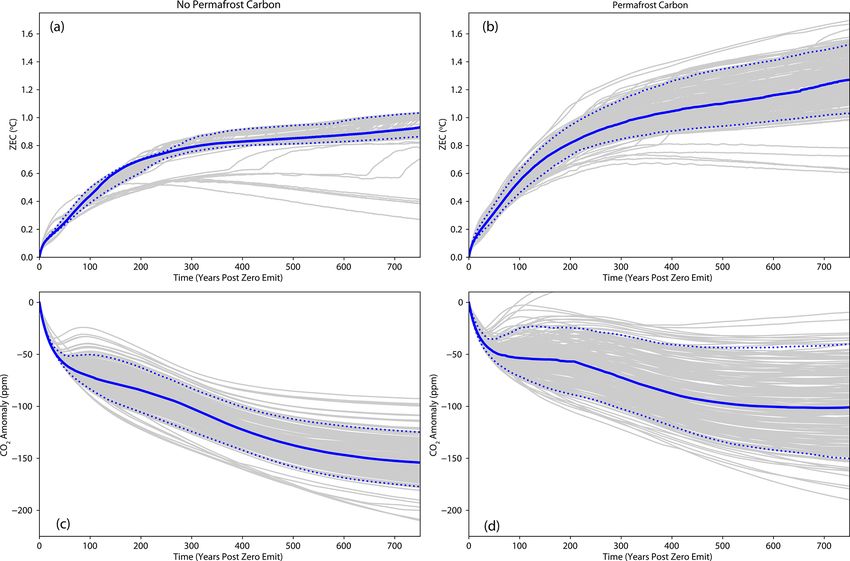
4938                                                              A. H. MacDougall: ZEC and the permafrost carbon feedback

quantifying the permafrost carbon feedback estimated a re-            faster than in the historical trajectory, and since it takes time
lease of carbon of between 74 and 652 Pg C by year 2300 un-           for permafrost soil to thaw and organic matter within these
der the high-end Representative Concentration Pathway 8.5             soils to decay, the experimental protocol will tend to underes-
scenario, with substantially lower release or even gain of soil       timate release of carbon from permafrost soils (MacDougall,
carbon under mitigation scenarios (McGuire et al., 2018).             2019).
Thus the permafrost carbon feedback to climate change has                Here I will use a perturbed parameter ensemble ap-
the potential to affect the value of ZEC in a fashion that was        proach to estimate the contribution to CO2 -only ZEC from
poorly quantified by ZECMIP.                                          the release of carbon from permafrost soils, following the
   Uncertainty in projections from Earth system models can            ZECMIP protocol. I will also conduct an experiment follow-
be classified into three components: (1) structural uncer-            ing a more realistic CO2 emission trajectory in order to quan-
tainty, (2) parameter uncertainty, and (3) scenario uncertainty       tity the thaw-lag effect from the high emission rates of the
(e.g. MacDougall and Knutti, 2016). Structural uncertainty is         ZECMIP protocol.
created from the discrepancy between the system the model
is intended to represent and the system the model actually
describes (Smith, 2007; Eyring et al., 2016). Examining dif-          2     Methods
ferent models of the same system with standardized forcings
through model intercomparison projects such as ZECMIP is              2.1    Model description
the principle way of quantifying structural uncertainty in cli-
mate sciences (Eyring et al., 2016). Parameter uncertainty            The University of Victoria Earth System Climate Model
is uncertainty about the value that model parameter should            (UVic ESCM) is a climate model of intermediate complex-
take on (Smith, 2007). As model parameters are sometimes              ity founded around a three-dimensional ocean general cir-
quantities measurable in the natural world, parameter un-             culation model coupled to a simplified moisture and energy
certainty is some cases equivalent to measurement uncer-              balance atmosphere (Weaver et al., 2001). The version of
tainty. In other cases parameters represent an amalgam of             the model used here (version 2.9pf) has representation of
natural processes; in such cases defining parameter uncer-            the oceanic and terrestrial carbon cycles (Schmittner et al.,
tainty becomes more ambiguous (Smith, 2007). Parameter                2008; Meissner et al., 2003). The oceanic carbon cycle has
uncertainty can be quantified with perturbed parameter ex-            representations of ocean carbonate chemistry (Weaver et al.,
periments, wherein ensembles of model variants with pa-               2001), phytoplankton–zooplankton–detritus ocean biology
rameter values selected from defined probability distribution         scheme (Schmittner et al., 2008), and interaction between
functions are run under the same experiment conditions (e.g.          ocean sediments and alkalinity (Archer, 1996). The terres-
Forest et al., 2002). Several such experiments have been con-         trial component is composed of the Top-down Representa-
ducted to assess uncertainty in the permafrost carbon feed-           tion of Interactive Foliage and Flora Including Dynamics
back (Schneider von Deimling et al., 2015; MacDougall and             (Triffid) dynamic vegetation model (Cox et al., 2001; Meiss-
Knutti, 2016; Gasser et al., 2018). Scenario uncertainty is           ner et al., 2003), a multi-layer representation soil respiration
created by uncertainty about what humans will do in the fu-           (MacDougall et al., 2012), and a permafrost carbon module
ture and is well explored by the coordinated scenario frame-          (MacDougall and Knutti, 2016).
work of CMIP (Eyring et al., 2016; O’Neill et al., 2017).                The terrestrial subsurface of the model is composed of 14
   For the permafrost carbon feedback, uncertainty ranges             layers, reaching a total depth of 250 m (Avis et al., 2011).
derived from structural uncertainty and parameter uncer-              The top eight layers (10 m) are active in the hydraulic cy-
tainty assessments have proven similar. The model intercom-           cle and deeper layers are impermeable bedrock (Avis et al.,
parison exercise of McGuire et al. (2018) found a range of            2011). The freeze–thaw physics of the soil accounts for the
74 to 652 Pg C with a mean of 341 Pg C released from per-             effect of soil valence forces on freezing point, and the frozen
mafrost soils by year 2300 under Representative Concentra-            and unfrozen fraction of the soil water is calculated using
tion Pathway 8.5, compared to 159 to 587 Pg C with a mean             equations the minimize Gibbs free energy (Avis, 2012). The
of 376 Pg C for the perturbed parameter experiment of Mac-            top six layers of the model (3.35 m) are active in the carbon
Dougall and Knutti (2016), forced under the same scenario.            cycle. Carbon is assigned to soil layers from Triffid based
   In addition to 16 out of the 18 ZECMIP models hav-                 on the root density in each soil layer, with remaining dead
ing no permafrost carbon module, the experimental design              plant matter added to the top soil layer (MacDougall et al.,
of ZECMIP is ill designed to quantify the permafrost car-             2012). Root density varies by plant function type and the
bon feedback. The top-tier idealized ZECMIP experiment                temperature of the soil layer (roots do not grow in frozen
branches from the idealized 1pctCO2 experiment where                  soil) (MacDougall et al., 2012). In model grid cells where
atmospheric CO2 concentration rises at 1 % a year com-                permafrost exists (where soil layers have been below 0 ◦ C
pounded leading to a quadrupling of CO2 concentration in              for two or more consecutive years) a diffusion-based cry-
140 years (Jones et al., 2019; Eyring et al., 2016). Following        oturbation scheme is used to redistribute soil carbon in the
this protocol CO2 and hence global temperatures rise much             soil column. The scheme was originally developed by Koven

Biogeosciences, 18, 4937–4952, 2021                                                      https://doi.org/10.5194/bg-18-4937-2021
A. H. MacDougall: ZEC and the permafrost carbon feedback                                                                     4939

et al. (2009) and modified for implementation in the UVic          perturbing six model parameters. Four of these parameters
ESCM in MacDougall and Knutti (2016). The scheme allows            control the size and susceptibility to decay of the permafrost
for a permafrost carbon pool to be generated alongside reg-        carbon pool, and two (climate sensitivity and arctic amplifi-
ular soil carbon in permafrost soils. The modifications made       cation) are physical climate parameters. The four permafrost
to the scheme by MacDougall and Knutti (2016) allow the            carbon parameters are the following: (1) the permafrost car-
permafrost carbon pool to come into equilibrium during the         bon decay constant; (2) the available fraction; (3) the pas-
5000-year model spin-up. The version of the UVic ESCM              sive pool transformation rate; and (4) the permafrost carbon
used here does not have a methane production module. Thus          saturation factor – which controls the size of the permafrost
emissions of carbon from soils to the atmosphere happen            carbon pool. The permafrost carbon decay constant controls
only as CO2 .                                                      how fast available permafrost carbon can decay given the
   In the version of the UVic ESCM used here (MacDougall           temperature and moisture of the soil. The available fraction is
and Knutti, 2016) permafrost carbon is a separate carbon           the fraction of permafrost carbon that is allowed to decay, ef-
pool. Permafrost carbon is created when carbon is advected         fectively the fraction of permafrost carbon that is unprotected
across the permafrost table by the cryoturbation scheme and        or weakly protected from decay. The passive pool transfor-
can only be destroyed by being respired into CO2 . The pool        mation rate is the rate at which highly protected permafrost
is characterized by a decay rate constant (κp ), a fraction of     carbon becomes weakly protected. The probability density
the pool that is available for decay (available fraction, Af ),    functions (PDFs) for the permafrost carbon decay constant
and a passive pool transformation rate (κtf ), which is the        and the available fraction were taken from the meta-analysis
rate at which the passive permafrost carbon becomes part           of permafrost carbon incubation experiments conducted by
of the available fraction. The available fraction is essentially   Schädel et al. (2014). The passive pool transformation rate
the combined size of the fast and slow carbon pools as con-        is constrained primarily by the non-existence of a remnant
ceptualized in incubation experiments (Schädel et al., 2014;       mid-latitude permafrost carbon pool from the last glacial
MacDougall and Knutti, 2016). This scheme accounts for the         maximum, yielding an estimated value of 0.25 × 10⁻¹⁰ to
large fraction of permafrost carbon that is very resistant to      4 × 10⁻¹⁰ s−1 , with a best guess of 1 × 10⁻¹⁰ s−1 (Trum-
decay (Schädel et al., 2014) while still allowing the pool to      bore, 2000; MacDougall and Knutti, 2016). The analysis of
decay over millennial time periods (MacDougall and Knutti,         MacDougall and Knutti (2016) showed that the passive pool
2016). A fourth parameter, the saturation factor (S) from the      transformation rate has only a weak effect of the permafrost
cryoturbation scheme allows the size of the permafrost car-        carbon feedback on decadal and centennial timescales. The
bon pool to be tuned (MacDougall and Knutti, 2016). The            estimated uncertainty in the size of the permafrost carbon
saturation factor is indexed to the mineral porosity of soils      pool was taken from Hugelius et al. (2014). For each model
(which vary by grid cell and soil layer) and accounts for          variant 5000-year model spin-ups were conducted with year
the diminishing concentration of soil carbon at depth in per-      1850 of the Common Era (CE) radiative forcing to bring the
mafrost regions (Hugelius et al., 2014).                           permafrost carbon into equilibrium, representing an invest-
   The model experiments here use the permafrost carbon            ment of 1.25 million model years of simulation time. We
variant of the UVic ESCM 2.9 detailed in MacDougall and            have re-used these model spin-ups for the present study.
Knutti (2016). A newer version of the UVic ESCM (version              MacDougall and Knutti (2016) also perturbed two phys-
2.10) is now available (Mengis et al., 2020). I use the older      ical model parameters: climate sensitivity and arctic ampli-
version of the model to allow for the use of legacy code and       fication. These parameters do not affect the model spin-up
legacy model spin-ups from MacDougall and Knutti (2016).           as both affect deviations from the pre-industrial climate; thus
Note that the terrestrial component of UVic ESCM 2.10 was          they can be changed for the present study. To my knowledge
taken from the version developed for MacDougall and Knutti         there has been no major update in the uncertainty range of
(2016), and thus the terrestrial components of the model ver-      arctic amplification since 2016. However, Sherwood et al.
sions are virtually identical (Mengis et al., 2020).               (2020) have substantially constrained the uncertainty in equi-
   By changing the flow of outgoing longwave radiation to          librium climate sensitivity to a 5th to 95th percentile range of
space as a function of global surface temperature anomaly,         2.3 to 4.7 ◦ C for a doubling of atmospheric CO2 concentra-
the climate sensitivity of the UVic ESCM can be altered            tion. Thus I have computed new climate sensitivity param-
(Zickfeld et al., 2009). Similarly by changing the meridional      eters for the 250 model variants. I use the same functional
diffusivity of the atmosphere within the model, arctic ampli-      form for the climate sensitivity PDFs as previous papers (e.g.
fication can also be altered (Fyke et al., 2014).                  Olson et al., 2012; MacDougall and Knutti, 2016), a product
                                                                   of two normal-inverse Gaussian functions. To get new pa-
2.2   Perturbed parameter experiments                              rameter values for the climate sensitivity PDF a Monte Carlo
                                                                   method was used to fit the function to the distribution out-
To assess the uncertainty in the strength of the permafrost        lined by Sherwood et al. (2020): a 5th to 95th percentile
carbon cycle feedback to climate change, MacDougall and            range of 2.3 to 4.7 ◦ C, a 66 % range of 2.6 to 3.9 ◦ C, and
Knutti (2016) generated 250 variants of the UVic ESCM by

https://doi.org/10.5194/bg-18-4937-2021                                                   Biogeosciences, 18, 4937–4952, 2021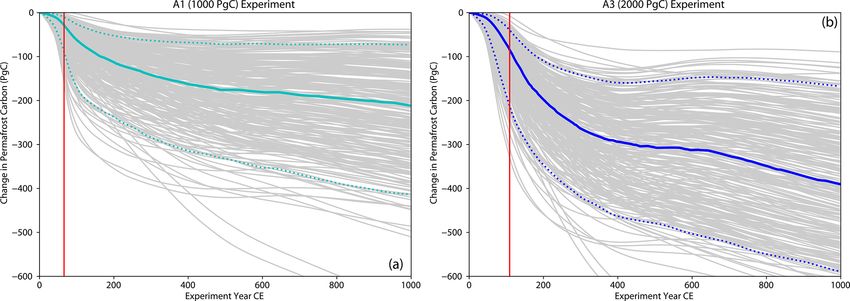
4940 A. H. MacDougall: ZEC and the permafrost carbon feedback
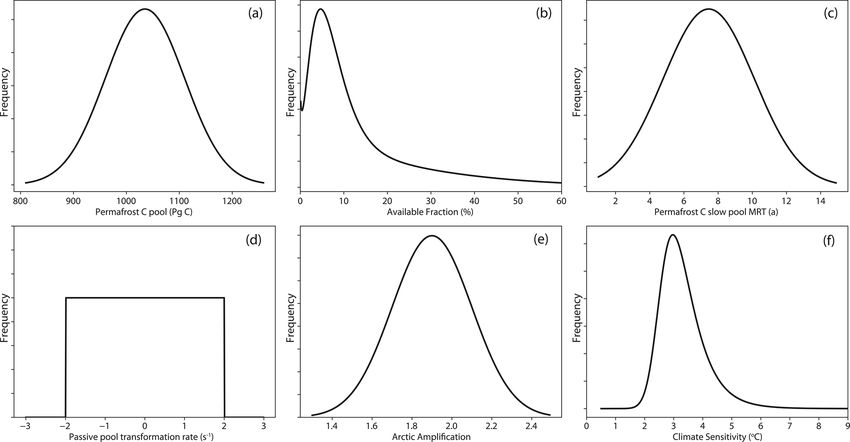
Figure 1. Probability distribution functions of the six parameters perturbed in this study. MRT is mean residence time. Note that (d) has a
logarithmic scale. All parameter PDFs except climate sensitivity are that same as in MacDougall and Knutti (2016).
the magnitude of the thaw-lag permafrost effect from using
the 1pctCO2 experiment to quantify ZEC? And (3) how sen-
sitive is the permafrost carbon feedback contribution to ZEC
to total CO2 emitted before cessation of emissions?
To answer the first question we would ideally compare
simulations with and without permafrost carbon that are oth-
erwise identical. In the UVic ESCM framework we can cre-
ate a version without permafrost carbon by setting the cry-
oturbation diffusion parameter to zero during model spin-
up. Without cryoturbation there will be no permafrost carbon
pool, and the active layer carbon pool will also be reduced in
size. However, the presence of carbon in soils subtly changes
soil thermal and hydraulic properties in the UVic ESCM
(Avis, 2012) such that the absence of a permafrost carbon
Figure 2. Emissions trajectories for the three experiment sets con-
pool could change the baseline climate conditions of the
ducted for this study.
model. To test the magnitude of this effect simulations were
conducted with the UVic ESCM with the cryoturbation dif-
fusion parameter set to zero and all other model parameters
a median value of 3.0 ◦ C. The new parameter values for the
held at their default settings. The model version was spun up
PDF are given in Appendix A.
for 5000 years. Both the version of the model with cryotur-
Figure 1 shows the PDFs of each parameter perturbed in
bation set to zero and the default version of the model were
this study. Note that all but equilibrium climate sensitivity
forced with the 1pctCO2 experiment (where CO2 concen-
are identical to MacDougall and Knutti (2016).
tration rises at 1 % per year compounded). Figure B1 shows
that the difference between the two simulations is minimal
2.3 Model experiments
with respect to global average temperature, with a 0.01 ◦ C
difference in baseline global temperature and a smaller dif-
To quantify the effect of the permafrost carbon feedback on
ference by the time atmospheric CO2 concentration doubled
ZEC, we have three key questions: (1) How much warming
in year 70 of the experiment. The difference in regular (non-
will the permafrost carbon feedback add to ZEC? (2) What is
Biogeosciences, 18, 4937–4952, 2021 https://doi.org/10.5194/bg-18-4937-2021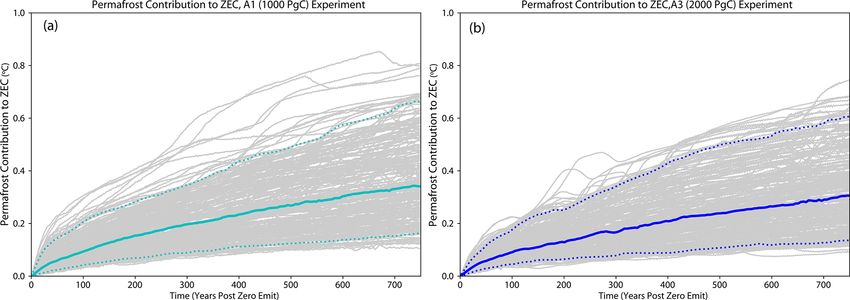
A. H. MacDougall: ZEC and the permafrost carbon feedback                                                                       4941

Table 1. Model experiments conducted in this study.

      Experiment                         A1                        A3                       Historical-SSP4-6.0
      Long name                          esm-1pct-brch-1000PgC     esm-1pct-brch-2000PgC    Historical, Shared Socioeconomic
                                                                                            Pathway Four version 6.0
      Total CO2 emissions (PgC)          1000                      2000                     1000
      Simulations with permafrost?       Yes                       Yes                      Yes
      Simulations without permafrost?    Yes                       Yes                      No

permafrost) soil carbon is also small between the two sim-          scenario uncertainty (O’Neill et al., 2017). For the experi-
ulation. The simulation without cryoturbation has 1837 Pg C         ment conducted here I selected two SSP-based criteria: that
of regular soil carbon in the pre-industrial state, and the sim-    the SSP reaches 1000 Pg C of CO2 emissions and that the
ulation with cryoturbation has 1853 Pg C in the regular soil        1000 Pg C cumulative CO2 emissions total is reached be-
carbon pools in the pre-industrial state.                           fore emissions begin to approach zero. The second crite-
   Thus to quantify the effect of permafrost carbon feedback        rion is needed as the ZECMIP bell-shaped curve experiments
on ZEC, two parallel sets of experiments were conducted.            showed that the Transient Climate Response to Cumulative
In one set of experiments model spin-ups from MacDougall            CO2 Emissions (TCRE) and ZEC effects become mixed as
and Knutti (2016) were used along with the 250 variants of          emissions approach zero (MacDougall et al., 2020). There-
the model to compute ZEC including permafrost. In a sec-            fore a sudden cessation of emissions is needed to separate
ond set of experiments a single model spin-up with the cry-         TCRE from ZEC. SSP4-6.0 is the lowest emission SSP that
oturbation diffusion parameter set to zero was used and 250         reaches 1000 Pg C whilst maintaining near-peak CO2 emis-
model variants were generated using just the climate sensi-         sions. Thus using SSP4-6.0 maximizes the time need to reach
tivity and arctic amplification parameters from the perturbed       1000 Pg C and therefore is optimal for assessing the thaw-lag
parameter sets. Thus each parallel variant pair will have the       effect. Under SSP4-6.0 CO2 emissions 1000 Pg C is reached
same climate sensitivity and arctic amplification parameters        in year 2067 of the Common Era (CE), allowing permafrost
with only the existence of permafrost carbon different be-          the time to thaw and the organic matter within it to decay.
tween the parallel variants. All model variants were forced            The effect of total CO2 emissions on the permafrost car-
with the esm-1pct-brch-1000PgC (A1) ZEC experiment de-              bon contribution to ZEC is quantified by forcing each of the
scribed in Jones et al. (2019) where the 1000 Pg C of car-          250 parallel model variants with the esm-1pct-brch-2000PgC
bon is emitted following the 1pctCO2 experiment pathway,            (A3) ZEC experiment from Jones et al. (2019), wherein
and emissions instantaneously go to zero once 1000 Pg C is          2000 Pg C of CO2 is emitted following the 1pctCO2 experi-
reached. All non-CO2 forcings are held either at their year         ment pathway and emissions instantaneously go to zero once
1850 CE values or their long-term mean for volcanic and so-         2000 Pg C is reached. Again the permafrost carbon effect on
lar forcing. The simulations are forced with CO2 emissions          ZEC is computed from the difference between parallel vari-
diagnosed from the default version of the UVic ESCM 2.9pf           ants with and without permafrost carbon. Model experiments
such that all simulations are forced with the same CO2 emis-        are summarized in Table 1.
sions pathway. Thus most model variants will only approx-
imately follow the 1pctCO2 CO2 trajectory, but all variants
have the same point in time that emissions cease, greatly sim-      3     Results
plifying analysis of the results. The difference between par-
allel variants with and without permafrost carbon quantifies        Figure 3 shows ZEC for the A1 (1000 Pg C) experiment for
the effect of the permafrost carbon pool on ZEC.                    the model versions with and without permafrost carbon. The
   To quantify the permafrost thaw-lag effect a set of ex-          figure shows that over centennial timescales the model ver-
periments were conducted with the 250 model variants with           sion with permafrost carbon has a higher ZEC. Consistent
permafrost carbon. The model variants were forced with a            with a higher ZEC, the model version with permafrost car-
CO2 emissions trajectory that follows historical emissions          bon exhibits a slower decline in atmospheric CO2 concen-
until year 2019 (Friedlingstein et al., 2020) and afterwards        tration after emissions cease. Figure 5a displays the dif-
follows the CO2 emissions trajectory of a Shared Socioeco-          ference in ZEC between the simulations with and without
nomic Pathway (SSP) (O’Neill et al., 2017) until 1000 Pg C          permafrost carbon for the A1 (1000 Pg C) experiment. Fifty
has been emitted (Fig. 2). Thereafter CO2 emissions are set         years after emissions cease the existence of a permafrost
to zero. All non-CO2 forcings are held either at their year         carbon pool has added 0.06 [0.02 to 0.14] ◦ C to ZEC (me-
1850 CE values or their long-term mean for volcanic and             dian [5th to 95th percentile]), rising to an addition of 0.09
solar forcing. Eight SSPs were used by CMIP6 to quantify            [0.04 to 0.21] ◦ C 100 years after emissions cease, and 0.27
                                                                    [0.12 to 0.49] ◦ C 500 years after emissions cease (Table 2).

https://doi.org/10.5194/bg-18-4937-2021                                                    Biogeosciences, 18, 4937–4952, 2021
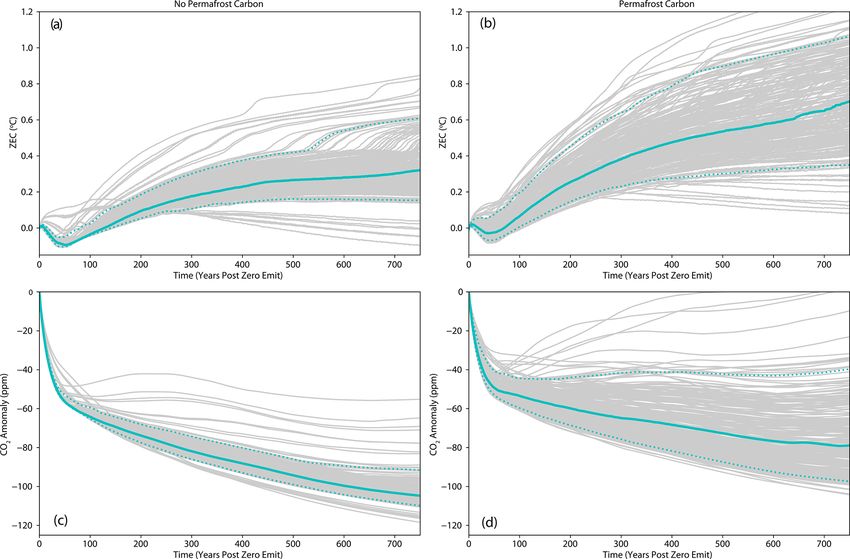
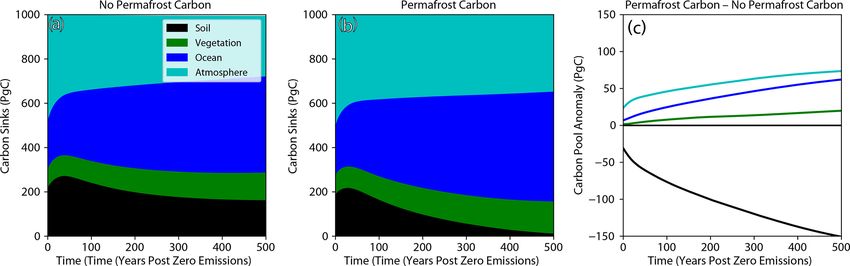
4942                                                                A. H. MacDougall: ZEC and the permafrost carbon feedback

Figure 3. (a, b) Zero Emission Commitment (ZEC) for model versions without (a) and with (b) a permafrost carbon pool forced by the A1
(1000 Pg C) experiment. ZEC is temperature change relative to the year emissions cease. (c, d) Change in atmospheric CO2 concentration
relative to year emissions cease for model versions without (c) and with (d) a permafrost carbon pool, forced by the A1 (1000 Pg C) exper-
iment. Grey lines are individual model variants, solid line is the median of the variants, and dashed lines are the 5th and 95th percentile.
Sudden increase in warming rate seen in many warmer model variants is associated with the disappearance of perennial sea ice in the Weddell
and Ross seas and concurrent changes in overturning circulation.

Figure 4. (a, b) Size of carbon sinks following cessation of emissions in the A1 (1000 Pg C) experiments with and without permafrost carbon.
(c) Difference in size of carbon pools between the simulation with and the simulation without permafrost carbon. The total of all carbon sinks
remains 1000 Pg C after emissions cease.

Biogeosciences, 18, 4937–4952, 2021                                                           https://doi.org/10.5194/bg-18-4937-2021
A. H. MacDougall: ZEC and the permafrost carbon feedback 4943
Figure 5. Difference in ZEC between experiments with and without permafrost carbon. (a) Anomalies for the A1 (1000 Pg C) experiment.
(b) Anomalies for the A2 (2000 Pg C) experiment. Grey lines are individual model variants, solid line is the median of the variants, and
dashed lines are the 5th and 95th percentile.
Table 2. Median anomalies in ZEC created by release of carbon from permafrost soils, and the magnitude of the respective carbon release.
Values in square brackets are 5th to 95th percentile ranges from the perturbed parameter experiments.
Years after ZEC anomaly A1 (◦ C) ZEC anomaly A3 (◦ C) Permafrost C Permafrost C
cessation of emissions release A1 (PgC) release A3 (PgC)
0 – – 29 [10 to 90] 84 [40 to 213]
50 0.06 [0.02 to 0.14] 0.06 [0.03 to 0.12] 73 [32 to 190] 159 [85 to 300]
100 0.09 [0.04 to 0.21] 0.09 [0.05 to 0.18] 100 [46 to 222] 205 [114 to 354]
500 0.27 [0.12 to 0.49] 0.24 [0.11 to 0.50] 178 [70 to 346] 312 [148 to 505]
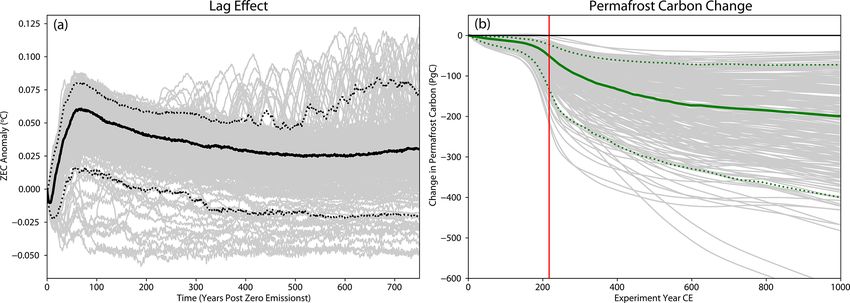
The additional warming is being driven by release of carbon Table 3. Correlation coefficients between perturbed model param-
from permafrost soils, which totals 29 [10 to 90] Pg C by the eters and the anomaly in ZEC 50 years after emissions cease.
time emissions cease, 73 [32 to 190] Pg C by 50 years after Stronger correlation indicates increased influence for a given pa-
emissions cease, 100 [46 to 222] Pg C 100 years after emis- rameter. MRT is mean residence time.
sions cease, and 178 [70 to 346] Pg C 500 years after emis-
A1 A3
sions cease (Fig. 6a, Table 2). The global mean temperature
anomaly at the time emissions cease is 1.51 [1.41 to 1.58] ◦ C Permafrost C pool 0.19 0.22
for the non-permafrost carbon experiment and 1.55 [1.47 to Available fraction 0.91 0.64
1.67] ◦ C for the permafrost carbon experiment. Thus, the car- Permafrost slow pool MRT −0.01 0.08
bon released from permafrost soils by the time emissions Passive pool transformation rate 0.22 0.55
ceases causes 0.04 [0.01 to 0.12] ◦ C of additional warming Equilibrium climate sensitivity 0.15 −0.11
Arctic amplification 0.01 −0.15
in the model versions with permafrost carbon. The value of
ZEC is determined by a balance of the warming effect of
diminishing ocean heat uptake and the cooling effect of de-
clining atmospheric CO2 concentration (MacDougall et al., mosphere for centuries after emissions cease, with the ocean
2020); thus the initial cooling after emissions cease is likely gradually becoming a more significant sink. Vegetation re-
caused by the initial rapid drop in atmospheric CO2 concen- mains a relatively small sink throughout the experiments.
tration (3c, and d). Figure 4 also suggests that the source of the rapid fall in at-
Figure 4 shows mean difference in global carbon pool mospheric CO2 in the decades after emissions cease is con-
sized in the simulations with and without permafrost car- tinued growth of the vegetation and soil carbon sinks. Within
bon, averaged across all of the model variants, for the A1 a century of cessation of emissions the terrestrial biosphere
(1000 Pg C) experiment. The excess carbon released from transitions from a carbon sink to carbon source, a process
permafrost soils is taken up by vegetation, the ocean, and exacerbated by the existence of permafrost carbon pool.
the atmosphere. Most of the excess carbon resides in the at-
https://doi.org/10.5194/bg-18-4937-2021 Biogeosciences, 18, 4937–4952, 2021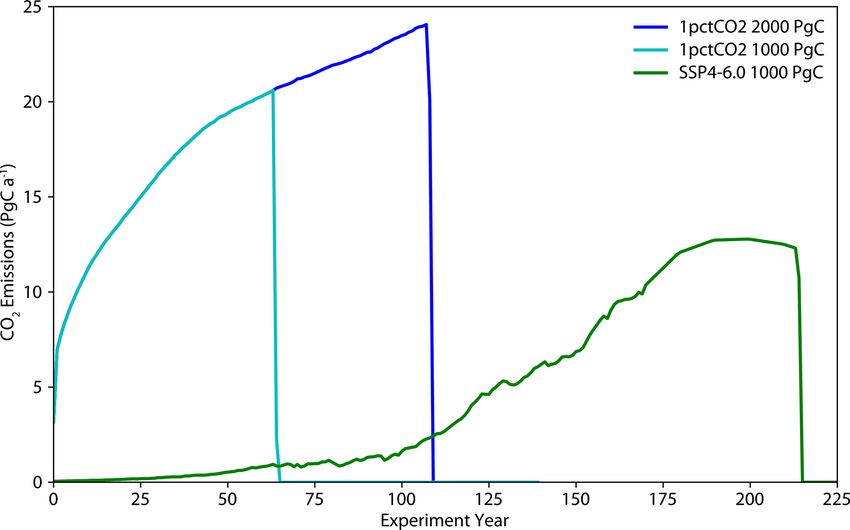
4944                                                                 A. H. MacDougall: ZEC and the permafrost carbon feedback

Figure 6. Change in the soil carbon held in permafrost regions relative to pre-industrial size. (a) Change for the A1 (1000 Pg C) experiment.
(b) Change for the A2 (2000 Pg C) experiment. Grey lines are individual model variants, solid line is the median of the variants, and dashed
lines are the 5th and 95th percentile. Vertical red line marks the time emissions cease.

Figure 7. (a) Difference in ZEC between the SSP4-6.0-based 1000 Pg C experiment and the standard ZECMIP A1 (1000 Pg C) experiment.
(b) Change in the soil carbon held in permafrost regions relative to pre-industrial size under the SSP4-6.0-based experiment. Vertical red line
marks the time emissions cease. Grey lines are individual model variants, solid line is the median of the variants, and dashed lines are the 5th
and 95th percentile.

   Figure 7 shows the difference in ZEC between simula-                   and 180 [71 to 354] Pg C have been released under the SSP4-
tions following the A1 (1000 Pg C) tier-1 ZECMIP experi-                  6.0-based experiment compared to 73 [32 to 190] Pg C, 100
ment protocol and the experiment where emissions follow                   [46 to 222] Pg C, and 178 [70 to 346] Pg C under the A1 ex-
historical and SSP4-6.0 emissions until 1000 Pg C of CO2                  periment, respectively. Notably the effect of the thaw-lag di-
has been emitted. In the SSP4-6.0-based experiment ZEC                    minishes with time after emissions cease.
is 0.04 [0 to 0.06] ◦ C, 0.03 [−0.01 to 0.05] ◦ C, and 0.03                  The ZEC for model variants without and with permafrost
[−0.02 to 0.08] ◦ C warmer 50, 100, and 500 years after emis-             carbon for the A3 (2000 Pg C) experiments is shown in Fig. 8.
sion cease, respectively. The slightly larger ZEC is being                Similar to the A1 experiment the existence of a permafrost
driven by additional carbon being released from permafrost                carbon pool adds to the magnitude of ZEC. The difference
soils under the SSP4-6.0-based experiment with 51 [22 to                  between the model versions with and without permafrost car-
132] Pg C released when emissions cease compared to 29 [10                bon is shown in Fig. 5b for the A3 experiment. The differ-
to 90] Pg C in the A1 experiment; 50, 100, and 500 years af-              ence in ZEC 50, 100, and 500 years after emissions cease
ter emissions cease 84 [39 to 204] Pg C, 107 [50 to 230] Pg C,            is 0.06 [0.03 to 0.12] ◦ C, 0.09 [0.05 to 0.18] ◦ C, and 0.24

Biogeosciences, 18, 4937–4952, 2021                                                            https://doi.org/10.5194/bg-18-4937-2021
A. H. MacDougall: ZEC and the permafrost carbon feedback                                                                                   4945

Figure 8. (a, b) Zero Emission Commitment (ZEC) for model versions without (a) and with (b) a permafrost carbon pool forced by the
2000 Pg C A3 experiment. ZEC is temperature change relative to the year emissions cease. (c, d) Change in atmospheric CO2 concentra-
tion relative to year emissions cease for model versions without (c) and with (d) a permafrost carbon pool forced by the A3 (2000 Pg C)
experiment. Grey lines are individual model variants, solid line is the median of the variants, and dashed lines are the 5th and 95th percentile.

[0.11 to 0.50] ◦ C (Table 2), respectively, corresponding to a             pool transformation rate (r = 0.55) have substantial correla-
release of carbon from permafrost soils of 84 [40 to 213] Pg C             tion values. These results contrast those for release of carbon
when emissions cease and 159 [85 to 300] Pg C, 205 [114 to                 from permafrost soils under future scenarios computed by
354] Pg C, and 312 [148 to 505] Pg C 50, 100, and 500 years                MacDougall and Knutti (2016), where both available frac-
after emissions cease (Fig. 6b, Table 2). Consistent with                  tion and equilibrium climate sensitivity played the most im-
previous results that examined representative concentration                portant roles, and the passive pool transformation rate had lit-
pathway scenarios, the temperature effect of the permafrost                tle effect on results. The difference may partly be due to the
carbon cycle feedback is not strongly effected by the total                reduced uncertainty range in equilibrium climate sensitivity
cumulative emissions (e.g. MacDougall et al., 2012; Schnei-                used here. The prominence of the Passive pool transforma-
der von Deimling et al., 2015).                                            tion rate in the A3 experiment results is concerning as this
   To explore which of the perturbed parameters has the                    parameter is the most poorly constrained of all parameters
greatest effect on the anomaly in ZEC created by the inclu-                considered. The available fraction parameter is effectively
sion of permafrost carbon, correlations were computed be-                  the combined size of the fast and slow pools as conceptu-
tween the perturbed parameter values and the anomaly in                    alized in incubation experiments (MacDougall and Knutti,
ZEC 50 years after emissions cease. These correlations are                 2016). Thus these results suggest that increased field sam-
shown in Table 3. For the A1 (1000 Pg C) experiment the                    pling of, and incubation experiments on, permafrost carbon
available fraction parameter has by far the strongest influ-               could substantially reduce the uncertainty in permafrost car-
ence with a correlation of 0.91. None of the other parame-                 bon’s contribution to ZEC.
ters have large correlations. For the A3 (2000 Pg C) experi-
ment both the available fraction (r = 0.64) and the passive

https://doi.org/10.5194/bg-18-4937-2021                                                              Biogeosciences, 18, 4937–4952, 2021
4946                                                               A. H. MacDougall: ZEC and the permafrost carbon feedback

4   Discussion                                                         ESCM (used here) and publicly available 2.10 version of the
                                                                       UVic ESCM do not account for enhanced methane produc-
ZECMIP found that the inter-model range of ZEC 50 years                tion from permafrost thaw. A methane production scheme
after emissions cease for the A1 (1000 Pg C) experiment is             has recently been added to a newly developed thread of the
−0.36 to 0.29 ◦ C with a median value of −0.05 ◦ C (Mac-               model, which preliminarily suggests a warming effect from
Dougall et al., 2020). Thus the additional warming expected            CH4 production from permafrost soils of 0 to 0.24 ◦ C, de-
from the permafrost carbon cycle feedback of 0.06 [0.02 to             pending on parameter values and scenario followed (Nzo-
0.14] ◦ C directly and 0.04 [0 to 0.06] ◦ C from the thaw-lag          tungicimpaye, 2021). Such values are consistent with expert
effect will not substantially change the expected value of             assessment of (Schuur et al., 2015). Accounting for these
ZEC on decadal timescales. Thus, the overall conclusion that           processes will likely increase the estimated effect of the per-
ZEC will be close to zero in the decades following cessation           mafrost carbon cycle feedback on ZEC, and therefore the ef-
of emissions remains unchanged.                                        fect of the permafrost carbon feedback on ZEC should be
   Here we have assessed the parameter uncertainty of the              reassessed when these processes are better accounted for in
permafrost carbon cycle feedback contribution to ZEC and               Earth system models.
have left structural uncertainty unassessed. To quantify struc-           UVic ESCM 2.10 was one of the two models that par-
tural uncertainty other Earth system models would have to              ticipated in ZECMIP that included a permafrost carbon
conduct ZECMIP experiments with and without their per-                 scheme (the other was CESM). The ZEC 50 years after
mafrost components turned on. As many of the models that               CO2 emissions cease for the A1 experiment (1000 Pg C) was
participated in ZECMIP do have permafrost carbon capable               0.03 ◦ C for the model version that participated in ZECMIP
versions of their models (e.g. Burke et al., 2012), such a study       (UVic ESCM 2.10). This value places UVic ESCM close
is possible and would make a valuable contribution to the              to the centre of the inter-model range ranking 8th highest
next iteration of ZECMIP.                                              of the 18 models that participated in ZECMIP (MacDougall
   Here we found that the permafrost carbon feedback contri-           et al., 2020). The model version with permafrost carbon used
bution to ZEC was insensitive to cumulative CO2 emissions,             here ZEC 50 years after emissions cease is −0.02 [−0.07
despite a larger release of CO2 to the atmosphere from per-            to 0.08] ◦ C; 750 years after emission cease ZEC is 0.70
mafrost soils in the A3 (2000 Pg C) experiment. The linear re-         [0.35 to 1.06] ◦ C for the A1 experiment for UVic ESCM
lationship between cumulative emissions of CO2 and global              2.9pf and was 0.20 ◦ C for UVic ESCM 2.10 in MacDougall
temperature change is generated by an atmosphere–ocean                 et al. (2020). Evidently the two model versions have simi-
phenomenon (MacDougall, 2017); thus the atmosphere–                    lar decadal ZEC values but diverge substantially on centen-
ocean system does not distinguish between emissions from               nial timescales. The main difference between UVic ESCM
the terrestrial biosphere and fossil fuel emissions (Simmons           versions 2.9pf and 2.10 is the representation of the ocean
and Matthews, 2016). Therefore this insensitivity of tem-              (Mengis et al., 2020), with the newer version of the model
perature to carbon released from permafrost soils appears              having substantially improved ocean dynamics and a state-
anomalous. However, for intermediate complexity models                 of-the-art representation of ocean biogeochemistry (Mengis
like the UVic ESCM the cumulative emissions of CO2 vs.                 et al., 2020). Ocean heat and carbon uptake are two of the
global temperature change curve are only approximately lin-            processes that determine the value of ZEC (MacDougall
ear and the change in temperature with a unit of CO2 emitted           et al., 2020). Therefore, it is not unexpected that differences
declines at high cumulative emission totals, as the logarith-          in the representation of the ocean would change the ZEC
mic radiative forcing from CO2 begins to become the domi-              value of a model.
nate effect (MacDougall and Friedlingstein, 2015). Thus the
emissions of CO2 from permafrost soil are less effective at
warming after 2000 Pg C of CO2 has been emitted than when              5   Conclusions
1000 Pg C has been emitted in the UVic ESCM. However, it
has been shown the full Earth system models do not have                Here we have used a perturbed parameter ensemble with the
non-linear cumulative emissions of CO2 vs. global temper-              UVic ESCM to estimate the impact of the permafrost carbon
ature change curves (Tokarska et al., 2016). Therefore the             cycle feedback on the value of the CO2 component of the
insensitivity of the permafrost carbon feedback contribution           Zero Emissions Commitment. We find 50 years after emis-
to ZEC to cumulative CO2 emissions found here should be                sions cease in an experiment where 1000 Pg C of CO2 is
treated with caution.                                                  emitted to the atmosphere that the permafrost carbon feed-
   To date no Earth system model (McGuire et al., 2018)                back adds 0.06 [0.02 to 0.14] ◦ C to ZEC, rising to 0.27 [0.12
accounts for abrupt thaw processes in permafrost systems.              to 0.49] ◦ C 500 years after emissions cease. Additionally fol-
These processes, including thermokarst production, active              lowing a more realistic emissions trajectory based on histor-
hill slope erosion, and coastal erosion, could accelerate thaw         ical and SSP4-6.0 emissions adds 0.04 [0 to 0.06] ◦ C to ZEC
processes by 40 % over the next few centuries (Turetsky                50 years after emissions cease. This thaw-lag effect dimin-
et al., 2020). Additionally the 2.9pf version of the UVic              ishes with time after emissions cease. Overall accounting for

Biogeosciences, 18, 4937–4952, 2021                                                      https://doi.org/10.5194/bg-18-4937-2021
A. H. MacDougall: ZEC and the permafrost carbon feedback 4947 the permafrost carbon feedback does not change the conclu- sion that ZEC will be close to zero on decadal timescales (MacDougall et al., 2020), though the effect of abrupt thaw remains unaccounted for and the feedback is of greater con- cern over longer timeframes. https://doi.org/10.5194/bg-18-4937-2021 Biogeosciences, 18, 4937–4952, 2021
4948                                                                 A. H. MacDougall: ZEC and the permafrost carbon feedback

Appendix A: Probability distribution function for
climate sensitivity

The functional form of the climate sensitivity PDF was taken
to be the product of two normal-inverse Gaussian functions
following Olson et al. (2012). The normal-inverse Gaussian
function is as follows:
                p
        αδK1 α δ 2 + (x − µ)2        √
                                        2   2
PDF =          p                   eδ α −β +β(x−µ) , (A1)
                   2
             π δ + (x − µ)   2

where µ is location, α is tail heaviness, β is an asymmetry
parameter, δ is a scale parameter, and K1 is a modified Bessel
function of the third kind (Olson et al., 2012). The Python
scipy.stats software package was used to compute the PDF.
   The new parameter values fitting the PDF to the Sherwood
et al. (2020) constraints on equilibrium climate sensitivity are
shown in Table A1 below.

Table A1. Parameter values for climate sensitivity PDF composed
of the product of two normal-inverse Gaussian (NIG) functions. An
additional scaling parameter of 5.9047 is needed to make the inte-
gral of the PDF 1.

                Parameter    NIG −1      NIG – 2
                α                2.97        2.94
                β                2.90        2.00
                δ                1.11        1.08
                µ                1.78        2.38

Biogeosciences, 18, 4937–4952, 2021                                                     https://doi.org/10.5194/bg-18-4937-2021
A. H. MacDougall: ZEC and the permafrost carbon feedback 4949 Appendix B: Effect of existence of permafrost carbon pool on simulated global climate Figure B1. Simulations of the 1pctCO2 experiment for two versions of the UVic ESCM one with default settings (permafrost carbon) and a second starting from a model spin-up where cryoturbation diffusion parameter has been set to zero, and hence there is no per- mafrost carbon pool. Since the 1pctCO2 is a concentration-driven scenario, the presence or absence of permafrost carbon does not have an effect on the atmospheric carbon pool. https://doi.org/10.5194/bg-18-4937-2021 Biogeosciences, 18, 4937–4952, 2021
4950                                                                     A. H. MacDougall: ZEC and the permafrost carbon feedback

Code availability. UVic ESCM 2.9 and 2.10 are available from                    Model Intercomparison Project Phase 6 (CMIP6) experimen-
http://terra.seos.uvic.ca/model/ (Eby, 2021).                                   tal design and organization, Geosci. Model Dev., 9, 1937–1958,
                                                                                https://doi.org/10.5194/gmd-9-1937-2016, 2016.
                                                                             Forest, C. E., Stone, P. H., Sokolov, A. P., Allen, M. R., and Web-
Data availability. Model output produced for this study is available            ster, M. D.: Quantifying uncertainties in climate system proper-
at https://doi.org/10.5683/SP2/I75BZ0 (MacDougall, 2021).                       ties with the use of recent climate observations, Science, 295,
                                                                                113–117, 2002.
                                                                             Friedlingstein, P., O’Sullivan, M., Jones, M. W., Andrew, R. M.,
Competing interests. The contact author has declared that there are             Hauck, J., Olsen, A., Peters, G. P., Peters, W., Pongratz, J., Sitch,
no competing interests.                                                         S., Le Quéré, C., Canadell, J. G., Ciais, P., Jackson, R. B., Alin,
                                                                                S., Aragão, L. E. O. C., Arneth, A., Arora, V., Bates, N. R.,
                                                                                Becker, M., Benoit-Cattin, A., Bittig, H. C., Bopp, L., Bultan,
                                                                                S., Chandra, N., Chevallier, F., Chini, L. P., Evans, W., Florentie,
Disclaimer. Publisher’s note: Copernicus Publications remains
                                                                                L., Forster, P. M., Gasser, T., Gehlen, M., Gilfillan, D., Gkritza-
neutral with regard to jurisdictional claims in published maps and
                                                                                lis, T., Gregor, L., Gruber, N., Harris, I., Hartung, K., Haverd, V.,
institutional affiliations.
                                                                                Houghton, R. A., Ilyina, T., Jain, A. K., Joetzjer, E., Kadono, K.,
                                                                                Kato, E., Kitidis, V., Korsbakken, J. I., Landschützer, P., Lefèvre,
                                                                                N., Lenton, A., Lienert, S., Liu, Z., Lombardozzi, D., Marland,
Acknowledgements. I am grateful for support from the Natural                    G., Metzl, N., Munro, D. R., Nabel, J. E. M. S., Nakaoka, S.-I.,
Sciences and Engineering Research Council of Canada Discov-                     Niwa, Y., O’Brien, K., Ono, T., Palmer, P. I., Pierrot, D., Poul-
ery Grant program and for computational support from Compute                    ter, B., Resplandy, L., Robertson, E., Rödenbeck, C., Schwinger,
Canada. Chris Jones and Charles Koven provided helpful critiques                J., Séférian, R., Skjelvan, I., Smith, A. J. P., Sutton, A. J., Tan-
of an early draft of the manuscript. I thank the two anonymous re-              hua, T., Tans, P. P., Tian, H., Tilbrook, B., van der Werf, G.,
viewers for their helpful comments.                                             Vuichard, N., Walker, A. P., Wanninkhof, R., Watson, A. J.,
                                                                                Willis, D., Wiltshire, A. J., Yuan, W., Yue, X., and Zaehle, S.:
                                                                                Global Carbon Budget 2020, Earth Syst. Sci. Data, 12, 3269–
Financial support. This research has been supported by the Natural              3340, https://doi.org/10.5194/essd-12-3269-2020, 2020.
Sciences and Engineering Research Council of Canada.                         Fyke, J., Eby, M., Mackintosh, A., and Weaver, A.: Impact of cli-
                                                                                mate sensitivity and polar amplification on projections of Green-
                                                                                land Ice Sheet loss, Clim. Dynam., 43, 2249–2260, 2014.
Review statement. This paper was edited by Alexey V. Eliseev and             Gasser, T., Kechiar, M., Ciais, P., Burke, E., Kleinen, T., Zhu, D.,
reviewed by two anonymous referees.                                             Huang, Y., Ekici, A., and Obersteiner, M.: Path-dependent re-
                                                                                ductions in CO2 emission budgets caused by permafrost carbon
                                                                                release, Nat. Geosci., 11, 830–835, 2018.
                                                                             Hare, B. and Meinshausen, M.: How much warming are we com-
References                                                                      mitted to and how much can be avoided?, Climatic Change, 75,
                                                                                111–149, 2006.
Archer, D.: A data-driven model of the global calcite lysocline,             Hugelius, G., Strauss, J., Zubrzycki, S., Harden, J. W., Schuur, E.
  Global Biogeochem. Cy., 10, 511–526, 1996.                                    A. G., Ping, C.-L., Schirrmeister, L., Grosse, G., Michaelson, G.
Avis, C. A.: Simulating the present-day and future distribution of              J., Koven, C. D., O’Donnell, J. A., Elberling, B., Mishra, U.,
  permafrost in the UVic Earth system climate model, PhD thesis,                Camill, P., Yu, Z., Palmtag, J., and Kuhry, P.: Estimated stocks
  University of Victoria, 2012.                                                 of circumpolar permafrost carbon with quantified uncertainty
Avis, C. A., Weaver, A. J., and Meissner, K. J.: Reduction in areal             ranges and identified data gaps, Biogeosciences, 11, 6573–6593,
  extent of high–latitude wetlands in response to permafrost thaw,              https://doi.org/10.5194/bg-11-6573-2014, 2014.
  Nat. Geosci., 4, 444–448, https://doi.org/10.1038/ngeo1160,                Jones, C. D., Frölicher, T. L., Koven, C., MacDougall, A. H.,
  2011.                                                                         Matthews, H. D., Zickfeld, K., Rogelj, J., Tokarska, K. B.,
Burke, E. J., Hartley, I. P., and Jones, C. D.: Uncertainties                   Gillett, N. P., Ilyina, T., Meinshausen, M., Mengis, N., Séférian,
  in the global temperature change caused by carbon release                     R., Eby, M., and Burger, F. A.: The Zero Emissions Com-
  from permafrost thawing, The Cryosphere, 6, 1063–1076,                        mitment Model Intercomparison Project (ZECMIP) contribu-
  https://doi.org/10.5194/tc-6-1063-2012, 2012.                                 tion to C4MIP: quantifying committed climate changes follow-
Cox, P. M., Betts, R. A., Jones, C. D., Spall, S. A., and Totter-               ing zero carbon emissions, Geosci. Model Dev., 12, 4375–4385,
  dell, I. J.: Modelling vegetation and the carbon cycle as interac-            https://doi.org/10.5194/gmd-12-4375-2019, 2019.
  tive elements of the climate system, Proceedings of the RMS mil-           Koven, C., Friedlingstein, P., Ciais, P., Khvorostyanov, D., Krin-
  lennium conference, available at: http://terra.seos.uvic.ca/model/            ner, G., and Tarnocai, C.: On the formation of high-latitude soil
  common/HCTN_23.pdf (last access: 8 September 2021), 2001.                     carbon stocks: Effects of cryoturbation and insulation by organic
Eby, M.: Earth System Climate Model UVic ESCM, SEOS                             matter in a land surface model, Geophys. Res. Lett., 36, L21501,
  [code], available at: http://terra.seos.uvic.ca/model/, last access:          https://doi.org/10.1029/2009GL040150, 2009.
  7 September 2021.
Eyring, V., Bony, S., Meehl, G. A., Senior, C. A., Stevens, B.,
  Stouffer, R. J., and Taylor, K. E.: Overview of the Coupled

Biogeosciences, 18, 4937–4952, 2021                                                               https://doi.org/10.5194/bg-18-4937-2021
A. H. MacDougall: ZEC and the permafrost carbon feedback 4951
MacDougall, A. H.: The oceanic origin of path- Nzotungicimpaye, C. M.: Investigating the importance of methane
independent carbon budgets, Sci. Rep.-UK, 7, 10373, for future climate change: wetland methane emissions, the per-
https://doi.org/10.1038/s41598-017-10557-x, 2017. mafrost carbon feedback, and methane mitigation, PhD thesis,
MacDougall, A. H.: Limitations of the 1 % experiment as Simon Fraser University, Vancouver, Canada, 2021.
the benchmark idealized experiment for carbon cycle inter- Olson, R., Sriver, R., Goes, M., Urban, N. M., Matthews, H. D.,
comparison in C4 MIP, Geosci. Model Dev., 12, 597–611, Haran, M., and Keller, K.: A climate sensitivity estimate
https://doi.org/10.5194/gmd-12-597-2019, 2019. using Bayesian fusion of instrumental observations and an
MacDougall, A. H.: Estimated effect of the permafrost car- Earth System model, J. Geophys. Res.-Atmos., 117, D04103,
bon feedback on the zero emissions commitment to cli- https://doi.org/10.1029/2011JD016620, 2012.
mate change, Scholars Portal Dataverse [data set], V3, O’Neill, B. C., Kriegler, E., Ebi, K. L., Kemp-Benedict, E., Ri-
https://doi.org/10.5683/SP2/I75BZ0, last access: 7 September ahi, K., Rothman, D. S., van Ruijven, B. J., van Vuuren, D. P.,
2021. Birkmann, J., Kok, K., Levy, M., and Soleckim, W.: The roads
MacDougall, A. H. and Friedlingstein, P.: The origin and lim- ahead: Narratives for shared socioeconomic pathways describ-
its of the near proportionality between climate warming ing world futures in the 21st century, Global Environ. Chang.,
and cumulative CO2 emissions, J. Climate, 28, 4217–4230, 42, 169–180, 2017.
https://doi.org/10.1175/JCLI-D-12-00751.1, 2015. Rogelj, J., Shindell, D., Jiang, K., Fifita, S., Forster, P.,
MacDougall, A. H. and Knutti, R.: Projecting the release of car- Ginzburg, V., Handa, C., Kheshgi, H., Kobayashi, S.,
bon from permafrost soils using a perturbed parameter en- Kriegler, E., Mundaca, L., Seferian, R., and Vilarino, M. V.: Mit-
semble modelling approach, Biogeosciences, 13, 2123–2136, igation pathways compatible with 1.5 ◦ C in the context of sus-
https://doi.org/10.5194/bg-13-2123-2016, 2016. tainable development, in: Global warming of 1.5 ◦ C. An IPCC
MacDougall, A. H., Avis, C. A., and Weaver, A. J.: Sig- Special Report on the impacts of global warming of 1.5 ◦ C above
nificant existing commitment to warming from the per- pre-industrial levels and related global greenhouse gas emission
mafrost carbon feedback, Nat. Geosci., 5, 719–721, pathways, in the context of strengthening the global response to
https://doi.org/10.1038/NGEO1573, 2012. the threat of climate change, sustainable development, and ef-
MacDougall, A. H., Frölicher, T. L., Jones, C. D., Rogelj, J., forts to eradicate poverty, World Meteorological Organization,
Matthews, H. D., Zickfeld, K., Arora, V. K., Barrett, N. J., Geneva Switzerland, 2018.
Brovkin, V., Burger, F. A., Eby, M., Eliseev, A. V., Ha- Schädel, C., Schuur, E. A., Bracho, R., Elberling, B., Knoblauch, C.,
jima, T., Holden, P. B., Jeltsch-Thömmes, A., Koven, C., Lee, H., Luo, Y., Shaver, G. R., and Turetsky, M. R.: Circumpo-
Mengis, N., Menviel, L., Michou, M., Mokhov, I. I., Oka, A., lar assessment of permafrost C quality and its vulnerability over
Schwinger, J., Séférian, R., Shaffer, G., Sokolov, A., Tachiiri, time using long-term incubation data, Glob. Change Biol., 20,
K., Tjiputra, J., Wiltshire, A., and Ziehn, T.: Is there warm- 641–652, 2014.
ing in the pipeline? A multi-model analysis of the Zero Emis- Schmittner, A., Oschlies, A., Matthews, H. D., and Galbraith, E. D.:
sions Commitment from CO2, Biogeosciences, 17, 2987–3016, Future changes in climate, ocean circulation, ecosystems, and
https://doi.org/10.5194/bg-17-2987-2020, 2020. biogeochemical cycling simulated for a business-as-usual CO2
Matthews, H. D., Tokarska, K. B., Rogelj, J., Smith, C. J., emission scenario until year 4000 AD, Global Biogeochem. Cy.,
MacDougall, A. H., Haustein, K., Mengis, N., Sippel, S., 22, GB1013, https://doi.org/10.1029/2007GB002953, 2008.
Forster, P. M., and Knutti, R.: An integrated approach to quan- Schneider von Deimling, T., Grosse, G., Strauss, J., Schirrmeister,
tifying uncertainties in the remaining carbon budget, Communi- L., Morgenstern, A., Schaphoff, S., Meinshausen, M., and Boike,
cations Earth and Environment, 2, 1–11, 2021. J.: Observation-based modelling of permafrost carbon fluxes
McGuire, A. D., Lawrence, D. M., Koven, C., Clein, J. S., Burke, E., with accounting for deep carbon deposits and thermokarst activ-
Chen, G., Jafarov, E., MacDougall, A. H., Marchenko, S., ity, Biogeosciences, 12, 3469–3488, https://doi.org/10.5194/bg-
Nicolsky, D., Peng, S., Rinke, A., Ciais, P., Gouttevin, I., 12-3469-2015, 2015.
Hayesf, D. J., Jin, D., Krinner, G., Mooren, J. C., Ro- Schuur, E., McGuire, A., Schädel, C., Grosse, G., Harden, J.,
manovsky, V., Schädel, C., Schaefer, K., Schuurt, E. A. G., Hayes, D., Hugelius, G., Koven, C., Kuhry, P., Lawrence, D., Na-
and Zhuang, Q.: Dependence of the evolution of carbon dy- tali, S. M., Olefeldt, D., Romanovsky, V. E., Schaefer, K., Turet-
namics in the northern permafrost region on the trajectory of sky, M. R., Treat, C. C., and Vonk, J. E.: Climate change and the
climate change, P. Natl. Acad. Sci. USA, 115, 201719903, permafrost carbon feedback, Nature, 520, 171–179, 2015.
https://doi.org/10.1073/pnas.1719903115, 2018. Sherwood, S., Webb, M. J., Annan, J. D., Armour, K., Forster, P. M.,
Meissner, K. J., Weaver, A. J., Matthews, H. D., and Cox, P. M.: Hargreaves, J. C., Hegerl, G., Klein, S. A., Marvel, K. D.,
The role of land–surface dynamics in glacial inception: A study Rohling, E. J., Watanabe, M., Andrews, T., Braconnot, P.,
with the UVic Earth System Model, Clim. Dynam., 21, 515–537, Bretherton, C., Foster, G., Hausfather, Z., von der Heydt, A.,
2003. Knutti, R., Mauritsen, T., Norris, J., Proistosescu, C., Rugen-
Mengis, N., Keller, D. P., MacDougall, A. H., Eby, M., Wright, stein, M., Schmidt, G., Tokarska, K., and Zelinka, M.: An as-
N., Meissner, K. J., Oschlies, A., Schmittner, A., MacIsaac, sessment of Earth’s climate sensitivity using multiple lines of
A. J., Matthews, H. D., and Zickfeld, K.: Evaluation of the evidence, Rev. Geophys., 58, e2019RG000678, 2020.
University of Victoria Earth System Climate Model version Simmons, C. and Matthews, H.: Assessing the implications of hu-
2.10 (UVic ESCM 2.10), Geosci. Model Dev., 13, 4183–4204, man land-use change for the transient climate response to cu-
https://doi.org/10.5194/gmd-13-4183-2020, 2020. mulative carbon emissions, Environ. Res. Lett., 11, 035001,
https://doi.org/10.1088/1748-9326/11/3/035001, 2016.
https://doi.org/10.5194/bg-18-4937-2021 Biogeosciences, 18, 4937–4952, 20214952 A. H. MacDougall: ZEC and the permafrost carbon feedback Smith, L.: Chaos: a very short introduction, Oxford University United Nations: Paris Agreement: Twenty-first conference of the Press, London, United Kingdom, 2007. parties of the United Nations Framework Convention on Climate Tokarska, K. B., Gillett, N. P., J.Weaver, A., Arora, V. K., Change, United Nations, Geneva, Switzerland, 2015. and Eby, M.: The climate response to five trillion Weaver, A. J., Eby, M., Wiebe, E. C., ans P. B. Duffy, C. M. B., tonnes of carbon, Nat. Clim. Change, 6, 851–855, Ewen, T. L., Fanning, A. F., Holland, M. M., MacFadyen, A., https://doi.org/10.1038/NCLIMATE3036, 2016. Matthews, H. D., Meissner, K. J., Saenko, O., Schmittner, A., Trumbore, S.: Age of soil organic matter and soil respiration: radio- Wang, H., and Yoshimori, M.: The UVic Earth System Climate carbon constraints on belowground C dynamics, Ecol. Appl., 10, Model: Model description, climatology, and applications to past, 399–411, 2000. present and future climates, Atmos. Ocean, 39, 1–67, 2001. Turetsky, M. R., Abbott, B. W., Jones, M. C., Anthony, K. W., Ole- Zickfeld, K., Eby, M., Matthews, H. D., and Weaver, A. J.: Setting feldt, D., Schuur, E. A., Grosse, G., Kuhry, P., Hugelius, G., cumulative emissions targets to reduce the risk of dangerous cli- Koven, C., Lawrence, D. M., Gibson, C., Sannel, A. B. K., and mate change, P. Natl. Acad. Sci. USA, 106, 16129–16134, 2009. McGuire, A. D.: Carbon release through abrupt permafrost thaw, Nat. Geosci., 13, 138–143, 2020. Biogeosciences, 18, 4937–4952, 2021 https://doi.org/10.5194/bg-18-4937-2021
You can also read


