Hoop Screens: Why is a basketball model also best for predicting the box office? - By Ari Levin Advisor Gaston Illanes
←
→
Page content transcription
If your browser does not render page correctly, please read the page content below
Hoop Screens: Why is a basketball model

 also best for predicting the box office?

 By Ari Levin

 Advisor Gaston Illanes

 Northwestern University Mathematical Methods in the Social Sciences

 Senior Thesis Spring 2019
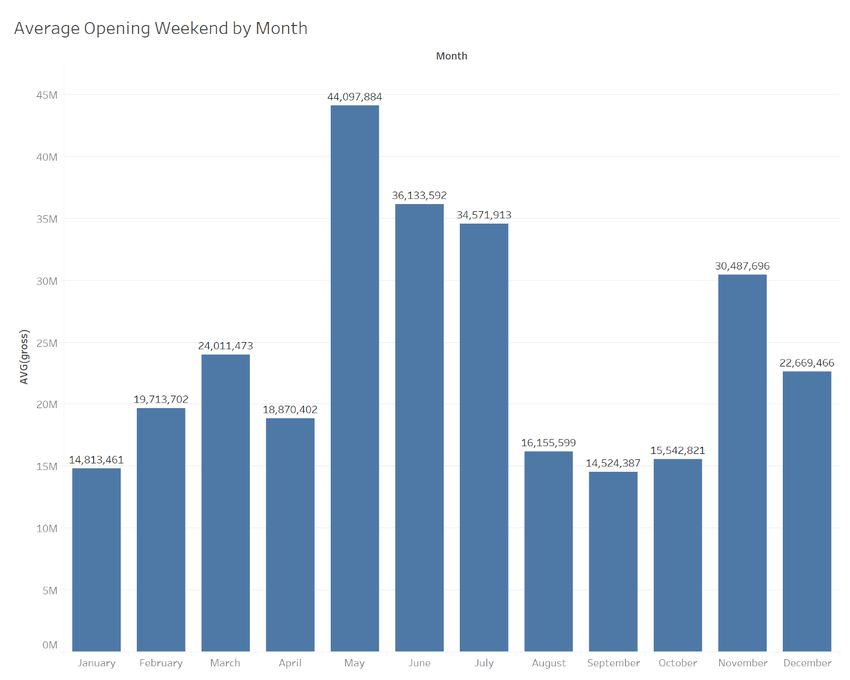
Table of Contents

 Acknowledgements ..................................................................................................................... 3

 Introduction ................................................................................................................................. 3

 Literature Review ........................................................................................................................ 4

 Data ............................................................................................................................................. 8

 Industry Background ................................................................................................................... 8

 Jurassic World: Fallen Kingdom: Profile of a Blockbuster ..................................................... 9

 Limited releases ..................................................................................................................... 18

 Miscellaneous ........................................................................................................................ 21

 Methods ..................................................................................................................................... 22

 Results ....................................................................................................................................... 26

 Discussion ................................................................................................................................. 29

 Conclusion................................................................................................................................. 36

 References ................................................................................................................................. 38

 Appendices ................................................................................................................................ 40

 Appendix A: Variables .......................................................................................................... 40

 Appendix B: Data Eliminated................................................................................................ 42

 Appendix C: Interactions Tested ........................................................................................... 43

 Appendix D: .Do File ............................................................................................................ 44

 Appendix E: CARMELO Example from FiveThirtyEight.................................................... 46

 2
Acknowledgements

This project would not have been possible without the help and support of so many people, some

of whom I will undoubtedly miss in this paragraph. First, I must thank Gaston Illanes, who was

the perfect choice as a thesis advisor. Prof. Illanes was always willing to help, and he knew

exactly what I wanted to do and what models I should run. I would also like to thank Professor

Joseph Ferrie for organizing the thesis seminar. Thanks to Nicole Schneider, MMSS Program

Coordinator, for her administrative support and for keeping the MMSS Lounge open for an

unreasonable number of hours, and to Prof. Jeff Ely for leading the MMSS program for my four

years. Thanks so much to all the professors in both MMSS and in other departments who taught

me all the skills I used in this analysis. I would like to specifically acknowledge John Meehan

and Pete Johnson for their help in collecting and organizing the data I needed. Thanks to all of

my friends who helped with this study with their input, support, advice and ideas. Finally, this

would not have been possible without the unwavering love and support from my amazing family.

Introduction

In this paper, we build a predictive model for estimating the domestic opening weekend box

office of wide release movies. The study analyzes which type of model works best, how accurate

such a model can predict, and how it compares to industry professionals. Many different models

were built and tested in this study. Of these, the most effective is an adaptation of

FiveThirtyEight’s CARMELO model of predicting basketball players. That model generates a

prediction by taking a weighted average of the most similar movies/players in the data set.

 3
The prediction model is tested on every movie released nationwide in 2018. We then analyze

places where the model was accurate and places where it missed to learn about how such a

model can be useful and why it may struggle. The CARMELO model generated an R2 of 0.80

between the predicted and actual opening weekend gross of 2018 films. However, the predictions

by forecasting website BoxOffice Pro generated an R2 of 0.97 for 2018 films, outperforming any

model tested. One struggle for the model is predicting “first-of-its-kind” movies that do not have

good priors for comparisons. It also struggles to predict movies with a high potential variance

and cannot predict which movies reach the high end of their range. The model does not consider

data such as ticket presales that are not publicly available but are used by industry experts. The

model does, however, succeed in creating an accurate list of similar movies in most instances.

To test different models, this study breaks down the prediction model into three parts: defining

closest comparisons, finding the right number of comparisons, and using those comparisons to

make a prediction. The best combination of those three factors constitutes the best model.

Literature Review

Box office analysis, predicting or studying the gross of films during their theater release, can

lead to novel studies because a large amount of data exists relative to the analysis that has been

conducted. Box Office Mojo publishes the daily domestic gross for every film and has an archive

dating back through 2002 for single days and through 1982 for weekends, along with

characteristics for each film. Every film has unique characteristics, both quantitative and

qualitative, that can be used in modeling. The box office landscape changes quickly over time,

 4
due to inflation and changes in consumption patterns, so it is important to continually update old

studies and to weigh recent data heavily.

Previous studies have attempted to see whether a model could predict box office performance.

Some of those studies focus on a specific model, and do not attempt to find the best one. Others

determine which factors are important to box office.

Basuroy, Chatterjee and Ravid (2003) ask, “How critical are critical reviews?” To answer, they

take a random sample of 175 films released between 1991-93, 10 years before the study was

published, and use the reviews of popular move critics Gene Siskel and Roger Ebert. They

expect to see a negativity bias, where bad reviews hurt more than good ones help, and find this to

be true. They also find that the impact of negative reviews diminishes over time, but the impact

of positive reviews does not, suggesting “momentum” generated through positive reviews as an

important factor. They also note that big budgets and A-list actors blunt the impact of bad

reviews.

Their study is important but limited. With social media playing such an important role in the

modern film industry, celebrity film critics like Ebert and Siskel are not as important.

Furthermore, as to which the study briefly points, the set of movies that Ebert and Siskel review

may not be a complete set and may expose the study to selection biases.

Liu (2006) analyzed the impact of word of mouth (WOM) on box office revenue. The study used

Yahoo Movies message boards to analyze the valence (whether the tone is positive and negative)

and volume of a movie’s online discussion. The broader purpose is to use box office as a proxy

to analyze the performance of a new product. Liu finds that WOM has an impact on gross and

that volume is more important than valence.

 5
However, this study has some issues that could hurt its accuracy or relevance. Most importantly,

the study limits WOM analysis to internet discussion on a specific site. This likely presents a

biased sample of the movie consumer base, especially considering that internet use in the United

States in 2002 was just 59% of the population, compared to 75% in 2017 (World Bank). The

study only considers movies released in Summer 2002, which introduces several potential biases.

There is a selection bias, as studios decide which movies to release in summer or other seasons,

and anticipated reception might be a factor. There is a small data size, with only 40 movies

studied. Given that, the introduction of a single outlier could change the study. Spider-Man was

released in May 2002 and was the highest opening weekend in history until July 2006, the type

of outlier that could hurt the study.

Additionally, the study presents volume and valence as separate categories, but it is possible or

perhaps likely that they interact. Finally, this study is from 2006, and uses 2002 as the data set.

The industry has seen so many changes since then that the study may not apply today when

making a prediction. The box office industry has seen a massive shift towards an emphasis on

opening weekend (with a steep decline afterwards), and social media is now the primary carrier

of WOM and likely features a different demographic than early movie forums.

Similar to Liu’s study, Du, Xu and Huang (2014) use social media and microblogs to predict box

office in China. They again try to calculate valence for microblogs on the Chinese website

Tencent Microblog. They find a strong relationship, more predictive than a linear model. The

study is limited to predicting the third week gross after two weeks of gross are already observed.

They do not predict opening weekend.

Again, there is an issue of selection bias related to the demographics of an internet message

board. Both of these studies could have used a user-aggregated review website, such as IMDB or

 6
Rotten Tomatoes, as a proxy for WOM instead of worrying about defining valence on message

boards, a difficult task.

Sawhney and Eliashberg (1996) presents a parsimonious forecasting model. The stated intention

is to help theater managers choose which movies to screen. The model, even with its simplicity,

is fairly accurate. It determines what type of model to use to predict future weeks. However, it

relies largely on prior data points to predict the total gross, rather than predicting week-by-week,

which may be more helpful to a theater manager. The opening weekend predictions (t=0) has an

average error of 71.1%.

This model is promising but dated. The study includes 111 movies from 1992. The biggest

opening weekend from that year (Batman Returns) even adjusted for inflation was just 27.8% of

Avengers: Endgame in 2019.

A consistent drawback with the existing literature is that the box office landscape changes so

rapidly that analysis from more than 10 years ago may no longer be relevant. For example, Liu

uses Yahoo Movies forums, which has long since disappeared. Liu also concludes that word-of-

mouth valence declines post-release; this may no longer be true with internet message boards

replaced by social media. Just as one example of the fast changes, (see Description for more)

before 2009, the highest opening weekend in April was $42,220,847. In April 2019, Avengers:

Endgame grossed $357,115,007 opening weekend. Furthermore, many of the studies use small

sample sizes.

Most importantly, none of the studies directly predict opening weekend gross. This study will

use opening weekend box office as a way to test model accuracy compared to human

performance. Instead of limiting to a specific type of model, this study analyzes several

possibilities and compares their performance.

 7
Data

The data set contained, at the start, the top 200 movies by total domestic box office for every

year from 2006-2018 for 2,600 movies. The data set used data from Box Office Mojo, which is

owned by IMDB and contains box office data and some descriptive variables for every major

release. More descriptive variables were scraped from the OMDB API. Films were connected by

title and release date to the API, and when the title did not match, the IMDB link was inputted by

hand. Variables used in the regression were release date, theater count, runtime, genre, studio,

rating, reviews, and indicators for whether the movie was a rerelease or a sequel (Appendix A).

Every limited release was cut out of the data set. Only movies that played in at least 1,000

theaters for their opening weekend were used for the analysis. There were 1,695 films that fit

these criteria. For the sake of conformity in the dataset, a few odd movies were eliminated from

the analysis (Appendix B). That left 1,686 movies for the analysis, each with 20 different

variables or observations and 42 different regressors (year was not used as a regressor.)

Industry Background

The 2018 domestic box office total ran over $11.8 billion, a new record for a single year. (Unless

otherwise specified, all data is from Box Office Mojo.) The box office business is as booming as

ever. As for specific movies, Black Panther and Avengers: Infinity War rank third and fourth on

the all-time box office list as of April 2019. But 2018 also had its share of box office busts,

including Solo: A Star Wars Story and Nutcracker and the Four Realms.

 8
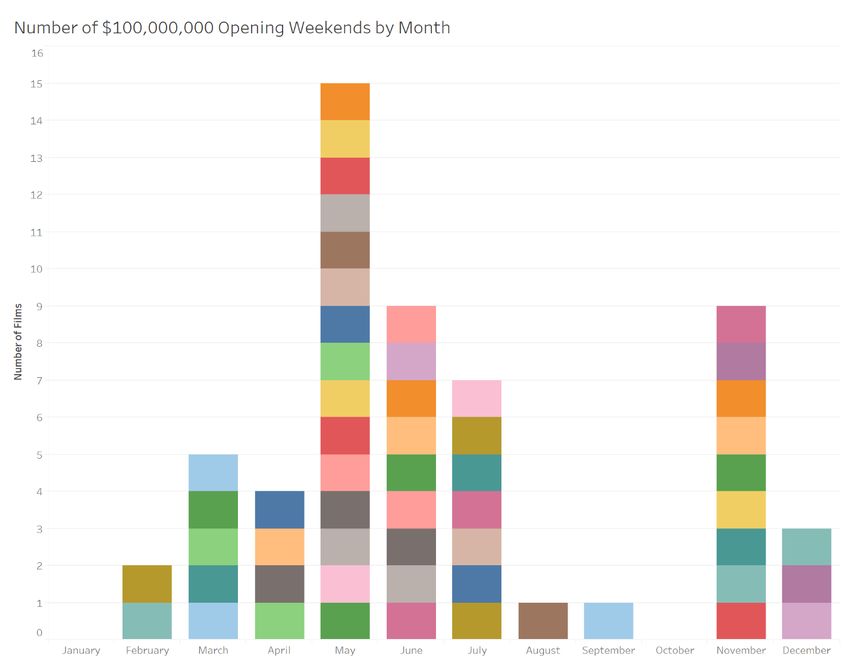
The analysis both in this section and the rest of the paper will be limited to domestic

performance instead of worldwide gross. The data is much more robust, and there is a strong

correlation from domestic to worldwide box office.

Jurassic World: Fallen Kingdom: Profile of a Blockbuster

A specific example will help illustrate how most movies perform at the box office.

Jurassic World: Fallen Kingdom was one of the biggest movies of 2018. It made a total of $417

million domestically, good for fourth that year, and $1.3 billion worldwide, third for the year.

It was a sequel to the incredibly successful Jurassic World, a reboot of the famous Jurassic Park

franchise. Overall, Jurassic World: Fallen Kingdom was the fifth Jurassic World installment.

Three of the movies in the series broke records. So, it was likely an easy decision to make

another one. In fact, Jurassic World 3 is already in the works.

Release Date

Jurassic World: Fallen Kingdom was released on June 22, 2018 in the United States. This is 10

days later on the calendar than Jurassic World released. The date was announced by Universal

Studios executives during the second weekend of its predecessor, and never moved in the three-

year span, even though it is not uncommon for films to change their release date.

June is the second-most common month (Figure 1) for a release with an opening weekend over

$100 million, behind May. The phrase “summer blockbuster” rings true in the box office

industry. A June release capitalizes on families on vacation, kids out of school and warm weather

to maximize gross, especially early in the run.

 9
Figure 1: Number of opening weekends above $100 million, by month, all time through April 2019

Jurassic World: Fallen Kingdom was released on the fourth Friday in June. Almost every movie

is released on a Friday, or a Wednesday of a holiday weekend. Of the movies in the data set,

87% had a Friday release date, and 9% on Wednesday.

Jurassic World in 2015 was released on June 12. That release date put Father’s Day on the

second weekend of its release. All holidays affect the box office in ways that depend on the

importance of the holiday. Father’s Day gives a boost to movies like Jurassic World that appeal

to an older male demographic. On that Sunday, Jurassic World grossed 21% more than would

have been expected given the Saturday-to-Sunday drop percentage from the following weekend.

 10
Jurassic World: Fallen Kingdom, however, released the week after Father’s Day. The likely

reason for that is the previous week was already taken, by Incredibles 2, which was, as expected,

another of the biggest grossers in history ($182 million opening weekend ranks #9 through April

2019.) Universal could release their movie the same weekend if they chose. But every studio

likes to avoid competition when possible. However, Jurassic World: Fallen Kingdom’s opening

still had competition from the second weekend of Incredibles 2, which grossed $80.3 million.

Figure 2: Average opening weekend gross of wide releases by month of release, 2006-2018. Early summer movies tend to gross
 more than the rest of the year. Early winter and late summer are the least active periods.

 11
Opening Weekend

For the week of June 22-28, Jurassic World: Fallen Kingdom played in 4,475 theaters, at the

time the second-highest number. The widest releases in terms of theater count are all summer

movies because some theaters close in the winter. Traditional theater contracts are two weeks

(though some are three or even four) for a new release, meaning that the theater can’t drop the

movie after the first week. However, 10 theaters added Jurassic World: Fallen Kingdom for the

second weekend, giving it 4,485.

The movie made $148,024,610 in its opening weekend, which charts as the 22nd-highest recorded

through April 2019. However, that is over $60 million less, and 29% below 2015’s Jurassic

World. That performance disappointed, but did not surprise studio executives and industry

analysts, such as Box Office Pro, who predicted an opening weekend of $129 million.

The decline was largely consistent throughout the weekend. The Friday total was 28.5% less than

Jurassic World’s, 28.6% on Saturday, and 30.5% on Sunday; it is unclear why the Sunday was

smaller for the second weekend. One idea is that the first weekend featured more sellouts early in

the weekend, pushing people who had planned to go Friday or Saturday to Sunday instead.

 12
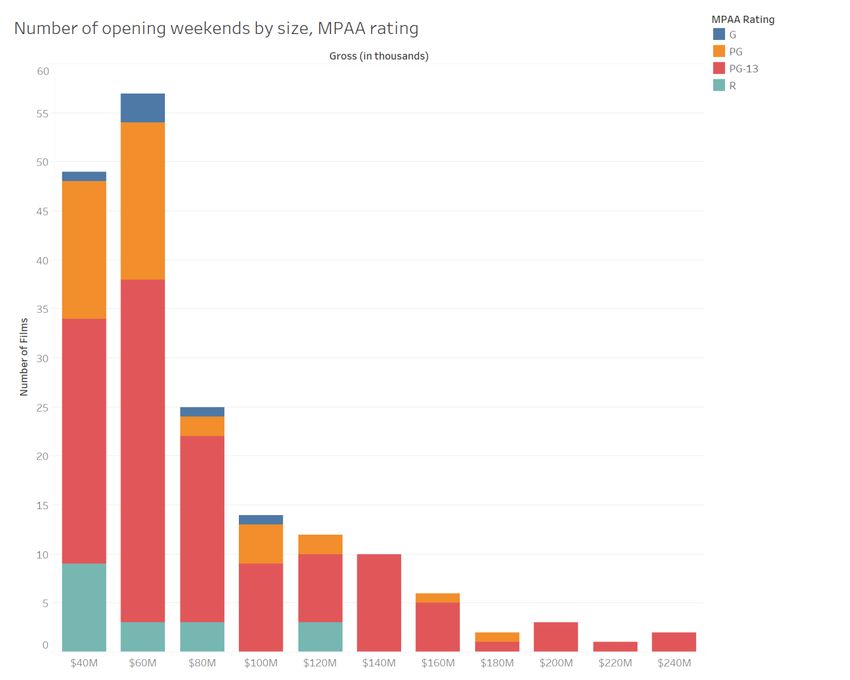
Figure 3: Number of movies by opening weekend gross, $40MM+, layered by MPAA rating, 2006-2018. PG-13 is the most
 common rating for the biggest releases.

The Weekdays

The majority of the box office is collected on the weekends, but the week days make up a

significant portion. That percentage varies by genre (Figure 4) and by season. Family movies

outside of the summer see a smaller proportion during the week, because the audience is usually

in school. Jurassic World: Fallen Kingdom grossed $204,787,335 its first week, 28% coming

Monday-Thursday.

 13
Figure 4: By genre, the average percent of weekly gross for each day of the week

Jurassic World: Fallen Kingdom decreased by 63% on its first Monday from the day before but

increased by 25% on Tuesday. Tuesday is the busiest of the week days and is a discount day at

many theater chains.

Jurassic World: Fallen Kingdom’s second Wednesday was July 4. Independence Day appears to

boost box office totals when it falls during the week but hurts them when it’s during a weekend.

Because of the dominant nature of the weekend in the box office, our analysis will focus

exclusively on weekends, unless noted otherwise. The weekday gross can be predicted quite

easily from the weekend that precedes it.

 14
Week 2

Jurassic World: Fallen Kingdom declined by 58.8% on its second weekend. There’s a very slight

inverse relationship between opening weekend and second weekend drop (R 2=0.0043, p =

0.0064), but there’s many other factors. Notably, Jurassic World dropped just 49%; some of that

can be attributed to Father’s Day.

The week-to-week declines were 70.3% for Friday, 52.1% for Saturday, and 50.4% for Sunday.

Friday is almost always the highest for the second weekend unless some other factor is involved

(usually a holiday).

For many movies, Friday is the biggest day of the opening week, because it is opening day, but

for every subsequent week, Saturday is the highest. That was true for Jurassic World: Fallen

Kingdom for every week of its release except over Labor Day (see: Last Weeks) when Sunday

was 3.1% higher than Saturday.

 15
Figure 5: Average percentage drop from prior weekend, by week of release and genre, for movies released in and currently
 playing in 1,000+ theaters that did not increase theater count. Bubble sizes is number of movies, color is genre. Most movies
 decline between 30% and 60% each weekend.

Next weeks

Sometimes, week three represents a big drop off because of the way theater contracts are

structured, as discussed earlier. With Jurassic World: Fallen Kingdom’s nine-figure opening

weekend, though, there was no worry about that. The film lost just 136 theaters from the

preceding week, playing in 4,349 theaters, the most of any film that week.

In week three, Jurassic World: Fallen Kingdom grossed $28.6 million. The 53% decline was a

smaller drop than the previous week. That weekend, Jurassic World: Fallen Kingdom ranked

 16
second at the box office, behind the new release of Ant-Man and the Wasp, and barely ahead of

Incredibles 2. The next week, it fell behind Incredibles 2 and two new releases for fifth place.

Over the new few weeks, Jurassic World: Fallen Kingdom’s drop began to stabilize, at 43.4%,

30.5%, 40.3% and 41.2% as it crossed $400 million total, just the 33rd movie to do so.

For a big movie like Jurassic World: Fallen Kingdom, in the middle weeks the decline can

become stable and predictable through the week. For instance, the week of July 16-22, Monday-

Sunday, the drops looked like this: 30.6%, 39.3%, 38.0%, 35.1%, 34.2%, 30.9%, 26.4%. In this

time, the Monday-Thursday numbers are both representative of the prior weekend and possess

predictive value for the next week.

Later weeks

There is a strong relationship between the opening weekend and the number of weeks for which

a film is viable. While a big opening weekend usually leads to a big week two drop, the drops

will decline to an extent as the film keeps popularity and stays nationwide in theaters, often

playing for months. Jurassic World: Fallen Kingdom made over $1 million, played in over 800

theaters, and ranked in the top 15 for each of its first nine weekends.

In week 11, Labor Day weekend, the film increased from 608 to 1,556 theaters and doubled its

gross to $1.5 million. Labor Day is a popular time for studios to give a last-ditch effort to

promote their summer hits. That same weekend, Incredibles 2 bumped from 1,060 to 2,890

theaters. The previous year, Pixar’s Cars 3 increased from 214 to 2,445 theaters over Labor Day

and increased its gross tenfold while pushing across $150 million total.

 17
The end

Different studios have different practices on how to report gross in later weeks. The movie will

generally end up in “dollar theaters” for some time. In later weeks, a movie can be making

money in theaters, but the gross is not reported because it is not significant enough to matter.

Jurassic World: Fallen Kingdom reported a total of 15 weeks, ending on October 4.

The last reported weekend was $114,505 in 162 theaters. The last day, a Thursday, it reported

$9,380. That same weekend, though, Deadpool 2, a May release from 20 th Century Fox, reported

a gross of $2,438 in five theaters, illustrating the difference in reporting strategies. Unlike

Universal, Fox reported weekends and weekly gross for the last few weeks but did not report

daily grosses beginning on September 20.

In total, Jurassic World: Fallen Kingdom grossed $417,719,760 domestically, and

$1,309,484,461 worldwide on a $170 million budget. Not as much as its predecessor, which

made over $1.6 billion, but more than enough to turn a profit.

Universal plans to release Jurassic World 3 on June 11, 2021

Limited releases

Not all movies follow the same pattern of Jurassic World: Fallen Kingdom. The complement to

the wide release is the limited (or platform) release. A limited release starts its run in,

depending on the definition, usually less than 1,000 theaters nationwide, generally in select

markets. Some start in as few as four theaters limited to New York and Los Angeles. A limited

release might be advertised as “in select theaters.”

 18
After its opening weekend, the film is played in more theaters the following week. Depending on

its success, it can keep expanding until it is eventually widened nationwide. Roughly one-fourth

of the movies in this data set are limited releases (Figure 6).

 Figure 6: Number of movies released 2006-18 in selected theater count ranges which ended in the yearly top 200.

For any study of limited release films, the selection bias will be extreme:

 • While the list of Top 200 movies from each year contains nearly every wide release,

 success or fail, it contains a very small number of limited releases.

 • The film often premieres at a film festival before a distributor buys it, meaning that a

 study of distributors or studios will confound with the film’s perceived quality and

 viability.

 19
• The more successful the first weeks, the more theaters a film will open to in later in

 weeks, confounding the early and late success of the film.

 • Limited releases usually play early in small markets, or markets targeted to the film,

 confounding regional and nationwide appeal.

 • Any list of top grossing movies will only select the limited release films that succeed the

 most.

Limited release films have, on average, different characteristics from wide releases. They are

more likely to be dramas or documentaries and are more often targeted towards urban markets

and to an older population. And they almost always have a smaller budget. They are also more

likely to be better reviewed than wide releases.

Limited release is a popular strategy for films hoping to win awards. Of the nine Academy

Award for Best Picture nominees from 2017, seven began as a limited release, while all reached

at least 900 theaters at one point in their run.

Especially those who are seeking Oscars, limited releases are more common during the fall or

early winter, with the idea that they will be fresh in academy members’ minds. All seven of those

limited release nominees began their run in November or December. (This analysis does not

consider whether that strategy is effective for winning Oscars or getting bigger gross.) However,

there are limited releases year-round.

There are also certain studios that specialize in limited releases, including Focus Features, Fox

Searchlight, and more recently A24. Those studios are sometimes consistent with themselves on

their release patterns and know how to best execute their strategy.

 20
An extreme example of the limited release strategy is the 2016 Oscar-winning La La Land,

which grossed a total of $151,101,803 to be the No. 19 film of the year. La La Land began its run

in just five theaters, where it grossed $881,104. The $176,221 per-theater average from that

weekend ranks No. 10 all time. The top seven on that list all belong to Disney movies that had a

very limited release before going nationwide the following week, most recently with 2013’s

Frozen – which played for five days exclusively at the El Capitan theater before a wide release.

The following week, La La Land expanded to 200 theaters, which is a somewhat rare number;

most films either will be somewhere around 30 theaters or around 500. It grossed $4,102,091, for

a 366% increase, and an 88% decline in per-theater average.

The next three weeks over Christmas and New Year’s, La La Land played in 734, 750 and 1,515

theaters, posting a higher gross each week. The film peaked gross-wise over Martin Luther King

weekend by making $14,533,070 in 1,848 theaters. Three weeks later it was up to 3,236 theaters

– on par with a major wide release – before beginning to decline.

Overall, La La Land was in the top 15 movies for 15 weekends, a very high but not

unprecedented number. By week 16, though, it made $195,343 in 212 theaters, and reported

gross for just five more weeks, totaling at just over $150 million.

Miscellaneous

Some other tidbits that may come up in this analysis:

 • In recent years, there has been a dramatic shift towards bigger opening weekends and

 smaller late-run grosses. For a variety of reasons, this trend continues as opening

 21
weekend becomes more important. This is one major reason that comparisons more than

 ten years old can be misleading.

 • Thursday previews are an important factor for movies in their opening weekend. A recent

 development, many wide releases will hold showings starting Thursday night before its

 Friday release date. This number is reported as an estimate, but in official reports it is

 combined into the Friday gross. The extreme example is Star Wars: The Force Awakens,

 which grossed $57 million in Thursday previews, nearly half of its opening day total. For

 most movies, the Thursday preview will be between 5% and 10% of its opening weekend

 gross, a percentage that varies heavily on genre and release date. Thursday previews are

 not included in this analysis, despite being a strong predictor for the rest of the weekend,

 because there is no robust data.

 • The difference between week two and week three drops can be revealing. Week two drop

 is somewhat a function of audience and critical approval. But the biggest flops often see

 their biggest drop on the third weekend, when it is dumped from theaters. The worst-

 received movies drop around 80% on the second weekend. Whereas in the third weekend,

 that can be over 90% (or even 100% in some cases) if there is a massive theater drop.

Methods

The goal for this study was to find the most predictive model for estimating the opening weekend

box office of 2018 releases, using 2006-2017 wide releases as training data. As discussed in

Results, the best model proved to be an adaptation of the CARMELO model. The CARMELO

model, developed by FiveThirtyEight originally in 2015, predicts the career arc of every NBA

player. For this study, that model was adapted as follows:

 22
The movies in the database were separated into 2018 releases (134) and pre-2018 releases

(1,552). Each of the 42 predictive variables were normalized among the pre-2018 releases,

including the dummy variables. The means and variances from pre-2018 releases were applied to

the 2018 releases for standard variables.

An OLS was run among the normalized variables from pre-2018 to calculate standard Beta

coefficients for each predictor.

Then, for each 2018 release, a deviance score was calculated for every pre-2017 release. The

deviance was the sum of the squared difference between z-scores for every variable, multiplied

by the standard betas.

 ⅇ = ∑ ( − )

The deviance score was turned into a similarity score as:

 1.25 − ⅇ
 = 100 ⋅ ( )
 1.25

To predict a 2018 movie, the model considers every pre-2018 release with a positive similarity

score. The prediction is an average of the gross of every movie in that sample, weighted by

similarity score. This process was repeated for 133 of the 134 releases, and the result was saved

as the prediction.1

In this idea, which applies to every prediction model, there are three key components that can be

changed:

1
 The model was unable to generate a prediction for “Once Upon a Deadpool.” The PG-13 rated re-cut of Deadpool
2, released seven months later in December, grossed $2.7 million in its opening weekend in 1,566 theaters. It
finished with $6.1 million. No movie generated a positive similarity score.

 23
a. The calculation for similarity scores.

 b. The number of most similar data points used to create a model.

 c. The model used to form a prediction using the comparisons.

For instance, an OLS model can be thought of as (a) being irrelevant, (b) being every entry, and

(c) being an OLS. For this model, (a) is the standard deviance, adjusted as described earlier, (b)

is every movie with a positive similarity score, and (c) is a weighted average, using similarity

score as weights.

This model was then tweaked or rewritten, all using STATA, for different types of models:

(2) was a simple OLS regression on log of gross, using the same regressors as CARMELO.

(3) was a random forest model to predict gross using the same regressors as CARMELO. 2

(4) was an elastic regression, with lambda 0.0143 and alpha 1, using every regressor and

interactions between variables (Appendix C).

(5) was a ridge regression with the same regressors and interactions.

(6) was a lasso regression with the same regressors and interactions.

(7) was the same model as CARMELO but without limiting the weighted average to only

positive similarity scores.

(8) was a test of CARMELO where the 1.25 in calculating the similarity score was changed to

1.5.

2
 Interactions did not significantly change the results in the random forest model and were not used in the final tests.

 24
(9) was a test of CARMELO where the 1.25 in calculating the similarity score was changed to

1.0.

(10) was a test of CARMELO where the standard Betas were all replaced with 1 when

calculating the deviance scores.

(11) was a test of CARMELO where the final step of a weighted average was replaced with an

OLS to predict log of gross using only metascore and theatercount.

(12) was a test of CARMELO where the final step of a weighted average was replaced with an

OLS to predict log of gross using only metascore, theatercount, runtime, sequel dummy, and

imdbrating.

(13) was a test of CARMELO where the final step of a weighted average was replaced with an

elastic regression using the same regressors and interactions as (4).3

(14) was a test of CARMELO where the criterion of a positive similarity score was replaced with

the N=50 observations with the highest similarity score. Every possible N was tested, and N=50

was the most predictive.

(15) was a test of CARMELO where the criterion of a positive similarity score was replaced with

the N=1552 observations with the highest similarity score, and the final step of a weighted

average was replaced with an OLS to predict log of gross using only metascore, theatercount,

runtime, sequel dummy, and imdbrating. Every possible N was tested, and N=1552 was the most

predictive.

3
 More tests of this type could not be attempted due to the length of the calculation in STATA.

 25
(16) was a test of CARMELO where the deviance score was taken as the absolute value, rather

than the square, of the difference between z-scores.

(17) was a test of CARMELO where every positive similarity score was squared before the

weighted average.

Each of these models changed at least one of (a), (b) or (c). As discussed in results, none

performed as well as CARMELO.

Results

When our version of CARMELO is run, using 2006-2017 films as training data, the R2 between

the predicted and observed for 2018 films is 0.8034. This is higher than the R 2 of any other test.

We also ran tests to find R2 for four subsets, two at both ends: movies predicted over $50

million, gross over $50 million, predicted under $10 million, gross under $10 million.

Table 1 shows the R2 for each of the 17 models on the overall data and the four subsets.

The best overall R2 is for (1), the pure CARMELO. CARMELO also outperforms every other

model in most categories. Only (17) is better in both the high and low end. This potentially

suggests that when a movie is near the extremes, taking fewer comparisons leads to a better

prediction. For risk of overfitting, we did not try to pursue this model further.4

4
 If this were true, a model would first need to be used to determine whether a movie was near an extreme, and then
based on that a separate model would be used to generate a prediction. This is similar to the parsimonious model
used by Sawhney and Eliashberg (1996). Further tests of this type should be considered in a future study.

 26
R^2 p > 50M G > 50M p < 10M G < 10M

(1) 0.8034 0.6797 0.6138 0.0384 0.3914

(2) 0.7807 0.5025 0.5320 0.2531 0.4334

(3) 0.7093 0.4127 0.4078 0.1296 0.0549

(4) 0.7649 0.4546 0.5199 0.2085 0.4064

(5) 0.6725 0.3337 0.4439 0.1896 0.3341

(6) 0.7478 0.4152 0.4867 0.2528 0.3993

(7) 0.0125 0.0055 0.1840 0.2586 0.0223

(8) 0.7715 0.3986 0.5499 0.0169 0.3335

(9) 0.7784 0.6070 0.6230 0.1198 0.4960

(10) 0.6790 0.6139 0.4463 0.5601 0.0808

(11) 0.6035 0.1160 0.3551 0.1056 0.3237

(12) 0.6539 0.3152 0.3541 0.0930 0.3167

(13) 0.7569 0.4502 0.4790 0.1357 0.4432

(14) 0.7923 0.5979 0.6286 0.0841 0.5001

(15) 0.6684 0.4493 0.3589 0.0789 0.3385

(16) 0.7752 0.5705 0.5394 0.0250 0.3506

(17) 0.7940 0.6849 0.6234 0.0567 0.4416
 Table 1: Results of model tests

 27
28
Figure 7: Opening weekend gross of 2018 releases and CARMELO model prediction
Discussion

Based on these tests, the best model for predicting domestic opening weekend box office is a

basketball model. This is certainly a surprising a result that warrants further discussion. The

adaptation from CARMELO for basketball to movies is in some ways intuitive, and in others it is

a stretch.

Perhaps the most important difference is the output. For basketball, the prediction can generate

several possible statistics, and the model generates two outputs: offensive and defensive wins

above replacement. The box office model only has one output: gross, a much simpler calculation,

and easier measurement, than the arbitrary wins above replacement. This suggests our model

could be more accurate than FiveThirtyEight’s. Our measurement for success is much easier to

measure than in basketball. A model could be adapted to predict Friday, Saturday and Sunday for

potentially better accuracy.

The other important difference involves the inputs. For basketball players, prior statistics can be

used to predict future ones. Even for rookies, the CARMELO model uses college statistics and is

able to adjust to the NBA. In our opening weekend box office prediction, there is no prior gross

from which to predict. In this sense, our prediction should be less accurate.

There are a few differences in calculations between the model in this study and the one used by

FiveThirtyEight. First, CARMELO for basketball outputs a range, where we only make a single

prediction. FiveThirtyEight has an extra step for a baseline projection. Sometimes a player is

significantly above or below what would be expected and has been for years. This would often

be a superstar player where the comparisons are too low. Each comparison player gets a baseline

projection given a simple model of their age, playing time, and recent performance. If the

 29
comparison players consistently exceed the baseline, that exceedance is applied to the forecast.

This step was not used in the box office model.

The other difference involves the use of standardized Betas when calculating the deviance score.

CARMELO replaces these with a selection of integers as weights for each category. When

discussing the model, Nate Silver wrote, “To be honest, they’re a little arbitrary and … intended

to make ‘good basketball sense’ rather than being optimized to the nth degree in a way that

might produce an overfit model.”

Finally, basketball CARMELO does not exclusively limit the forecast to the use of positive

similarity scores. If there are not enough positive comparisons to make a forecast, “the system is

designed to relax its standards and give players with mildly negative similarity scores some

weight in calculating a player’s forecast,” Silver wrote. Our model only uses positive scores,

which only presents a problem for Once Upon a Deadpool.

A future model may attempt to more closely emulate the FiveThirtyEight methods.

We must consider why this model outperforms every other test. An early finding was that the

characteristics for a movie at the low end of the box office, and one at the high end, are so

different that they offer no predictive value for each other. Sawhney and Eliashberg (1996) found

a similar problem but offered a different solution to use a different type of model for each movie.

Here, the difference is not the movie itself but the gross of the movie. Rather than find a different

complex model, we use the simple weighted average, but limit to only average the most similar

comparisons.

What this model offers is an intuitive way of making a prediction using comparison. The process

experts use when forecasting is similar in many ways. They are likely to find similar

 30
comparisons to the movie, perhaps by using an arbitrary process, and make a forecast based off

the comparisons.

More can be learned about the model by analyzing the places where it is missed.

The Avengers Problem

Because of the structure of the model, it will never predict a new all-time record. It is

mathematically impossible. The model can only consider grosses from the past, so it is

constrained to the prior range, which has an upper bound. That’s why this model missed low on

Avengers: Infinity War, predicting $147 million against its ultimate $257.7 million opening

weekend – an opening weekend record. This, in itself, is only a problem every couple of years or

so (the opening weekend record had been broken 11 times since 2000 when this study was

published, most recently by Avengers: Endgame in April 2019.)

But there is a larger problem that Avengers: Infinity War reveals. The model is not good at

recognizing a movie that outperforms every comparable. Deadpool presents a great example of

this. A “first-of-its-kind” R-rated superhero action comedy X-Men spinoff from Fox, Deadpool

stunned the industry with its $132 million opening weekend. It had the smallest theater count for

any $90 million opener, even below movies from 2001 when theater counts were much smaller –

its opening was such a surprise to many.

Just three days before release, Deadline predicted a weekend of $60-65 million over four days –

missing low by $90 million. That 4-day total would translate to around $50 million for the

weekend.

Our model, though, would have missed by more. Rather than isolating the 2015 release, we can

analyze what would happen if a Deadpool clone would be released on May 1, 2019 – giving it a

 31
generous release date for a superhero movie. Even still, the comparisons it generates are mostly

useless.

title similarity gross

Deadpool 87.2 $132,434,639

Kingsman: The Secret Service 68.6 $36,206,331

Game Night 53.3 $17,005,332

Focus (2015) 43.0 $18,685,137

How to Be Single 42.0 $17,878,911

Mile 22 37.0 $13,710,825

John Wick: Chapter Two 36.4 $30,436,123

A Good Day to Die Hard 36.3 $24,834,845

Ferdinand 34.1 $13,401,586

This Means War 32.8 $17,405,930

 Table 2: Comparisons for a hypothetical May 2019 Deadpool release

None of these are accurate representations of Deadpool. The model struggles to identify what

makes this R-rated action movie with a medium theater count special. Even with Deadpool’s

$135 million as the top comparison, our prediction is $25,796,897. The industry predictions for

Deadpool were also very inaccurate, though not to the same extent.

Occasionally, it is clear to the human eye, as in the case of Avengers: Infinity War or Deadpool,

that the movie will outperform all the comparisons. Basketball CARMELO adjusts for this type

of problem using the baseline forecast. However, because we have no prior statistics to use as a

baseline, the problem cannot be solved through this model. Even if we were able to create this

baseline prediction, it may not be effective. Avengers: Infinity War opened in fewer theaters than

 32
Despicable Me 3 ($72 million opening weekend in 2017), and while its 156-minute runtime is

longer than most blockbusters, that does not necessarily mean a higher prediction.

The Black Panther Problem

The biggest miss of 2018 by total dollars is for Black Panther. The Marvel superhero smash hit

has a projection by this model of $77.5 million. Instead, it grossed $202,003,951 opening

weekend.

A look at the comparisons reveals where this miss possibly comes from.

title similarity gross

Guardians of the Galaxy 50.8 $94,320,883

Rogue One: A Star Wars Story 39.8 $155,081,681

Doctor Strange 37.6 $85,058,311

Marvel's The Avengers 34.5 $207,438,708

The Jungle Book (2016) 33.6 $103,261,464

Ant-Man 31.7 $57,225,526

Captain America: The Winter Soldier 29.5 $95,023,721

Thor: Ragnarok 22.3 $122,744,989

 Table 3: Comparisons for Black Panther (2018)

This is a very good list of comparisons. Most analysts would probably come up with a similar

one. This list includes, for the most part, large Disney (mostly Marvel) releases that weren’t a

sequel to a previous movie but were part of the larger franchise. And given that description, the

prediction is not too far off. Most movies in this category would gross around that number.

But then there’s the variance. Over time, some movies with this prediction will fall below what’s

expected, such as Ant-Man. And perhaps one will so perfectly capture a cultural zeitgeist in a

 33
way that explodes it from $100 million opening weekend to double that. Without any tracking

data, the model can’t predict which will be which.

Black Panther was unique in its success. When it opened, it was $68 million higher than any

superhero original story opening weekend before it. As of May 2019, Captain Marvel ranks

second at $153 million, still nearly $50 million behind. The Metascore of 88, one of the highest

in the dataset, gives a clue of its success (the movie was later nominated for Best Picture at the

Oscars) but because of the Avengers Problem the model cannot directly use that to adjust higher.

Our model is not unique, however, in underestimating Black Panther. The Long Range Forecast

by Box Office Pro, published eight weeks before release, usually before tracking data is

available, predicted $90 million for the movie. Even the week of its release, when they had

knowledge that it had the best-ever presales for any superhero movie, and adjusting upwards

later in the week, the site still underpredicted, forecasting a $205 million 4-day opening weekend

compared to its $242 million actual.

What results, ultimately, is a problem of variance. Ticket sales or social tracking data could give

us a hint at which will be the biggest successes, but this model does not have that data. This

model can’t predict which will hit the top end of the variance range much more than it can

predict which in a series of 50 dice rolls will hit snake eyes.

Box Office Pro

What has not yet been discussed is how this model compares to the experts. As it turns out, it is

poor given the constraints.

The comparison was made using weekend forecasts from Boxoffice Pro. The website publishes

weekend predictions every Wednesday. Predictions were available for 127 of the 134 movies

 34
with a few adjustments. Some weekends were predicted for 4 days and were adjusted by taking

80% to use as their 3-day forecast. For movies where a range was given as the forecast, the

middle of the range was used. “Low single digits” was taken to mean $3 million.

As a whole, Box Office Pro performs significantly better than our model. The R2 of their

predictions to the actual gross is 0.9685. The average miss is much better, and it makes a more

accurate prediction for 101 of 127 movies.

There are two potential reasons for their success: better data and better use of the data. While this

model contains many regressors, there are important factors that it cannot consider. Most

important are ticket presales and social media tracking. These are the most important variables in

making a prediction. Ticket sales, especially, represent actual dollars spent. Comparing ticket

sales to similar movies is a great way to make an accurate forecast.

Because they have better data, perhaps this is an unfair comparison. The model would be able to

make use of presale data if it had enough of an archive, using these numbers either as another

point in the similarity score or as a baseline adjustment. Using differences in presale numbers to

adjust the gross of comparable movies simulates a forecasting process.

However, perhaps the box office industry is better for a human expert to forecast. These

predictions need a human fingerprint to get the best accuracy, especially in determining what

makes a comparison better than another one. Consider the 2019 film Breakthrough, about a boy

who nearly dies after an ice accident but recovers through prayer. These are the top ten

comparisons the model generates:

 35
title similar gross

The Miracle Season 58.7 $3,950,652

Heaven is for Real 51.3 $22,522,221

The Case for Christ 48.7 $3,967,885

Super Troopers 2 44.2 $15,181,624

Chasing Mavericks 44.1 $2,268,274

Soul Surfer 43.8 $10,601,862

The Promise (2017) 42.4 $4,095,718

The Identical 42.0 $1,587,137

God Bless the Broken Road 41.5 $1,386,254

Woodlawn 41.2 $4,002,226

 Table 4: Comparisons for Breakthrough (2019)

Eight of the ten are most similar Christianity-themed movies that the model finds even though

religion is not part of the model. Chasing Mavericks, while not explicitly religious, fits the

criteria well. The tenth, Super Troopers 2, an R-rated vulgar comedy about a group of prankster

Vermont police offers, sticks out like a sore thumb.

Conclusion

This model is intended to be the start, rather than the ending, of box office analysis. The model

can potentially be tweaked for better accuracy. If adapted by a studio or industry analyst, they

can add presale data for better accuracy. Moreover, this idea can be applied to other areas of box

office predictions with a few adjustments, and hopefully will be in future analysis.

Predicting the gross of movies after their opening weekend is just as important. A model may be

able to be much more accurate than it is for opening weekends and may even rival expert

 36
predictions in accuracy. For this model, opening weekend can be used as one variable, and the

previous weeks as another. Perhaps it is best to only compare the same week during their run, but

comparing across weeks should also be tested. Special attention for this model must be paid to

holiday weekends. Holidays were ignored to the model’s detriment in the opening weekend

analysis. But they become a much more important factor in determining the relationship between

opening weekends and a future weekend. There are four official 4-day weekends in studio

reporting: MLK, President’s Day, Memorial Day and Labor Day. For each of these, most movies

see a much smaller decline than expected, and some even show an increase. Other days, such as

Valentine’s Day or Halloween, will also have a big impact. The model could potentially work by

outputting the predicted gross for the weekend, or by predicting the percent decline from the

week before. Both should be tested, as well as other ideas as fit.

Another important adaptation for this model would be for limited releases. Similar to the post-

opening weekend model, this model would need to run week-by-week. Theater counts would be

a much bigger factor. A big problem in making these predictions is often finding comparisons

with similar expansion patterns. Simply having a searchable database can be hugely valuable.

This can also test questions such as the difference caused by expanding earlier or later in the

movie’s run.

The model may not, at this point, make better predictions than experts publish, but that does not

mean there is no value. With five or fewer tests each weekend, though, this is expected. A human

forecaster can easily spend more time making their predictions than the model. In a universe

where hundreds of movies (or a different industry where hundreds of products) were released

each day, the model should be more accurate than a human.

 37
Where the model would be immediately useful is in the first step, finding comparisons. Finding

comparable movies by hand is hard – as of now, there’s no specific process or list. This model

formalizes that process.

Furthermore, the model can provide a useful starting point for industries planning a future

release. While far from perfect, the model can find similar movies and compare their success.

The studio can attempt to model the release pattern after the more successful entries before it has

any presales.

There are numerous applications and potential future adjustments to this model. With all of the

data available, the analysis in both the industry and in academics can quickly capitalize.

References

Information courtesy of Box Office Mojo. Used with permission.

http://www.boxofficemojo.com/

Basuroy, Suman, et al. “How Critical Are Critical Reviews? The Box Office Effects of Film

Critics, Star Power, and Budgets.” Journal of Marketing, vol. 67, no. 4, 2003, pp. 103–117.

JSTOR, www.jstor.org/stable/30040552.

D'Alessandro, Anthony. “'Deadpool' To Rule Holiday Weekend, But Women Have Eyes For

'Zoolander 2' & 'How To Be Single'.” Deadline, 9 Feb. 2016,

www.deadline.com/2016/02/deadpool-zoolander-2-how-to-remain-single-valentines-day-

presidents-day-weekend-box-office-1201699293/.

Du, Jingfei, et al. “Box Office Prediction Based on Microblog.” Expert Systems with

Applications, vol. 41, no. 4, Mar. 2014, pp. 1680–1689., doi:10.1016/j.eswa.2013.08.065.

 38
Liu, Yong. “Word of Mouth for Movies: Its Dynamics and Impact on Box Office Revenue.”

Journal of Marketing, vol. 70, no. 3, 2006, pp. 74–89. JSTOR, www.jstor.org/stable/30162102.

Robbins, Shawn. “Long Range Forecast: Is Marvel's 'Black Panther' Poised to Become 2018's

First Blockbuster?” Boxoffice Pro, 22 Dec. 2017, www.boxofficepro.com/long-range-forecast-

black-panther/.

Robbins, Shawn. “Weekend Forecast (Update): Marvel's 'Black Panther' Poised to Shred Box

Office Records, Targeting Possible $200M+ 4-Day Launch.” Boxoffice Pro, 17 Feb. 2018,

www.boxofficepro.com/weekend-forecast-black-panther-marvel-shred-records-early-man-

samson-presidents-day/.

Robbins, Shawn. “Weekend Forecast: 'Jurassic World: Fallen Kingdom' & 'Incredibles 2'

Primed for Box Office Brawl.” Boxoffice Pro, 20 June 2018, www.boxofficepro.com/weekend-

forecast-jurassic-world-fallen-kingdom-takes-second-frame-incredibles-2/.

Sawhney, Mohanbir S., and Jehoshua Eliashberg. “A Parsimonious Model for Forecasting Gross

Box-Office Revenues of Motion Pictures.” Marketing Science, vol. 15, no. 2, 1 May 1996, pp.

113–131., doi:10.1287/mksc.15.2.113.

Silver, Nate. “We're Predicting The Career Of Every NBA Player. Here's How.”

FiveThirtyEight, ESPN, 9 Oct. 2015, www.fivethirtyeight.com/features/how-were-predicting-

nba-player-career/.

World Bank. “Individuals using the Internet (% of population).” World Development Indicators,

The World Bank Group, 2017. Accessed 1 May 2019.

 39
Appendices

Appendix A: Variables

These variables were pulled from BoxOfficeMojo:

 • Title, as defined by BoxOfficeMojo
 • Gross – domestic opening weekend gross, in dollars
 • Year – Year of release in the United States
 • Startdateid – date of release in the United States, with 1 as January 6, 2006 – and one
 added for each subsequent day
 • Theatercount – number of theaters the film played in during opening weekend
 • Runtime – the length, in minutes, of the movie
 • Genre – defined as nine dummy variables: action, animation, comedy, documentary,
 drama, family, horror, scifi, thriller (these categories are not fully disparate; some movies
 are marked for multiple genres)
 • Dayofweek – the day of the week of the release date, where 1 is Sunday, 2 is Monday,
 etc.
 • Month – the month of the release date, defined as 11 dummy variables: jan, feb, mar, apr,
 may, jun, jul, aug, sep, oct, nov (with dec eliminated to avoid collinearity)
 • Studio – the movie studio, or parent group, who held the distribution rights in the United
 States to the film, defined as seven dummy variables: disney, fox, paramount, sony, wb,
 uni, lionsgate (an eighth category, “other” combines 50 other studios and distributors, and
 was eliminated to avoid collinearity)
 • MPAA – the rating given to a movie’s United States release by the Motion Picture
 Association of America, defined as three dummy variables: pg, pg13, r (with g eliminated
 to avoid collinearity; every movie in the data set fell into one of these four categories)

These variables were pulled from OMDB API:

 40
• Metascore – an aggregate of critical reviews on a scale of 1 to 100, pulled at the
 beginning of 2019 for every movie
 • Imdbrating – user reviews, a measure of the general audience reception on a scale of 1 to
 10, pulled at the beginning of 2019 for every movie

These variables were inputted by hand, using data from Box Office Mojo:

 • Rerelease – a dummy variable for whether the film was a re-release of an earlier movie
 • Rereleaseopen – if the film is a re-release, the opening weekend gross, in dollars, for the
 original release
 • Rereleasegross – if the film is a re-release, the total gross, in dollars, for the original
 release
 • Sequel – a dummy variable for whether the film is a sequel to another movie (reboots,
 spin-offs or movies part of a franchise do not count unless they are sequels)
 • Sequelopen – if the film is a sequel, the opening weekend gross, in dollars, for its
 predecessor
 • Sequelgross – if the film is a sequel, the total gross, in dollars, for its predecessor

 41
You can also read