Urban Air Pollutant from Motor Vehicle Emissions in Kuala Lumpur, Malaysia Siti Haslina Mohd Shafie, Mastura Mahmud
←
→
Page content transcription
If your browser does not render page correctly, please read the page content below
Aerosol and Air Quality Research, 20: 2793–2804, 2020
ISSN: 1680-8584 print / 2071-1409 online
Publisher: Taiwan Association for Aerosol Research
https://doi.org/10.4209/aaqr.2020.02.0074
Urban Air Pollutant from Motor Vehicle Emissions in Kuala Lumpur, Malaysia
Siti Haslina Mohd Shafie, Mastura Mahmud*
Geography Programme, Faculty of Social Sciences and Humanities, Universiti Kebangsaan Malaysia, Bangi, 43600
Selangor, Malaysia
ABSTRACT
The increasing amount of motor vehicles that emit pollutants are contributing significantly to urban air pollution, be it in
industrial or developing countries. This study investigates the emission of particulate matter (PM10) from exhaust and non-
exhaust sources and gaseous pollutants, such as carbon monoxide (CO) and nitrogen oxide (NOx) from several different
classes of motor vehicles in the tropical city of Kuala Lumpur. Air pollutants from fuel consumption were obtained from
emission factors, while non-exhaust particulate matter was estimated from the United States Environmental Protection
Agency (U.S. EPA) Compilation of Air Pollutant Emissions Factors (AP-42). The total PM10 emissions from all classes of
motor vehicles estimated from the tail-pipe exhaust was 1,029,883 kg, while non-exhaust sources were 1,573,539 kg.
Emissions of PM10 from newly registered private cars was the most dominant at 214,427 kg, followed by emissions from
motorcycles at 118,582 kg in 2014. Private cars also contributed 14,605 kg of CO and 5,726 kg of NOx in 2014, compared
with 9,830 kg of CO and 3,854 kg of NOx in 2010. Comparison with other Organisation for Economic Co-operation and
Development (OECD) countries shows that the total emissions for PM10 and NOx were lower in Malaysia than in most
countries, but the CO emissions here were higher than in Asian countries such as Japan and Korea, as well as in other
European countries. Various strategies and policies should be implemented by the local authorities and government agencies
to reduce emissions from the transportation sector in urban areas to improve the quality of the urban environment, human
health, and the urban community.
Keywords: Urban traffic; Gaseous emissions; Private cars; Urban pollution; Asia Pacific.
INTRODUCTION 2013; Beelen et al., 2014; Su et al., 2019; Wei et al., 2019),
and premature mortality (Su et al., 2015). Thus, WHO
The transportation sector is a major source of traffic estimates approximately 4.2 million premature death cases
pollution in the city center. High levels of economic growth, worldwide (WHO, 2018). Recently, a relationship between
rapid urbanization, increasing disposable income, a variety traffic pollution and other diseases such as cognition, mental
of social and recreational activities, increasing private vehicles, health and dementia, and air pollution has been identified
and the distribution of dissimilar materials and resources have (Luyten et al., 2018; Shehab and Pope, 2019; Hu et al.,
directly increased the demand for the transport sector and 2020).
leading to a deteriorating urban air quality (Saboori et al., Generally, the major sources of urban air pollution to
2014; Shahbaz et al., 2015). These increasing emissions from individual health are particulate matter (PM) and nitrogen
the transportation sector are contributing factors to domestic dioxide (NO2) through emission from vehicle exhaust
air pollution, global climate change, human health problems, (Ghaffarpasand et al., 2020). In 2016, on-road vehicles
and ground-level ozone formation at both regional and accounted for about 39% and 20% of total NOx and carbon
national scales (Saija and Romano, 2002; Azam et al., 2016). monoxide (CO) emissions in the European Union (EU), and
Epidemiological evidence has identified traffic pollution it is found those passenger vehicles are the major cause of
as a risk factor for adverse health outcomes, including NOx and CO emissions from road transportation (EEA,
respiratory disease incidences (Zhu et al., 2012; Laumbach 2018). Meanwhile, motor vehicles using diesel fuel have
and Kipen, 2014), cardiovascular diseases (Jerrett et al., been identified as a major contributor to high NOx emissions
in Europe (Anttila et al., 2011; Henschel et al., 2015) beside
CO and total hydrocarbons (THC) (Yang et al., 2020).
*
Corresponding author. Fuel Consumption and Motor Vehicle Emissions
Tel.: 03-89215672; Fax: 03-89213334 The transportation sector consumes about 48 million
E-mail address: mastura@ukm.edu.my barrels of oil per day compared to the current global total of
Copyright The Author(s). This is an open access article distributed under the terms of the Creative Commons Attribution License (CC BY 4.0), which permits
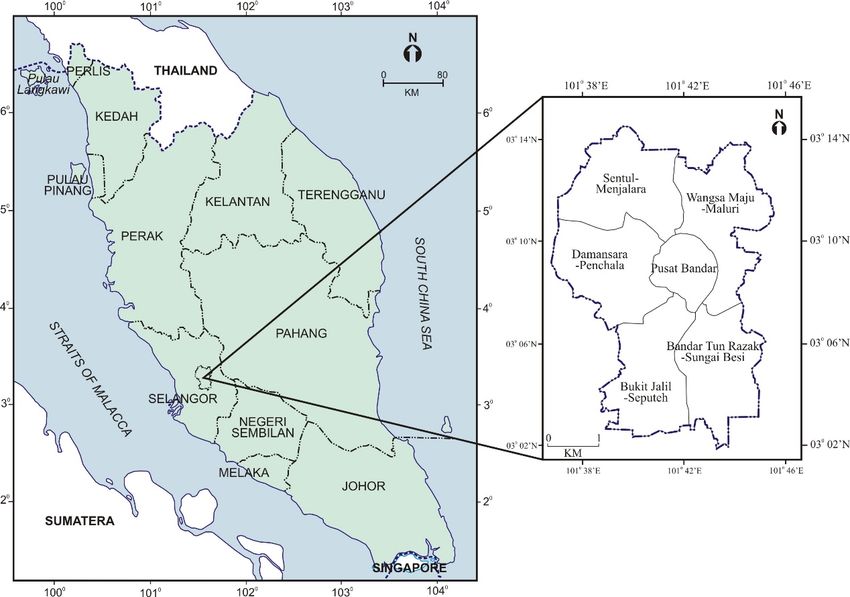
unrestricted use, distribution, and reproduction in any medium, provided the original author and source are cited.2794 Mohd Shafie and Mahmud, Aerosol and Air Quality Research, 20: 2793–2804, 2020 93 million barrels of oil a day from more than 1.5 billion The energy use from the transportation sector from fossil motor vehicles (EIA, 2014). Fuel consumption is defined as fuels was estimated at 50% in Malaysia, which is the highest the amount of fuel consumed per unit distance and expressed in ASEAN (Chandran and Foon, 2013). Traffic emissions in litres/100 km. The lower value of fuel consumption by are also influenced by rapid urbanisation that impacts the vehicles has shown that high savings occur (Mathew, 2014). population, economic growth, and activity services, The higher octane petrol is cooler and significantly produces particularly in the city centres. According to the 10th lower nitrogen oxide (NOx) release levels (Al-Arkawazi, Malaysia Plan, the rate of urbanisation in Malaysia has 2019). increased from 25% in 1960 to 65% in 2005, with the Cheah et al. (2008) investigated that fuel consumption expected increase of 75% of the population residing in the and emission of pollutants from motor vehicles recorded a Klang Valley conurbation by 2020 (Kuala Lumpur City reduction from 11.2 litres/100 kilometres in 2007 to Hall, 2004). 5.6 litres/100 km, while the sales-weighted average fuel Thus, the objective of this study is to calculate the economy increased from 21 miles per gallon (mpg) in 2007 emissions of particulate matter from the exhaust and non- to 42 mpg by 2035. The International Energy Agency (IEA) exhaust and gaseous pollutants from the fuel consumption specified that energy consumption from the global transport of the vehicle class passenger cars, motorcycles, buses, and sector and greenhouse gas emissions are expected to increase goods transport from 2010 to 2014 in the metropolitan city by approximately 50% by 2030 and 80% by 2050 (Huang et of Kuala Lumpur. This study utilizes the top-down approach al., 2020). Higher fuel consumption in motor vehicles was based on fuel consumption for CO and NOx, and the bottom- detected at urban signalised intersections due to the frequent up approach (vehicle kilometre travelled (VKT) and number changing of vehicle modes of deceleration, acceleration, and of vehicles) for particulates. The CO and NOx emissions stopping (Wu et al., 2020). from motor vehicle exhausts are calculated based on fuel In Malaysia, private cars, motorcycles, light, and heavy consumption (Masjuki et al., 2004; Kakouei et al., 2012), vehicles are major contributors to deterioration in air quality, while the particulates include the exhaust PM10 and non- especially in urban areas. The total number of newly registered exhaust source from paved roads. The different approach for motor vehicles from 2004 to 2017 was 286,771,902 units, CO and NOx are used, as they are gaseous pollutants from comprising five classes: passenger cars, motorcycles, motor vehicles through the fuel combustion process as petrol vans/lorries, and taxis/buses (DOE, 2017). Motorcycles and and diesel directly affect the levels of CO and NOx released. passenger cars are the dominant classes of motor vehicles, For PM10 emissions from motor vehicle exhaust, it is estimated with 6,572,366 units in 2004 that increased by 35% to using VKT and number of vehicles (EIA, 2005) because the 11,989,591 units in 2015 (DOE, 2015). The same situation movement the motor vehicles or driving patterns directly was shown for passenger cars, with 5,911,752 units in 2004 influence the emission of PM10 (Rostampour, 2010). Thus, that grew by 35% to 13,173,030 units in 2017 (DOE, 2015, VKT is affected by the flow of traffic and traffic congestion. 2017). Furthermore, the number of vehicles also caused serious Motor vehicles and traffic emissions are directly related traffic congestion through different driving patterns. The to the fuel consumption caused by an incomplete combustion CO, NOx, and PM10 emissions will be compared to the process in the engine system. Fuel consumption from the Organisation for Economic Co-operation and Development transport sector in Malaysia showed an upward annual trend, (OECD) countries to gauge the rank of an environmental as evidence by the 5,386 kilotonnes of oil equivalent (ktoe) indicator of urban Kuala Lumpur that represents a developing in 1998 that rapidly increased to 23,435 ktoe in 2015 country. The identification of the vehicle class that (Energy Commission Malaysia, 2014). Combustion of fossil contributes the most emissions to the atmosphere in Kuala fuels from petrol, fuel oil, and natural gas in the internal Lumpur may help policymakers to adopt a strategy to reduce combustion engine of a motor vehicle releases air pollutants, air pollutants and the impacts of climate change on the city. such as carbon monoxide (CO), sulphur dioxide (SO2), oxides of nitrogen (NOx), non-methane volatile organic compounds MATERIALS AND METHOD (NMVOC), and particulate matter (PM) (Ong et al., 2011; Azam et al., 2016). In addition, transport activities from Study Area: Urban Kuala Lumpur private and goods vehicles emit about 20% of greenhouse Kuala Lumpur (KL) is the federal capital of Malaysia and gases (World Bank, 2014; Alshehrya and Belloumi, 2017). is a prominent and sophisticated city in Southeast Asia, In Malaysia, energy consumption directly relates to the acting as a centre of commercial and industrial activities transport sector, foreign direct investment, and pollutant (Ling et al., 2010; Teriman et al., 2010; Jamhari et al., 2014). emissions that resulted from positive economic growth Kuala Lumpur covers an area of 24,221 hectares and is (Department of Statistics Malaysia, 2011). Consequently, located on the west coast of Peninsular Malaysia (Fig. 1). It higher fossil fuel consumption in Malaysia resulted in a 6.7% has a total population of 1,627,172 inhabitants and a density increase in annual average growth from the transportation of over 6,800 persons per square kilometre (Teriman et al., sector from 1971 to 2008, which is comparable to Thailand at 2010). More than 60% of Malaysians live in urban areas in 6.6% and Indonesia at 6.3% (Ghosh, 2010). The increased 2010 and it is predicted to increase to 75% in 2020 (Shuid, consumption of fossil fuels in Malaysia from 1960 to 2002 2004). resulted from the increasing motor vehicle ownership, with Kuala Lumpur city is situated in the Klang Valley or Kuala an average of 6.7% for 1,000 persons (Dargay et al., 2007). Lumpur Conurbation (KLC). Under the Kuala Lumpur
Mohd Shafie and Mahmud, Aerosol and Air Quality Research, 20: 2793–2804, 2020                     2795

                                    Fig. 1. Map of six strategic zones in Kuala Lumpur.

Structure Plan (2004–2020) and the Kuala Lumpur City             Agency (U.S. EPA) AP-42 (U.S. EPA, 2011).
Plan, it was divided into six strategic planning zones for the
purposes of city planning (Architects and Urban Planners         Fuel Consumption
Malaysia, 2006) consisting the City Centre, Sentul–Menjalara,      Fuel consumption for each vehicle class was analysed
Wangsa Maju–Maluri, Damansara–Penchala, Bukit Jalil–             using Eq. (1) below by Kakouei et al. (2012):
Seputeh, and Bandar Tun Razak–Sungai Besi (Ling et al.,
2012). Road transport represents 84% of the city’s mobility,     Fc = Ac × V × Rd                                        (1)
with private cars accounting for 57% of all motorised trips
in Kuala Lumpur (Kuala Lumpur City Hall, 2004). Currently,       where:
Kuala Lumpur has a total of 1,213 kilometres of road length      Fc = Fuel consumption in a day (diesel or petrol) in litres;
(Teriman et al., 2010). According to a report from the Public    Ac = Average fuel consumption by each type of vehicle per
Work Department of Malaysia (2014), the overall road             kilometre (L km–1);
network in Kuala Lumpur, covering Kuala Lumpur–Kuala             V = Number of each type of vehicle; and
Selangor, Kuala Lumpur–Ipoh, Kuala Lumpur–Seremban               Rd = Amount of running per day by the vehicle (km).
Expressway, and Kuala Lumpur–Damansara, with a total             * The value of Rd is the number of vehicle trips (km) per
length of 1,531.20 km, had a traffic volume recorded at          day and is estimated from the survey answered from 200
1,083,320 units for a 16-hour duration in 2010.                  residents in Kuala Lumpur (Mohd Shafie, 2019). The small
   Newly annual registered motor vehicle data for Kuala          value of Rd is because it involves the average short-range
Lumpur was provided by the Department of Road Transport          distance performed by the residents of Kuala Lumpur. The
Malaysia (MOT) at the Wangsa Maju branch. Data were              average daily distance travelled is 14 km.
classified to different categories and according to the fuel        The emissions of CO and NOx were next calculated from
consumption of private cars and motorcycles (petrol), and        fuel consumption using Eq. (2) (Masjuki et al., 2004):
buses and goods vehicles using diesel from the year 2010 to
2014. The exhaust emissions of CO and NOx are obtained           TMi = CF (ES × FE 1p + ES × FE 2p + ES × FE 3p +… +
from their fuel consumption, while particulate matter            ES × FE np)                                      (2)
emission is estimated based on Baidya and Borken-Kleefeld
(2009). The non-exhaust particulate matter from paved roads      where:
is calculated using the formula from the emission factors        TMi = Total emission in year i (kg);
provided by the United States Environmental Protection           ES = Energy use in year of fuel type (ktoe);
2796 Mohd Shafie and Mahmud, Aerosol and Air Quality Research, 20: 2793–2804, 2020
FE n/p = Emission per unit energy of fuel type n (kg GJ–1); VKT = Average annual vehicle kilometer travelled (km);
CF = Conversion factor. e = Emission factor.
* The conversion factor (CF) used in this study is 1 toe = Emission factors for private cars and motorcycles (petrol)
41.86 GJ (UN, 1991; IEA, 2002; EIA, 2004). are obtained from Baidya and Borken-Kleefeld (2009) while
* Energy use of fuel type (ES) in ktoe is calculated from the buses and goods vehicle are based on Euro 4 emission limits
total registration of motor vehicles by year with energy use for RON95 and RON97 in Malaysia (Table 3).
values derived from Malaysia Energy Statistics Handbook
reports from 2010 and 2014 (Malaysian Energy Commission, RESULTS AND DISCUSSION
2017). The emission per unit energy of fuel type is constant
according to pollutants for petrol and diesel as shown in Motor Vehicles in Kuala Lumpur
Tables 1 and 2. The total number of new motor vehicles registered from
Therefore, this study only estimated emissions from private 2010 to 2014 consists of private cars, motorcycles, goods
cars using petrol and not diesel. Data from the Department vehicles, and buses. The annual trend showed a continuous
of Road Transport Malaysia (MOT) showed that the total increase of 3.71% per year from 3,161,741 units in 2010 to
number of private cars using petrol is 10,906,065 units 3,812,460 units in 2014 (Fig. 2). The highest numbers of
(62.37%) compared to 148,207 units of diesel cars (0.84%) vehicle classes are the private cars and motorcycles, which
from 2010 to 2014. recorded 10,906,065 units (an increase of 62.37%) in 2014
and 6,030,752 units in 2010. This is in contrast to a lower
Particulate Matter Emissions number of goods vehicle at 498,837 units or 2.85% increase,
Particulate matter emissions from road vehicles comprise while buses showed a lower quantity of 48,113 units or
emissions from tailpipe exhaust and non-exhaust emissions 0.27% of the total vehicles.
such as brake, tires and clutch, and re-suspension of dust The total newly registration motor vehicles in Kuala
(Thorpe and Harrison, 2008). Particulate emissions from the Lumpur significantly showed annual averaged VKT for
surface of paved roads via the movement of motor vehicles are private cars is highest year by year from 26,259,715 km in
estimated by using the following equation from U.S. EPA 2010 to 31,919,321 km in 2014 compared to other vehicles
AP-42 (U.S. EPA, 2011). Default values used in this analysis: classes. In addition, motorcycles recorded an increasing
k = 4.6, sL= 0.62 g m–2, W = 3.4 tonnes (U.S. EPA, 2011). annual averaged VKT of 14,658,117 km and reached
17,651,935 km beside 1,307,720 km to 1,371,397 km for
E = k (sL)0.91 × (W)1.02 (3) goods transport during the study period (Table 4).
The total pollutants emitted by private cars, motorcycles,
where: buses, and goods vehicles from 2010 to 2014 for PM10
E = Particulate emission factor (units match the units of k); (exhaust and non-exhaust), CO, and NOx are 2,603,422 kg,
k = Particle size multiplier for particle size range and units 80,875 kg, and 33,437 kg, respectively (Fig. 1). The total PM10
of interest; emissions from exhaust is 1,029,883 kg and 1,573,539 kg
sL = Road surface silt loading (grams per square meter) from non-exhaust from 2010 to 2014. Overall, non-exhaust
(g m–2); and PM10 emissions from private cars and motorcycles emit the
W = Average weight (tonnes) of vehicles traveling the road. highest total of PM10 in 2014 at 214,427 kg and 118,582 kg,
Meanwhile, particulate matter emission from vehicle respectively. This is followed by tailpipe PM10 emission of
exhaust is based on mainly the fuel consumption (petrol and 142,952 kg from private cars and 79,055 kg by motorcycles
diesel), vehicle kilometre travelled (VKT), and emission in 2014. Meanwhile, goods vehicles released 9,212 kg of
factors. VKT is derived from Eq. (4) (EIA, 2005) and PM10 in 2014. Buses also showed similar conditions but in
emission factor using Eq. (5). minimal quantities from 864 kg in 2010 to 869 kg in 2014.
VKT = Number of vehicles x Distance travelled (4) Transport Emissions in Kuala Lumpur
The CO emission from private cars was high, which was
EP = ∑ (N × VKT × e) (5) about 14,605 kg in 2014 in contrast to 9,830 kg in 2010.
Additionally, goods vehicles and buses produced CO
where, emissions of 72 kg and 69 kg in 2010, respectively, from
EP = Total emissions E of a pollutant p; which the numbers had slightly increased to 79 kg and 70 kg,
N = Number of vehicles (unit); respectively, in 2014. Similarly, NOx also accounted for the
Table 1. Energy use for fuel type and motor vehicle (ES) in ktoe.
Motor vehicle 2010 2011 2012 2013 2014
Motorcycles (petrol) 9560 8155 10843 12656 12705
Private cars (petrol) 9560 8155 10843 12656 12705
Buses (diesel) 8388 8712 9410 9568 10161
Goods transport (diesel) 8388 8712 9410 9568 10161
Source: Malaysian Energy Commission, 2017.Mohd Shafie and Mahmud, Aerosol and Air Quality Research, 20: 2793–2804, 2020 2797
Table 2. Emission per unit energy of fuel type for petrol and five years with newer engine technology can reduce CO and
diesel (FE) (kg GJ–1). NOx emissions by 71% and 10%, respectively (Clark et al.,
Emission 2002).
Fuel Type Taxi was excluded in this study, where it cumulatively
CO NOx
accounted for only 335 units in 2010, which increased to 336
Petrol 3.490 1.368
units in 2014, through the use of natural gas (natural gas
Diesel 0.102 0.284
vehicles or NGV) in Kuala Lumpur. Furthermore, the rapid
growth of mobile technology and smartphone applications
Table 3. Emission factor for PM10 emission from exhaust significantly led various companies to develop relationships
according to fuel type and motor vehicles classes. with consumers through mobile applications (Zhang, 2017;
Motor vehicle class EF (g km–1) Chin and Lai, 2018). For example, MyTeksi was introduced
Private cars (petrol) 0.06 in Kuala Lumpur and was subsequently branded as GrabTaxi
Motorcycles (petrol) 0.06 in 2011. Then, GrabCar was officially launched in Malaysia
Buses (diesel) 0.025 following the increasing use of GrabCar due to usage of
Goods vehicle (diesel) 0.025 safety, time efficiency, and convenience to passengers and
drivers alike in 2014 (Jayaraj et al., 2019).
In Malaysia, Grab was launched in 2012 as a third-party
high emission from private cars and motorcycles with 5,726 kg taxi e-hailing mobile application (Lin and Dula, 2016). Report
and 1,750 kg compared with 3,854 kg and 1,200 kg, from The Land Public Transport Commission (SPAD)
respectively, from 2010 to 2014 (Table 5). summarized that 80% of the public are more likely to use
The highest PM10 emissions in Kuala Lumpur were from Uber and GrabCar services due to high accessibility factors
private cars and motorcycles during peak hours at 0700 to (New Straits Times, 2017). Today, Grab is the best platform for
0900 and at around 1700 hr to 2000 hr in the morning and driving individual day trips mostly for drivers and passengers
evening, respectively (Azhari et al., 2018). This significantly to choose and use the Grab application in Southeast Asia.
increased the emissions due to the minimum speed limits of Therefore, using taxis for mobility is deemed impractical and
the vehicles and stop-and-go vehicle in traffic lights not the popular choice for Kuala Lumpur residents.
(Madireddy et al., 2011). Individual attitude and driving The Organisation for Economic Co-operation and
patterns, characteristics and types of vehicles, the physical Development (OECD, 2019) also released information on
aspect of road surface, average vehicle speed, as well as the road transport emissions of CO, NOx, and PM10 (Table 6).
traffic conditions all affect the rate of emissions (Barth and The list of countries included for comparison are Germany,
Boriboonsomsin, 2009). which represents an industrialised European nation; Chile and
Generally, CO and NOx pollutants are emitted from fuel New Zealand, which represent the countries in the Southern
consumption in vehicle movement process, with diesel fuel Hemisphere; while Japan and Korea represent the Asian
producing higher emissions than petrol. However, the Pacific countries. No information is available for ASEAN
emission from petrol fuel is also attributed by the high countries. Germany recorded the high emissions of PM10,
number of motor vehicles compared with goods vehicles NOx, and CO in 2010 but displayed a decreasing trend in
that consume diesel in Kuala Lumpur. Vehicles of less than 2014. Asian countries, such as Korea, also showed a similar
2014
2013
2012
2011
2010
0 500000 1000000 1500000 2000000 2500000
Goods vehicle Buses Private cars Motorcycles
Fig. 2. Annual total ownership registration of motor vehicles in Kuala Lumpur (2010–2014).2798 Mohd Shafie and Mahmud, Aerosol and Air Quality Research, 20: 2793–2804, 2020
Table 4. Annual vehicle kilometer travelled (VKT) in Kuala Lumpur (2010–2014).
Vehicle Class Total vehicle registered (unit) Averaged annual VKT (km)
2010
Motorcycles 1,094,113 14,658,117
Private cars 1,960,081 26,259,715
Buses 9,601 1,286,27
Goods vehicle 97,611 1,307,720
2011
Motorcycles 1,143,270 15,316,686
Private cars 2,0736,15 27,780,760
Buses 9,611 128,761
Goods vehicle 98,505 1,319,697
2012
Motorcycles 1,204,920 16,142,627
Private cars 2188458 29,319,341
Buses 9616 128,828
Goods vehicle 99467 1,332,585
2013
Motorcycles 1,270,871 17,026,190
Private cars 2,301,385 30,832,254
Buses 9,629 129,002
Goods vehicle 100,890 1,351,650
2014
Motorcycles 1,317,578 17,651,935
Private cars 2,382,526 31,919,321
Buses 9,656 129,364
Goods vehicle 102,364 1,371,397
Table 5. Gaseous and PM10 emissions (kg) from new registered vehicles in Kuala Lumpur (2010–2014).
Pollutant Class/Years 2010 2011 2012 2013 2014
PM10 Private cars 117605 124417 131307 138083 142952
(exhaust) Motorcycles 65647 68596 72295 76252 79055
Buses 240 240 240 241 241
Goods vehicle 2440 2463 2487 2522 2559
Total 185932 195716 206330 217098 224807
PM10 Private cars 176407 186625 196961 207125 214427
(non-exhaust) Motorcycles 98470 102894 108443 114378 118582
Buses 864 865 865 867 869
Goods vehicle 8785 8865 8952 9080 9213
Total 284527 299250 315221 331450 343091
CO Private cars 9830 11003 12323 13628 14606
Motorcycles 3061 3344 3735 4154 4465
Buses 70 69 70 70 71
Goods vehicle 72 73 75 77 79
Total 13034 14490 16203 17930 19220
NOx Private cars 3854 4314 4832 5344 5727
Motorcycles 1200 1311 1465 1629 1751
Buses 193 191 194 194 195
Goods vehicle 200 203 207 213 220
Total 5448 6020 6698 7380 7893
trend, where the CO and NOx emissions in 2010 had further number compared with other OECD countries for PM10,
reduced to 409.218 thousand tonnes and 335.721 thousand while the annual newly registered vehicles in Kuala Lumpur
tonnes in 2014, respectively. Improved green technology represent approximately 6% of the emissions. The
can be attributed to the declining trend of emissions. increasing trend is small compared with other OECD
For Malaysia, the emission data obtained from the nations. As a developing country, Malaysia displayed higher
Department of Environment had shown a significantly lower CO emissions from the transport sector at 1,597 tonnes inMohd Shafie and Mahmud, Aerosol and Air Quality Research, 20: 2793–2804, 2020 2799
Table 6. Comparison of road transport emissions (thousand tonnes) in Malaysia and selected OEDC countries (2010–2014).
New Kuala
Pollutant Year Germany Canada Iceland Chile Japan Korea Malaysia
Zealand Lumpur
PM10 2010 34.41 33.88 0.19 1.88 NA 15.26 NA 4.49 0.003
2011 33.47 32.90 0.17 1.86 NA 13.03 NA 4.44 0.003
2012 31.95 31.80 0.17 1.77 NA 12.97 NA 4.59 0.003
2013 31.07 31.49 0.16 2.26 NA 12.10 NA 4.34 0.003
2014 30.30 30.06 0.15 2.54 NA 10.02 NA 4.27 0.003
NOx 2010 537.08 562.68 3.00 61.19 397.55 368.05 69.38 213.79 0.005
2011 523.16 550.22 2.58 65.40 410.90 382.23 71.41 216.43 0.006
2012 506.13 529.67 2.40 66.76 371.21 322.31 72.33 226.21 0.007
2013 495.61 492.88 2.34 75.58 339.06 345.67 72.35 220.79 0.007
2014 493.12 469.02 2.37 80.37 313.92 335.72 73.69 223.05 0.008
CO 2010 971.93 2,318.37 9.43 305.69 618.92 583.72 519.98 1597.96 0.013
2011 907.01 2,209.95 8.07 469.42 1,092.91 520.39 524.09 1671.00 0.014
2012 884.37 2,011.03 7.21 480.02 944.54 463.54 516.13 1779.40 0.016
2013 826.04 1,902.77 6.38 360.70 973.83 442.67 505.93 1786.40 0.018
2014 805.88 1,860.25 5.93 285.03 843.51 409.22 503.89 1850.57 0.019
NA: Not available.
2010 and 1,850 tonnes in 2014 (DOE, 2011, 2015). The (Bernama, 2019).
increasing trend of CO and NOx emissions is mainly due to Malaysia should follow the industrialised OECD countries
the increase in total motor vehicles, which mostly consume that had successfully reduced GHG and air pollutants from
fossil fuel. the road transport over the past ten years. Incentives for tax
Malaysia should adopt more green transport initiatives credits for those using green technologies, such as electric
since the trend of emissions of pollutants from the vehicles, should encourage more consumers to use affordable
transportation sector in Malaysia is on the increase compared green vehicles that consume less fuel. The Malaysian Green
to other OEDC countries. Currently, approximately 90 percent Technology Corporation (MTDC) was charged to install
of vehicles are fossil-fueled, hence the low number of 3,000 charging sites in government buildings, petrol stations,
environmental-friendly electric vehicles of less than 6,000 and shopping malls by 2018 to encourage for e-mobility of
units on Malaysia roads (Md Khalili, 2019). China leads the electric cars (Aswan, 2019), of which there were only 5,403
market for electric vehicles with 2.3 million in 2018, efficiency vehicle (EV) cars in March 2019. This is still below
followed by 1.3 million in Europe (IEA, 2019). In the US the target set by the National Electric Mobility Blueprint (2015)
and Europe, mobile source emission controls such as projection of 125,000 charging stations by 2030, where power
exhaust after-treatment technologies for diesel and petrol supply for customers remains a problem (Zainuddin, 2019).
vehicles that meet strict regulations have reduced emission Incentives were also given on energy efficiency vehicles
(Winkler et al., 2018). Stricter Euro 6 emission limits for (EEVI) and plug in hybrid efficiency vehicles (PHEV) as was
petrol and diesel were imposed in Europe since 2015 (The implemented successfully in other Asian countries (China,
Automobile Association, 2020). Policies in some OECD Japan, India), Europe, and the USA. However, the growth of
countries to reduce emissions include a zero-emissions the EV industry in Malaysia is hampered by factors such as
vehicles (ZEVs) mandate in Canada by 2030, while in Korea high price, slow infrastructure implementation, and
initiatives include national subsidies for low-carbon vehicle technological limitation (Frost and Sullivan, 2019). Even the
purchases in 2018, abatement and subsidies on vehicle taxes, move by the Government of the United Kingdom to ban new
decreased road tolls and municipal parking rates (IEA, sales of diesel vehicles by 2040 to achieve a sustainable,
2019). zero-carbon road transport system is considered too late by
Some of the reasons why the usage of electric cars is in some (Shammut et al., 2019).
low demand is due to the limited options of cars available, EVs offer zero CO2 tailpipe emissions and the highest
the expensive price tag of the cars from the tax of imported energy efficiency compared to a fuel-based car that produced
vehicles imposed by the Malaysia government, the lack of 152 g km–1, a saving of 1.7 million tonnes of CO2 (GreenTech,
public awareness on the importance of green technology and 2015). Among the positive impacts of electric vehicles (EV)
environmental-friendly modes of transport (Bernama, 2019). are the decline in human toxicity exposure to ozone, and
In order to achieve a green technology nation, the reduction in particulate matter formation which improves air
government needs to implement comprehensive initiatives to quality as EV performs 8 times better than the Euro 6 diesel
achieve these targets such as those outlined in the National vehicles (Hooftman et al., 2016).
Electric Mobility Blueprint (2015–2030) (GreenTech, 2015). It is estimated that a battery electric vehicle (BEV) produces
By 2030, the government aspires to attain 100,000 electric lower NOx emission of 36 mg km–1 (based on 2016 US
cars; 100,000 electric motorcycles and 2,000 electric buses electric grid) compared to Euro 6 petrol of 60 mg km–1. Green
on Malaysian roads, as well as 125,000 charging stations vehicles will emit zero particulates and CO compared to the2800 Mohd Shafie and Mahmud, Aerosol and Air Quality Research, 20: 2793–2804, 2020 0.3 mg km–1 emission of particulates and 500 mg km–1 of Diesel Euro 2 (EDE2) significantly improved the engine fuel CO from the Euro 6 petrol (Winkler et al., 2018). The consumption by 7.39% and for exhaust emissions, EDE2 emission reduction potential from the transportation sector produced slightly higher NOx and CO in Malaysia. In addition, would be beneficial to Malaysia environmentally when there the U.S. EPA informed that approximately 2% of sulphur is mass usage of EV as the air quality will be improved from from diesel fuel also produces PM emission (Stanislaus et zero emission of CO and particulate matter, and NOx al., 2010). emission that will be halved. Malaysia introduced the Euro 2M fuel Standard in 2009, Kuala Lumpur City Hall (KLCH) is a member of the C40 whereby the fuel properties are controlled by the Cities Climate Leadership. Indeed, the issue of climate Environmental Quality (Control of Petrol and Diesel change has significantly encouraged the development of Properties) Regulations 2007 (Environmental Quality Act more intensive, practical, and integrated acts, policies, and 1974, 1974). Since then, all oil companies in Malaysia were strategies by policymakers and stakeholders in Malaysia. required to upgrade their fuel quality to comply with the Euro The Kuala Lumpur Low Carbon Society Blueprint 2030 was 2 Standard. Formerly, the sulphur limit was 3,000 ppm for developed as its commitment to reduce emissions by 70% diesel and 1,500 ppm for gasoline (Asian Development by 2022 against 2015 levels (Ho et al., 2018). This amounts Bank 2006). Hence, the Malaysian government recommends to a decrease in cumulative emissions of 134,345 tCO2e and lower sulphur to ensure that vehicles use fuels that comply a financial saving in energy cost of RM76.1 million over this with the Euro 2 Standard. On the other hand, growth in vehicle period of time. Some of the national policies in place include numbers and modern emission reduction technology demand the national target of 40% emissions intensity reduction, an adequate supply of low sulphur fuel at levels of 50 ppm Renewable Energy Act, National Green Technology Policy, and 10 ppm. However, Malaysia moved towards Euro 4 National Energy Efficiency Plan, and National Policy on Standard implementations as the next step forward in fuel Climate Change. It has also committed to a target of 45% quality improvement. The Euro 4 Standard restricts sulphur carbon intensity reduction by 2030 (relative to 2005 levels) content to a maximum of 50 ppm in fuels (Ramalingam and (Kuala Lumpur City Hall, 2017). Fuad, 2014). In addition to the policies, the implementation of emission The diesel Euro 5M was introduced to the Malaysian reduction focusing on the petrol quality of Euro in Malaysia market by some oil and gas companies in 2016 (Atiqah et would be impactful in reducing the amount of air pollutants al., 2018). Diesel Euro 5M is a cleaner fuel due to its lower emitted to the surrounding environment with the content of sulphur compared with diesel Euro 2M (Stanislaus implementation of the two types of octane rating fuel for et al., 2015). The benzene level in the Malaysian Euro 4M petrol in Malaysia, namely RON95 and RON97. The Euro is specified at 3.5% by volume, in contrast to the Euro 4 4M RON97 commenced in September 2015, as well as the specification for a benzene content of 1% maximum by Euro 5 diesel since November 2014. Following the Malaysian volume (Asian Clean Fuel Association, 2012). The sulphur government’s directive for the implementation of Euro 4M content for Euro 4M was set at 50 ppm, similar to Euro 4. by 1 January 2020, petrol operators such as Shell, Caltex, The NOx emissions for Euro 4M is capped at 0.15 g km–1 for Petron and Petronas have introduced the new fuel standard petrol passenger cars, in comparison to the equivalent of RON95 petrol at their stations. The price of RON95 had figures for Euro 4 at 0.08 g kg–1 or the more stringent Euro 5, increased steadily since it replaced the lower octane RON92 with NOx emission capped at 0.06 g km–1 (Asian Clean Fuel in 2008 due to the gradual reduction in fuel subsidies by the Association, 2012). government (The Central Bank of Malaysia, 2011; Omar Kamil, 2015; Shaari et al., 2018; Yunus et al., 2019). Uncertainty The RON95 petrol produced lower NOx emissions by Among the uncertainties that arise from this study is that 7.7% compared to RON97 but produced higher emissions of only the new motor vehicles registered in the Kuala Lumpur CO (36.9%) and HC (20.3%) (Salleh et al., 2018). The CO metropolitan area are considered, which is a small scope on emission from RON97 is also reduced from 4% to 3%, while the air quality study of pollutant emissions from motor vehicles the reduction from RON95 petrol is from 3% to 2.8% based for a short period from 2010 to 2014. Notwithstanding, this on the fuel characteristics such as density, octane number study does not focus on the older motor vehicles, where age and lower heating value (Salleh et al., 2018). Engine speed is identified as a major contributor to pollution emissions also reduces the CO emissions from the RON95 petrol by (Caserini et al., 2013), rather, this study examines the fuel 10% lower than the RON97 petrol. consumption in the process of vehicle movement. Zachariadis The sulphur limit for petrol and diesel in Malaysia was et al. (2001) assumed that both the specific mileage, for still high at 500 ppm in 2007, which coincides with the example, kilometre per vehicle, and the emission factors are Euro 2 Standard (Atiqah et al., 2018). Ramalingam and independent of vehicle age and therefore independent of Fuad (2014) found that 60% of diesel samples had sulphur time. Experimental emissions data from in-use cars indicated levels above 1000 ppm in 2006, followed by 67% in 2007 a clear deterioration in the emission behaviour as cars and 26% in 2009. However, the concentration of sulphur in became older, mainly because of the ageing of their catalytic all diesel samples in 2011, 2012, 2013 and 2014 were lower converters and degradation of their emission control systems than 500 ppm and this value was eight times higher than (Lawson, 1993; Samaras et al., 1998; Ntziachristos and Euro 4 Standards in Peninsular Malaysia (Ramalingam and Samaras, 2000). Therefore, age and technological changes Fuad, 2014). Atiqah et al. (2018) also summarized that determine the internal dynamics of the motor vehicle
Mohd Shafie and Mahmud, Aerosol and Air Quality Research, 20: 2793–2804, 2020                        2801

population and influence the environmental impact of road         vehicle fuelled with non-surfactant low grade diesel
transport in various ways. Uncertainty also arises from the       emulsion compared with a high grade diesel in
average vehicle mileage travelled from the mileage variation,     performance and emissions of light-duty diesel vehicle
which is estimated up to 3% for NOx and approximately             fuelled with non-surfactant low grade diesel emulsion
12% for CO as well as the emission factors that also              compared with a high grade diesel in Malaysia. Energy
contribute to the uncertainty in calculating the emission of      Convers. Manage. 130: 192–199. https://doi.org/10.1016/
pollutants (Baidya and Borken-Kleefeld, 2009).                    j.enconman.2016.10.057
                                                                Azam, M., Othman, J. and Ara, R. (2016). Energy consumption
CONCLUSION                                                        and emission projection for the road transport sector in
                                                                  Malaysia: An application of the LEAP model. Environ.
   Urban traffic pollution has resulted from various factors      Dev. Sustain. 18: 1027–1047. https://doi.org/10.1007/s10
such as urbanisation, population, and the economy of the          668-015-9684-4
country. The PM10 emissions from private cars contribute to     Azhari, A., Talib, M. and Fariz, A. (2018). Road traffic as
air pollution with 214,427 kg released in 2014. The highest       an air pollutant contributor within an industrial park
PM10 emission in Kuala Lumpur was contributed by private          environment. Atmos. Pollut. Res. 9: 680–687.
cars and motorcycles that resulted from traffic congestion,       https://doi.org/10.1016/j.apr.2018.01.007
differences of fuel characteristic in vehicle movement          Baidya, S. and Borken-Kleefeld, J. (2009). Atmospheric
processes, and morphology aspects of the urban background.        emissions from road transportation in India. Energy
The growth of EV industry in Malaysia should be encouraged        Policy 37: 3812–3822. https://doi.org/10.1016/j.enpol.20
by reducing the exorbitant price of cars, improving the           09.07.010
charging infrastructure, and through other strategies           Barth, M. and Boriboonsomsin, K. (2009). Traffic congestion
implemented by other nations, such as tax incentives on           and greenhouse gases. Access 35: 2–9. https://www.acce
green technological vehicles, which could be one of the           ssmagazine.org/fall-2009/traffic-congestion-greenhouse-
ways forward for government agencies to control the negative      gases/
impact of urban traffic pollution, especially towards human     Beelen, R., Stafoggia, M., Raaschou-Nielsen, O., Andersen,
health and urban community.                                       Z.J., Xun, W.W., Katsouyanni, K. and Hoek, G. (2014).
                                                                  Long-term exposure to air pollution and cardiovascular
REFERENCE                                                         mortality: An analysis of 22 European Cohorts.
                                                                  Epidemiology 25: 368–378. https://doi.org/10.1097/EDE.
Al-Arkawazi, S.A.F. (2019). The petrol fuel quality impact        0000000000000076
  on fuel consumption, air-fuel ratio (AFR), lambda (λ) and     Bernama (2019). Green transport the way forward.
  exhaust emissions of petrol-fueled vehicles. Cogent Eng.        https://www.nst.com.my/cbt/2019/10/530681/green-tran
  6: 1–22. https://doi.org/10.1080/23311916.2019.1616866          sport-way-forward
Alshehrya, A.S. and Belloumi, M. (2017). Study of the           Caserini, S., Pastorello, C., Gaifani, P. and Ntziachristos, L.
  environment Kuznets curve for transport carbon dioxide          (2013). Impact of the dropping activity with vehicle age
  emissions in Saudi Arabia. Renewable Sustainable Energy         on air pollutant emissions. Atmos. Pollut. Res. 4: 282–
  Rev. 75: 1339–1347. https://doi.org/10.1016/j.rser.2016.1       289. https://doi.org/10.5094/APR.2013.031
  1.122                                                         Chandran, V.G.R. and Foon, C. (2013). The impacts of
Anttila, P., Tuovinen, J.P. and Niemi, J.V. (2011). Primary       transport energy consumption, foreign direct investment
  NO2 emissions and their role in the development of NO2          and income on CO2 emission in ASEAN-5 economies.
  concentrations in a traffic environment. Atmos. Environ.        Renewable Sustainable Energy Rev. 24: 445–453.
  45: 986–992. https://doi.org/10.1016/j.atmosenv.2010.1          https://doi.org/10.1016/j.rser.2013.03.054
  0.050                                                         Cheah, L., Evans, C., Bandivadekar, A. and Heywood, J.
Architects and Urban Planners Malaysia (AJM) (2006).              (2008). Factor of two: Halving the fuel consumption of
  Kuala Lumpur Local Plan -Findings Report. Unpublished           New U.S. Automobiles by 2035. In Reducing climate
  report. Kuala Lumpur City Hall.                                 impacts in the transportation sector, Cannon, J. and
Asian Clean Fuel Association (2012). InFocus: Malaysia to         Sperling, D. (Eds), Springer, Dordrecht. http://web.mit.ed
  Implement Euro 4M in 2015. https://www.acfa.org.sg/pdf/         u/sloan-auto-lab/research/beforeh2/files/cheah_factorTwo.
  InFocus8%202012_06%20Malaysia.pdf                               pdf
Asian Development Bank (2006). Malaysia–Clean Air               Chin, T.A. and Lai, L.Y. (2018). Determinants of brand
  Initiative 2006. Country Synthesis Report on Urban Air          image and their impacts on purchase intention of Grab. J.
  Quality Management. Malaysia. Discussion Draft.                 Arts Soc. Sci. 2: 26–36. https://ruijass.com/wp-content/up
  https://www.cleanairnet.org/caiasia/1412/csr/malaysia.pdf       loads/2018/03/3-003TICFinal.pdf
Aswan, M. (2019). ChargEV is driving Malaysia’s electric        Clark, N.N., Kern, J.M., Atkinson, C.M. and Nine, R.D.
  vehicle infrastructure. Carlist, 13 September 2019.             (2002). Factors affecting heavy-duty diesel vehicle
  https://www.carlist.my/news/chargev-is-driving-malaysia-        emissions. J. Air Waste Manage. Assoc. 52: 84–94.
  s-electric-vehicle-infrastructure-66003/66003/                  https://doi.org/10.1080/10473289.2002.10470755
Atiqah, N., Jazair, W., Muhsin, A. and Hasannuddin, A.K.        Dargay, J., Gately, D. and Sommer, M. (2007). Vehicle
  (2018). Performance and emissions of light-duty diesel          ownership and income growth, worldwide: 1960-2030.
2802 Mohd Shafie and Mahmud, Aerosol and Air Quality Research, 20: 2793–2804, 2020 Energy J. 28: 143–170. https://www.jstor.org/stable/4132 Kuala Lumpur Low Carbon Society Blueprint 2030. KL 3125 City Hall, Kuala Lumpur. http://www.dbkl.gov.my/index. Department of Environment (DOE) (2011). Malaysia php?option=com_jdownloads&Itemid=692&view=finis environmental quality report 2011. Department of h&cid=874&catid=86&m=0&lang=ms Environment, Putrajaya, Malaysia. Hooftman, N., Oliveira, L., Messagie, M., Coosemans, T. Department of Environment (DOE) (2015). Malaysia and Van Mierlo, J. (2016). Environmental analysis of environmental quality report 2015. Department of petrol, diesel and electric passenger cars in a Belgian Environment, Putrajaya, Malaysia. urban setting. Energies 9: 84. https://doi.org/10.3390/en9 Department of Environment (DOE) (2017). Malaysia 020084 environmental quality report 2017. Department of Hu, C.Y., Gao, X., Fang, Y., Jiang, W., Huang, K., Hua, Environment, Putrajaya, Malaysia. X.G., Yang, X.J., Chen, H.B., Jiang, Z.X. and Zhang, X.J. Department of Statistics Malaysia (2011). Population (2020). Human epidemiological evidence about the distribution and basic demographic characteristics- association between air pollution exposure and gestational population and housing census of Malaysia 2010. diabetes mellitus: Systematic review and meta-analysis. Department of Statistics Malaysia. Putrajaya, Malaysia. Environ. Res. 180: 108843. https://doi.org/10.1016/j.envr EEA (2018). European Union Emission inventory report es.2019.108843 1990–2016 under the UNECE Convention on Long-range Huang, W., Guo, Y. and Xu, X. (2020). Evaluation of real- Transboundary Air Pollution (LRTAP). European time vehicle energy consumption and related emissions in Environment Agency. https://www.eea.europa.eu/publicati China: A case study of the Guangdong-Hong Kong- ons/european-union-emission-inventory-report-1990-2016 Macao greater Bay Area. J. Clean. Prod. 263: 121583. Energy Commission Malaysia (2014). National energy https://doi.org/10.1016/j.jclepro.2020.121583 balance 2014. https://meih.st.gov.my/documents/10620/ International Energy Agency (IEA) (2002). Oil information 5bb0f85c-fc99-4743-a8a9-8ee0d65f1299 2002. IEA/OECD, International Energy Agency (IEA), Environmental Quality Act 1974 (1974). Environmental Paris. Quality (Control of Petrol and Diesel Properties) International Energy Agency (IEA) (2019). World energy Regulations 2007. P.U. (A) 145/2007, Federal Subsidiary outlook 2019. International Energy Agency (IEA), Paris Legislation, Percetakan National Berhad, Lawnet. https://www.iea.org/reports/world-energy-outlook-2019 Frost and Sullivan (2019). Malaysian eMobility Sector in Jamhari, A.A., Sahani, M., Latif, M.T., Chan, K.M., Tan, the Context of Electric Vehicle (EV) Developments in H.S., Khan, M.F. and Tahir, N.M. (2014). Concentration Southeast Asia, Forecast to 2022. https://www.reportlink and source identification of polycyclic aromatic er.com/p05778491/Malaysian-eMobility-Sector-in-the-Co hydrocarbons (PAHs) in PM10 of urban, industrial and ntext-of-Electric-Vehicle-EV-Developments-in-Southeast- semi-urban areas in Malaysia. Atmos. Environ. 86: 16–27. Asia-Forecast-to.html https://doi.org/10.1016/j.atmosenv.2013.12.019 Ghaffarpasand, O., Beddows, D.C.S., Ropkins, K. and Pope, Jayaraj, M.D., Abu Hasan, Z.R. and Ahmad, N.M. (2019). F.D. (2020). Real-world assessment of vehicle air Grabcar: Opportunities and challenges for taxi operators. pollutant emissions subset by vehicle type, fuel and Euro Univ. Malaysia Terengganu J. Undergraduate Res. 1: 46– class: New findings from the recent UK EDAR field 55. http://umtjur.umt.edu.my/wp-content/uploads/sites/1 campaigns, and implications for emissions restricted 41/2019/06/JUR-5-GRABCAR-OPPORTUNITIES-AND- zones. Sci. Total Environ. 734: 139416. https://doi.org/1 CHALLENGES-FOR-TAXI-OPERATORS.pdf 0.1016/j.scitotenv.2020.139416 Jerrett, M., Burnett, R.T., Beckerman, B.S., Turner, M.C., Ghosh, S. (2010). Examining carbon emissions economic Krewski, D., Thurston, G., Martin, R., van Donkelaar, A., growth nexus for India: A multivariate co-integration Hughes, E., Shi, Y., Gapstur, S., Thun, M. and Pope III, approach. Energy Policy. 38: 3008–3014. https://doi.org/ C.A. (2013). Spatial analysis of air pollution and mortality in 10.1016/j.enpol.2010.01.040 California. Am. J. Respir. Crit. Care Med. 188: 593–599. GreenTech (2015). National Electric mobility blueprint; https://doi.org/10.1164/rccm.201303-0609OC positioning Malaysia as the ‘electric mobility Kakouei, A., Vatani, A. and Idris, A.K. (2012). An estimation marketplace. Malaysian Green Technology Corporation. of traffic related CO2 emissions from motor vehicles in https://rise.esmap.org/data/files/library/malaysia/RE/12. the capital city of Iran. Iran. J. Environ. Health Sci. Eng. 4%20page%2011.pdf 9: 1–13. https://doi.org/10.1186/1735-2746-9-13 Henschel, S., Tertre, A.L., Atkinson, R.W., Querol, X., Kuala Lumpur City Hall (2004). Kuala Lumpur Structure Pandolfi, M., Zeka, A., Haluza, D., Analitis, A., Plan 2020 (KLSP2020). Federal Town and Country Katsouyanni, K. and Bouland, C. (2015). Trends of Planning Department, Kuala Lumpur. nitrogen oxides in ambient air in nine European cities Kuala Lumpur City Hall (2017). Kuala Lumpur City Hall between 1999 and 2010. Atmos. Environ. 117: 234–241. Carbon Management Plan Draft 2017–2022. Federal https://doi.org/10.1016/j.atmosenv.2015.07.013 Town and Country Planning Department, Kuala Lumpur. Ho, C.S., Chau, L.W., Ling, H.T., Abdul Rahim, M.N., Laumbach, R.J. and Kipen, H.M. (2014). Respiratory health Zulibrahim, M.Z., Hishammuddin, M.A.H., Abdullah, R., effects of air pollution: Update on biomass smoke and Saari, N.S. and Jausus, N. (2018). 70 By 30. A Greener traffic pollution. J. Allergy Clin. Immunol. 129: 3–11. Better Kuala Lumpur. A summary for policymakers. https://doi.org/10.1016/j.jaci.2011.11.021
Mohd Shafie and Mahmud, Aerosol and Air Quality Research, 20: 2793–2804, 2020                       2803

Lawson, D.R. (1993). ‘Passing the test’- Human behaviour        Omar Kamal, S.M. (2015). Analysis of performance and
  and California’s smog check program. J. Air Waste               emission of different petrol fuel on small duty engine at
  Manage. Assoc. 43: 567. https://doi.org/10.1080/1073161         various ambient temperatures. Master Thesis of
  X.1993.10467226                                                 Mechanical Engineering. Universiti Tun Hussein Onn
Lin, M. and Dula, C. (2016). Grab taxi: Navigating new            Malaysia, Malaysia.
  frontiers. Asian Management Insights 3: 40–45.                Ong, H.C., Mahlia, T.M.I. and Masjuki, H.H. (2011). A
  https://ink.library.smu.edu.sg/sis_research/3433                review on emissions and mitigation strategies for road
Ling, H.L.O., Ting, K.H., Shaharuddin, A., Kadaruddin, A.         transport in Malaysia. Renewable Sustainable Energy Rev.
  and Yaakob, M.J. (2010). Air quality and human health in        15: 3516–3522. https://doi.org/10.1016/j.rser.2011.05.006
  urban settlement: Case study of Kuala Lumpur city. 2010       Public Work Department (2014). Road Traffic Volume
  International Conference on Science and Social Research         (RTMV). Ministry of Works, Malaysia
  (CSSR 2010), pp. 510–515. https://doi.org/10.1109/CSS         Ramalingam, M. and Fuad, A.A. (2014). Short
  R.2010.5773831                                                  communication: Sulphur levels and fuel quality in
Ling, H.L.O., Ahmad, S., Aiyub, K., Jani, Y.M. and Hwa,           Peninsular Malaysia. ASEAN J. Sci. Technol. Dev 32: 52–
  T.K. (2012). Urban air environmental health indicators          59. https://doi.org/10.29037/ajstd.11
  for Kuala Lumpur City. Sains Malays 41: 179–191.              Rostampour, V. (2010). The perth vehicle emissions
  http://journalarticle.ukm.my/3289/                              inventory      2006     –    2007:    Technical      report.
Luyten, L.J., Saenen, N.D., Janssen, B.G., Vrijens, K.,           https://www.der.wa.gov.au/images/documents/your-
  Plusquin, M., Roels, H.A., Debacq-Chainiaux, F. and             environment/air/publications/Perth_Vehicle_Emissions_
  Nawrot, T.S. (2018). Air pollution and the fetal origin of      Inventry_2006-2007.pdf
  disease: A systematic review of the molecular signatures      Saboori, B., Sapri, M. and Baba, M. (2014). Economic
  of air pollution exposure in human placenta. Environ. Res.      growth, energy consumption and CO2 emissions in OECD
  166: 310–323. https://doi.org/10.1016/j.envres.2018.03.         (Organization for Economic Co-operation and
  025                                                             Development)’s transport sector: A fully modified bi-
Madireddy, M., De Coensel, B., Can, A., Degraeuwe, B.,            directional relationship approach. Energy 66: 150–161.
  Beusen, B., De Vlieger, I. and Botteldooren, D. (2011).         https://doi.org/10.1016/j.energy.2013.12.048
  Assessment of the impact of speed limit reduction and         Saija, S. and Romano, D. (2002). A methodology for the
  traffic signal coordination on vehicle emissions using an       estimation of road transport air emissions in urban areas
  integrated approach. Transp. Res. Part D 16: 504–508.           of Italy. Atmos. Environ. 3636: 5377–5383. https://doi.org/
  https://doi.org/10.1016/j.trd.2011.06.001                       10.1016/S1352-2310(02)00488-0
Malaysian Energy Commission (2017). Malaysia energy             Salleh, M.R., Mahmud, A.J. and Khathri, A.M. (2018).
  statistics handbook 2017. https://meih.st.gov.my/docume         Experimental investigation the RON 95 and RON 97 on
  nts/10620/b1849938-e2e9-49fe-a789-9240df14cd75                  the performance and emissions. Polytechnic & Community
Masjuki H.H., Karim M.R. and Mahlia T.M.I. (2004).                Collage Journal of Engineering and Technology, Special
  Energy use in the transportation sector of Malaysia.            Issues on CoT 2018 22–33. http://myjms.moe.gov.my/in
  Consultancy Unit, University of Malaya, Kuala Lumpur.           dex.php/PMJET/article/view/3556
  https://www.scribd.com/doc/10049213/Energy-Use-in-            Samaras, Z., Zachariadis, T., Joumard, R., Vernet, I., Hassel,
  the-Transportation-Sector-of-Malaysia                           D., Weber, F.J. and Rijkeboer, R. (1998). Alternative
Mathew, T.V. (2014). Fuel consumption and emission                short test for inspection & maintenance of in-use cars with
  studies IIT. Bombay, pp. 1–25. https://www.civil.iitb.ac.i      respect to their emissions performance. Int. J. Veh. Des.
  n/~vmtom/nptel/583_FuelEmi/web/web.html                         20: 292–303. https://doi.org/10.1504/IJVD.1998.001837
Md Khalili, S.S. (2019). 5 reasons why you shouldn't dream      Shaari, M.S., Yusuf, A.H., Abashah, A. and Pei, T.L. (2018).
  of owning an electric vehicle in Malaysia. New Straits          Can retail selling prices of petrol and diesel trigger
  Times. https://www.nst.com.my/cbt/2019/08/509085/5-             inflation in Malaysia? MATEC Web of Conferences 150:
  reasons-why-you-shouldnt-dream-owning-electric-                 05070. https://doi.org/10.1051/matecconf/201815005070
  vehicle-malaysia                                              Shahbaz, M., Loganathan, N., Sbia, R. and Afza, T. (2015).
Mohd Shafie, S.H. (2019). Impact of traffic pollution on          The effect of urbanization, affluence and trade openness
  physical and social environment in Kuala Lumpur.                on energy consumption: A time series analysis in
  Unpublished PhD Thesis. Universiti Kebangsaan                   Malaysia. Renewable Sustainable Energy Rev. 47: 683–
  Malaysia.                                                       93. https://doi.org/10.1016/j.rser.2015.03.044
New Straits Times (2017). Grab Malaysia receives e-money        Shammut, M., Cao, M., Zhang, Y., Papaix, C. and Gao, Y.L.
  licence. https://www.nst.com.my/business/2017/12/3123           (2019). Banning diesel vehicles in London: Is 2040 too
  51/grab-malaysia-receives-e-money-licence                       late? Energies 12: 3495. https://doi.org/10.3390/en12183
Ntziachristos, L. and Samaras, Z. (2000). Speed dependent         495
  representative emission factors for catalyst passenger cars   Shehab, M. and Pope, F. (2019). Effects of short-term
  and influencing parameter. Atmos. Environ. 34/27: 4611–         exposure to particulate matter air pollution on cognitive
  4619. https://doi.org/10.1016/S1352-2310(00)00180-1             performance. Sci. Rep. 9: 8237. https://doi.org/10.1038/s
OECD (2019). Organization for economic co-operation and           41598-019-44561-0
  development statistic. https://stats.oecd.org                 Shuid, S. (2004). Urbanization and housing in Kuala
2804                      Mohd Shafie and Mahmud, Aerosol and Air Quality Research, 20: 2793–2804, 2020

  Lumpur city centre. 19th EAROPH World Planning and               Koutrakis, P., Zanobetti, A., Dominici, F. and Schwartz,
  Housing Congress 2004, Melbourne Australia. pp. 1–14.            J.D. (2019). Short-term exposure to fine particulate matter
  http://irep.iium.edu.my/4159/1/earoph2004.pdf                    and hospital admission risks and costs in the Medicare
Stanislaus A., Marafi, A. and Rana, M.S. (2010). Recent            population: Time stratified, case crossover study. BMJ
  advances in the science and technology of ultra low              367: l6258. https://doi.org/10.1136/bmj.l6258
  sulphur diesel (ULSD) production. Catal. Today 153: 1–         Winkler, S.L., Anderson, J.E., Garza, L., Ruona, W.C.,
  68. https://doi.org/10.1016/j.cattod.2010.05.011                 Vogt, R. and Wallington, T.J. (2018). Vehicle criteria
Su, J.G., Apte, J.S., Lipsitt, J., Garcia-Gonzales, D.A.,          pollutant (PM, NOx, CO, HCs) emissions: How low
  Beckerman, B.S., de Nazelle, A., Texcalac-Sangrador,             should we go? npj Clim. Atmos. Sci. 1: 23. https://doi.org/
  J.L. and Jerret, M. (2015). Populations potentially              10.1038/s41612-018-0037-5
  exposed to traffic-related air pollution in seven world        World Bank (2014). World Development Indicators. World
  cities. Environ. Int. 78: 82–89. https://doi.org/10.1016/j.e     Bank, Washington, US. https://datacatalog.worldbank.or
  nvint.2014.12.007                                                g/dataset/world-development-indicators
Su, W., Wu, X., Geng, X., Zhao, X., Liu, Q. and Liu, T.          World Health Organization (WHO) (2018). World health
  (2019). The short-term effects of air pollutants on              statistics 2018: Monitoring health for the SDGs,
  influenza-like illness in Jinan, China. BMC Public Health        sustainable development goals. World Health Organization.
  19: 13–19. https://doi.org/10.1186/s12889-019-7607-2             https://apps.who.int/iris/handle/10665/272596
Teriman, S., Yigitcanlar, T. and Mayere, S. (2010). Chapter      Wu, L., Ci, Y., Wang, Y. and Chen, P. (2020). Fuel
  11 Sustainable urban infrastructure development in South         consumption at the oversaturated signalized intersection
  East Asia: Evidence from Hong Kong, Kuala Lumpur and             considering queue effects: A case study in Harbin, China.
  Singapore. In Sustainable urban and regional                     Energy 192: 116654. https://doi.org/10.1016/j.energy.20
  infrastructure development: Technologies, applications           19.116654
  and management, Yigitcanlar, T. (Ed.), pp. 152–164, IGI        Yang, Z., Liu, Y., Wu, L., Martinet, S., Zhang, Y. and Andre,
  Global, Information Science Reference, United States of          M. (2020). Real-world gaseous emission characteristics
  America. https://doi.org/10.4018/978-1-61520-775-6.ch011         of Euro 6b light-duty petrol- and diesel-fueled vehicles.
The Automobile Association (2020). EURO Emissions                  Transp. Res. D 78: 102215. https://doi.org/10.1016/j.trd.2
  Standards. Limits to improve air quality and health.             019.102215
  https://www.theaa.com/driving-advice/fuels-environment/        Yunus, S.M., Hodin, N.S., Zulkifli, F.H., Mustaffa, N. and
  euro-emissions-standards                                         Osman, S.A. (2019). FMC the comparative analysis
The Central Bank of Malaysia (2011). Central Bank of               between gasolines RON95, RON97 and RON100 on
  Malaysia Annual Report 2010. Kuala Lumpur: Central               engine performance. Fuel, Mixture Form. Combust. Proc.
  Bank of Malaysia Publishing. https://www.bnm.gov.my/i            1: 1–7. https://fazpublishing.com/fmc/index.php/fmc/art
  ndex.php?ch=en_publication&pg=en_ar&ac=16&lang=en                icle/view/12
Thorpe, A. and Harrison, R.M. (2008). Sources and                Zachariadis, T., Ntziachristos, L. and Samaras Z. (2001).
  properties of non-exhaust particulate matter from road           The effect of age and technological change on motor
  traffic: A review. Sci. Total Environ 400: 270–282.              vehicle emissions. Transp. Res. Part D. 6: 221–227.
  https://doi.org/10.1016/j.scitotenv.2008.06.007                  https://doi.org/10.1016/S1361-9209(00)00025-0
U.S. Energy Information Administration (EIA) (2004).             Zainuddin, A. (2019). Electric vehicles gain momentum in
  DOE: http://www.eia.doe.gov/emeu/ipsr/contents.html              Malaysia, but power supply remains a problem. The
U.S. Energy Information Administration (EIA) (2005).               Malaysian Reserve. https://themalaysianreserve.com/201
  Household vehicles energy use: Latest data & trends.             9/07/03/electric-vehicles-gain-momentum-in-malaysia
  DOE/EIA-0464-2005. Energy Information Administration           Zhang, T., Omran, B.A. and Cobanoglu, C. (2017). Generation
  (EIA), U.S. Department of Energy. U.S. Department of             Y’s positive and negative eWOM: Use of social media
  Energy, Washington D.C. https://www.eia.gov/consump              and mobile technology. Int. J. Contemp. Hosp. Manage.
  tion/residential/pdf/046405.pdf                                  29: 732–761. https://doi.org/10.1108/IJCHM-10-2015-0611
U.S. Energy Information Administration (EIA) (2014).             Zhu, W., Wang, J., Zhang, W. and Sun, D. (2012). Short-
  Short-term Energy Outlook (STEO). https://www.eia.go             term effects of air pollution on lower respiratory diseases
  v/outlooks/steo/archives/jun14.pdf                               and forecasting by the group method of data handling.
United States Environmental Protection Agency (U.S. EPA)           Atmos. Environ. 51: 29–38. https://doi.org/10.1016/j.atm
  (2011). Compilation of Air Pollutant Emission Factors,           osenv.2012.01.051
  Volume I: Stationary Point and Area Sources AP-42.
  United States Environmental Protection Agency, USA.
United Nations (UN) (1991). Energy Statistics: A Manual                              Received for review, February 24, 2020
  for Developing Countries, Series F, No. 56, United                                           Revised, September 14, 2020
  Nations, New York.                                                                            Accepted, October 12, 2020
Wei, Y., Wang, Yan, Di, Q., Choirat, C., Wang, Yun,
You can also read