A briefing by - Transport & Environment
←
→
Page content transcription
If your browser does not render page correctly, please read the page content below
1
a briefing by
Europe’s giant ‘taxi’ company:
is Uber part of the problem or
the solution?
Summary

    Uber has been expanding rapidly in Europe. New evidence suggests that Uber is adding extra vehicle
    trips to urban roads which are overwhelmingly diesel-powered. Data on the number of Private Hire
    Vehicle (PHV) licences delivered in at least two major EU cities - the legal category Uber drivers fall into
    in most European countries - shows that the availability of ride-hailing apps like Uber has been
    accompanied by a rapid increase in the number of PHV drivers.

    Today taxi services account for between 10% and 20% of urban traffic in cities despite only representing
    a few percent of the number of vehicles i. Historically the number of taxis in European cities was limited
    due to the licensing system. But in only a few years, Uber has revolutionised the sector. It has attracted
    tens of thousands of partner drivers who offer passengers rides through the app in large urban areas.
    The data indicate most of these drivers are new drivers, meaning the stellar increase in Uber drivers has
    not been offset by a similar reduction in taxi licences. Based on available data Uber market entrance did
    not accelerate the reduction of car trips in London and Paris. For instance, recent PHV registration data
    from Paris and London point to an increase of about 10 000 and 25 000 licences respectively in the past
    five years. In parallel, since the arrival of Uber in London car trips and the number of taxi licences
    remained more or less stable. This indicates that the convenience of door-to-door, app-based trip
    booking makes travelling by (hired) cars in cities more and more popular, risking a reversal of a 15 year
    trend of reducing car trips in cities.

    The uptake of ride-hailing services across EU cities also poses a risk to the fight against pollution and
    climate changing emissions. Based on PHV fleet composition in the country, T&E estimates that Uber
    operations in the urban areas of London, Paris, and Brussels combined contribute around 525 kt CO2
    per year - as much as a quarter of a million average cars 1, which runs counter the cities’ ambitions to
    reduce their climate footprint. Worse, these extra kilometres have mostly been added by diesel cars. In
    France, 90% of private hire vehicles are diesel powered ii exacerbating air quality problems, as evidence
    has shown that internal combustion engines are sources of harmful pollution iii. Only in London, where
    it is mandatory, Uber is making an effort to shift to cleaner, electric-powered vehicles.

    Uber recently went through its initial public offering (IPO) and valued at $49bn in October 2019. iv It is
    not currently profitable but investors expect Uber to grow rapidly and to become profitable by
    increasingly monopolising taxi and associated mobility services. In its initial public offering (IPO)
    documentation Uber announced it seeks in the near term to capture a market of 4.7 trillion miles
    globally, a 20% increase compared to its current market share. Of the six key markets it plans to expand
    it, three are European (Spain, Italy and Germany)v.

    If Uber continues its current business practice of adding more combustion engine cars and fossil-
    powered kilometres in our cities, it is an obstacle to the transition to green and sustainable cities in
    Europe. But Uber could also “do the right thing” as it promised in its IPO and choose to become part of

1
 The average car in the EU emits 1.8 t/CO2 year. Car CO2 Emissions from cars: the facts (2018). Page 15 Figure 10.
Available:
https://www.transportenvironment.org/sites/te/files/publications/2018_04_CO2_emissions_cars_The_facts_report_final_0
_0.pdf

                                                                                                                   2
                                                                   a briefing by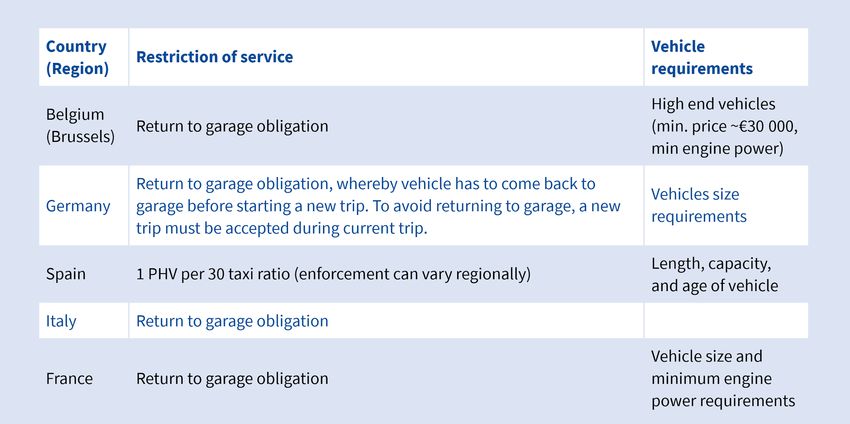
the solution. This would require it to stop adding fossil-fuelled cars to city roads and to rapidly electrify
   its existing fleet. Given that hundreds of affordable plug-in models are coming to the market, and that
   there’s an excellent business case for ultra-high mileage (60 000km/year) cars this is eminently feasible.
   In exchange cities should rapidly roll out dedicated fast charging infrastructure for Ubers and Taxis. But
   Uber should also genuinely start contributing to a reduction in car travel in cities, offering and promoting
   shared/pooled rides, sharing (real time) data and closely integrating its services into existing public
   transport networks rather than competing with them as it announced it would in its IPO.

1. Introduction
Since Uber began operating in Europe, it has been the centre of media attention and has raised a lot of questions
and concerns about their business model and the social impacts of the company, including workers’ rights. Less
in the spotlight, the rapid growth of Uber and of transportation network companies (TNCs) more generally around
the world, has also led to increased scrutiny about their impact on congestion and emissions. A mounting set of
evidence that document the negative effects of Uber on emissions and congestion in the US is already available vi.
However, similar data has so far lacked in a European context, which this briefing brings to light.

This briefing draws on the Uber experience in Europe so far - looking especially at the company’s biggest markets
Paris and London - to estimate the company’s impact on kilometres driven and associated CO2 emissions. Since
Uber indicated that it intends to expand into several new and existing markets, notably in cities in Germany, Italy,
and Spain, the paper provides insights on the potential impacts for other European cities in Uber’s sight should
they and their competitors significantly scale up there.

2. Regulation of taxi and private hire vehicles (PHVs) in EU
   Member States - an overview
To best assess the impact of Uber rides in European cities, it is important to understand the regulatory
environment in which the company operates. While in the US - where regulations are less restrictive on TNC
operations - the most popular way of taking an Uber is UberPoP, the company has suspended this service in many
EU countries following a backlash with national regulators that often set higher social, vehicle, and operational
standards. UberPoP allows private individuals to provide ride hailing services, without any specific licensing
obligations.

Table 1 provides an overview of the different requirements that drivers working for services such as Uber must
comply with, highlighting the fragmented situation across countries compared to other markets, such as the US.

                                                                                                                   3
                                                                  a briefing by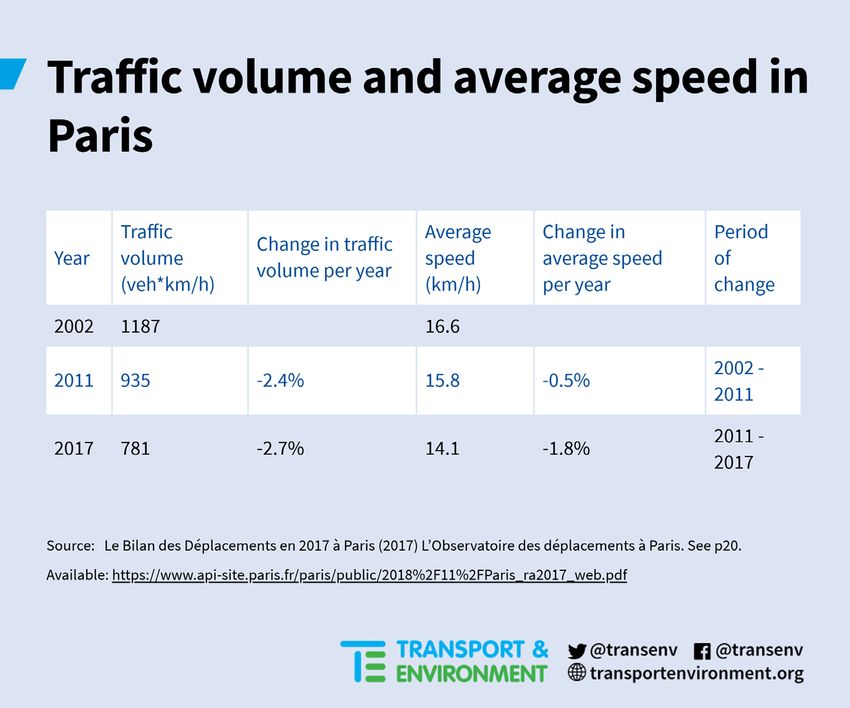
Table 1: Details of PHV service restrictions in several EU countries 2

Uber’s most common service in Europe is UberX, whereby enlisted drivers must be registered as licensed
professionals. This legal obligation means that in Europe - despite steady growth - the supply of Uber drivers is
more limited than in the US.

Transport Network Companies’ (TNC) business models, or Uber-like services, in Europe are closest to the PHV
category that exists in many in Member States’ alongside the taxi category. TNC services are pre-booked door-
to-door transport services, with flexible fares that are indicative at the time of booking. However, TNCs and PHVs
also differ in particular with regards to the employment relationship between drivers and the PHV operator or
TNC: as illustrated in the Figure 1, TNC drivers are considered as independent partners, whereas PHV drivers are
mostly employed. In Europe, the so-called TNC partner drivers are often either self-employed, or employed by a
PHV company working with the Uber app. In some cases such as in Torino, Italy vii, or in Germany viii, the Uber app
can be used to match customers with traditional taxi drivers.

Taxi and PHV regulation confer specific privileges to each category. Taxis must typically have a dedicated taxi
license (or medallion) to operate in a given city and can wait for customers at taxi stands or be hailed on the streets,
a privilege that is not shared with PHVs. On the contrary, PHVs don’t need a taxi license but must be booked in
advance by the client – via the app in the case of Uber.

2
    See Appendices for sources.

                                                                                                                   4
                                                                   a briefing by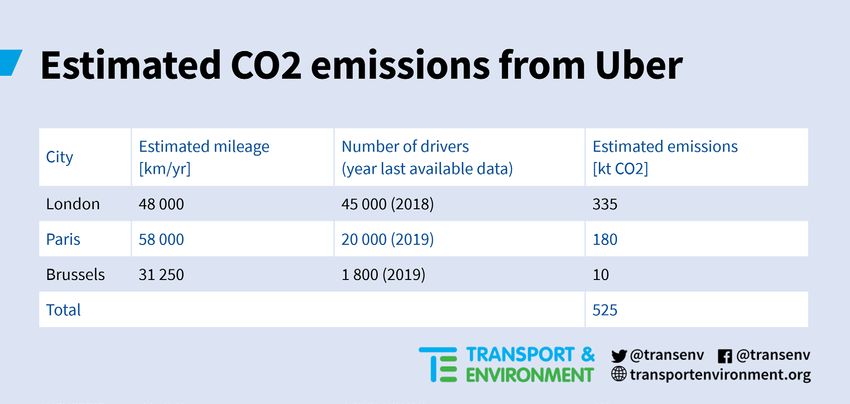
Figure 1. Legal and operational differences between door-to-door mobility providers by passenger
vehicles.

UberX is not the only door-to-door service available on the Uber app in Europe. Additional services include
UberPool, enabling customers to share rides with strangers. This service is widely available in the US but less so in
Europe, because of the national and local rules of operations (e.g. it is for the moment not available in Germany,
the Netherlands, or Belgium). The complexity of regulations framing Uber’s operations in Member States is
illustrated by a recent court case in Germany. Despite a judgement by the Court of Cologne forbidding the use of
UberX over infringement of the German passenger transportation act (Personenbeförderungsgesetz), the
company is still providing its services in the countryix.

Uber is not the only TNC app available in Europe, but its popularity in cities such as Paris and London indicates the
company’s overwhelming success. Based on a sample data for January 2019, the number of times different TNC
apps were opened in Paris was used as a proxy to estimate the most popular ride hailing app. The survey showed
that participants opened the Uber app more than 8 times the competitor apps such as Heetch, Bolt, or Kapten. 3
This should serve as a warning for what could happen to urban mobility systems if one TNC were to reach a near
monopolistic position. There is a risk that users booking trips for all their mobility needs through one app would
only access a curated mobility offer - so-called walled gardens - that don’t necessarily reflect the most sustainable
or cost-effective available option. Companies like Uber integrate many services in their app, ranging from
personal mobility (JUMP) to food delivery (UberEats), which could exacerbate the ‘walled garden’ phenomenon.

3
 Survey of 25 000 people. Report on the results of the survey available:
https://www.journaldunet.com/economie/transport/1423222-vtc-qui-a-la-plus-grosse-audience-en-france/

                                                                                                                5
                                                                 a briefing by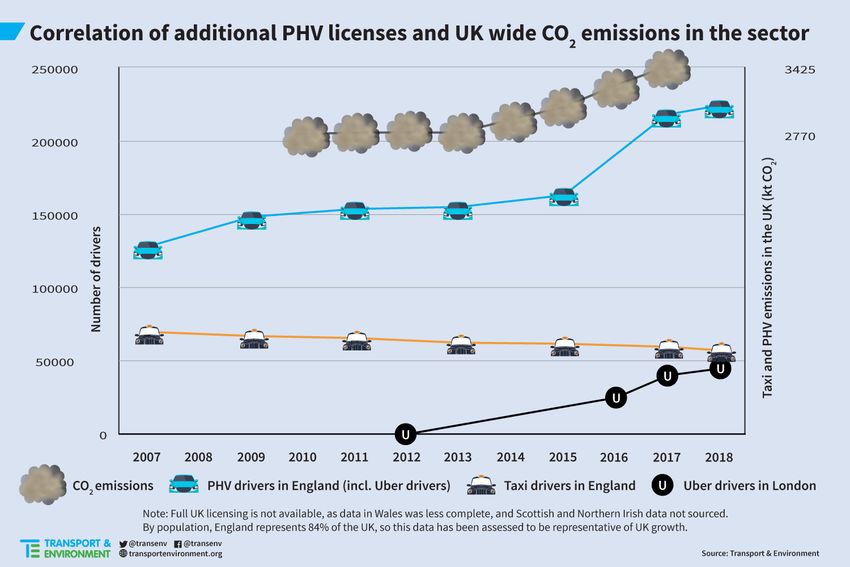
3. EU evidence: Increase in number of PHV licences since Uber
entered EU markets
T&E commissioned market research firm Euromonitor to compile evidence of taxi and PHV operators, including
Uber, from publicly available information. One of the findings of this study, is that the available information is
often fragmented and not available in general city or country wide traffic or taxi statistics. This seems to indicate
that many European cities themselves cannot fully appreciate the impact of Uber and other new PHV services on
their streets. The study indicates that Uber is a key player in all the markets analysed. London and Paris have
significantly more available data on PHV operations. This section draws on data from these cities and reflects on
the best available data found from other markets.
Uber’s impact on new licences
In the largest EU markets for Uber - London and Paris - the number of PHV licences delivered since Uber has been
operating over the past 7 years has significantly increased. The London case is illustrated in Figure 2 below:
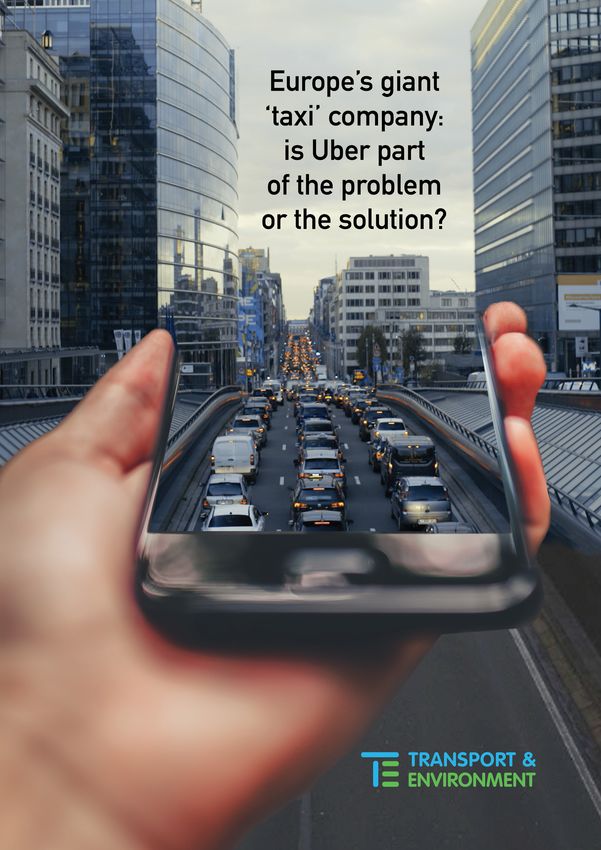
Figure 2: Evolution of the PHV and licences in London before and after the arrival of Uber
Despite the increase in the numbers of cars, the UK department of transport’s data on PHV operators in London x,
including Uber, shows a recent decrease in the number of register private-hire vehicles operators (anyone who
invites or accepts bookings for private hire vehicles, including 'booking agent' businesses which accept bookings
6
a briefing byand then sub-contract them) from 3 200 in 2013 to 2 200 in 2019, hinting to a consolidation of the market. The
case of London is a good proxy to track the growth of Uber. The total PHV vehicle licence volume almost doubled
from 49 854 to 88 113 between 2013 and 2018. At the end of 2018, it was reported that Uber had 45 000 drivers in
the British capital city xi, roughly half the total PHV vehicle licence number, highlighting that the growth in the PHV
market has been mostly the result of Uber operations and is not the result of one substituting the other.
The same evolution can be observed in the greater Paris region, where taxi licences have remained stable at
around 17 000 between 2016 and 2018 xii; in the meantime, the number of PHV licences nearly doubled from
around 10 000 to close to 20 000. But the latter figure is disputed by the French taxi association, which speaks of
around 40 000 PHV drivers in Paris only xiii. This illustrate the opacity regarding the actual number of PHV drivers
working with the Uber app in Paris. In Table 3, we estimate that there are 20 000 Uber drivers in Paris, using the
split oh PHV drivers between Paris and the rest of France, applied to the total reported number of Uber in January
2019. This in no way implies that all PHV drivers in Paris work with the Uber app.
The strong correlation between Uber’s entry in the market and the rise in the PHV licence volume indicates that
the vast majority of newly registered PHV drivers did so in order to work for Uber. In the meantime, taxi licences
have remained more or less stable because their number is regulated, so there is no significant displacement from
traditional taxi services to the new more disruptive TNCs, although in terms of trips, clients and revenue such a
shift may well have occurred. Uber’s rapid expansion (Figure 2) has made Uber one of the largest taxi-like services
in London (3.5 million users reported in 2018 xiv) and France (2.7 million users in 2017 xv).
Similar findings hold true for other cities such as Brussels, where the number of partner drivers working with the
app more than tripled between 2017 and 2019, from 500 to 1800 drivers xvi. Similarly, in the Netherland’s Randstad
region 4, the overall number of PHV licences increased from about 5 800 to 8 000 between 2015 and 2018xvii. In
Madrid, which chose not to regulate the PHV sector as strictly as other Spanish cities like Barcelona 5, 1700 newly
regulated PHV licences were delivered between January and September 2019, a 26% growth. Today’s PHV
market in Madrid is half the size (8 264) of the taxi market (15 630) xviii.
In markets where TNCs struggle to operate due to various requirements limiting their operations (some cities in
Germany, Italy and Spain for instance), Uber’s growth has been more moderate compared to the London or Paris
examples.
Uber’s impact on car trips and urban mobility systems
Since the company’s creation in 2009, Uber has repeatedly stated the company’s objective to directly compete
with car ownership xix, reducing congestion in cities xx. Uber’s vision consists of unbundling transport and vehicle
ownership in order to offer an on-demand service, accessible to users only when needed. This is however in stark
contrast with the reality of their operations in the US xxi, and appears to be the case in the EU as well from the
available data (as detailed herein). Car trips in Greater London and the greater Paris region have not decreased
faster since the arrival of Uber and other TNCs or PHVs. The dominating trend in these two urban areas for the
last 15-20 years has been a steady but slow decrease in car trips.
In London, the number of car trips went from 6.7 million per day in 2000 down to 5.8 million in 2019, due to a mix
of attractive public transport offer and the introduction of the congestion charge xxii. The arrival of Uber in 2012
did not accelerate this trend, as car trips in 2012 had already been reduced to 5.9 million. In 2016, Transport for
London (TfL) reported that about 18 000 Private Hire Vehicles entered the congestion zone every dayxxiii. And
similar TfL data show an increase in PHV and taxi trips between 2012 and 2017 of around 25% 6. TfL suggests that
4
Area encompassing cities between Amsterdam, The Hague, Rotterdam, and Utrecht.
5
The Catalan government an obligation for rides to be delayed 15 minutes after being booked, which led Uber and Cabify
to suspend their operations in August 2019.
6
Travel in London report, 11, table 2.1, p.25: http://content.tfl.gov.uk/travel-in-london-report-11.pdf. TfL kindly provided
higher resolution data on request for the number of taxi and PHV trips, however owing to the data sample sizes these data
can only be indicative only.
7
a briefing bythe increase in total traffic flows in the London central cordon has seen an increase of 5 per cent since 2012. This
could be a result of an increase in private hire vehicles over this time period rather than private cars xxiv.
In the case of Paris, the traffic volume (measured in vehicle*km/h) 7 has been steadily decreasing since 2002 8,
without a significant change in the trend from 2011 xxv, the year Uber was introduced in Paris xxvi (see Table 2). The
average speed in the city has decreased more rapidly since 2011. A reduction in average speed is often used as a
metric for congestion as it increases a given journey time (or delay), for example the TomTom Congestion Index 9,
but it can also be the result of speed limit changes or a reduction in lanes. What is clear is that the average speed
and thus journey time in Paris has certainly not been improving since the arrival of Uber and other PHV services.
Table 2: Traffic statistics in Paris xxvii
7
Speed multiplied by number of cars gives a measure of how many vehicles can pass through an area in a given time.
8
Since 2001, Paris has been engaged in a long-term strategy to reduce emissions, including from traffic, through e.g. traffic
restrictions, increasing bus lanes, cycling infrastructures, etc. See: https://www.paris.fr/pages/les-actions-de-la-ville-pour-
une-meilleure-qualite-de-l-air-7103
9
https://www.tomtom.com/en_gb/traffic-index/about/: “The TomTom Traffic Index figures are based on speed measurements
from TomTom's historical traffic database. These speed measurements are used to calculate travel times on individual road
segments and entire networks.”
8
a briefing by4. Uber adds to traffic and emissions in cities
Unlike in the US no comprehensive studies into the mobility and traffic impacts of Uber have been undertaken in
Europe. However the limited available evidence suggests suggest these findings are confirming that EU cities face
similar challenges to US ones, such as New-York xxviii, San Franciscoxxix, Boston xxx, and Chicago xxxi, where Uber and
Lyft have been shown to exacerbate congestion. Indeed, the market entry of Uber in London has coincided with
an increase in PHV licences, while at the same time taxi licences and car trips remained comparatively stable. In
other words, this correlation suggests that contrary to TNCs’ narrative, ride hailing companies are currently
generating additional car trips to city centres, where public policy has been trying for years to limit their number
and contain their impact. Coupled with the above quantitative assessment of the increase in PHV licences, a
qualitative analysis presented below allows to estimate the impact of surging number of private hire drivers on
CO2 emissions. This necessitates a number of assumptions as explained below.
Taxi and PHV fleet renewal rates are higher than for the average private vehicle fleet, because of higher mileage
and minimum vehicle requirements imposed by national or local regulations. This directly impacts the age of
vehicles used for this type of services, which differs significantly depending on countries and cities but tend to be
newer than the private fleet. For instance in London, taxis should not be older than 15 years xxxii, and their estimated
average age is 7 years 10. In France, the average age of taxis is 3.7 years (2.6 for Paris), while private hire vehicles
are usually 3.4 years old xxxiii.
Most PHVs in London are 4 years old or younger (53%) xxxiv. This compares to 7 years for traditional taxi companies,
and 8.8 years xxxv for the private car fleet. Looking at the most popular vehicles used by PHV drivers, it appears that
almost one third of them are driving hybrid models such as the Toyota Prius (by far the most popular model) xxxvi.
Data collected by TfL in 2018 reveal that almost half of the Priuses are 5 years or older (45%)xxxvii.
In terms of powertrain composition, in Paris, and France more generally, the PHV fleet is mostly comprised of
diesel vehicles. Government data indicate that on 31 December 2017, the French PHV fleet composition was 90%
diesel vehicles xxxviii . This is an issue in particular because of diesel’s high pollutant emissions in real-world
conditions. Real-world data on pollutant emissions collected in London by the TRUE initiative show Euro 5 and
Euro 6 diesel cars’ nitrogen oxide (NOx) emissions are 6 times higher than the standard xxxix.
In several cities across Europe, including London and Paris, Uber has introduced its ‘Uber Green’ service, where
users can choose to ride an EV instead of a conventional vehicle. Unfortunately, the number of EVs available via
these services remains low, meaning longer waiting time for users and thus a less attractive service overall.
Services like Uber Green are certainly a step in the right direction, but the experience also shows that ramping up
EV offer among PHV and taxi companies in coming years is key to zero emission service uptake. Only this will
allow the development of a competitive zero-emission door-to-door mobility offer.
PHV and taxi mileage is up to five times higher than the average private fleet. According to data published by the
sector, an average taxi and PHV driver completes about 48 000 km a year in the UK, or around 120 miles (190 km)
per dayxl. This figure is low compared to other countries like France (58 000 km for PHVs and 69 000 km for taxis xli),
the Netherlands (61 000 km xlii), and Belgium (31 250 km 11).
Based on the above assumptions, Table 3 shows a summary of how much CO2 Uber services in several countries
have added to CO2. We assume that for PHV drivers who share a vehicle, they are both driving the same average
distance in a year. Likewise, the composition and individual mileage of the Uber fleet of vehicles is not known, so
we assume (generously) that the Uber fleet of cars has emissions equivalent to the real world emissions of new
vehicles sold in 2018 in the respective countryxliii. In the case of London where one third of vehicles are reportedly
10
Assuming an even distribution of vehicles by age.
11
TML (2018) E-Taxi’s - Eindrapport. See Figure 2 page 11. Taxis used as a proxy for PHV activity, although taxis can wait at
taxi ranks. 50% of Brussels taxis complete 125 km/day; at 250 working days per year, yearly mileage approximated to be 31
250 km/year. Report available: https://www.bondbeterleefmilieu.be/sites/default/files/files/180522_e-
taxis_eindrapport_finaal_tml_v4.pdf
9
a briefing byPriuses, we have updated the emission factor accordingly xliv. Table 3 shows that the annual mileage of taxi and
PHV services in London and Paris is 4 to 5 times more than the average EU motorist, who covers 12 000 km/year xlv.
Table 3. Estimated CO2 emissions xlvi from Uber in London, Paris, and Brussels, based on respective
country fleet average CO2 emissions
UK wide statistics show that taxi and taxi like service emissions have increased from 2.77 Megatonnes CO2 in 2012
to 3.42 Mt CO2 in 2017, an increase of 23% or 655 kilotonnes CO2. xlvii This evolution is contrary to the UK’s climate
target of -37% CO2 from Effort Sharing Regulation targets xlviii, which covers road transport, or indeed its long term
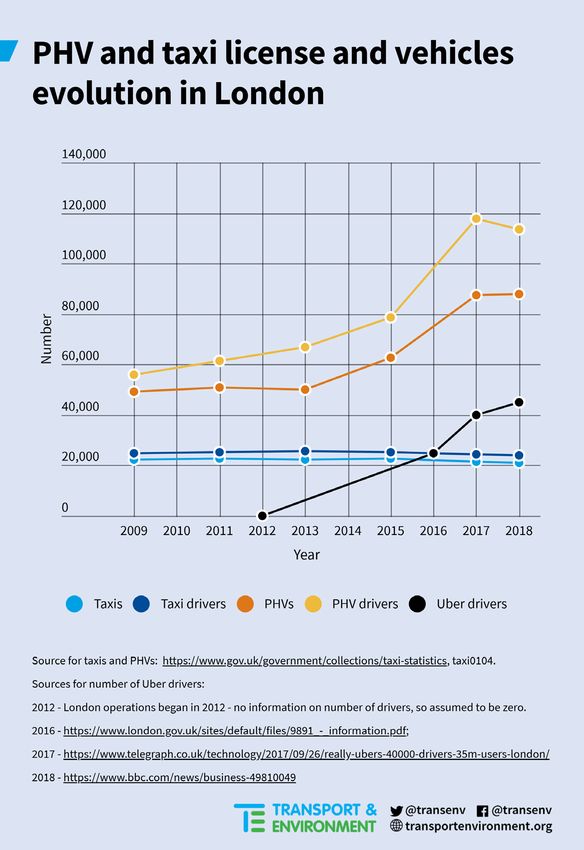
target to reach zero emissions by 2050 xlix. Figure 3 shows the evolution of taxi, PHV, and Uber drivers with the
increase of CO2 emissions from taxi and PHV services in the UK, which shows that the increase in PHV licenses is
strongly correlated with more emissions from the sector, but there is no correlation with taxi licenses which flat-
lined over this period. Over the same period of time, total car emissions in the UK decreased by 581 kt CO2 l; as
taxi and PHV emissions are included in these UK wide figures, the reduction of emissions of cars is only half of
what it could be had the increase of PHV emissions not taken place.
Figure 3: Evolution of taxi drivers, PHV drivers (England), and Uber drivers (London) compared to taxi
and PHV CO2 emissions (UK) li
10
a briefing byIn addition to the CO2 being emitted as a result of their operations, the impact of conventional vehicles in taxi and
PHV fleets is putting a heavy burden on city air quality. The 2019 air quality in Europe report from the European
Environmental Agency shows that the majority of member states in the EU still register NO2 exceedances in cities,
which are caused primarily by motor vehicle emissions. lii
T&E conducted measurements on taxi particulate number emissions in eight different cities and found that on
average, across all samples, 4% of total diesel Euro 5-6 taxis recorded abnormally high concentrations of
particulate emissions. liii This figure is unusually high when considering Euro 5-6 new cars have been fitted with
mandatory diesel particulate filters (DPF) since the 2011 round of Euro 5 standards. This discrepancy between
what should be expected of Euro 5-6 diesels and our sample results is likely due to these vehicles being driven with
tampered or dysfunctional DPFs. According to Frank Kelly, professor of environmental health at King's College
London, the removal of a DPF causes up to 20 times higher PN emissions than with an effectively operating filter. liv
This means just 4% of cars with ineffective DPF increase fleet emissions by 75%. Moreover, data from the True
initiative project shows London cabs’ pollutant emissions are also substantially high: euro 5 London taxi NOx
emissions are on average three times higher than those of other euro 5 diesel cars. lv This puts the health of taxi
and PHV drivers themselves at risk, as studies show they are over-exposed to dangerous levels of air pollution,
especially black carbon. lvi
This paper can only estimate the potential CO2 impact of Uber operations since an accurate assessment of
emissions induced by Uber and other TNCs is only possible if (anonymised) trip data collected by these services
are more transparent and shared publicly. Likewise, knowing the number of drivers using TNC apps in specific
cities, as well as the type of vehicles they drive and their mileage, would give a more granular picture of what their
impacts on European cities are. However, a recent case in the UK shows that there is still a long way to go when it
comes to sharing data: upon request to access his data - which the General Data Protection Regulation allows, a
former Uber driver was only sent a limited data sample by the tech giant. He now has rallied more than 100 other
drivers to jointly ask for access to data generated by their work.lvii
5. Ride hailing and taxi companies must go zero emissions by 2025
in large cities
Taxi services account for between 10% and 20% of urban traffic lviii . In London, taxi and PHV vehicles were
responsible for 12% of traffic during working days lix, despite making up only 4% of registered vehicles lx. The rapid
increase in ride-hailing services such as Uber means that door-to-door services have a disproportionate impact
on traffic, CO2 and air pollution emissions 12. Taxis and PHVs are high mileage vehicles and compared to privately
owned vehicles, tend to be newer, meaning they have a higher renewal rate.
For these reasons, taxi and Uber-like services should rapidly transition their fleets to zero emission vehicles. Electric
vehicle models on the market have the required range and performance to undertake taxi and PHV services. Some
best practices examples in the sector already exist, such as zero emission ride pooling company Clevershuttle lxi,
or ViaVan’s commitment to convert all its locations to full electric fleets by 2025lxii. The observed increase in the
number of private hire vehicles will jeopardize cities’ and the EU's climate objectives if they are not electric.
Currently, the EU 2030 CO2 targets are being revised to be -50% to 55% reduction compared to 1990 emissions,
as set out in president elect Van der Leyen’s programme lxiii.
European cities have great leverage to steer TNC toward electrification, as large urban areas constitute priority
potential markets for door-to-door transport companies. For this reason, we expect that TNCs would be quick to
adapt to new regulations in place as doing so will be a prerequisite to provide their services. The electrification of
TNCs would lead to a race to the top between them and their competitors - the incumbent taxi industry in Europe.
12
Inner and outer London private car registration total 2.66 million while taxis and PHVs number 108 000, or 4%. TfL states
in Travel in London 9 report that they account for 12% of London traffic during the working day.
https://data.london.gov.uk/dataset/licensed-vehicles-type-0 ; http://content.tfl.gov.uk/travel-in-london-report-9.pdf
11
a briefing byThis has been best illustrated with the case of London and the introduction of the ultra-low emission zone, to
which Uber reacted by setting up a clean air fund helping their drivers to switch to zero-emission vehicles. This
commitment is unique to London, where strong policy measures have led to this. A commitment to zero-emission
makes perfect sense for TNCs in the EU, where there are an increasing number of low and zero emission zones lxiv
coupled with some cities and member states announcing their intention to ban ICEs in the 2030s.
On the other hand, cities should enable zero emission pooling. Currently, collecting several passengers connected
by an application is not allowed in many European cities. This means services such as UberPool can’t be accessed,
limiting load factor optimisation. Shared ride hailing has the potential to maximise vehicle utilisation by riders. US
evidence indicates that in some cities 20% of rides are booked using UberPool lxv. Specific uptake data of the
UberPool service in European countries in not available, but would be welcome to assess the propensity of Uber
and other TNC users to share rides.
Many local governments already impose vehicle requirements for PHVs (see Table 1). Such requirements should
be extended to environmental criteria, including a mandatory obligation to provide up to 100% zero-emission
operations in large cities by 2025. On top of this, considering the total cost of operation, it makes economic sense
for TNC drivers to switch to EVs earlier than the rest of the fleet. The ICCT lxvi estimates cost parity between EVs
(assuming most of the charging occurs at home during the night) and hybrids by 2023. Research from fleet
management company Leaseplan shows ZEV TCOs are better for medium car segments (typically C & D where
many affordable EV models are being introduced such as VW ID.3) and particularly as mileage increases due to
the lower energy cost lxvii. As a result, minimum vehicle size criteria for PHV that exist in some countries today
should be lifted. In parallel, strategic partnerships between TNCs and car manufacturers on zero-emission
vehicles would be mutually beneficial. Upfront costs of buying or leasing EVs would go down for drivers, whereas
the carmakers would be able to use large fleets such as taxi or TNC services to sell more ZEVs and reach their
2020/21 CO2 targets more easily.
Requirements to electrify TNCs and taxi companies should be flanked with adequate public charging
infrastructure roll out, with dedicated and privileged access for these services. As a priority, these charging points
should be deployed at strategic locations such as train stations, hotels, and airports. But the backbone of everyday
charging will remain slow home charging, as it offers more affordable rates than fast public charging. To this
extent, the current national efforts to ramp up residential charging points will also help Uber drivers switch to EVs.
Charging at home is the best solution for TNC drivers as they can choose to do this as off-peak hours and have
enough range to complete their shift, which are less than 230 km a day on average 13. In parallel, TNCs can also
partner with charging point operators to speed up charging infrastructure roll out and better match their drivers’
needs, as is already happening between Uber and EVGO in the US lxviii.
Finally, to avoid the risk of monopoly by one app-based mobility provider, regulation needs to adapt to the reality
of diverse and dynamic new mobility services and to ensure access to open data and exchange between public
and private mobility providers. For TNCs, these data should include the number of trips, trip origin and destination,
time and duration of trips, trip distance, the number of vehicles available in the service, the number of drivers
available in the service, and the number of users.
Conclusions and recommendations
Transportation network companies have a great value proposition of slashing private car ownership and arguably
lead to a genuine improvement of the incumbent taxi service in many cities. But as this paper shows, there is a
gap between vision and reality. The real-world data suggests that today Uber-like services bring more emissions
and congestion, and an incentive for people who did not use cars before to do so. While cities like London and
Paris have been pursuing the objective over the past 15 years of reducing car trips, the arrival of Uber and the
increase in the number of taxi-like PHV services have done little to reduce car activity in cities and the uptake of
Uber licenses coupled with the requirements for relatively new high mileage cars suggests that additional car trips
13
Calculation based on average annual mileage of PHV operations in Paris (see Table 3); with estimated number of working
days 250.
12
a briefing byhave been added to the city streets where they operate. We estimate that only in three cities, the emissions of
Uber services could be as high as half a megatonne of CO2, equivalent to the emissions of a quarter of a million
privately owned cars. In the UK, taxi and taxi-like services CO2 emissions have grown 23% since 2012.
The arrival of TNCs in Europe has led to a de facto convergence across markets between similar door-to-door
services that used to be regulated differently such as taxis and PHV. These services’ legal definition should
therefore be revamped to reflect market reality and give local authorities consistent regulatory powers.
Most importantly, TNCs, PHVs, and taxis should all be zero-emission by 2025 - i.e. use electric motors only - at the
latest in large European cities. Vehicle and battery technology and the economics of door-to-door transportation
services make a transition to zero-emission by 2025 realistic and commercially viable.
Ultimately, more transparency on trip data as well as the disclosure by TNCs of the exact number of drivers and
type of vehicle driven is needed. Up-to-date (and where relevant real-time) data on new mobility services should
be made available to public authorities, as a prerequisite for their operations. This is a crucial step towards better
monitoring and management of TNC and new mobility services in general.
Further information
Yoann Le Petit
Clean Vehicles and New Mobility Officer
Transport & Environment
yoann.lepetit@transportenvironment.org
Tel: +32(0)2 851 02 08
Thomas Earl
Modelling and Data Analysis Manager
Transport & Environment
thomas.earl@transportenvironment.org
November 2019
13
a briefing byAppendices
Sources on Table 1
Belgium https://www.brusselslimo.be/vtc-tout-sur-la-reglementation-et-les-types-de-vehicules-utilises/
Brussels https://mobilite-
mobiliteit.brussels/sites/default/files/20070329_arrete_grbc_taxis_limos_maj20190404fr.pdf
Germany https://www.welt.de/wirtschaft/gruenderszene/article186359938/Carsharing-So-hebeln-Mobility-
Start-ups-die-deutschen-Gesetze-aus.html.
In addition to the return to garage rule, trip requests can only be accepted at a place of business - so
it is in theory not possible to jump into a car directly. This rule is often circumvented in practice. See:
https://ngin-mobility.com/artikel/mobilitaet-gesetz/
Spain https://techcrunch.com/2018/08/02/spanish-anti-uber-taxi-strike-ends-after-government-agrees-
new-regulation/
Italy https://it.businessinsider.com/uber-si-arrende-con-la-nuova-legge-sugli-ncc-meno-auto-e-tempi-
dattesa-piu-lunghi-ci-spiace/
Sources and assumptions on Table 3
City Estimated mileage Number of drivers
[km/yr] (year last available data)
London London taxi driver mileage on assumed to be https://www.bbc.com/news/business-
120 miles per day. Assuming a 250 day 49810049
working year, this is 48 000 km year, per driver.
See: https://www.levc.com/tx-electric-taxi/
Paris http://temis.documentation.developpement- In 2019, there were 28 000 Uber drivers in
durable.gouv.fr/docs/Temis/0088/Temis- France. https://www.capital.fr/entreprises-
0088166/23855.pdf marches/uber-les-salaires-de-ses-chauffeurs-
francais-reveles-1325098 Using PHV driver
distribution as a proxy, there were 71.8% in
Paris. From p16 table 3 of:
http://temis.documentation.developpement-
durable.gouv.fr/docs/Temis/0088/Temis-
0088166/23855.pdf
Brussels TML (2018) E-Taxi’s - Eindrapport. See Figure https://www.standaard.be/cnt/dmf20190902
2 page 11. Taxis used as a proxy for PHV _04588146?articlehash=AC943C2E327D2CD9
activity, although taxis can wait at taxi ranks. 8624D02AB51C800267CDFD3969C442EF413
50% of Brussels taxis complete 125 km/day; at BBF1F047551EF220FCCD2A7D82B58963521
250 working days per year, yearly mileage B67CB8992CB80EB81D1B918B86EAD64F19E
approximated to be 31 250 km/year. Report E73A1A4
available:
https://www.bondbeterleefmilieu.be/sites/def
14
a briefing byault/files/files/180522_e-
taxis_eindrapport_finaal_tml_v4.pdf
For emissions data for each country, see Transport & Environment (2019) Mission Possible. Page 14, with real world factor of
39% added to NEDC value. Available: https://www.transportenvironment.org/publications/mission-possible-how-
carmakers-can-reach-their-2021-co2-targets-and-avoid-fines
Endnotes
i
https://www.iru.org/taxi
ii
http://temis.documentation.developpement-durable.gouv.fr/docs/Temis/0088/Temis-0088166/23855.pdf
iii
https://www.transportenvironment.org/publications/cars-engines-can-they-ever-be-clean
iv
https://www.cnbc.com/2019/10/01/uber-closes-at-record-low-worth-less-than-50-billion.html
v
https://www.sec.gov/Archives/edgar/data/1543151/000119312519103850/d647752ds1.htm
vi
See for instance New York, Boston, Chicago, and San Francisco, where Uber and Lyft have been shown to exacerbate
pollution and congestion, respectively: https://www1.nyc.gov/assets/tlc/downloads/pdf/fhv_congestion_study_report.pdf
http://www.mapc.org/wp-content/uploads/2019/07/Growing-Carbon-Footprint-of-Ride-hailing-in-MA.pdf
https://www.chicago.gov/content/dam/city/depts/mayor/Press%20Room/Press%20Releases/2019/October/TNPCongestio
nReport.pdf
https://advances.sciencemag.org/content/advances/5/5/eaau2670.full.pdf
vii
https://torino.repubblica.it/cronaca/2018/11/26/news/uber_taxi_sbarca_in_in_italia_l_app_a_torino_entro_fine_anno_ma_
i_tassisti_annunciano_gia_battaglia-212689643/
viii
https://www.uber.com/de/newsroom/faqhamburg/
ix
https://www1.wdr.de/nachrichten/rheinland/urteil-gegen-uber-in-deutschland-100.html
x
TAXI0102 data set: https://www.gov.uk/government/organisations/department-for-transport/series/taxi-statistics
xi
https://www.bbc.com/news/business-49810049
xii
http://temis.documentation.developpement-durable.gouv.fr/docs/Temis/0088/Temis-0088166/23855.pdf
xiii
https://www.francetvinfo.fr/france/greve-des-taxis/taxi-les-chauffeurs-ont-perdu-30-a-40-de-leur-chiffre-daffaire-avec-
le-developpement-des-vtc-selon-la-chambre-
syndicale_2039899.html&sa=D&ust=1571042178948000&usg=AFQjCNG5O7dV_qbHU6Q-Okfiwmiq_Q0wkg
xiv
https://www.businessofapps.com/data/uber-statistics/
xv
http://www.leparisien.fr/economie/heetch-prend-un-nouveau-virage-03-03-2018-7588134.php
xvi
https://www.tijd.be/ondernemen/transport/uber-ziet-aantal-gebruikers-in-brussel-verdubbelen/9952258.html ;
https://www.standaard.be/cnt/dmf20190902_04588146?articlehash=AC943C2E327D2CD98624D02AB51C800267CDFD39
69C442EF413BBF1F047551EF220FCCD2A7D82B58963521B67CB8992CB80EB81D1B918B86EAD64F19EE73A1A4
xvii
https://www.cbs.nl/nl-nl/nieuws/2017/43/aantal-kleine-taxibedrijven-blijft-groeien ; https://www.ad.nl/binnenland/hoe-
veilig-ben-je-als-vrouw-in-een-nederlandse-ubertaxi~aafafbb2/
xviii
https://www.onlinemarketplaces.com/articles/29068-VTC-drivers-shoot-up-26-in-Madrid-and-fall-5-4-in-Barcelona
xix
https://www.cnbc.com/video/2019/05/10/uber-ceo-says-that-ubers-competition-is-car-ownership.html
xx
https://www.theguardian.com/technology/2015/sep/17/uber-well-ease-the-transition-to-self-driving-cars
xxi
See footnote VI.
xxii
https://consultations.tfl.gov.uk/policy/private-hire-charge-exemption/user_uploads/changes-to-congestion-charge-
scheme-integrated-impact-assessment.pdf
xxiii
https://www.london.gov.uk/sites/default/files/mayors-transport-strategy-2018.pdf
xxiv
Travel in London report, 11, p.139: http://content.tfl.gov.uk/travel-in-london-report-11.pdf
xxv
Le Bilan des Déplacements en 2017 à Paris (2017) L’Observatoire des déplacements à Paris. See p20. Available:
https://www.api-site.paris.fr/paris/public/2018%2F11%2FParis_ra2017_web.pdf
xxvi
https://www.lemonde.fr/economie/article/2014/02/04/a-paris-uber-veut-changer-les-particuliers-en-
taxis_4359694_3234.html
xxvii
Le Bilan des Déplacements en 2017 à Paris (2017) L’Observatoire des déplacements à Paris. See p20. Available:
https://www.api-site.paris.fr/paris/public/2018%2F11%2FParis_ra2017_web.pdf
15
a briefing byxxviii
https://www1.nyc.gov/assets/tlc/downloads/pdf/fhv_congestion_study_report.pdf
xxix
https://advances.sciencemag.org/content/advances/5/5/eaau2670.full.pdf
xxx
http://www.mapc.org/wp-content/uploads/2019/07/Growing-Carbon-Footprint-of-Ride-hailing-in-MA.pdf
xxxi
https://www.chicago.gov/content/dam/city/depts/mayor/Press%20Room/Press%20Releases/2019/October/TNPCongestio
nReport.pdf
xxxii
https://tfl.gov.uk/info-for/taxis-and-private-hire/emissions-standards-for-taxis
xxxiii
http://temis.documentation.developpement-durable.gouv.fr/docs/Temis/0088/Temis-0088166/23855.pdf
xxxiv
http://content.tfl.gov.uk/taxi-and-phv-fleet-with-age.pdf
xxxv
See graph page 53: https://www.acea.be/uploads/publications/ACEA_Pocket_Guide_2019-2020.pdf
xxxvi
http://content.tfl.gov.uk/taxi-and-phv-fleet-with-age.pdf
xxxvii
http://content.tfl.gov.uk/taxi-and-phv-fleet-with-age.pdf
xxxviii
http://temis.documentation.developpement-durable.gouv.fr/docs/Temis/0088/Temis-0088166/23855.pdf
xxxix
https://www.trueinitiative.org/data/publications/remote-sensing-of-motor-vehicle-emissions-in-london
xl
https://www.levc.com/tx-electric-taxi/
xli
http://temis.documentation.developpement-durable.gouv.fr/docs/Temis/0088/Temis-0088166/23855.pdf
xlii
https://www.knv.nl/wp-content/uploads/2019/06/Kerncijfers-taxi-en-zorgvervoer-2016-KNV.pdf
xliii
Transport & Environment (2019) Mission Possible. Page 14, with real world factor of 39% added to NEDC value.
Available: https://www.transportenvironment.org/publications/mission-possible-how-carmakers-can-reach-their-2021-
co2-targets-and-avoid-fines
xliv
According to www.spritmonitor.de, petrol powered non-plug-in Priuses average 5.13 l/100km.
xlv
https://www.odyssee-mure.eu/publications/efficiency-by-sector/transport/distance-travelled-by-car.html
xlvi
See Appendices for sources and assumptions
xlvii
https://www.statista.com/statistics/486067/co2-emission-of-taxi-services-uk/
xlviii
http://data.consilium.europa.eu/doc/document/ST-13224-2017-INIT/en/pdf, page 26
xlix
https://www.gov.uk/government/news/uk-becomes-first-major-economy-to-pass-net-zero-emissions-law
l
UK reporting of GHG inventories to the UNFCCC. https://unfccc.int/process-and-meetings/transparency-and-
reporting/reporting-and-review-under-the-convention/greenhouse-gas-inventories-annex-i-parties/national-inventory-
submissions-2019
li
Taxi and PHV licenses from TAXI0104 data set for England: https://www.gov.uk/government/organisations/department-
for-transport/series/taxi-statistics. Sources for Uber drivers see sources in Figure 2. CO2 emissions for the taxi and PHV
industry in the UK available at: https://www.statista.com/statistics/486067/co2-emission-of-taxi-services-uk/. Note that
license data in Wales was less complete, and Scottish and Northern Irish data not sourced, thus information on full UK
licensing is not available. By population, England represents 84% of the UK, so this data has been assessed to be
representative.
lii
https://www.umweltbundesamt.de/themen/neun-fragen-antworten-diesel
liii
https://www.transportenvironment.org/sites/te/files/publications/2018_09_TE_Dieselgate_report_final.pdf
liv
BBC News, 'Thousands' driving without crucial diesel filters, October 2017
lv
https://www.trueinitiative.org/data/publications/remote-sensing-of-motor-vehicle-emissions-in-london
lvi
https://airqualitynews.com/2019/10/01/taxi-drivers-face-highest-level-of-black-carbon-exposure/
lvii
https://workerinfoexchange.org/
lviii
https://www.iru.org/taxi
lix
http://content.tfl.gov.uk/travel-in-london-report-9.pdf
lx
In 2018, 2.66 million cars registered in inner and outer London. See: https://data.london.gov.uk/dataset/licensed-vehicles-
type-0
lxi
https://www.clevershuttle.de/en/
lxii
https://www.electrive.com/2019/10/26/viavan-launches-fully-electric-fleet-in-milton-keynes/
lxiii
https://ec.europa.eu/transport/sites/transport/files/themes/strategies/doc/2011_white_paper/white-paper-illustrated-
brochure_en.pdf
lxiv
https://www.transportenvironment.org/sites/te/files/publications/2019_09_Briefing_LEZ-ZEZ_final.pdf
lxv
http://www.schallerconsult.com/rideservices/automobility.pdf
lxvi
https://theicct.org/sites/default/files/publications/EV_ridehailing_policy_approaches_20190108.pdf
lxvii
https://www.leaseplan.com/en-ix/global-fleet-insights/tco-ev/
lxviii
https://www.electrive.com/2019/10/01/uber-evgo-partner-to-encourage-switch-to-electric-cars/
16
a briefing byYou can also read